

Abstract
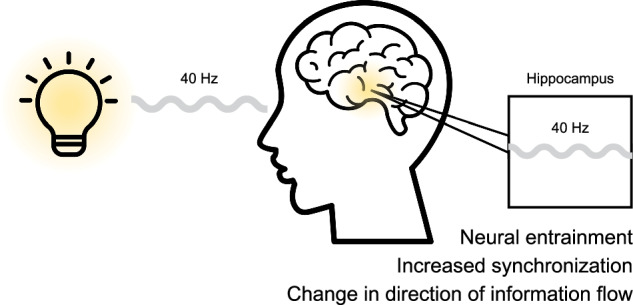
Nonpharmaceutical approaches based on gamma entrainment using sensory stimuli (GENUS) have shown promise in reducing Alzheimer’s disease pathology in mouse models. While human studies remain limited, GENUS has been shown to alleviate aspects of neurodegeneration in patients with Alzheimer’s disease. In this study, we analyze intracranial EEG data from 490 contacts across eleven patients with refractory epilepsy in response to three visual stimulation conditions. We find that 40 Hz visual stimulation successfully entrains neural activity beyond early visual areas, including the hippocampus and other cortical regions such as the temporal and frontal lobes. Additionally, we show that synchronization increases between the hippocampus and other cortical areas in response to the 40 Hz visual stimulation. Furthermore, combining stimulation with a simple visual oddball task alters the direction of information flow from frontal regions to the hippocampus and enhances both the strength and spatial extent of neural entrainment. These findings highlight the potential influence of cognitive engagement during sensory gamma stimulation and provide additional insights into the neurophysiological effects of 40 Hz visual stimulation.
Subject terms: Neurophysiology, Translational research
A study using intracranial EEG suggests that visual gamma stimulation successfully entrains neural activity in the human hippocampus and affects both directional and nondirectional interactions between the hippocampus and other brain regions.
Introduction
Alzheimer’s disease (AD), the leading cause of dementia, is a progressive neurodegenerative disorder characterized by the accumulation of beta-amyloid (Aβ) plaques outside and neurofibrillary tau tangles inside neurons1. In its early stages, patients experience problems with memory, language, and thinking, which worsen over time. These cognitive impairments, combined with behavioral changes, greatly impact patients’ independence and their ability to perform daily tasks. Currently, there is no cure for AD. Some newly FDA-approved medications target the biological mechanisms underlying the disease and have shown promising results in reducing amyloid markers in patients with early AD2,3. However, longer trials are still warranted to determine their effectiveness and safety4.
The hippocampus is among the earliest and most severely affected regions in Alzheimer’s disease, exhibiting pronounced atrophy and accumulation of amyloid and tau pathology5,6. As a key structure for memory encoding and retrieval, its vulnerability to early degeneration makes it a central target for therapeutic interventions. In addition to pharmaceutical advances, a nonpharmaceutical therapy has been proposed for AD based on “Gamma ENtrainment Using Sensory Stimuli” (GENUS)7, with promising outcomes in mouse models. During GENUS, subjects are presented with periodic sensory (visual and/or auditory) stimulation at 40 Hz, leading to periodic neural activations in the gamma band, commonly referred to as ‘entrainment’. Research on mouse models of AD suggests a potential role of GENUS therapy in addressing AD brain pathology and improving cognitive function7–11. Iaccarino et al.7 reported that both short- and long-term 40 Hz visual stimulation, but not using 20 Hz, 80 Hz, or random frequencies, significantly reduce Aβ levels in the visual cortex of an AD mouse model as well as in deeper brain regions, including the hippocampus. This specificity aligns with neurophysiological studies, which show that slow gamma oscillations (~40 Hz) are involved in memory retrieval processes in the hippocampus12. Furthermore, a recent study using intracranial recordings showed that 40 Hz stimulation led to a neural response in significantly more contacts compared to 5.5 Hz or 80 Hz stimulation13. Similarly, one hour of daily auditory 40 Hz stimulation for seven consecutive days resulted in reduced Aβ load and phosphorylated tau levels in both the auditory cortex and hippocampus while also improving spatial and recognition memory9. Furthermore, a combination of visual and auditory stimulation was shown to propagate the effect to the medial prefrontal cortex9. In contrast to the aforementioned studies, Soula et al.14 observed no significant difference in the Aβ load following either one hour of 40 Hz visual stimulation or seven consecutive days of daily one hour stimulation in the visual cortex or hippocampus of AD mouse models. However, the authors used nonstandard analysis methods, which could have introduced additional variability in their results15. In addition to reducing amyloid and tau levels, GENUS has been associated with neuroprotective changes, including enhanced glymphatic clearance11, reduced neuroinflammation8,9, and modulation of glial cell activity9 in AD mouse models.
Although gamma entrainment was mostly effective in reducing the amyloid load in AD mouse models, studies in humans are scarce and inconclusive. In contrast to findings in mouse models, Ismail et al.16 reported that one hour of 40 Hz visual stimulation twice per day for ten consecutive days had no discernible effect on the cortical Aβ load in six Aβ-positive patients with AD. Similarly, He et al.17 found no significant alterations in amyloid or tau levels in the cerebrospinal fluid of ten patients with prodromal AD following four or eight weeks of daily 40 Hz audiovisual stimulation. However, several clinical studies suggest that gamma entrainment may alleviate aspects of neurodegeneration and dementia (for a recent review, see Blanco-Duque et al.15). In a study by Chan et al.18, 15 patients with mild AD underwent daily 40 Hz audiovisual stimulation for three months and showed a reduced rate of ventricular enlargement and no change in hippocampal size compared with the placebo group. Moreover, chronic 40 Hz audiovisual stimulation led to increased functional connectivity in the default mode network (DMN) and improved performance on an associative memory task in patients with mild AD. Similarly, He et al.17 reported increased functional connectivity in the DMN in patients with prodromal AD after eight weeks of daily audiovisual stimulation.
While studies of GENUS in humans remain limited, the reported findings suggest GENUS could offer a promising tool for probing neural mechanisms associated with AD. However, due to the early stage of research, questions regarding the underlying mechanism of GENUS and its clinical efficacy remain to be answered. Recently, Blanpain et al.13 reported that audiovisual stimulation effectively modulated activity in the medial temporal lobe and prefrontal cortex, suggesting broader network engagement. Despite these promising findings, the factors driving entrainment propagation beyond early visual areas remain poorly understood. In animal models, combining visual 40 Hz stimulation with physical exercise has led to the most effective reduction of Aβ and tau levels, potentially improving cognitive function10. However, in humans, the impact of simultaneous engagement during GENUS remains unclear, as many studies have either not recorded EEG responses or have not examined the effects of concurrent tasks13,16,18,19. Building on these findings and our previous EEG study20, where we showed that including a cognitive task during stimulation enhances the strength and extent of the neural response, we aim to provide further evidence that task engagement facilitates stronger and more widespread entrainment. Since steady-state visual responses are typically restricted to early visual areas21, it is important to evaluate the potential benefits of cognitive engagement, as gamma-based interventions primarily target deeper structures such as the hippocampus, one of the earliest and most affected regions in AD.
Our results show that 40 Hz visual stimulation successfully entrains neural activity in the hippocampus as well as other brain regions. Furthermore, we report that 40 Hz visual stimulation, with and without an attention task, affects both directional and nondirectional interactions between the hippocampus and other brain regions.
Results
Hippocampal integrity
Given that hippocampal atrophy or sclerosis is frequently observed in patients with drug-resistant mesial temporal lobe epilepsy22, the structural integrity of the hippocampi of the patients included in this study was assessed. Patients P1, P2, and P11 exhibited medial temporal lobe atrophy (MTA score = 2), with patient P2 additionally showing mesial temporal sclerosis on the implanted side. Patient P4 exhibited gliotic transformation in the uncus of the parahippocampal gyrus on the implanted side.
Signal-to-noise ratio and phase locking to the stimulation
We investigated the effect of visual gamma stimulation and examined neural responses to three stimulation conditions (40 Hz stimulation, Regular; 40 Hz stimulation combined with a task, Task; irregular stimulation, Irregular; Fig. 1, Supplementary Fig. 1) across several brain regions. A total of 430 cortical contacts and 60 contacts targeting the hippocampus were included in the analysis (Fig. 1b). Patient P1 was implanted with a subdural grid with 10 contacts over the right occipital cortex, covering the primary visual areas. These contacts were used as a control to confirm that regular stimulation elicits a response in visual areas. Average frequency spectra were extracted for each electrode contact and condition and signal-to-noise ratio (SNR) at a frequency of 40 Hz was calculated. Compared with the irregular stimulation, the regular 40 Hz stimulation elicited a significant response for all occipital contacts, with median SNR of 5.01 (25th and 75th percentiles: 3.20 and 7.02) for the Regular condition, 6.12 (25th and 75th percentiles: 4.61 and 10.07) for the Task condition, and 1.03 (25th and 75th percentiles: 1.00 and 1.12) for the Irregular condition. Next, the phase locking value (PLV) to the stimulation was calculated, and all 10 of the occipital contacts showed a significant PLV to the stimulation for both Regular (median 0.51, 25th and 75th percentiles: 0.35 and 0.63) and Task (median 0.50, 25th and 75th percentiles: 0.40 and 0.70) conditions compared to the Irregular condition (median 0.14, 25th and 75th percentiles: 0.13 and 0.15). Together, these results confirm that both conditions with regular 40 Hz stimulation successfully engage visual areas.
Fig. 1. Stimulation conditions, electrode placements for all patients, and LFP traces at the beginning of the stimulation.

a LED panel comprising an 8 × 8 LED matrix with central red LED used as a fixation point and to elicit a visual oddball and three stimulation conditions used in the experiment. b A total of 490 contacts was included in the analysis, which were grouped by anatomical region. Parietal and occipital contacts were excluded from the connectivity analyses, as only one patient was implanted at those locations. c Example of LFP traces at the beginning of each stimulation for each of the anatomical regions included, averaged across contacts corresponding to a specific location for one patient. Lines and shaded areas indicate mean ± standard deviation. Vertical gray lines indicate the beginning of the stimulation. Data was filtered between 2 and 45 Hz for visualization purposes. Examples of raw traces are shown in the Supplementary Fig. 1.
We then investigated whether 40 Hz visual stimulation modulates activity in the hippocampal region (Fig. 2, Supplementary Figs. 2, 3). Across 60 contacts targeting the hippocampus of 8 patients, the permutation test showed a significant increase in the SNR relative to the Irregular condition for 66.67% and 88.33% of the contacts for Regular and Task conditions, respectively (Fig. 2a). The median SNRs of all contacts were 1.75 (25th and 75th percentiles: 1.25 and 2.35) and 2.16 (25th and 75th percentiles: 1.64 and 2.86) for Regular and Task conditions, respectively. The median SNR for Irregular condition was 0.98 (25th and 75th percentiles: 0.91 and 1.12). Statistically significant SNR was higher for both regular conditions compared to the Irregular condition (Z = −6.73, p < 0.001 and Z = −6.72, p < 0.001 for Regular and Task conditions, respectively). There was a significant difference in the SNR between Regular and Task conditions (Z = −2.53, p = 0.01).
Fig. 2. Results for hippocampal contacts.

a Signal-to-noise ratio (SNR), b Phase locking value (PLV) to the stimulation, and c aperiodic exponent boxplots for each hippocampal contact at the group and patient level, for each condition. Each dot represents one hippocampal contact. Color convention: yellow – Regular, blue – Task, gray – Irregular, purple – Rest. Box plots: The central line on each box marks the median and the bottom and top edges mark the lower (Q1, 25th percentile) and upper quartile (Q3, 75th percentile), the whiskers mark the range from Q1 – 1.5 * IQR to Q3 + 1.5 * IQR, where the inter-quartile range (IQR) is defined as Q3 – Q1. The horizontal black lines denote the presence of a statistically significant difference between conditions, the stars the significance level (nonparametric Friedman test for within-subject comparisons and Wilcoxon signed-rank test for pairwise comparisons on a group level) with *p < 0.05, **p < 0.01, and ***p < 0.001.
We further evaluated PLV to the stimulation (Fig. 2b, Fig. 3), where a permutation test revealed that 73.33% and 93.33% of all the hippocampal contacts showed significantly different PLV in both Regular and Task conditions compared to the Irregular condition. Figure 3b shows a clear increase in PLV for most of the patients after the onset of the stimulation for Regular and Task conditions, which is not present for the Irregular condition. After the offset of the stimulation, PLVs return to their pre-stimulation level, suggesting a transient effect of entrainment. The median PLVs to the stimulation were 0.21 (25th and 75th percentiles: 0.15 and 0.27) and 0.23 (25th and 75th percentiles: 0.19 and 0.30) for Regular and Task conditions, respectively. The median PLV to the stimulation for the Irregular condition was 0.14 (25th and 75th percentiles: 0.13 and 0.15) and 0.13 (25th and 75th percentiles: 0.12 and 0.15) for the one-minute rest period before the start of the first stimulation condition. PLVs were higher for both regular conditions compared to the Irregular condition (Z = −6.61, p < 0.001 and Z = −2.99, p = 0.003 for Regular and Task conditions, respectively) or to the rest period (Z = −2.19, p = 0.028 and Z = −5.97, p < 0.001 for Regular and Task conditions, respectively). There was a significant difference between Regular and Task conditions (Z = −6.46, p < 0.001).
Fig. 3. Time course of PLV to the stimulation for hippocampal contacts.

a For each patient, average phase locking value (PLV) to the stimulation was estimated during the stimulation period (Stim), as well as during one-minute pre- (Pre) and one-minute post-stimulation (Post) periods for each hippocampal contact across patients. Each dot represents one hippocampal contact. Box plots follow the same convention as in Fig. 2, with the median marked by the central line and the box indicating the inter-quartile range, and statistical significance indicated by black lines with *p < 0.05, **p < 0.01, and ***p < 0.001. b Each row shows the time course of PLV to the stimulation averaged across hippocampal contacts for each patient implanted with depth electrode targeting the hippocampus. Solid lines represent the mean, and shaded areas indicate ± 1 standard deviation. Gray vertical lines mark the onset and offset of stimulation. Stimulation lasted 5 min for all patients but was divided into two 2.5-minute trials for patients P6−P11 to minimize visual strain.
There was a significant correlation between the SNR and the PLV to the stimulation in both regular conditions for hippocampal contacts (Supplementary Fig. 4; ρ = 0.91, p < 0.001 and ρ = 0.88, p < 0.001 for Regular and Task conditions, respectively).
Considering other cortical regions, we observed a significant difference in the SNR between Regular or Task conditions compared to the Irregular condition for 63.72% and 64.60% of the 113 contacts covering the frontal lobe areas, 57.69% and 82.42% of the 182 contacts covering the temporal regions, and 52.24% and 76.12% of the 67 contacts on the basal surface of the temporal lobe. All 22 contacts targeting the insula showed an increased SNR for the Regular condition and 95.45% for the Task condition. The median values for all regions and conditions are presented in Fig. 4a. Results at the individual level are presented in Supplementary Fig. 5 and Supplementary Table 1. Similarly, we observed a significant PLV to the stimulation of contacts in all regions. The highest PLV to the stimulation was observed in the insular region, where all of the contacts showed a significant PLV to the stimulation for both the Regular and Task conditions. In other regions, this was true for 70.33% and 77.47% of the contacts in the temporal lobe, 62.69% and 79.10% of the contacts at the basal surface of the temporal lobe, and 76.11% and 81.42% of the contacts covering the frontal lobe. The PLVs to the stimulation for all regions and conditions are presented in Fig. 4b. Results at the individual level are presented in Supplementary Fig. 6 and Supplementary Table 1.
Fig. 4. Results for other brain regions.

a Signal-to-noise ratio (SNR), b Phase locking value (PLV) to the stimulation, and c aperiodic exponent boxplots across all patients for contacts in insula, temporal lobe, frontal lobe, and basal part of the temporal lobe. Each dot represents one contact. Box plots follow the same convention as in Fig. 2, with the median marked by the central line and the box indicating the inter-quartile range, and statistical significance indicated by black lines with *p < 0.05, **p < 0.01, and ***p < 0.001. Results at the individual level are presented in Supplementary Figs. 2−4.
Aperiodic exponent
In order to evaluate whether visual stimulation modifies the neuronal excitation-inhibition balance, the aperiodic exponent of the power spectrum was estimated over the gamma band (30–120 Hz) for each contact and condition. Due to a bad fit (R2 < 0.80), data from all contacts of one patient (P11) were excluded for the Rest condition.
There was a significant difference in aperiodic exponent between conditions for the hippocampal contacts (Χ2 = 21.90, p < 0.001, Fig. 2c). All three stimulation conditions differed from the baseline rest activity (Z = −3.55, p < 0.001, Z = −4.21, p < 0.001, and Z = −3.41, p = 0.001 for Regular, Task, and Irregular conditions, respectively). The aperiodic exponent was significantly higher for the Task condition compared to the Irregular condition (Z = −2.85, p = 0.004). There was no significant difference between the Regular condition and the Irregular condition (Z = −0.69, p = 0.49) or between Regular and Task conditions (Z = −1.52, p = 0.129). We additionally observed modulation of aperiodic exponents in response to stimulation in other brain regions (Fig. 4c), where all three stimulation conditions resulted in an increased exponent in the temporal lobe and the basal surface of the temporal lobe. Interestingly, for contacts in the frontal lobe, the aperiodic exponent was higher only in the Regular condition. The pattern was the opposite in the insular region, where the exponent was the lowest for the Regular condition. All median values for other brain regions are presented in Fig. 4c. Results at the individual level are presented in Supplementary Fig. 7 and Supplementary Table 1.
Phase synchrony and phase lag between the hippocampus and other regions
To evaluate the synchronization between the hippocampus and other brain regions (Fig. 5, Supplementary Fig. 8−10), the PLV between contact pairs was estimated as a measure of nondirectional connectivity for each condition across different frequency bands.
Fig. 5. PLV and PSI between hippocampus and other regions for different frequency bands.

a Box plots for phase locking value (PLV) and phase slope index (PSI) per frequency band (rows) for all contact pairs between hippocampus and other regions showing significant interactions in all stimulation conditions. Positive PSI value indicates an information flow from the hippocampus to regions of interest and negative PSI value indicates a reversed flow. Box plots follow the same convention as in Fig. 2, with the median marked by the central line and the box indicating the inter-quartile range. The dot corresponds to the mean value. b Mean difference in PLV and PSI between conditions for contact pairs showing significant interactions in all conditions (linear mixed effects model with the false discovery rate correction for multiple comparisons; p < 0.05). Rows in each matrix correspond to the four frequency bands (theta, alpha, beta, and gamma around the stimulation frequency (38–42 Hz)), columns to brain regions. Colors indicate the magnitude of the change. Annotations in the PSI matrices indicate the proportion of contacts for which a switch in the direction of the information flow occurred. c Proportion of contact pairs per region pair showing significant interactions in all three stimulation conditions for PLV and PSI for different frequency bands. Rows in each matrix correspond to the four frequency bands, columns to brain regions.
We observed a higher PLV between the hippocampus and all regions in the Regular compared to the Irregular condition in the gamma band around the stimulation frequency (Fig. 5a, b left panels). Similar results were observed for the Task condition. To establish the direction of the information flow, the phase slope index (PSI) between contact pairs across all three stimulation conditions was estimated (Fig. 5a, b right panels). In the Task condition, we observed a change in information flow between the hippocampus and the frontal region. Specifically, information flow in the gamma band reversed from hippocampus-to-frontal in the Regular condition to frontal-to-hippocampus in the Task condition for 50% of the contacts. The same change in information flow occurred for 52% of the contacts when comparing the Irregular and Task conditions.
Discussion
In this study, we investigated the efficacy of 40 Hz visual stimulation (GENUS) beyond primary sensory areas and highlighted changes in phase synchrony and phase lag in response to the stimulation, using human intracranial recordings. Our findings show successful entrainment in several cortical regions and even in the hippocampus, a brain region commonly impacted by AD. While similar observations have been reported for deep brain electrodes implanted in the hippocampus in one or two patients18,20, our multipatient study considers not only deep brain electrodes but also subdural grids and strips, covering a variety of cortical and subcortical regions, further confirming the recent findings of Blanpain et al.13. Moreover, this study offers additional insight by examining phase synchrony and lag to assess nondirectional and directional interactions between the hippocampus and several cortical regions in response to 40 Hz visual stimulation.
Our findings show that synchronization at the stimulation frequency increases between the hippocampus and its surrounding areas. Furthermore, we observed a change in the direction of information flow across gamma frequency band when regular stimulation was combined with an attention task. The information flow shifted from the frontal areas to the hippocampus, indicating a stronger “top-down” influence of the frontal areas on the hippocampus during an attention task. Similar findings in the beta band have been previously reported during a verbal memory task23. Future studies should investigate whether the changes in phase synchrony and phase lag observed in our study persist beyond the period of stimulation and the possible long-term effects of such stimulation on connectivity. Notably, the observed PSI values were relatively low, which could be due to the averaging of positive and negative phases across contacts. Nonetheless, the values observed are in line with previous studies24 on intracranial data, and currently, there are no established reference ranges for PSI of brain recordings.
With intracranial recordings, we overcome the spatial limitations of noninvasive scalp recordings and show that visual 40 Hz stimulation has the potential to elicit a response not only in the primary visual areas but also across other cortical and deep brain regions. Although patients with epilepsy are not the primary target group for the GENUS application, they offer a unique opportunity to record from deeper brain regions typically affected in AD. In early AD stages, when therapeutic interventions are likely to return the most significant effect25, hippocampal atrophy is commonly observed. Since hippocampal atrophy or sclerosis is also often observed in patients with drug-resistant mesial temporal lobe epilepsy22, the structural integrity of the hippocampi of the patients with epilepsy included in our study was assessed. Importantly, in this study, gamma entrainment was observed in both passive visual stimulation and stimulation combined with an attention task, despite the presence of atrophy in 3 out of 8 patients implanted with depth electrodes targeting the hippocampus. While this suggests that visual gamma stimulation can elicit a neural response even in the presence of atrophy in the hippocampus, our small sample size limits drawing stronger conclusions about the interaction between the hippocampal structural integrity and the effects of stimulation. Future studies on larger samples are needed to systematically examine this relationship. All patients, except for one (P4), showed a significant increase in SNR in response to regular conditions. In the same patient, gliotic transformation in the parahippocampal gyrus was observed, which has been previously linked to altered inhibitory synaptic transmission in hippocampal neurons26. Moreover, our study confirms that there are no issues with visual 40 Hz stimulation, as it did not elicit any epileptiform activity even in patients with epilepsy, which is consistent with observations in previous studies13,18.
In addition to the hippocampus, visual 40 Hz stimulation successfully modulates neural activity across multiple cortical regions. This finding is in line with a recent study of Blanpain et al.13, who showed that sensory stimulation successfully induces a response across widespread brain networks, including areas in the medial temporal lobe and frontal areas associated with cognition. In this study, we further support these results and show that visual stimulation can propagate towards the temporal and frontal lobes, as well as nodes of the DMN, such as the precuneus and angular gyrus. Patients with AD consistently show reduced connectivity between the hippocampus and the DMN regions, a connection relevant for episodic memory formation27. Recently, Chan et al.18 reported that patients with mild cognitive impairment (MCI) due to AD and patients with mild AD receiving combined visual and auditory GENUS stimulation for 3 months daily exhibited a reduced loss in functional connectivity between DMN nodes compared with a control group of patients who did not receive any stimulation. Similarly17, showed that daily 40 Hz visual and auditory stimulation over 8 weeks increased connectivity between DMN nodes in patients with MCI. Although our results are limited to stimulation at 40 Hz and show a narrow spectral response, it would be valuable to investigate whether other frequencies within the low gamma band can induce similar effects and their impact on intrinsic gamma oscillations. A recent EEG study in younger adults showed that visual stimulation at 34−38 Hz elicited stronger and more widespread neural response compared to stimulation at 40−50 Hz28. Similarly, in older adults, visual stimulation at 32 or 34 Hz generated a stronger response than stimulation at 36 Hz, 38 Hz, or 40 Hz29. These results suggest that optimal stimulation frequency may shift with age. However, 40 Hz has previously been associated with resonance phenomena in the human visual system, suggesting that stimulation at this frequency induces stronger steady-state responses compared to adjacent frequencies, despite identical stimulus parameters30. This implies that neural populations exhibit intrinsic frequency preferences, possibly due to recurrent circuitry and conduction delays within oscillatory networks. Rather than indicating a lack of broader modulation, the narrow spectral response may point to a precise and targeted engagement of frequency-specific networks.
In addition to narrowband changes at 40 Hz, we assessed changes in the aperiodic exponent, the 1/f-like slope of the power spectrum, over the gamma range, which was previously suggested to reflect the neuronal excitation-inhibition (E/I) balance31. We observed a significant increase in the aperiodic exponent across hippocampal contacts for all stimulation conditions compared to rest, with the strongest effect for the Task condition. This suggests that visual gamma stimulation may shift the E/I balance towards inhibition, especially when combined with a simple attention task. These changes are particularly relevant in light of recent studies reporting disrupted E/I balance in AD32,33. Interestingly, our resutls suggest a region-specific effect of visual gamma stimulation on the aperiodic exponent, with contacts in the insular region showing the opposite effect compared to other regions, with the lowest exponent in the Regular condition.
Furthermore, we showed that combining stimulation with a simple attention task can increase the number of contacts exhibiting significant entrainment. These results extend previous findings from our group on healthy participants and one patient implanted with intracranial electrodes20. Using scalp EEG recordings, the inclusion of a simple attention task increased the strength of gamma entrainment and promoted its propagation across electrode contacts. Here, we add evidence from multiple participants using invasive recordings and further show that combining visual stimulation with an attention task can facilitate its propagation across the brain. While the current oddball task design effectively ensured participants’ engagement, its simplicity limits the ability to assess a potential relation between entrainment and cognitive load, given the small number of oddballs and the near-ceiling accuracy. Future studies could address this limitation by incorporating a more demanding cognitive task, which may be particularly relevant in patients with cognitive decline.
While we showed evidence of gamma entrainment in response to visual 40 Hz stimulation and highlighted the importance of combining stimulation with an attention task, the clinical effects of this approach remain to be established. Recent studies have suggested that chronic 40 Hz audiovisual stimulation may benefit cognitive functions, sleep quality, and daily activities17–19. However, evidence regarding its effects on neurodegeneration remains limited, with no evidence for amyloid or tau clearance in humans. To our knowledge, previous human studies did not account for the participants’ mental engagement during the therapy, which might enhance the response to stimulation, as demonstrated here. While our findings suggest efficient modulation of hippocampal activity by visual 40 Hz stimulation, its potential modulation by ongoing cognitive processes remains an open question. In our design, each stimulation condition was preceded by a rest period to standardize pre-stimulation activity. However, it is plausible that the strength of entrainment could be diminished when the hippocampus is engaged in other cognitive tasks, particularly those related to memory encoding or retrieval. Investigating this would require a paradigm specifically designed to assess state-dependent modulation. Future studies should explore how concurrent hippocampal engagement impacts the strength and temporal variability of entrainment.
We acknowledge that although our results show successful modulation of neural activity in response to visual 40 Hz stimulation, they do not necessarily imply any clinical or cognitive benefit. Larger double-blind and sham-controlled clinical studies on patients with AD are thus needed to determine the clinical relevance of gamma stimulation therapy and confirm results from AD mouse models.
It is important to acknowledge that our study has its limitations. First, larger sample sizes are needed to confirm our results and to further assess the propagation of stimulation across the brain. Second, our results are obtained from patients with epilepsy, and their response to visual stimulation might not necessarily reflect the response of patients with AD. However, this is currently the only way to measure intracranial neural activity in humans within ethical boundaries. Third, even though the spatial resolution of intracranial recordings is better than that of noninvasive scalp recordings, we were limited by the location and spatial coverage of the contacts as this was decided on a clinical basis. Consequently, we could not evaluate the effect of stimulation on a wider network structure. Furthermore, contacts were grouped across larger brain regions, limiting a full understanding of more detailed network interactions. Finally, a similar stimulation luminosity was used across all participants. Optimizing the intensity of stimulation for each individual may increase response strength and further promote propagation across the brain28,29,34.
In conclusion, our study shows that visual 40 Hz stimulation modulates neural activity across various cortical and deep brain regions and changes phase synchrony and phase lag between the hippocampus and several other brain regions. Furthermore, our findings highlight the importance of mental engagement during visual stimulation, as it might enhance propagation across the brain. Overall, our study provides valuable insights into the neurophysiological effects of visual gamma entrainment, encouraging further research on the use of GENUS in the scope of AD and related neurodegenerative disorders.
Methods
Participants
We recruited 11 patients with refractory epilepsy (6/11 females, mean age 30 ± 13.50 years) that were implanted with subdural grids and/or strips covering various brain regions (Ad-Tech Medical, United States; 4- or 8-mm platinum electrode contacts, with 10 mm contact spacing). Eight of them were also implanted with depth electrodes targeting the hippocampus (Ad-Tech Medical; 1.1 mm diameter, 5 mm contact spacing). The electrode locations are listed in Supplementary Table 2. All patients had normal or corrected-to-normal vision.
Before participating, patients were informed about the purpose of the study and if they agreed to participate, they or their legal representative signed the informed consent form, previously approved by the Medical Ethics Committee of Gent University Hospital (B670202042877). All ethical regulations relevant to human research participants were followed.
Stimulation device
Visual stimulation was delivered via a custom-developed 8 × 8 cm LED panel (Fig. 1a) mounted on a stand that could be adjusted to the participant’s position. The center of the panel featured a red LED that served the visual attention task and otherwise served as a fixation point. The parameters of the LED panel stimulation were controlled by an Arduino Uno microcontroller.
Experimental procedure and data acquisition
The experiment consisted of three different stimulation conditions (Fig. 1a): 40 Hz stimulation (Regular), 40 Hz stimulation combined with a task (Task), and irregular stimulation (Irregular). Each condition started with 1 minute of resting state, followed by 5 minutes of stimulation. In regular conditions with 40 Hz stimulation (Regular, Task), 40 Hz stimulation was presented, consisting of a square-wave pattern with 50% duty cycle. The Irregular condition served as a nonrhythmic control condition in which stimulation consisted of single square-wave periods with a 50% duty cycle at random integer frequencies between 30 and 50 Hz. For all conditions, participants fixated at the center of the LED panel and were asked to refrain from thinking about anything specific. In the Task condition, a visual attention task was added to the stimulation, whereby the central red LED randomly lit up for 250 ms to evoke an oddball. Participants were instructed to mentally count the occurrences of the red oddball, but the reported outcome was not further used in the analysis. While the stimulation lasted 5 minutes for all patients, it was split into two 2.5-minute trials for patients P6–P11 to minimize visual strain. The order of the stimulation conditions was randomized across participants. The stimulation device was positioned 55 cm from the patients in a dimly lit room. Similar LED luminosity (between 225 and 250 lumen) was used for all conditions across all participants.
Data were recorded using an SD LTM 64 Express device (Micromed, Italy) operating at a sampling rate of 256 Hz, with average mastoid contacts used as a reference.
Electrode localization
Cortical reconstruction and volumetric segmentation were first performed on the preimplantation MRI scan of each participant using the FreeSurfer image analysis suite (version 6.0)35. The postimplementation CT scan was then coregistered with the FreeSurfer output using the Brainstorm toolbox36 and the SPM12 extension37. The electrode coordinates were manually extracted from the CT scan artifacts and then mapped onto the cortical surface. All visualizations of the cortex were created with the Brainstorm toolbox36 and custom MATLAB (R2022a) scripts.
Structural integrity of the hippocampus
Preimplantation MRI scans were examined by an experienced neuroradiologist to assess the structural integrity of the hippocampus of the 8 patients who were also implanted with a depth electrode in the hippocampus. Atrophy of the hippocampus was evaluated with an MTA-score38, which is a visual score ranging from 0 to 4, based on the evaluation of several factors, namely, width of the choroid fissure, width of the temporal horn of the lateral ventricle, and height of the hippocampus. The assessments are listed in Supplementary Table 2.
Electrophysiology
Prior to the analysis, the raw data were first inspected for bad electrode contacts, which were then excluded. For each participant, 5-minute stimulation epochs were extracted from the recordings per condition, locked to the onset of visual stimulation. Similarly, 1-minute epoch of resting state prior to the onset of the first stimulation condition was extracted, to serve as a control rest period. To obtain the frequency spectrum per condition, all stimulation and rest epochs were cut into 30-second segments with 50% overlap, and the spectra were averaged across all segments for each electrode contact, resulting in a frequency resolution of 0.033 Hz. To evaluate the extent of gamma entrainment relative to background activity, the SNR of the neural response at 40 Hz was calculated for each condition and contact. The SNR was calculated as the ratio of the Fourier amplitude at 40 Hz and the average amplitude of the surrounding frequencies (ranging from 38 to 42 Hz, excluding 40 Hz). An SNR value of 1 signifies that the 40 Hz amplitude is not distinguishable from that of the surrounding frequencies.
Additionally, power spectra densities (PSDs) were calculated for each contact and condition using Welch’s method39 (2-second windows, 50% overlap) for 5-minute stimulation epochs and 1-minute rest period. Power spectra for each contact and condition were parameterized into periodic and aperiodic components using the FOOOF algorithm40 with the following settings: peak width limits (1, 12), aperiodic mode (fixed), minimum peak height (0.1), and maximum number of peaks (6). Goodness-of-fit was estimated for each fit and the contacts with the R2 < 0.80 were excluded from subsequent analyses.
Similar to Blanpain et al.13, the PLV to the stimulation was estimated for each contact and condition. The 40 Hz visual stimulation was modeled as a sinusoidal wave and the intracranial data were filtered around the simulation frequency (38–42 Hz) using a zero-phase shift, fourth-order Butterworth filter. The Hilbert transform was then applied to extract the instantaneous phase. To estimate the temporal dynamics of PLV, a sliding window approach was used (10-second windows with 2-second steps), starting from the 1-minute rest period before the stimulation onset to the 1-minute rest period after the stimulation offset. For each window, the phase difference between the sinusoid and the filtered data was computed. The mean PLV was then calculated for each contact and condition across three time periods: pre-, during, and post-stimulation.
In addition, the pairwise connectivity between contacts was evaluated with the PLV and the PSI for several frequency bands (theta (4–8 Hz), alpha (8–12 Hz), beta (12–18 Hz), and gamma around the stimulation frequency (38–42 Hz)). For the PLV, the method described above was used for each frequency band and contact pair. To estimate the PSI, which measures the time delay between two signals and indicates how consistently this delay occurs in a specific direction, the formula introduced by Nolte et al.41 was used. A positive PSI value between signals A and B suggests a stronger influence of signal A on signal B, while still considering some level of influence from signal B on signal A24.
Both phase measures were estimated between all contact pairs for each patient and then pooled between the patients and regions of interest. Comparisons with fewer than five significant pairs were excluded. As the number of contacts per region varied between patients, the mean PLV and PSI values at the group level for between-region comparisons were excluded if fewer than two patients contributed contacts to that region. This resulted in 5 regions of interest: hippocampus, insula, temporal lobe, basal surface of the temporal lobe, and frontal lobe.
Statistics and reproducibility
Data from 11 patients with refractory epilepsy was included in the analysis, with a total of n = 490 contacts. Each patient completed one experiment session, in which their neural response to three different visual stimulation conditions as well as resting state preceding each condition was obtained.
A nonparametric random permutation test with 10,000 iterations was used to evaluate significant differences between conditions in SNR values and PLV to the stimulation for each contact. The 95th percentile of the permuted differences was set as the threshold for statistical significance. To correct for multiple comparisons, we applied the false discovery rate (FDR) correction using the Benjamini-Hochberg procedure with a significance threshold of p < 0.05. To estimate overall differences between conditions, the nonparametric Friedman test was used, followed by the Wilcoxon signed-rank test for pairwise comparisons of outcome values between conditions. Correlations between measures were assessed using Spearman’s rank correlation analyses. A p-value below 0.05 was considered statistically significant.
To establish statistical significance thresholds for both the PLV and PSI values, surrogate data were generated by randomizing the phase component of the broadband signal for the Irregular condition and the PLV and PSI were calculated as described above. This was repeated 20 times, and the 50 highest surrogate values from each of the 20 iterations were retained to create a null distribution of 1000 values. The 95th percentile of this null distribution was set as the significance threshold. Values exceeding this threshold were considered significant and retained for further analysis. As the number of significant interactions differed per condition, and to avoid comparing non-meaningful interactions, we only retained values for contact pairs that showed significant interaction in all three stimulation conditions (Fig. 5c). The mean PLVs between regions were then statistically compared across conditions using linear mixed effects models with FDR correction using the Benjamini-Hochberg procedure with a significance threshold of p < 0.05.
Reporting summary
Further information on research design is available in the Nature Portfolio Reporting Summary linked to this article.
Supplementary information
Description of Additional Supplementary Files
Acknowledgements
The authors would like to thank Kato Van Rooy (Ghent University Hospital) for her help with data acquisition. M.M.V.H. discloses support for the research of this work from Horizon Europe’s Marie Sklodowska-Curie Action [grant number 101118964], Horizon 2020 research and innovation programme [grant number 857375], KU Leuven special research fund [grant number C24/18/098], The Belgian Fund for Scientific Research - Flanders [grant numbers G0A4118N, G0A4321N, G0C1522N], The Hercules Foundation [grant number AKUL 043].
Author contributions
Conceptualization: E.K., B.W., M.M.V.H., Data curation: T.M., E.K., B.W., E.C., Formal analysis: T.M., E.K., B.W., Investigation: T.M., E.K., B.W., I.D., E.C., D.V.R., E.A., Methodology: T.M., E.K., B.W., M.M.V.H., Project administration: E.C., I.D., P.B., A.M., Software: B.W., Supervision: A.M., M.M.V.H., Validation: A.M., M.M.V.H., Visualization: T.M., Writing—original draft: T.M., M.M.V.H., Writing—review & editing: T.M., E.K., B.W., I.D., E.C., D.V.R., E.A., P.B., A.M., M.M.V.H. All the authors have approved the final manuscript for submission.
Peer review
Peer review information
Communications Biology thanks the anonymous reviewers for their contribution to the peer review of this work. Primary Handling Editors: Jacqueline Gottlieb and David Favero. A peer review file is available.
Data availability
The data that support the findings of this study are available on request from the co- author EC. The data are not publicly available due to sensitive patient information. Source data for Figs. 2–5 is available in Supplementary Data 1.
Code availability
Data was analyzed using FreeSurfer software suite (version 6.0), Brainstorm toolbox (version 3.240328), SPM12 extension, and MATLAB (R2022a). Custom MATLAB scripts are available as Supplementary Software.
Competing interests
The authors declare no competing interests.
Footnotes
Publisher’s note Springer Nature remains neutral with regard to jurisdictional claims in published maps and institutional affiliations.
Supplementary information
The online version contains supplementary material available at 10.1038/s42003-025-08766-6.
References
- 1.2023 Alzheimer’s disease facts and figures. Alzheimer’s Dementia19, 1598–1695 (2023). [DOI] [PubMed]
- 2.van Dyck Christopher, H. et al. Lecanemab in Early Alzheimer’s Disease. N. Engl. J. Med.388, 9–21 (2023). [DOI] [PubMed] [Google Scholar]
- 3.Honig, L. S. et al. Updated safety results from phase 3 lecanemab study in early Alzheimer’s disease. Alz Res. Ther.16, 105 (2024). [DOI] [PMC free article] [PubMed] [Google Scholar]
- 4.Peng, Y. et al. Current and future therapeutic strategies for Alzheimer’s disease: an overview of drug development bottlenecks. Front. Aging Neurosci.15, 1206572 (2023). [DOI] [PMC free article] [PubMed] [Google Scholar]
- 5.Rao, Y. L. et al. Hippocampus and its involvement in Alzheimer’s disease: a review. 3 Biotech12, 55 (2022). [DOI] [PMC free article] [PubMed] [Google Scholar]
- 6.Josephs, K. A. et al. Rates of hippocampal atrophy and post-mortem TDP-43 in Alzheimer’s disease: a longitudinal retrospective study. Lancet Neurol.16, 917–924 (2017). [DOI] [PMC free article] [PubMed] [Google Scholar]
- 7.Iaccarino, H. F. et al. Gamma frequency entrainment attenuates amyloid load and modifies microglia. Nature540, 230–235 (2016). [DOI] [PMC free article] [PubMed] [Google Scholar]
- 8.Adaikkan, C. et al. Gamma entrainment binds higher-order brain regions and offers neuroprotection. Neuron102, 929–943.e8 (2019). [DOI] [PMC free article] [PubMed] [Google Scholar]
- 9.Martorell, A. J. et al. Multi-sensory gamma stimulation ameliorates alzheimer’s-associated pathology and improves cognition. Cell177, 256–271.e22 (2019). [DOI] [PMC free article] [PubMed] [Google Scholar]
- 10.Park, S.-S. et al. Physical exercise during exposure to 40-Hz light flicker improves cognitive functions in the 3xTg mouse model of Alzheimer’s disease. Alzheimers Res. Ther.12, 62 (2020). [DOI] [PMC free article] [PubMed] [Google Scholar]
- 11.Murdock, M. H. et al. Multisensory gamma stimulation promotes glymphatic clearance of amyloid. Nature1, 8 (2024). [DOI] [PMC free article] [PubMed] [Google Scholar]
- 12.Bieri, K. W., Bobbitt, K. N. & Colgin, L. L. Slow and fast gamma rhythms coordinate different spatial coding modes in hippocampal place cells. Neuron82, 670–681 (2014). [DOI] [PMC free article] [PubMed] [Google Scholar]
- 13.Blanpain, L. T. et al. Multisensory flicker modulates widespread brain networks and reduces interictal epileptiform discharges. Nat. Commun.15, 3156 (2024). [DOI] [PMC free article] [PubMed] [Google Scholar]
- 14.Soula, M. et al. Forty-hertz light stimulation does not entrain native gamma oscillations in Alzheimer’s disease model mice. Nat. Neurosci.26, 570–578 (2023). [DOI] [PMC free article] [PubMed] [Google Scholar]
- 15.Blanco-Duque, C., Chan, D., Kahn, M. C., Murdock, M. H. & Tsai, L.-H. Audiovisual gamma stimulation for the treatment of neurodegeneration. J. Intern. Med.295, 146–170 (2024). [DOI] [PMC free article] [PubMed] [Google Scholar]
- 16.Ismail, R. et al. The Effect of 40-Hz Light Therapy on Amyloid Load in Patients with Prodromal and Clinical Alzheimer’s Disease. Int. J. Alzheimer’s Dis.2018, 1–5 (2018). [DOI] [PMC free article] [PubMed] [Google Scholar]
- 17.He, Q. et al. A feasibility trial of gamma sensory flicker for patients with prodromal Alzheimer’s disease. Alzheimer’s Dement. Transl. Res. Clin. Interventions7, e12178 (2021). [DOI] [PMC free article] [PubMed] [Google Scholar]
- 18.Chan, D. et al. Gamma frequency sensory stimulation in mild probable Alzheimer’s dementia patients: Results of feasibility and pilot studies. PLoS ONE17, e0278412 (2022). [DOI] [PMC free article] [PubMed] [Google Scholar]
- 19.Cimenser, A. et al. Sensory-evoked 40-Hz gamma oscillation improves sleep and daily living activities in Alzheimer’s disease patients. Front. Syst. Neurosci.15, 746859 (2021). [DOI] [PMC free article] [PubMed] [Google Scholar]
- 20.Khachatryan, E. et al. Cognitive tasks propagate the neural entrainment in response to a visual 40 Hz stimulation in humans. Front. Aging Neurosci.14, 1010765 (2022). [DOI] [PMC free article] [PubMed] [Google Scholar]
- 21.Wittevrongel, B. et al. Representation of steady-state visual evoked potentials elicited by luminance flicker in human occipital cortex: an electrocorticography study. NeuroImage175, 315–326 (2018). [DOI] [PubMed] [Google Scholar]
- 22.Moran, N. F., Lemieux, L., Kitchen, N. D., Fish, D. R. & Shorvon, S. D. Extrahippocampal temporal lobe atrophy in temporal lobe epilepsy and mesial temporal sclerosis. Brain124, 167–175 (2001). [DOI] [PubMed] [Google Scholar]
- 23.Das, A. & Menon, V. Asymmetric frequency-specific feedforward and feedback information flow between hippocampus and prefrontal cortex during verbal memory encoding and recall. J. Neurosci.41, 8427–8440 (2021). [DOI] [PMC free article] [PubMed] [Google Scholar]
- 24.Casimo, K. et al. Regional patterns of cortical phase synchrony in the resting state. Brain Connectivity6, 470 (2016). [DOI] [PMC free article] [PubMed] [Google Scholar]
- 25.Breijyeh, Z. & Karaman, R. Comprehensive review on alzheimer’s disease: causes and treatment. Molecules25, 5789 (2020). [DOI] [PMC free article] [PubMed] [Google Scholar]
- 26.Ortinski, P. I. et al. Selective induction of astrocytic gliosis generates deficits in neuronal inhibition. Nat. Neurosci.13, 584–591 (2010). [DOI] [PMC free article] [PubMed] [Google Scholar]
- 27.Ranganath, C., Heller, A., Cohen, M. X., Brozinsky, C. J. & Rissman, J. Functional connectivity with the hippocampus during successful memory formation. Hippocampus15, 997–1005 (2005). [DOI] [PubMed] [Google Scholar]
- 28.Lee, K. et al. Optimal flickering light stimulation for entraining gamma waves in the human brain. Sci. Rep.11, 16206 (2021). [DOI] [PMC free article] [PubMed] [Google Scholar]
- 29.Park, Y. et al. Optimal flickering light stimulation for entraining gamma rhythms in older adults. Sci. Rep.12, 15550 (2022). [DOI] [PMC free article] [PubMed] [Google Scholar]
- 30.Herrmann, C. S. Human EEG responses to 1–100 Hz flicker: resonance phenomena in visual cortex and their potential correlation to cognitive phenomena. Exp. Brain Res137, 346–353 (2001). [DOI] [PubMed] [Google Scholar]
- 31.Gao, R., Peterson, E. J. & Voytek, B. Inferring synaptic excitation/inhibition balance from field potentials. Neuroimage158, 70–78 (2017). [DOI] [PubMed] [Google Scholar]
- 32.van Nifterick, A. M. et al. Resting-state oscillations reveal disturbed excitation–inhibition ratio in Alzheimer’s disease patients. Sci. Rep.13, 7419 (2023). [DOI] [PMC free article] [PubMed] [Google Scholar]
- 33.Martínez-Cañada, P. et al. Combining aperiodic 1/f slopes and brain simulation: An EEG/MEG proxy marker of excitation/inhibition imbalance in Alzheimer’s disease. Alzheimers Dement (Amst.)15, e12477 (2023). [DOI] [PMC free article] [PubMed] [Google Scholar]
- 34.Jones, M. et al. Gamma band light stimulation in human case studies: groundwork for potential Alzheimer’s disease treatment. JAD70, 171–185 (2019). [DOI] [PMC free article] [PubMed] [Google Scholar]
- 35.Fischl, B. FreeSurfer. Neuroimage62, 774–781 (2012). [DOI] [PMC free article] [PubMed] [Google Scholar]
- 36.Tadel, F., Baillet, S., Mosher, J. C., Pantazis, D. & Leahy, R. M. Brainstorm: a user-friendly application for MEG/EEG analysis. Comput Intell. Neurosci.2011, 879716 (2011). [DOI] [PMC free article] [PubMed] [Google Scholar]
- 37.Penny, W. D., Friston, K. J., Ashburner, J. T., Kiebel, S. J. & Nichols, T. E. Statistical Parametric Mapping: The Analysis of Functional Brain Images (Elsevier, 2011).
- 38.Scheltens, P. et al. Atrophy of medial temporal lobes on MRI in ‘probable’ Alzheimer’s disease and normal ageing: diagnostic value and neuropsychological correlates. J. Neurol. Neurosurg. Psychiatry55, 967–972 (1992). [DOI] [PMC free article] [PubMed] [Google Scholar]
- 39.Welch, P. The use of fast Fourier transform for the estimation of power spectra: a method based on time averaging over short, modified periodograms. IEEE Trans. Audio Electroacoustics15, 70–73 (1967). [Google Scholar]
- 40.Donoghue, T. et al. Parameterizing neural power spectra into periodic and aperiodic components. Nat. Neurosci.23, 1655–1665 (2020). [DOI] [PMC free article] [PubMed] [Google Scholar]
- 41.Nolte, G. et al. Robustly estimating the flow direction of information in complex physical systems. Phys. Rev. Lett.100, 234101 (2008). [DOI] [PubMed] [Google Scholar]
Associated Data
This section collects any data citations, data availability statements, or supplementary materials included in this article.
Supplementary Materials
Description of Additional Supplementary Files
Data Availability Statement
The data that support the findings of this study are available on request from the co- author EC. The data are not publicly available due to sensitive patient information. Source data for Figs. 2–5 is available in Supplementary Data 1.
Data was analyzed using FreeSurfer software suite (version 6.0), Brainstorm toolbox (version 3.240328), SPM12 extension, and MATLAB (R2022a). Custom MATLAB scripts are available as Supplementary Software.