

Abstract
Analog and Mixed Signal Integrated Circuits (AMS ICs), which have many different components on a single chip, can now be integrated due to technological advancements. However, controllability and observability both decline with increasing circuit complexity, making testing more difficult and expensive. The real time signals are analog in nature and hence ADCs are used to convert them to digital signals for further processing in all the mixed signal circuits. In order to enhance the reliability, a great deal of effort has been devoted in the recent years to test the ADCs. ADC testing is becoming a point of intensive research today. ADCs are deigned and full custom BIST scheme for the fault detection of the ADCs is proposed. This scheme involves a pattern counter, adaptive ramp generator and two stage operational amplifier comparator. This proposed method provides the test outputs in time domain and provides easy ways of determining the presence of errors. The effectiveness of the proposed BIST is tested with four different ADC architectures namely Servo Tracking ADC, Flash ADC,Threshold Invert Quantization (TIQ) Flash ADC and three stage comparator based Servo Tracking ADC. The proposed BIST scheme provides average fault coverage of 95.8% among the four type of ADC tested.
Keywords: ADC testing, Built in self test, Fault modelling, Fault coverage
Subject terms: Engineering, Mathematics and computing, Physics
Introduction
More and more functions are being consolidated onto a single chip as deep sub-micron technologies continue to progress and electronic systems become more complex. The integrated circuits that combine analog and digital components has increased as a result1. High-performance analog and mixed-signal (AMS) integrated circuits are in high demand across a number of industries, such as wireless technologies, data transfer systems, and satellite communications2. As a result, test tools are moving closer to integrated platforms that can assess digital and analog components on the same chip. Despite these advancements, testing mixed-signal circuits is still a difficult task that calls for thorough evaluation of the system as a whole to make sure it satisfies strict performance, reliability, and functionality requirements in addition to meticulous verification of individual functional units. AMS circuits are often non-linear, noisy and have parameters that vary widely. The relationship between input and output signals in AMS circuits is difficult to model3. This prevents the development of effective, accurate, and highly generalizable fault simulation and test generation algorithms. Moreover, complex analog circuits are typically mixed-signal circuits as they typically contain logic and signal-switching components for control and configuration.
Previous works
Several Built-In Self-Test (BIST) approaches have been proposed in the past few years to address the growing complexity of testing analog and mixed-signal circuits. One of the earliest methods, specifically designed for speech CODEC testing, was proposed by Teraoka in 1993. This approach relied on the presence of Analog-to-Digital Converters (ADC) and Digital-to-Analog Converters (DAC) on the chip. In Linear Time-Invariant (LTI) systems, the cross-correlation of input and output signals under ideal conditions can be used to determine the system’s impulse response, thereby characterizing the circuit under test and enabling fault detection4.
BIST techniques traditionally consist of direct functional testing, where analog output responses are compared with performance requirements. These methods typically require on-chip analog stimulus generators capable of producing a variety of test waveforms. Analog signature analysis requires significant amounts of data. For instance, spectral BIST demands the generation of calibrated sine waves at several frequencies5. Some BIST methods use on-chip signal generators1,2. To address challenges associated with analog stimulus generation and response analysis, a digital BIST strategy was developed by Ohletz6. Additionally, Sunter and Roy (1999) proposed a fully digital testing method for Phase-Locked Loops (PLLs), highlighting the advantages of synthesizable digital circuits for automated design and layout.
Recent advances include BIST methods that employ pseudo-random pulse patterns for testing LTI analog building blocks and data converters7. Chioktour et al.8 proposed an adaptive BIST scheme that selectively uses subsets of test vectors based on input frequency patterns. Nti Darko et al.9 introduced an Arbitrary Waveform Generator (AWG) featuring a low-cost, fully digital on-chip calibration DAC to minimize DAC non-linearity. Saikiran et al.10implemented a Logic BIST (LBIST) controller for a ripple carry adder using Verilog on Xilinx ISE and Cadence-based ASIC flow11. proposed a dynamic logic gate-based BIST architecture designed for higher computational efficiency and enhanced fault detection.
12proposed a dual-mode BIST strategy with both online and offline testing capabilities, where a selector module chooses test vectors from a predefined list to apply to a reduction module13. discussed a BIST architecture for ADCs using a 12-bit SAR ADC and a 14-bit R-2R DAC14. tackled in-field specification extraction of low-pass filters in PSoC1 chips without requiring additional hardware overhead15. proposed a chip aging monitoring system capable of identifying aging phases and initiating proactive corrective actions to prevent performance degradation.
Other innovations include a time-tick-triggered BIST scheme for evaluating ADC static errors16, a BIST approach for detecting catastrophic faults in dynamic comparators17, and a switch-controlled, state-skipping-based test pattern generator with reduced memory requirements18,19presented a low-overhead, embedded BIST solution integrated within millimeter-wave front-end circuits20. developed a machine learning-based technique to generate indirect test patterns for analog and mixed-signal circuits21. proposed a user-friendly and efficient defect simulation model for pre-silicon verification of AMS designs. Furthermore22, explored various machine learning algorithms applicable to circuit testing.
The challenges of testing analog and mixed-signal circuits have been well-documented23–25. Multiple factors contribute to the complexity of these tests. Analog circuits experience continuous variations in voltage and timing, making fault detection significantly more difficult than in digital circuits. Moreover, the inherent non-linearity of analog systems causes their performance to be highly sensitive to component parameters. Even minimal process variations within acceptable limits can substantially degrade circuit performance.The effectiveness of mixed-signal testing depends heavily on the dependability of the test equipment and the validity of the input stimuli. Unlike digital circuits, which have linear Boolean input–output characteristics, analog circuits have complex, non-Boolean behaviour that is more difficult to model, analyze, and predict correctly.
Creating fault models for mixed-signal circuits is a complicated and challenging task29. Consequently, model-based test methods may tend to be unreliable and hard to apply confidently. Digital Design-for-Test (DFT) methods, which tend to rely on structural circuit partitioning, are not well-suited to analog circuits because they have major effects on circuit performance30,31.
Functional testing of analog circuits is likely to be costly and time-consuming because it is rare that more than one specification is tested by the same method. The tests are likely to involve extensive programming and extra hardware design work.
Limited functional testing often fails to ensure the lack of defects. Digital circuits have large design safety margins; the analog circuits have much smaller margins and hence are more susceptible to process variations that result in a severe degradation of performance.
Overall, testing mixed-signal circuits is challenging because analog and digital elements share the same substrate and are, therefore, susceptible to both external and internal disturbances. For example, noise due to digital circuitry will negatively impact the behavior of analog components. Current BIST techniques created for ADC testing frequently have a number of drawbacks, including:
The requirement for on-chip delta-sigma DACs to produce sine waves, which raises the area usage.
To generate linear ramp signals, components such as low-pass filters, 1-bit DACs, pattern memory, and software-based delta-sigma modulators are needed; some of these components are off-chip, which increases area overhead.
Reliance on reference voltages and analog circuitry for measurement.
External output bit monitoring is required, which results in off-chip testing methods.
Problems with loading on analog nodes brought on by the BIST circuitry’s analog components.
Restricted coverage of faults.
Motivation of research
A BIST approach is proposed with less area overhead, low power consumption and high fault coverage for the defect oriented testing of ADCs. In order to validate the effectiveness of proposed BIST architecture, four ADCs are tested. A Flash ADC, Servo tracking ADC,a Threshold Inverter Quantization (TIQ) Flash ADC and three stage comparator based Servo Tracking ADC are tested using the BIST architecture.
Organization of paper
Section"Introduction"describes introduction, previous work and motivation of research. Design of different ADC under test is discussed in Section"Design of anaog to digital converters under test". Proposed BIST is described in Section"Proposed BIST architecture for ADC testing"and its different components of BIST are explained. Fault models and fault coverage analysis is discussed in Section"Results and discussions"results and discussions. Section"Conclusions"gives the conclusion.
Design of analog to digital converters under test
The proposed BIST is validated by testing various ADCs such as Servo tracking ADC, Flash ADC and TIQ Flash ADC.
Servo tracking ADC
Servo Tracking ADC is a direct-conversion type ADC and is an improved one compared to the regular counting ADC. The operation of Servo Tracking ADC relies on the comparison between the input analog signal and an in-house synthesized reference signal. A 7-bit servo-tracking ADC was designed and fabricated. Figure 1 shows a schematic of the servo-tracking ADC.
Fig. 1.

Schematic Diagram of the 7- bit Servo Tracking ADC.
The circuit has an up/down counter whose count direction is regulated by a comparator. The comparator is used to compare the analog output of a Digital-to-Analog Converter (DAC) to the analog input signal. The counter alters based on this comparison as follows: when the analog input signal exceeds the output of the DAC, the counter goes up by one Least Significant Bit (LSB); if the DAC output is greater, the counter goes down by one LSB. This movement keeps the DAC output always varying in the right direction to track the input. This tracking mechanism causes the digital output to oscillate near the true value by ± 1 least significant bit (LSB). Hence, when the analog input changes slowly, the counter is able to track it well, keeping the digital output near its actual value. But the counter tracking Analog-to-Digital Converter (ADC) has a slow response to sudden changes in inputs, due to the inherent drawbacks of this approach. A synchronous up/down counter, implemented using JK flip-flops, was utilized here. These JK flip-flops are implemented from direct pulse-triggered D flip-flops, as discussed in the previous section.The DAC converts the digital bit stream of the counter to an analog voltage. A charge-scaling DAC is employed for this, whose design and output characteristics are shown in Fig. 2 and Fig. 3. Ideally, the DAC produces a stepwise rising ramp signal. This output was compared with that of a linear ramp signal from an external ramp generator. The DAC is designed to work as close to ideals as possible with minimum error.
Fig. 2.

Schematic diagram of the Charge Scaling DAC.
Fig. 3.

Simulated results of the Charge Scaling DAC.
The output of the 7-bit Servo tracking ADC is shown in Fig. 4. The digital output waveform V(Q1) corresponds to the LSB and V(Q7) corresponds to the Most Significant Bit (MSB).
Fig. 4.

Simulated results of the 7 bit Servo Tracking ADC.
One of the main advantages of the servo-tracking ADC is its simplicity. It contains a very high update rate compared to traditional counting ADC implementations. When the counter must initially match the analog input at the beginning of the output plot, the rate of change of the output is identical to that of the original counting ADC. Moreover, because this design does not incorporate a shift register, the binary output ramps smoothly rather than moving suddenly from zero to the end value, unlike successive approximation or counter-based ADCs.
Flash ADC
Flash ADCs are considered the fastest ADC architecture, particularly for implementing low-resolution conversions. Flash ADCs schematic which employs a resistive ladder to divide the reference voltage shown in Fig. 5. Discrete levels. The reference voltages are compared simultaneously to the analog input signal by parallel comparators. The outputs of the comparators form a thermometer code, which is then converted into a binary code by a logic encoder, providing a digital approximation of the input signal during every clock cycle.
Fig. 5.

Schematic of the Flash ADC.
For improved accuracy, comparators are typically preceded by preamplifier stages. This reduces the input-referred offset and noise, which are essential for the proper operation of flash ADC operation. However, because the comparator offset voltages are random, they adversely affect the differential and integral nonlinearity (DNL and INL). Therefore, flash ADCs typically operate with resolutions of less than 8 bits.
The output of the Flash Converter is shown in Fig. 6. The digital output waveform v(Q1) corresponds to the LSB and the v(Q7) corresponds to the MSB of Flash ADC output.
Fig. 6.

Simulated Results of the Flash ADC.
TIQ flash ADC
The proposed ADC features the threshold inverter quantization (TIQ) technique. The high speed and low power are the features of this ADC. Figure 7 shows the block diagram of the TIQ Flash ADC. Two cascading inverters are used as a voltage comparator. The voltage comparators compare the input voltage with internal reference voltages, which are determined by the transistor sizes of the inverters. Hence the resistor ladder circuit used in a conventional flash ADC is not required in the design of TIQ Flash ADC.
Fig. 7.

Block Diagram of the TIQ Flash ADC.
Some of the main problems of the conventional comparator structures used in ADC designs are: (i) large transistor area for higher accuracy (ii) DC bias requirement (iii) charge injection errors (iv) metastability errors (v) high power consumption (vi) resistor or capacitor array requirement.
These problems are avoided by using “Threshold Inverter Quantizer”. The TIQ technique has many advantages such as simpler voltage comparator circuit, faster voltage comparison speed, elimination of resistor ladder circuit, does not require switches, clock signal, or coupling capacitors for the voltage comparison and highly adaptable to CMOS technology.
The TIQ comparator consists of two cascaded CMOS inverters shown in Fig. 8a. The analog input signal quantization level is set in the first stage by changing the Voltage Transfer Curve (VTC) by means of transistor sizing is ahown in Fig. 8b..The second inverter stage is used for increased gain and logic level inversion so that the circuit behaves as an internally set comparator circuit. Two cascaded inverters and their VTC, is shown in Figs. 8(a) and 8(b) respectively. The key point with the second stage is that it must be exactly same as the first stage to maintain the same DC threshold levels and to keep the linearity in balance for the voltage rising and falling intervals of high frequency input signals. The Vth point on the VTC of a CMOS inverter can approximately given by the following Eq. (1) – (3)
 |
1 |
where Vtn and Vtp are the threshold voltages for NMOS and PMOS devices, respectively; and
| 2 |
| 3 |
Fig. 8.

(a) Schematic of TIQ Comparator (b) VTC Curves of the TIQ Comparator.
Kn = Transconductance parameter of nMOS.
Kp = Transconductance parameter of pMOS.
µn= Mobility of electrons.
µp= Mobility of holes.
cox = capacitance due to Gate oxide.
L = Length of transistor (source to drain).
W = Width of transistor.
The gain boosters make sharper thresholds for comparator outputs and provide full a digital output voltage swing. The propagation delay is almost exponentially proportional to the transistor length, but the voltage gain follows a logarithmic function. Therefore the propagation delay and voltage gain should be considered together in the transistor sizing of the gain booster. TIQ flash ADC can be used in high speed communication application such as GSPS[31].
The code output of the comparator and are converted to a binary code in two steps through the `01’generator and the fat tree encoder as shown in Fig. 9.
Fig. 9.

Block diagram of TC-to-BC Encoder.
The output of the TIQ Flash ADC is shown in Fig. 10. The output waveform d7 corresponds to the MSB and the waveform d0 corresponds to the LSB.
Fig. 10.

Output of TIQ Flash ADC.
The Comparison of complexity and speed of various ADC is shown in Table 1. Flash ADC is best in speed but worst in area and power efficiency. Servo Tracking is area/power-efficient but slow. TIQ Flash has a tradeoff with intermediate complexity and high speed. 3-Stage SAR has a good balance and therefore is most suitable for energy-constrained applications with medium performance needs.
Table 1.
Comparison of complexity and speed of various ADC.
| ADC Type | Complexity | Speed | Main Parameter Optimized |
|---|---|---|---|
| Servo Tracking ADC | Low | Low | Power and area |
| Flash ADC | Very High (2ⁿ—1 comparators) | Very High | Speed |
| TIQ Flash ADC | Medium to High | High | Area and power |
| 3-Stage Comparator-based SAR ADC | Medium | Medium | Power and resolution |
Proposed bist architecture for Adc testing
The four types of ADC used as Device under teat(DUT) are implemented and tested using proposed BIST. An adaptive ramp generator with low voltage, high impedance current mirror at output is proposed to test the DUT. Proposed block diagram is shown in.
Figure 11 for the testing of ADCs. It consists of the ADC circuit under test, an adaptive ramp generator, pattern counter, analog multiplexer and response analyzer.
Fig. 11.

Block diagram of the proposed BIST architecture.
The proposed BIST circuit is tested with four different ADC architectures. The BIST has two modes of operation: normal mode and test mode. The mode of operation can be selected with the Select Input of the Input and Output multiplexers. A logic ‘0’ in the select signal selects the test mode and the logic ‘1’ selects the normal mode of operation. A logic ‘0’ selects the BIST output and the logic ‘1’ selects the ADC output. In the test mode of operation, the adaptive ramp generator feeds the ADC under test, through the input multiplexer. The pattern counter feeds the response analyzer. The step input of the adaptive ramp generator and the clock input of the pattern counter are synchronized in such a way that the ADC output and pattern counter output arrive simultaneously at the response analyzer. The pattern counter clock signal also drives the response analyzer to obtain synchronism. The response analyzer compares the ADC output and the pattern counter output. The response analyzer produces an all-zero output for the fault-free case and it produces non-zero output for the faulty case.
Proposed adaptive ramp generator
The linear ramp voltage is generated by charging a capacitor using voltage controlled current source or a current mirror. The voltage across a capacitor is the ramp signal and it is directly proportional with time. The output voltage of the ramp generator is given by
 |
4 |
In Eq. (1), Capacitor charge is indicated by C, Ic is the charging current of capacitor and tr is the time period of charging. The basic ramp generator schematic is shown in Fig. 12. The signal Init initializes the ramp generation. The step signal controls the time period of the ramp signal. Since the performance of the ramp generator depends on the constant current mirror, a low voltage, high output impedance current mirror is proposed in this thesis for the On-Chip ramp signal generation. The ramp generator depends on the accuracy of the current source or current mirror used. Hence in this thesis, a low voltage, high output impedance current mirror is proposed for the ramp generation.
Fig. 12.

Principle of voltage ramp generation.
The high impedance current mirror with low voltage is shown in.
Figure 13, is derived from Wilson current mirror with high swing. In this current mirror there is a significant increase in loop gain and thus the output resistance is obtained by replacing the diode connected transistor M1 with a cascode one. Hence in this current mirror the loop gain is increased by a factor of gm1ro1. The output resistance rout is given by,
| 5 |
Fig. 13.

Schematic and V-I Characteristics of Proposed Low voltage High Impedance Current Mirror.
In Eq. (2) gm1 and gm2 represents the trans conductance of M1 and M2 and r01, r02 and r03 represents the output resistance of M1, M2 and M3 respectively.
Drain source voltage of M2 and M4 is matched by operating them at the same saturation level. The M1 cascode transistor is biased with a voltage Vbn, so that the transistor M2 is in the same saturation ratio of M4. The biasing circuit proposed by (Minch 2002) is used in this work that functions well, at all current levels.
| 6 |
The Eq. (3.3) can be approximated to.
| 7 |
where gm3 and gm4 are the trans conductance of M3 and M4 respectively.
The V-I characteristics of the proposed current mirror is shown in Fig. 13. The proposed current mirror Vmin is 0.2 V, the output impedance is higher than the other current mirrors which is experimentally verified from the slope of the curve obtained from the simulation. Since Vmin is less, it can be used in low voltage applications. The slope is zero in the constant current region. Hence it can be used in the generation of precise On-chip ramp signals to test the Analog and Mixed Signal (AMS) circuits.
The high performance current mirrors such as Cascode, Wilson, Super Wilson and High swing super Wilson current mirrors are also simulated. Their performances are compared with the performance of the proposed current mirror. The current mirrors are designed to generate a current of 5 µA. The performance comparison of proposed current mirror with other current mirrors is shown in Table 2.
Table 2.
Performance Metrics of Various Current Mirrors.
| Current Mirrors |
Vmin (Volts) |
Transistor count |
Power (mw) |
Current Swing (μA) | Output Impedance |
|---|---|---|---|---|---|
| Cascode | 0.8 | 4 | 18 | 5 |
Medium |
| Wilson | 0.7 | 3 | 15.4 | 3.5 |
Poor
|
| Super Wilson | 0.7 | 4 | 18 | 5 | Increased by a factor of gm01r01 than Wilson Current mirror |
| High Swing Super Wilson | 0.3 | 6 | 18.8 | 4.5 | Increased by a factor of gm01r01 than Wilson Current mirror |
| Proposed current mirror | 0.2 | 6 |
16 (with bias circuit) |
5 |
Very good
|

From the results, it is observed that, even though Wilson current mirror has low power and Vmin, due to poor output impedance and poor current swing, it is not used for the signal generation applications. In cascode current mirror, the output current swing is 5 µA, but Vmin makes it unattractive. High swing super Wilson current mirror has low Vmin, but it has medium output impedance and current swing. The proposed low voltage, high impedance current mirror has lowest Vmin, full current swing of 5 µA and superior output impedance than that of the existing current mirrors with almost same power consumption (bias circuit is not considered). The proposed current mirror exhibits better performance in terms of its high output impedance, low power consumption and low voltage compliance, when compared with the other current mirrors. Hence it is used in low voltage, low power and high precise signal generation applications.The ramp generators are designed with the Cascode, Wilson, Super Wilson, High swing Super Wilson and proposed current mirrors and their performances are analysed.
Ramp generation with proposed current mirror
The schematic of the simple ramp generator with the proposed low voltage high impedance current mirror is shown in Fig. 14. The ramp generated with the proposed current mirror is compared with the ideal piece-wise linear ramp generated with the Tanner Tool. The slope deviation of the generated ramp is 0.06 V from that of the ideal piece-wise linear ramp signal.
Fig. 14.

Schematic and Output waveform of Simple Ramp Generator with Proposed Current Mirror.
The slope of the ramp generator depends on the capacitor values. In order to evaluate the slope precision an extensive spice simulation has been carried out for all the ramp generators with the change in capacitor values of about ± 10%. The slope variation of the ramp generator is shown in.
Fig. 15 (a) and Fig. 15 (b). The percentage of the slope variation is found to be in the range of 7.4% to 10.2%.
Fig. 15.

(a) Slope Variation of the Simple Ramp Generator with. a + 10% Variation in Capacitance (b) Slope variation of the proposed simple ramp generator with a −10% variation in capacitance.
Thus, from the results it can be concluded that the simple ramp generator with the proposed current mirror encounters the drawback of slope variation due to the capacitance and process parameter variations. An adaptive ramp generating method using the suggested current mirror is presented and investigated in order to rectify this inaccuracy. The block diagram for the proposed adaptive ramp generator is shown in Fig. 16. This method compares the generated ramp voltage to a fixed reference voltage on a continual basis. A ramp rate control unit receives the result of this comparison and generates a control signal to bring the ramp signal into line with the reference voltage.
Fig. 16.

Corrective Scheme block diagram.
The schematic of the adaptive ramp generator and its output ramp signal is shown in Fig. 17 and Fig. 18.
Fig. 17.

Schematic of the Adaptive Ramp Generator.
Fig. 18.

Adaptive Ramp Generator Output.
The comparison of the ramp signal generated with the adaptive ramp generator with that of the ideal piece wise linear ramp and is shown in Fig. 19.
Fig. 19.

Comparison of the Adaptive Ramp with the Ideal Piecewise Linear Ramp.
The adaptive ramp generator is also subjected to the capacitance variation and it is found that the variation of the slope is in the range of only 1 to 2%. The slope deviation of the ramp signal generated for variation in the capacitance is shown in Fig. 20.
Fig. 20.

Slope Variation of the Proposed Adaptive Ramp Generator with Capacitance Variation.
The performance of the adaptive ramp generator is also compared with the other ramp generators and is reported in Table 3.
Table 3.
Performance Metrics of Various Ramp Generators.
| Ramp Generator |
Power Consumption (mW) | Error voltage (v) |
Slope Comparison with ideal ramp (0.0066) |
Transistor count | Percentage of Slope Variation with Capacitance (± 10%) |
|---|---|---|---|---|---|
|
Cascode (Azais F. 2001) |
0.139 | 0.22 | 0.0055 | 14 | 19.4—5.8 |
| Wilson | 0.371 | 0.99 | 0.0020 | 13 | 62.5—55.4 |
| Super Wilson | 0.375 | 0.97 | 0.0030 | 14 | 59.3—51.3 |
| High Swing Super Wilson | 0.149 | 0.22 | 0.0061 | 16 | 12.7—5.35 |
| Proposed current mirror with Simple ramp generator | 0.15 | 0.06 | 0.0059 | 16 | 10.2—7.4 |
| proposed current mirror with Adaptive ramp generator | 7.94 | 0.0 | 0.001 | 38 (with Bias Circuit) | 1–2 |
The performance of the proposed adaptive ramp generation technique is also compared with that of the other existing techniques. The comparison is shown in Table 4.
Table 4.
Performance Comparison of the proposed adaptive ramp generator with other Techniques.
| Technique |
Supply Voltage Vdd (Volts) |
Output Voltage Vout-pp (Volts) |
Frequency (Hz) |
Design Complexity |
Power Dissipation (mW) |
|
|---|---|---|---|---|---|---|
|
Jing Wang et al.(2000) |
Section II | 3 V |
Upto 0.9 V |
1–10 kHz | Complex | 0.1 |
| Section III | ± 1.5 V |
0.2 V to 1.4 V |
30–400 kHz | Complex | 0.98 | |
| Dufort et al.(1997) | RAM Based | * | * | 40 MHz | Highly Complex | 36.5 |
| Shift Register Based | * | * | 40 MHz | Highly Complex | 129.7 | |
| Azais et al.26 | Capacitor Charging with cascode | 3 V | 3 V | ≈ 10 kHz | Simple | 1.14 |
| Simple Ramp generator with the proposed Current mirror | Capacitor Charging with the proposed Current Mirror | 1.8 V | 1.8 V | ≈ 10 kHz | Simple | 0.15 |
| Proposed Adaptive Ramp Generator with the proposed Current mirror | Capacitor Charging with the proposed Current Mirror | 1.8 V | 1.8 V | ≈ 10 kHz | Medium | 7.94 |
* not reported.
The ramp generators proposed by Jing Wang et al.27 for testing the static and dynamic behavior of the ADCs require a power supply of 3 V and ± 1.5 V and are complex in nature. The signal generation schemes proposed by Dufort et al.28 increases the complexity and hence cannot be used as an On-Chip ramp generation. The ramp generator proposed by Azais26 uses the cascode current mirror and output impedance is low. Table 3 shows that the adaptive ramp generator with the proposed current mirror exhibits better performance in terms of its power consumption, output voltage swing and design complexity than the existing ramp generators. Experimental results also show that the adaptive ramp generator scheme has better ramp linearity and precise slope while maintaining a low area over head. Due to its linearity, low power and precise slope it is used as the On-Chip ramp signal generator for the proposed BIST architecture.
Analog multiplexer
The input analog multiplexer provides any one of the two input signal (either test stimulus or external input) to the ADC. This selection is based on the input select line value. This analog multiplexer is implemented using transmission gates. The schematic diagram of the one stage of Analog Multiplexer is shown in Fig. 21.
Fig. 21.

Schematic of Analog Multiplexer.
Similar type of multiplexer is also used for the selection of BIST output or Normal output.
Response analyzer
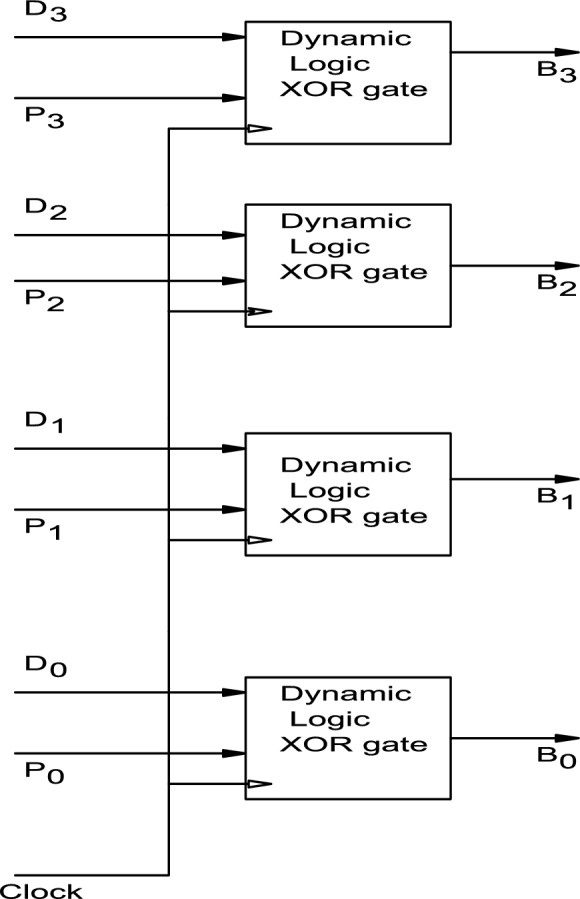
The response analyzer compares the output of the ADC with that of the pattern counter output. The response analyzer consists of series of dynamic logic XOR gate array. All the bits of the ADC output are individually XORed with that of the corresponding pattern counter output and the ADC test outputs are produced. Ideally for the faulty case, the output of the response analyzer should at zero voltage. The response analyzer output is a non-zero output for the faulty cases. Figure 22 shows the single stage of the response analyzer circuit.
Fig. 22.
Block diagram of the response analyzer.
The dynamic logic XOR gate schematic is shown in Fig. 23.The ADC configurations are tested for the seven types of catastrophic faults such as Gate Source Short (GSS), Drain Source Short (DSS), Gate Drain Short (GDS), Drain Open (DO), Source Open (SO), Resistor Open (RO) and Resistor Short (RS). These faults are introduced in the various ADCs under test and the change in the response is compared with the response of the pattern counter outputs and the BIST outputs are generated.
Fig.23.

Schematic of a dynamic logic XOR gate.
Results and discussions
Fault models
Drain Open (DO), Gate Open (GO), Source Open (SO), Resistor Short (RS), Resistor Open (RO), Drain-to-Source Short (DSS), Gate-to-Drain Short (GDS), and Gate-to-Source Short (GSS) are the structural fault models that were used to test the DACs. Figure 24 provides a detailed summary of these potential structural flaws. Low resistance (1Ω) and high resistance (10MΩ) values are employed to simulate these flaws. Open faults are imitated by connecting a 10MΩ resistor in series with the terminals, but transistor shorts are represented by connecting a 1 Ω resistor between the shorted terminals. To simulate a Gate Open defect, for example, a 10MΩ resistor is placed between the transistor’s source and drain terminals and the gate.
Fig. 24.

Various modelling of faults considered in ADC circuits.
Fault coverage of the proposed BIST
The response analyzer’s BIST output for an 8-bit TIQ Flash ADC malfunction is shown in Fig. 25. The output is made up of error voltages with the labels e0 through e7. The error e0 is the result of comparing the pattern counter’s LSB with the ADC output’s least significant bit (LSB) using the XOR operator. The system’s ability to detect mistakes and contribute to effective fault coverage is demonstrated by a nonzero BIST output, which indicates the presence of a problem.
Fig. 25.

BIST Output for Faulty TIQ Flash ADC.
The BIST output for a fault-free TIQ Flash ADC is shown in. Fig. 26 The fault-free case, gives an all-zero output.
Fig. 26.

BIST Output for a Fault-Free TIQ Flash ADC.
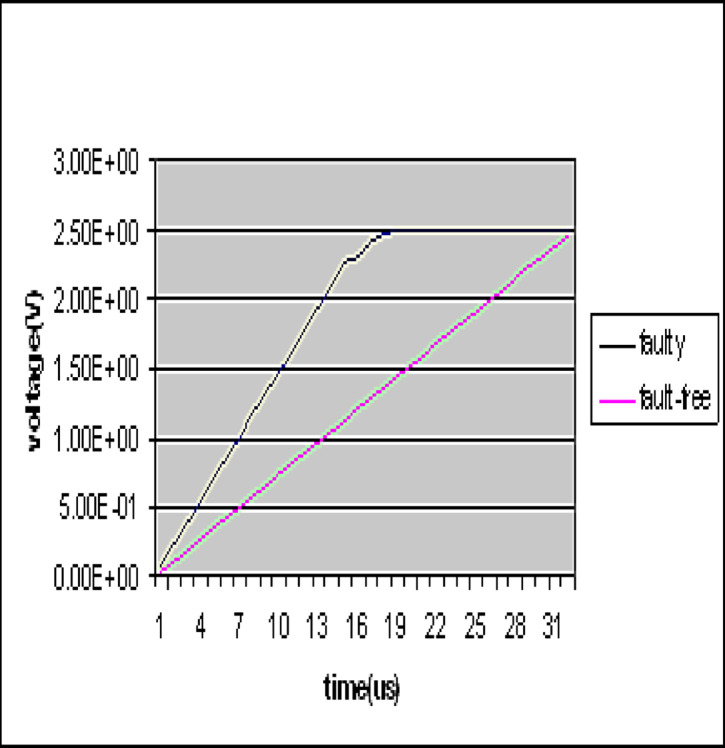
The deviation of the faulty response from the nominal fault-free response is compared and plotted for all the three ADC architectures. Sample plots of ADC for the various faults are shown in Figs. 27 - 32. Figure 27 and Fig. 28 output deviation of servo Tracking ADC. Figure 29 and Fig. 30 output deviation of flash ADC.. Figure 31 and Fig. 32 output deviation of three stage Comparator type SARADC.
Fig. 27.

Output deviation of a Servo Tracking ADC with GSS Fault.
Fig. 28.

Output deviation of a Servo Tracking ADC with GDS Fault.
Fig. 29.

Output deviation of the Flash ADC with DSS fault.
Fig. 30.

Output deviation of the Flash ADC with Source open fault.
Fig. 31.

Output deviation of the three stage Comparator type SAR with the Drain Open Fault.
Fig. 32.
Output deviation of the three stage Comparator type SAR with Source Open Fault.
The results show that the deviation of the faulty response varies from 0.08 V to 1.6 V. In the servo tracking ADC and three stage Comparator type SAR ADC the influence of the short faults is not at the greater extent and hence the average fault coverage of the BIST is only 88.8% and 94.4% respectively. Since the influence of the fault is higher in the Flash and TIQ Flash ADCs the average fault coverage of the BIST is 100%. The fault coverage of the BIST for the each of the catastrophic faults are listed in Table 5.
Table 5.
Comparison of fault coverage of the BIST for the various ADCs.
| Fault type | Fault Coverage (%) | |||
|---|---|---|---|---|
| Tracking ADC | 3 stage Comparator type SAR ADC | Flash ADC | TIQ Flash ADC | |
| Gate Source Short | 74 | 87 | 100 | 100 |
| Gate Drain Short | 74 | 87 | 100 | 100 |
| Drain Source Short | 74 | 87 | 100 | 100 |
| Drain Open | 100 | 100 | 100 | 100 |
| Source Open | 100 | 100 | 100 | 100 |
| Resistor Short | 100 | 100 | 100 | NA |
| Resistor Open | 100 | 100 | 100 | NA |
| Average (%) | 88.8 | 94.4 | 100 | 100 |
NA – Not Applicable (as no resistors in TIQ Flash ADC).
Average fault coverage of 100% has been achieved with the proposed BIST for the Flash and TIQ Flash ADCs. The fault coverage is less in the case of the Servo Tracking ADCs. This is due to the presence of the non-critical faults which resemble the fault-free response.
Parametric analysis of ADC under test
This parametric comparison evaluates four types of ADCs Servo Tracking ADC, Flash ADC, TIQ Flash ADC, and the Proposed 3-stage Comparator SAR ADC based on basic performance metrics: Gain Error, Offset Error, Integral Nonlinearity (INL), Differential Nonlinearity (DNL), and Average Power Consumption.
Differential Nonlinearity (DNL)
Differential Nonlinearity is defined as the difference between maximum and minimum deviation in the step size of two consecutive digital output codes from the ideal step size of 1 Least Significant Bit (LSB). It quantifies the linearity of code transitions across the input range.
Integral Nonlinearity (INL)
Integral Nonlinearity is the maximum deviation of an ADC’s real transfer function from an ideal straight line (best fit) joining the transfer curve endpoints. It indicates the overall linearity of the ADC for its entire input range.
Offset error
Offset error is the deviation of the input voltages from ideal input voltages that generate the first non-zero digital output. It is the horizontal offset of the transfer function and occurs due to reference voltage or comparator threshold mismatches.
Gain error
Gain error is the slope deviation of the actual and ideal transfer functions after offset error correction. It shows scaling errors and is usually a result of variation in the reference voltage or internal amplifier gain.
This Table 6 gives a comparative analysis of four various ADC architectures in terms of the most important performance parameters: gain error, offset error, integral nonlinearity (INL), differential nonlinearity (DNL), and average power consumption. The ADCs under consideration are a Servo Tracking ADC, a traditional Flash ADC, a TIQ Flash ADC, and a new proposed 3-stage comparator-based SAR ADC.
Table 6.
Comparison of the performance metrics of the ADCs under test.
| Performance Parameter | Servo Tracking ADC | Flash ADC | TIQ Flash ADC | Three stage Comparator type SAR ADC |
|---|---|---|---|---|
| Gain errors | 0.0098 | 0.00975 | 0. 0098 | 0.0098 |
| Offset error | 0.000 | 0.000 | 0.4010 | 0.000 |
| INL error | 0.007 LSB | 0.006 LSB | 0.13 LSB | 0.006LSB |
| DNL error | 0.005 LSB | 0.004 LSB | 0.10 LSB | 0.004LSB |
| Average Power Consumption | 17.47 µW | 17.47 µW | 53 mW | 4.1 µW |
Each of the four architectures possesses nearly identical gain errors of around 0.0098, denoting equal accuracy in scaling the analog input. This indicates that all the designs are blessed with equally competitive gain control, and little difference occurs between architectures. The TIQ Flash ADC features a significant offset error of 0.4010, which arises possibly due to threshold mismatches of the inverter-based design. Conversely, Servo Tracking, Flash, and SAR ADCs suggested have no offset, indicating improved initial reference alignment and larger comparator calibration for such designs.
INL of TIQ Flash ADC is 0.13 LSB, significantly more than the remaining three, but less than 0.007 LSB. This suggests that TIQ technique may sacrifice linearity in terms of speed or simplicity. Proposed SAR ADC is also satisfactory, with INL accuracy being nearly that of the conventional Flash ADC. Similar to INL, the TIQ Flash ADC also records the maximum DNL (0.10 LSB), implying step-size variation between adjacent codes. The remaining architectures like the Proposed SAR ADC have DNL of 0.004–0.005 LSB, indicating their stability and accuracy in output step sizes. Power efficiency is yet another distinguishing feature. The TIQ Flash ADC consumes 53 mW, which is by far the highest among the others. The Designed 3-stage SAR ADC consumes the least power of 4.1 µW, suitable for low-power processes. The Servo Tracking and Flash ADCs consume power of 17.47 µW, reflecting an average level of efficiency.
The Recommended SAR ADC has competitive performance with the least INL/DNL, zero offset, and the lowest power consumption possible and hence is highly ideal for battery-operated and IoT applications. Though the TIQ Flash ADC can show speed advantages, its fairly high offset, INL/DNL, and power consumption limit its applications to high-speed but low-power systems. Servo Tracking and Flash ADC have balanced performances with the Flash ADC being slightly better in linearity as well as DNL.
Conclusion
A BIST architecture is proposed to test the various structural faults in the ADCs. The proposed BIST structure involves a adaptive ramp generator, pattern counter and dynamic logic XOR-gate array. The ramp generator occupies less area and consumes low power when compared to the conventional sigma delta modulator based ramp generator. The pattern counter generates all the reference codes necessary for the comparison of the ADC output. The dynamic logic XOR-gate array is used as the response analyzer to compare the ADC and pattern counter outputs. The effectiveness of the proposed BIST is tested with four different ADC architectures namely Servo Tracking ADC, Flash ADC,Threshold Invert Quantization (TIQ) Flash ADC and three stage comparator based Servo Tracking ADC. Simulation results show that the catastrophic faults in the Flash and TIQ Flash ADCs are covered effectively compared to the Servo tracking ADCs faults. The proposed BIST scheme provides average fault coverage of 95.8%. The scheme also circumvents the problems faced by the existing BIST schemes. This has a simple design, occupies minimum area and consumes less power.
Author contributions
Contribution:.J.R and V.G conceptual design experimentation, S.S and C.E written manuscript and J.R and V.G verified manuscript.
Data availability
All data generated or analysed during this study are included in this published article.
Declarations
Competing interests
The authors declare no competing interests.
Footnotes
Publisher’s note
Springer Nature remains neutral with regard to jurisdictional claims in published maps and institutional affiliations.
References
- 1.Teroca E. (1993) A built-in self-test for ADC and DAC in a single-chip CODEC Proc. of IEEE International Test Conference 791–796. (1993)
- 2.Arabi K. and Kamniska B. (1994)‘A new built-in self-test for digital- to- analog and analog-to-digital converters Proc. of IEEE ICCAD 491–494. (1994)
- 3.Sunter S.K. and Naveena Nagi A simplified polynomial- Fitting algorithm for DAC and ADC BIST’ Proc. of IEEE International Test Conference 389–395. (1997)
- 4.Jan Arild Tofte , Chee-Kian Ong , Jiun-Lang Huang and Kwang-Ting,(Tim) Cheng characterization of a pseudo-random testing,technique for analog and mixed-signal built-in-self-test Proc. of the 18th IEEE VLSI Test Symposium (VTS'00), Prentice Hall of India Pvt. Ltd., New Delhi 237. (2000)
- 5.Vinnakota, B. Analog and mixed –signal test (Prentice- Hall Inc, 1998). [Google Scholar]
- 6.Ohletz M. (1991) Hybrid built-in self-test for mixed analog/digital integrated circuit Proc. of European Test Conference 307–316. (1991)
- 7.Pan, C. Y. & Cheng, K. T. Pseudorandom testing for mixed-signal circuits. IEEE Trans. Comput.-Aided Design Integr. Circuits Syst.16(10), 1173–1185 (1997). [Google Scholar]
- 8.Chioktour, V. & Kakarountas, A. Adaptive BIST for concurrent on-line testing on combinational circuits. Electronics11(19), 3193. 10.3390/electronics11193193 (2022). [Google Scholar]
- 9.Nti Darko, E. et al. Low-cost direct digital synthesis-based on-chip waveform generation for analog/mixed signal BIST applications. Metrology5(1), 8. 10.3390/metrology5010008 (2025). [Google Scholar]
- 10.Saikiran, M. et al. Low-cost defect simulation framework for analog and mixed signal (AMS) circuits with enhanced time-efficiency. Analog. Integr. Circ. Sig. Process117, 73–94. 10.1007/s10470-023-02167-7 (2023). [Google Scholar]
- 11.S. Umarani and M. L. Rathod, "ASIC implementation and analysis of logic BIST controller for ripple carry adder at different technology 2021 International Conference on Intelligent Technologies (CONIT), Hubli, India 1–4, 10.1109/CONIT51480.2021.9498398. (2021)
- 12.T. R. D. Kumar, S. S. Babu, K. S. Rani, S. V. Kumar, S. Vishal and S. K. P. Raj, Implementation of dynamic logic gates using bist architecture for effective computing 2024 International Conference on Recent Advances in Electrical, Electronics, Ubiquitous Communication, and Computational Intelligence (RAEEUCCI) Chennai, India 1–5 10.1109/RAEEUCCI61380.2024.10547805. (2024)
- 13.Menbari, A. & Jahanirad, H. A low-cost BIST design supporting offline and online tests. J. Electron. Test38, 107–123. 10.1007/s10836-022-05986-0 (2022). [Google Scholar]
- 14.Jangir, M. Dixit and A. Kumar, "An on chip BIST architecture for ADC parameter testing and measurement 2024 1st International Conference on Innovative Sustainable Technologies for Energy, Mechatronics, and Smart Systems (ISTEMS) Dehradun India 1–4, 10.1109/ISTEMS60181.2024.10560272. (2024)
- 15.Dri, E., Peretti, G. & Romero, E. A built-in self-test for analog reconfigurable filters implemented in a mixed-signal configurable processor. Analog. Integr. Circ. Sig. Process112, 355–365. 10.1007/s10470-022-02055-6 (2022). [Google Scholar]
- 16.K. Paldurai and K. Hariharan, An efficient time-tick based bist scheme to calculate static errors of ADC 2023 International Conference on Intelligent Technologies for Sustainable Electric and Communications Systems (iTech SECOM) Coimbatore India 367–372 10.1109/iTechSECOM59882.2023.10435318. (2023)
- 17.P. S, R. Sucheta, V. R, G. K. T R and N. Mohan, BIST Based aging fault prediction using machine learning 2021 Second International Conference on Electronics and Sustainable Communication Systems (ICESC) Coimbatore India 1715–1722 10.1109/ICESC51422.2021.9532739. (2021)
- 18.S. Nagaraju, G. R. Hemantha and S. Balasundaram, Switch controlled state skipping based memory efficient test pattern generator for BIST application 2023 Second International Conference on Advances in Computational Intelligence and Communication (ICACIC), Puducherry India 1–4 2023
- 19.Tang, X.-B. & Tachibana, M. A BIST scheme for dynamic comparators. Electronics11(24), 4169. 10.3390/electronics11244169 (2022). [Google Scholar]
- 20.Wenger, Y., Meinerzhagen, B. & Issakov, V. Built-In self-test of millimeter-wave integrated front-end circuits: how far have we come?. IEEE Access12, 78572–78588. 10.1109/ACCESS.2024.3406583 (2024). [Google Scholar]
- 21.Á. F. G. Ferreira, L. B. Zilch, M. S. Lubaszewski and T. R. Balen, Indirect test pattern generation for mixed-signal circuits using machine learning," In IEEE Design & Test, 10.1109/MDAT.2025.3551949.
- 22.L. J. Ahmed, P. Malin Bruntha, S. Dhanasekar, V. Govindaraj, T. S. Krishnapriya and A. Ramjan Begam An efficient heart-disease prediction system using machine learning and deep learning techniques 2023 9th International Conference on Advanced Computing and Communication Systems (ICACCS), Coimbatore India 1980–1985 10.1109/ICACCS57279.2023.10112793. (2023)
- 23.Sachdev, M. A realistic defect oriented testability methodology for analog circuits. J. Electr. Testing: Theory Appl.6(3), 265–276 (1995). [Google Scholar]
- 24.Balivada, A., Chen, J. & Abraham, J. A. Analog testing with time response parameters. IEEE Des. Test Comput.13(2), 18–25 (1996). [Google Scholar]
- 25.Slamani, M. & Kaminska, B. Analog circuit fault diagnosis based on sensitivity computation and functional testing. IEEE Des. Test Comput.9(1), 30–39 (1992). [Google Scholar]
- 26.Azais F., Bernard S., Bertrand Y., Michel X. and Renovell M. A Low-cost Adaptive Ramp Generator for Analog BIST Applications Proce. of IEEE VLSI Test Symposium, pp. 266–271. (2001)
- 27.Jing Wang, Sanchez-Sinencio E. and Maloberti F. Very linear ramp-generators for high resolution ADC BIST and calibration Proc. of the 43 rd IEEE Midwest Symposium on Circuits and Systems 2 908–911. (2000)
- 28.Dufort B. and Roberts G.W. Signal generation using periodic single and multi-bit sigma-delta modulated streams Proc. of International Test Conference 396–405. (1997)
- 29.P. M. Bruntha, S. Dhanasekar, L. J. Ahmed, V. Govindaraj, S. I. A. Pandian and S. S. Abraham Lung_RUNET: A segmentation framework for lung nodules 2023 9th International Conference on Advanced Computing and Communication Systems (ICACCS) Coimbatore India 658–661 10.1109/ICACCS57279.2023.10113093. (2023)
- 30.Ramesh, J., Nithyadevi, S. & Govindaraj, V. Fault classification in Digital to Analog Converter using machine learning. Int. J. Electron.10.1080/00207217.2024.2429149 (2024). [Google Scholar]
- 31.R. Joglekar, R. Daniels, A. Jagare, P. Shah and S. S. Rathod TIQ Comparator Based 8-bit Flash ADC for Communication Applications 2022 Sardar Patel International Conference on Industry 4.0 - Nascent Technologies and Sustainability for 'Make in India’ Initiative Mumbai, India 1–6, 10.1109/SPICON56577.2022.10180784. (2022)
Associated Data
This section collects any data citations, data availability statements, or supplementary materials included in this article.
Data Availability Statement
All data generated or analysed during this study are included in this published article.