Abstract
We show that a pH-sensitive derivative of the green fluorescent protein, designated ratiometric GFP, can be used to measure intracellular pH (pHi) in both gram-positive and gram-negative bacterial cells. In cells expressing ratiometric GFP, the excitation ratio (fluorescence intensity at 410 and 430 nm) is correlated to the pHi, allowing fast and noninvasive determination of pHi that is ideally suited for direct analysis of individual bacterial cells present in complex environments.
Bacteria are often subjected to various forms of environmental stress, and in recent years, there has been increasing focus on the different mechanisms they employ to protect themselves against these environmental changes. One of the most extensively studied stress responses is the ability of bacteria to survive low pH by adjusting their intracellular pH (pHi) in response to changes in extracellular pH (pHex) (1, 4). Several methods have been developed for measuring bacterial pHi (2, 14, 17, 19). However, as these techniques require radioactive labeling and time-consuming staining procedures, noninvasive methods for continuous measurement of pHi in bacteria are in demand. Since the discovery of green fluorescent protein (GFP), a wide range of mutant variants has been created. In eukaryotic cells, several GFP variants with altered excitation and emission spectra have been examined for their use as pHi probes (8, 11, 12, 13, 16). One of these GFP variants, ratiometric GFP, was obtained by introducing specific amino acid substitutions to the chromophore, causing the resulting protein to alter its excitation spectrum according to the pH of the surrounding environment (13).
In order to express the ratiometric GFP protein in both gram-positive and gram-negative bacterial cells, we inserted the corresponding gene downstream of the P32 promoter in the chloramphenicol-resistant expression vector pMG36c, which replicates in both cell types (20). The ratiometric gfp gene (GenBank accession no. AF058694) was amplified by PCR by using the oligonucleotides C-GFP (5′-TAT CCC AAG CTT TTA TTT GTA TAG TTC ATC CAT GCC ATG TG-3′) and N-GFP (5′-TGC TCT AGA GTA ATA AGG AGG AAA AAA TAT GAG TAA AGG AGA AGA ACT TTT CAC TGG AGT TGT CCC-3′) (DNA Technology, Århus, Denmark) that additionally introduced an initiating ATG codon as well as a ribosomal binding site (5). The resulting 750-bp DNA fragment was inserted into the XbaI- and EcoRI-digested pMG36c, and the correct DNA sequence of the ratiometric gfp gene present in the resulting plasmid (pGFPratiometric) was confirmed by DNA sequence analysis (data not shown).
When we introduced pGFPratiometric in the gram-positive bacterium Lactococcus lactis subsp. lactis CNRZ 157 as previously described (9) and grew cells at 30°C in M17 broth containing 0.5% (wt/vol) glucose and 5 μg of chloramphenicol per ml, we found that excitation at 410 nm gave a strong pH-dependent fluorescent signal. Furthermore, a pH-independent isosbestic point was seen at 430 nm, which is in accordance with previous results obtained in mammalian cells (13 and data not shown). It was therefore concluded that the excitation ratio, fluorescence intensity at 410 and 430 nm (R410/430), is suitable as a measure of pHi.
To correlate R410/430 with pHi, L. lactis cells carrying pGFPratiometric were permeabilized with nisin (3, 7), which disrupts the proton gradient across the cytoplasmic membrane and allows the internal pH to become identical to the external pH. Correspondingly, Escherichia coli TOP 10 cells (Invitrogen) were grown at 37°C in Luria-Bertani broth, transformed with pGFPratiometric (15), and pH-equilibrated by use of carbonyl cyanide-m-chlorophenylhydrazone (CCCP) (6). Subsequently, overnight cultures expressing ratiometric GFP were harvested by centrifugation (10,000 × g for 5 min), washed twice in potassium phosphate buffer (pH 7.5) containing glucose (10 mM), and finally resuspended in potassium phosphate buffer (10 mM glucose) with appropriate pH for 30 min. One hundred microliters of the bacterial suspension (approximately 108 cells) was applied to a coverslip coated with 0.01% (wt/vol) poly-l-lysine (Sigma) and allowed to settle. Prior to being used, the coverslips were cleaned by overnight submersion in chrome sulfuric acid (Sigma) and then rinsed in distilled water and stored in 70% (vol/vol) ethanol. Unattached bacteria were removed by rinsing with buffer. The fluorescence microscopy setup has previously been described (19), except that the emission was recorded on a Coolsnap fx charge-coupled device camera (Roper Scientific, Trenton, Pa.). The dichroic mirrors were 380 and 510 nm for ratiometric GFP and cFDAse [fluorochrome 5(6)-carboxyfluorescein diacetate succinimidyl ester], respectively, and the emission band-pass filters were 500 to 530 nm and 515 to 565 nm for ratiometric GFP and cFDAse, respectively. Images were stored on a personal computer by using Metafluor 4.5 (Universal Imaging, Downingtown, Pa.), and data from regions of interest (i.e., single cells) were logged into a spreadsheet (Excel). In each experiment, at least 20 single cells were analyzed. Each experiment was carried out in duplicate.
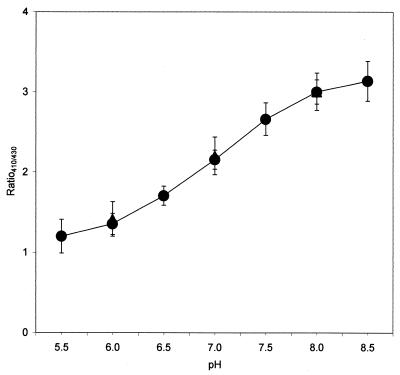
On the basis of the results obtained with nisin- or CCCP-treated cells, a calibration curve was constructed by plotting R410/430 versus the pH of equilibrated cells in the pH range of 5.5 to 8.5 (Fig. 1). When L. lactis cells were permeabilized with nisin, we found that the relationship between R410/430 and pHi was similar to that observed when E. coli cells treated with CCCP were investigated.
FIG. 1.
Correlation between pHi and R410/430 of ratiometric GFP in pH-equilibrated cells. L. lactis and E. coli single cells were equilibrated with 10 kIU of nisin ml−1 (closed circles) and 10 μM CCCP (closed triangles), respectively. Each point represents the mean value for 20 individual cells, with error bars indicating the standard deviations.
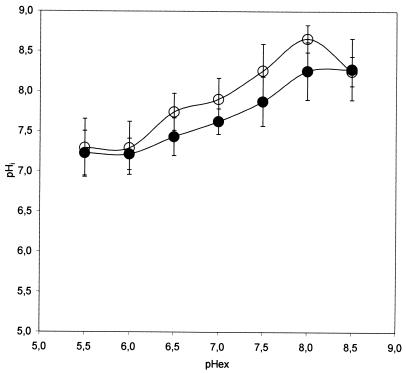
Subsequently, we used the calibration curve (Fig. 1) to determine pHi in single bacterial cells that had been resuspended in 50 mM potassium phosphate buffers with various pHs (Fig. 2). Examination of the pHi of L. lactis cells revealed that the pH gradient (ΔpH = pHi − pHex) is approximately 1.8 at a pHex of 5.5. Increasing the pHex caused a decrease in the ΔpH, which finally became negative at a pHex of 8.5. In order to validate these results, the pH measurements were also carried out by using the conventional pH-sensitive cFDAse. L. lactis cells stained with cFDAse were analyzed as previously described (19), except that the pH equilibration was performed with nisin as described above.
FIG. 2.
Determination of L. lactis pHi as a function of pHex by use of ratiometric GFP and cFDAse. The pHi of cells transformed with ratiometric GFP (closed circles) was obtained by measuring the R410/430 and converting the obtained value to the correlating pHi. For validation, pHi was also obtained by staining the cells with cFDAse (open circles) and measuring the R490/435. Each point represents the mean value for 20 individual cells, with error bars indicating the standard deviations.
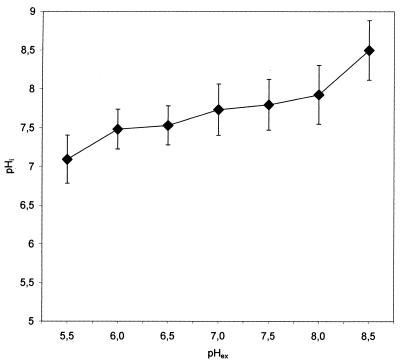
The results presented in Fig. 2 show a good correlation (R = 0.987) between the pH responses obtained with the two methods. The observed deviations possibly result from the fact that both methods rely on a calculation of pHi based on standard curves, which introduces a variation of 0.1 to 0.2 pH units (18). In addition, heterogeneities in the populations will influence the standard deviation. Therefore, we conclude that ratiometric GFP can be used as a pHi probe for bacterial cells. When pHi was measured in E. coli cells exposed to various pH values, we found that a large ΔpH of approximately 1.5 was maintained at a low pHex, gradually decreasing with increasing pHex until finally becoming 0 at a pHex of 8 (Fig. 3). For both bacteria, we obtained similar standard deviations (Fig. 2 and 3), suggesting that ratiometric GFP is equally applicable for measurements with gram-negative and gram-positive bacteria.
FIG. 3.
Determination of E. coli pHi as a function of pHex. Cells expressing ratiometric GFP were resuspended in phosphate buffers at pHs ranging from 5.5 to 8.5. The R410/430 was determined and was transformed to the corresponding pHi. Each point represents the mean value for 20 individual cells, with error bars indicating the standard deviations.
To ensure that the presence of pGFPratiometric did not affect the growth of bacterial cells, we followed the growth of L. lactis and E. coli cells in the presence or absence of the plasmid and found no effect with L. lactis, while the presence of the plasmid in E. coli cells slightly reduced the growth rate (data not shown). We also investigated the stability of pGFPratiometric as previously described (10) and found that 74% of L. lactis and 54% of E. coli cells retained the plasmid after 60 generations, demonstrating that studies can be conducted in the absence of antibiotic selection of the plasmid. Furthermore, we investigated whether the type of acid used for acidification affects the ratiometric GFP excitation spectrum when expressed in L. lactis cells and found the same excitation spectrum with acetic, citric, or formic acid as we found with hydrochloric acid (data not shown). This result indicates that the method is also applicable when the pH is adjusted with organic acids.
In conclusion, we have applied a pH-sensitive derivative of the GFP, ratiometric GFP (13), for measurement of pHi in single bacterial cells in the pH range of 5.5 to 8.5. While this technique requires that the cells of interest express the ratiometric GFP protein, it provides a fast, noninvasive, and continuous determination of pHi which is ideally suited for kinetic studies of both gram-negative and gram-positive bacteria. As the ratio between the fluorescence intensities at two different excitation wavelengths is used, the determination is independent of the individual concentration of ratiometric GFP in each cell. Furthermore, we show that the excitation spectrum of ratiometric GFP when cells were acidified with various organic acids was identical to that when cells were acidified with hydrochloric acid, suggesting that the ratiometric GFP is well suited for studies of the pHi in bacteria residing in natural environments such as food products.
Acknowledgments
We thank G. Miesenböck for providing the ratiometric gfp gene, J. Kok for providing pMG36c, and M. Chopin for providing L. lactis subsp. lactis CNRZ 157. A. Arndal and C. Friis are thanked for excellent technical assistance. We thank J. Delves-Broughton (Aplin and Barrett Ltd., Danisco Cultor, Beaminster, England) for providing the purified nisin.
REFERENCES
- 1.Booth, I. R. 1985. Regulation of cytoplasmic pH in bacteria. Microbiol. Rev. 49:359-378. [DOI] [PMC free article] [PubMed] [Google Scholar]
- 2.Breeuwer, P., J.-L. Drocourt, F. M. Rombouts, and T. Abee. 1996. A novel method for continuous determination of the intracellular pH in bacteria with the internally conjugated fluorescent probe 5 (and 6-)-carboxyfluorescein succinimidyl ester. Appl. Environ. Microbiol. 62:178-183. [DOI] [PMC free article] [PubMed] [Google Scholar]
- 3.Budde, B. B., and M. Jakobsen. 2000. Real-time measurements of the interaction between single cells of Listeria monocytogenes and nisin on a solid surface. Appl. Environ. Microbiol. 66:3586-3591. [DOI] [PMC free article] [PubMed] [Google Scholar]
- 4.Cook, G. M., and J. B. Russell. 1994. The effect of extracellular pH and lactic acid on pH homeostasis in Lactococcus lactis and Streptococcus bovis. Curr. Microbiol. 28:165-168. [Google Scholar]
- 5.Denoya, C. D., D. H. Bechhofer, and D. Dubnau. 1986. Translational autoregulation of ermC 23S rRNA methyltransferase expression in Bacillus subtilis. J. Bacteriol. 168:1133-1141. [DOI] [PMC free article] [PubMed] [Google Scholar]
- 6.Diez-Gonzalez, F., and J. B. Russell. 1997. Effects of carbonylcyanide-m-chlorophenylhydrazone (CCCP) and acetate on Escherichia coli O157:H7 and K-12: uncoupling versus anion accumulation. FEMS Microbiol. Lett. 151:71-76. [DOI] [PubMed] [Google Scholar]
- 7.Duffes, F., P. Jenoe, and P. Boyaval. 2000. Use of two-dimensional electrophoresis to study differential protein expression in divercin V41-resistant and wild-type strains of Listeria monocytogenes. Appl. Environ. Microbiol. 66:4318-4324. [DOI] [PMC free article] [PubMed] [Google Scholar]
- 8.Elsliger, M. A., R. M. Wachter, G. T. Hanson, K. Kallio, and S. J. Remington. 1999. Structural and spectral response of green fluorescent protein variants to changes in pH. Biochemistry 38:5296-5301. [DOI] [PubMed] [Google Scholar]
- 9.Holo, H., and I. F. Nes. 1989. High-frequency transformation, by electroporation, of Lactococcus lactis subsp. cremoris grown with glycine in osmotically stabilized media. Appl. Environ. Microbiol. 55:3119-3123. [DOI] [PMC free article] [PubMed] [Google Scholar]
- 10.Ingmer, H., and S. N. Cohen. 1993. Excess intracellular concentration of pSC101 RepA protein interferes with both plasmid DNA replication and partitioning. J. Bacteriol. 175:7834-7841. [DOI] [PMC free article] [PubMed] [Google Scholar]
- 11.Karagiannis, J., and P. G. Young. 2001. Intracellular pH homeostasis during cell-cycle progression and growth state transition in Schizosaccharomyces pombe. J. Cell Sci. 114:2929-2941. [DOI] [PubMed] [Google Scholar]
- 12.Kneen, M., J. Farinas, Y. Li, and A. S. Verkman. 1998. Green fluorescent protein as a noninvasive intracellular pH indicator. Biophys. J. 74:1591-1599. [DOI] [PMC free article] [PubMed] [Google Scholar]
- 13.Miesenböck, G., D. A. De Angelis, and J. E. Rothman. 1998. Visualizing secretion and synaptic transmission with pH-sensitive green fluorescent proteins. Nature 394:192-195. [DOI] [PubMed] [Google Scholar]
- 14.Nannen, N. L., and R. W. Hutkins. 1991. Intracellular pH effects in lactic acid bacteria. J. Dairy Sci. 74:741-746. [Google Scholar]
- 15.O'Callaghan, D., and A. Charbit. 1990. High-efficiency transformation of Salmonella typhimurium and Salmonella typhi by electroporation. Mol. Gen. Genet. 223:156-158. [DOI] [PubMed] [Google Scholar]
- 16.Robey, R. B., O. Ruiz, A. V. P. Santos, J. Ma, F. Kear, L. J. Wang, C. J. Li, A. A. Bernardo, and J. A. L. Arruda. 1998. pH-dependent fluorescence of a heterologously expressed Aequorea green fluorescent protein mutant: in situ spectral characteristics and applicability to intracellular pH estimation. Biochemistry 37:9894-9901. [DOI] [PubMed] [Google Scholar]
- 17.Roe, A. J., D. McLaggan, I. Davidson, C. O'Byrne, and I. R. Booth. 1998. Perturbation of anion balance during inhibition of growth of Escherichia coli by weak acids. J. Bacteriol. 180:767-772. [DOI] [PMC free article] [PubMed] [Google Scholar]
- 18.Siegumfeldt, H., K. B. Rechinger, and M. Jakobsen. 1999. Use of fluorescence ratio imaging for intracellular pH determination of individual bacterial cells in mixed cultures. Microbiology 145:1703-1709. [DOI] [PubMed] [Google Scholar]
- 19.Siegumfeldt, H., K. B. Rechinger, and M. Jakobsen. 2000. Dynamic changes of intracellular pH in individual lactic acid bacterium cells in response to a rapid drop in extracellular pH. Appl. Environ. Microbiol. 66:2330-2335. [DOI] [PMC free article] [PubMed] [Google Scholar]
- 20.van de Guchte, M., J. M. van der Vossen, J. Kok, and G. Venema. 1989. Construction of a lactococcal expression vector: expression of hen egg white lysozyme in Lactococcus lactis subsp. lactis. Appl. Environ. Microbiol. 55:224-228. [DOI] [PMC free article] [PubMed] [Google Scholar]


