

ABSTRACT
Objective
To evaluate the impact of endometrial thickness on the reproductive outcomes of embryo transfer (ET) treatments using both cut‐off‐based meta‐analysis and meta‐analysis of proportions.
Methods
This was a systematic review and meta‐analysis of comparative studies (randomized controlled trials, cohort studies, case–control studies) and descriptive studies (cross‐sectional studies, case series) published in English, French, German, Italian or Spanish and analyzing the impact of endometrial thickness on the rates of embryo implantation, clinical pregnancy, live birth, miscarriage and/or ectopic pregnancy in fresh and/or frozen–thawed ET cycles. Live‐birth rate was defined as the primary outcome. The literature search was conducted in MEDLINE, EMBASE, Cochrane Central Register of Controlled Trials, ClinicalTrials.gov, Web of Science and ÍnDICEs‐CSIC, from inception of each database until 1 September 2024. The risk of bias was assessed using the Newcastle–Ottawa scale for analytical studies and the Joanna Briggs Institute tool for descriptive studies. Pooled effects were estimated as odds ratios (OR) or risk differences obtained from a random‐effects model, with 95% CIs. Linear meta‐regression was used to assess the relationship between risk difference and endometrial thickness cut‐off. Meta‐analysis of proportions was performed as a secondary analysis, comparing outcome rates between 2‐mm intervals of endometrial thickness and a reference category (≥ 6 to < 8 mm).
Results
A total of 67 studies were included, of which 22 were cohort studies and 45 were descriptive. In fresh ET cycles, the live‐birth rate was higher in patients with a thicker endometrium across cut‐offs from ≥ 5 mm (OR, 5.66 (95% CI, 1.10–28.98)) to ≥ 15 mm (OR, 1.49 (95% CI, 1.26–1.77)). Effect size decreased linearly as the cut‐off increased (P < 0.0001; R 2 = 61.5%). Meta‐analysis of proportions found significant differences in live‐birth rate when the reference category (≥ 6 to < 8 mm) (0.26 (95% CI, 0.22–0.30); I 2 = 94.3%) was compared to the groups with endometrial thickness of ≥ 4 to < 6 mm (0.17 (95% CI, 0.14–0.20); I 2 = 0%), ≥ 10 to < 12 mm (0.35 (95% CI, 0.28–0.42); I 2 = 99.2%), ≥ 12 to < 14 mm (0.43 (95% CI, 0.33–0.53); I 2 = 99.5%) and ≥ 14 to < 16 mm (0.39 (95% CI, 0.27–0.51); I 2 = 99.2%). In frozen–thawed ET cycles, thicker endometrium was associated with a higher live‐birth rate for cut‐offs between ≥ 5 mm (OR, 2.65 (95% CI, 1.23–5.72); I 2 = 0%) and ≥ 8 mm (OR, 1.17 (95% CI, 1.10–1.24); I 2 = 13%). A linear relationship between endometrial thickness and effect size was observed for this analysis (P < 0.0001; R 2 = 73.8%). In fresh ET cycles, endometrial thickness was correlated positively with the rates of clinical pregnancy and embryo implantation, inversely with miscarriage rate and showed no correlation with ectopic pregnancy. In frozen–thawed ET cycles, thicker endometrium was correlated positively with the rate of clinical pregnancy and inversely with that of miscarriage. Evidence quality was rated as very low in 70% of assessments because of bias and inconsistency.
Conclusions
Endometrial thickness is associated with reproductive outcomes, but demonstrates a gradient of effectiveness as a prognostic indicator, rather than offering a critical threshold below which ET should be avoided. ET scheduling should consider endometrial thickness alongside other prognostic factors. © 2025 The Author(s). Ultrasound in Obstetrics & Gynecology published by John Wiley & Sons Ltd on behalf of International Society of Ultrasound in Obstetrics and Gynecology.
Keywords: assisted reproduction, clinical pregnancy, ectopic pregnancy, embryo implantation, embryo transfer, endometrial thickness, infertility, live birth, miscarriage
INTRODUCTION
During the follicular phase of the ovarian cycle, the endometrial thickness increases as a result of the proliferation of its functional layer, both in the natural cycle and in assisted reproductive treatments involving the transfer of fresh or frozen–thawed embryos. Endometrial growth represents one of the estrogen‐induced morphological and functional changes involved in the preparation of the endometrium for embryo implantation. In a clinical setting, endometrial thickness can be measured repeatedly and reproducibly using high‐resolution transvaginal ultrasound 1 , 2 , which has generated interest over several decades in evaluating its use as a marker of endometrial receptivity 3 , 4 . Indeed, ultrasonographic measurement of endometrial thickness during the advanced proliferative phase is considered a prognostic factor for endometrial receptivity to embryo implantation 5 , 6 , 7 , 8 , 9 . The majority of original research studies and meta‐analyses published to date support the association between endometrial thickness and the effectiveness of embryo transfer (ET) treatments. However, despite this association, a definitive threshold for endometrial thickness associated with critical rates of embryo implantation, clinical pregnancy, live birth, miscarriage and ectopic pregnancy is yet to be identified. A minimal endometrial thickness of 7–8 mm is frequently accepted in clinical practice, although this threshold has limited ability to discriminate between favorable and unfavorable outcomes in ET cycles 7 , 10 .
The aim of the present study was to analyze the impact of endometrial thickness on the reproductive outcomes of ET treatments using an updated quantitative synthesis, focusing on relevant outcomes overlooked in previous meta‐analyses, such as ectopic pregnancy. Our primary cut‐off‐based analysis was complemented by two additional approaches: first, linear regression analysis of the relationship between effect size and endometrial thickness cut‐off value, and second, estimation of outcome probabilities across different intervals of endometrial thickness. The second approach aims to avoid the cumulative estimation effect associated with threshold‐based analysis.
METHODS
This systematic review and meta‐analysis was registered prospectively in the PROSPERO database (registration number: CRD42024569911).
Eligibility criteria
The population of interest was infertile women undergoing fresh or frozen–thawed ET, for whom endometrial preparation was by artificial cycle (sequential administration of exogenous estrogens and progesterone), and for whom endometrial thickness was measured using transvaginal ultrasound, either on the day of triggering (with human chorionic gonadotropin or other agents) in the case of fresh ET, or on the day of initiating exogenous progesterone in the case of frozen–thawed ET.
We defined the following inclusion criteria. (1) Comparative study (randomized controlled trial, cohort study or case–control study) or descriptive study (cross‐sectional study or case series) that analyzed or described the effect of endometrial thickness on the rates of embryo implantation, clinical pregnancy, live birth, miscarriage and/or ectopic pregnancy. (2) Measurement of endometrial thickness was performed using high‐resolution transvaginal ultrasound, as part of ET cycle monitoring. (3) Results were expressed in the appropriate terms to be summarized into the quantitative synthesis. (4) Peer‐reviewed article that was published in English, French, German, Italian or Spanish from inception of the database until 1 September 2024.
The exclusion criteria were defined as follows. (1) Study assessed the effect of endometrial thickness on the outcome of intrauterine insemination. (2) Endometrial thickness was measured on a date other than the day of triggering, in the case of fresh ET, or that of initiating exogenous progesterone, in the case of frozen–thawed ET. (3) Insufficient information provided on the population, exposure, outcomes or comparisons of interest. (4) Dataset not compliant with the requirements of data extraction for the meta‐analysis.
Information sources and search strategy
We performed a systematic literature search in the following databases: MEDLINE, EMBASE, Cochrane Central Register of Controlled Trials (CENTRAL), ClinicalTrials.gov, Web of Science (including Web of Science Core Collection, Current Contents Connect, Derwent Innovations Index, Grants Index, KCI–Korean Journal Database, ProQuest Citation Index and SciELO Citation Index) and ÍnDICEs‐CSIC. The search strategy was structured using the specific syntax of each database (Appendix S1). We searched for articles published in the abovementioned languages with no time restrictions. The first search was conducted on 1 July 2024, and the search was rerun on 1 September 2024. Cross‐references cited in reviewed studies were identified manually.
Selection of studies and data extraction
Studies identified by the literature search were classified initially according to their title and abstract by pairs of authors, each author working independently. Studies deemed eligible by both authors were evaluated in full‐text format, and discrepancies were resolved by consensus with a third author (either F.P.‐M. or M.C.‐C.).
The independent variable was endometrial thickness, defined as the linear distance between two external endometrial boundaries, measured in the region of maximum endometrial thickness. Measurement was by transvaginal ultrasound scan on the day of triggering in the case of fresh ET, or on the day of initiating exogenous progesterone in the case of frozen–thawed ET.
The exposure was defined as endometrial thickness greater than or equal to the cut‐off value, which was used to dichotomize the distribution of transfer cycles according to endometrial thickness. Non‐exposed patients were those with endometrial thickness below the cut‐off value.
The primary outcome was the live‐birth rate, defined according to the International Glossary on Infertility and Fertility Care 11 . Secondary outcomes were the rates of embryo implantation, clinical pregnancy, miscarriage and ectopic pregnancy, defined as per the aforementioned consensus.
Data were extracted from the selected studies by one of a pair of authors and verified by the second author. Collected data included year of publication, study design, study period, study setting, study population (type of ET, inclusion and exclusion criteria), procedure for measurement of endometrial thickness, use of endometrial features as a criterion for cancellation of ET, cut‐off values and/or intervals of endometrial thickness analyzed, number of exposed and non‐exposed patients, outcomes considered and control of potential confounders (age, body mass index, smoking status, type and cause of infertility, number and quality of embryos transferred and day of ET). Disagreements between authors on the results of data extraction were resolved by a third review of the original study, conducted jointly by the two evaluators.
Risk‐of‐bias assessment for individual studies
Non‐randomized comparative studies were evaluated using the Newcastle–Ottawa scale (NOS) for cohort studies 12 . The following domains were analyzed: selection of participants, comparability of exposed and non‐exposed cohorts, and assessment of the outcome. Results were summarized by a numerical score and qualified according to the standards of the United States Agency for Healthcare Research and Quality (AHRQ) 13 . Cross‐sectional studies and case series were assessed using the Joanna Briggs Institute (JBI) critical appraisal tool (jbi.global/critical‐appraisal‐tools).
Quality assessment was carried out by pairs of authors, each author working independently. Disagreements were resolved by a third review of the original study, conducted jointly by the two evaluators. All selected studies were included in the quantitative synthesis, irrespective of their quality, although a sensitivity analysis for study quality was conducted.
Effect measures and synthesis methods
Numerical data were transcribed as reported by the original authors, and missing data were noted. When results were reported in terms of intervals of endometrial thickness, standardization was performed by defining 1‐mm intervals including values greater than or equal to a given integer thickness and less than the next consecutive integer thickness (i.e. from ≥ n mm to < n + 1 mm). When reproductive outcomes were reported in terms of strata of endometrial thickness (defined by a threshold), cumulative frequencies above or below specific cut‐off points were calculated by summing the frequencies of the relevant strata. Data were recorded in a predesigned Excel spreadsheet (Microsoft, Redmond, WA, USA).
Quantitative synthesis of the selected studies was performed if at least two studies with sufficient consistency for the pooled analysis were available. The primary analysis concerned the estimation of the effect of endometrial thickness on reproductive outcome, stratified by as many cut‐off values as were reported by the selected studies, by means of odds ratios (OR) and risk differences, with 95% CIs. To obtain these estimates, a fixed‐effects or random‐effects meta‐analysis model was applied, depending on the clinical and statistical heterogeneity of the studies. The association between the estimated risk difference and the endometrial thickness cut‐off value, which was assumed to be a potential source of heterogeneity, was analyzed by linear meta‐regression. The secondary analysis comprised a meta‐analysis of proportions based on the results of all the studies that provided adequate data. The effects were analyzed by estimating the pooled proportion of each outcome for each 2‐mm interval of endometrial thickness and by pairwise comparison of each interval with a reference category (≥ 6 to < 8 mm). The association between the estimated proportion and endometrial thickness was evaluated by linear meta‐regression.
The primary and secondary analyses were carried out separately for fresh and frozen–thawed ET. Statistical heterogeneity of the pooled analyses was estimated using Cochran's Q test and the I 2 statistic. The Q statistic was considered statistically significant if P < 0.05. I 2 was graded according to the criteria of Higgins and Thompson 14 ; values above 50% were considered to represent high heterogeneity.
The following sensitivity analyses were conducted: (1) including only cohort studies scoring ≥ 7 on the NOS assessment and rated as good quality according to AHRQ criteria, to consider the effect of study design and quality; (2) excluding studies that analyzed artificial ET cycles but included a minority subset of natural or modified–natural cycles without reporting the results separately and (3) excluding studies that considered endometrial thickness or pattern as a criterion for ET cancellation. The relevance of the sensitivity analyses was interpreted by considering the variation of the summary effect measures compared with the overall analysis, as well as heterogeneity estimators.
Risk‐of‐bias assessment across studies
Reporting bias and small‐size study effects were evaluated by visual assessment of the asymmetry of funnel plots for each outcome. Egger's test was used where necessary.
Certainty assessment
Grading of Recommendations, Assessment, Development and Evaluation (GRADE) criteria were applied to rate the quality of the evidence supporting the estimates for each outcome 15 . The baseline confidence rating was adjusted after considering the risk of bias, inconsistency, indirectness, imprecision, publication bias, effect size, dose–response gradient and potential effects of confounding factors. The confidence ratings of the pooled results are presented for each outcome and each comparison.
RESULTS
A total of 579 distinct references were identified during the initial search of databases and registers and subsequent cross‐reference searches, of which 225 were evaluated for their eligibility in full‐text format and 69 were included in the quantitative synthesis 16 , 17 , 18 , 19 , 20 , 21 , 22 , 23 , 24 , 25 , 26 , 27 , 28 , 29 , 30 , 31 , 32 , 33 , 34 , 35 , 36 , 37 , 38 , 39 , 40 , 41 , 42 , 43 , 44 , 45 , 46 , 47 , 48 , 49 , 50 , 51 , 52 , 53 , 54 , 55 , 56 , 57 , 58 , 59 , 60 , 61 , 62 , 63 , 64 , 65 , 66 , 67 , 68 , 69 , 70 , 71 , 72 , 73 , 74 , 75 , 76 , 77 , 78 , 79 , 80 , 81 , 82 , 83 , 84 (Figure 1). The study characteristics are described in Appendix S2. Twenty‐three were cohort studies, of which three were prospective 16 , 17 , 18 and 20 were retrospective 19 , 20 , 21 , 22 , 23 , 24 , 25 , 26 , 27 , 28 , 29 , 30 , 31 , 32 , 33 , 34 , 35 , 36 , 37 , 83 . The remaining 45 were descriptive studies 38 , 39 , 40 , 41 , 42 , 43 , 44 , 45 , 46 , 47 , 48 , 49 , 50 , 51 , 52 , 53 , 54 , 55 , 56 , 57 , 58 , 59 , 60 , 61 , 62 , 63 , 64 , 65 , 66 , 67 , 68 , 69 , 70 , 71 , 72 , 73 , 74 , 75 , 76 , 77 , 78 , 79 , 80 , 81 , 82 , 84 . Appendix S2 also summarizes the excluded studies and the reason for exclusion, as well as the assessment of quality and risk of bias in the included studies. Of the included studies, approximately 10% were rated as low quality (2/22 cohort studies and 5/45 descriptive studies), mainly because of the lack of comparability between the exposed and unexposed groups in the case of cohort studies and the lack of control for potentially relevant confounders in the case of descriptive studies. The results of individual included studies are presented in forest plots in Appendix S3.
Figure 1.
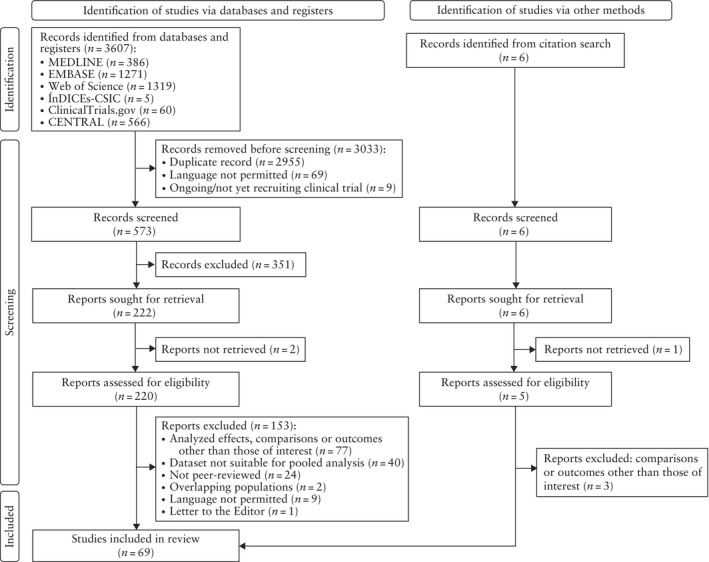
Flowchart summarizing study selection process. CENTRAL, Cochrane Central Register of Controlled Trials.
Quantitative synthesis
Fresh embryo transfer cycles
Live birth
The analysis included 22 studies that were scored predominantly as being of good or fair quality 18 , 21 , 26 , 27 , 28 , 29 , 32 , 34 , 35 , 36 , 37 , 42 , 50 , 60 , 61 , 62 , 65 , 67 , 70 , 73 , 75 , 79 . Table 1 provides a summary of the estimated effects of endometrial thickness cut‐offs between 4 and 18 mm. Estimates based on a random‐effects model, identified a significant association between a thicker endometrial lining and an increased live‐birth rate following fresh ET for all cut‐off values between ≥ 5 mm (OR, 5.66 (95% CI, 1.10–28.98)) and ≥ 15 mm (OR, 1.49 (95% CI, 1.26–1.77)), with a significant linear decrease in effect size as the cut‐off increased (y = − 0.0151x + 0.257; P < 0.0001; R 2 = 61.5%) (Appendix S4). Figure 2a shows the meta‐regression of effect size (expressed as risk differences) by endometrial thickness cut‐off.
Table 1.
Effect of endometrial thickness (stratified by cut‐offs) on live‐birth rate following fresh or frozen–thawed embryo transfer (ET)
| Fresh ET | Frozen–thawed ET | |||||||||
|---|---|---|---|---|---|---|---|---|---|---|
| Live births per ET* | Live births per ET* | |||||||||
| Endometrial thickness cut‐off | Studies (n) | ≥ Cut‐off | < Cut‐off | OR (95% CI) | I 2 (%) | Studies (n) | ≥ Cut‐off | < Cut‐off | OR (95% CI) | I 2 (%) |
| 4 mm | 1 | 7133/21888 (32.6) | 0/26 (0) | 25.62 (1.56–420.50) | — | 1 | 5325/18919 (28.1) | 0/23 (0) | 18.41 (1.12–303.17) | — |
| 5 mm | 4 | 11 203/33997 (33.0) | 9/118 (7.6) | 5.66 (1.10–28.98) | 55† | 2 | 5413/19172 (28.2) | 7/57 (12.3) | 2.65 (1.23–5.72) | 0 |
| 6 mm | 10 | 45 134/130052 (34.7) | 226/1516 (14.9) | 2.36 (1.79–3.12) | 57† | 6 | 22 233/74265 (29.9) | 100/577 (17.3) | 1.89 (1.22–2.92) | 55 |
| 7 mm | 16 | 54 482/149830 (36.4) | 1229/5765 (21.3) | 1.90 (1.61–2.23) | 75† | 5 | 21 595/72107 (29.9) | 456/2091 (21.8) | 1.52 (1.27–1.81) | 35 |
| 8 mm | 13 | 43 719/119647 (36.5) | 4012/15561 (25.8) | 1.61 (1.34–1.93) | 91† | 8 | 20 609/68887 (29.9) | 3381/12252 (27.6) | 1.17 (1.10–1.24) | 13 |
| 9 mm | 11 | 19 970/49072 (40.7) | 3881/15137 (25.6) | 1.51 (1.44–1.58) | 0 | 5 | 721/2294 (31.4) | 1111/3628 (30.6) | 0.93 (0.68–1.27) | 77† |
| 10 mm | 10 | 33 955/84956 (40.0) | 16 852/54584 (30.9) | 1.47 (1.24–1.75) | 97† | 5 | 6532/21007 (31.1) | 10 654/34893 (30.5) | 1.06 (1.03–1.11) | 0 |
| 11 mm | 9 | 16 078/38313 (42.0) | 11 890/32570 (36.5) | 1.35 (1.07–1.72) | 96† | 3 | 105/211 (49.8) | 855/1668 (51.3) | 1.13 (0.84–1.53) | 0 |
| 12 mm | 8 | 11 256/26649 (42.2) | 24 328/74906 (32.5) | 1.32 (1.13–1.53) | 87† | 4 | 2191/7122 (30.8) | 14 539/48134 (30.2) | 1.05 (1.00–1.11) | 0 |
| 13 mm | 7 | 7433/13775 (54.0) | 20 457/51431 (39.8) | 1.44 (1.21–1.72) | 88† | 2 | 23/49 (46.9) | 916/1750 (52.3) | 0.87 (0.43–1.76) | 19 |
| 14 mm | 6 | 4173/9373 (44.5) | 30 629/88019 (34.8) | 1.28 (1.04–1.57) | 81† | 4 | 661/2177 (30.4) | 16 984/55996 (30.3) | 1.02 (0.93–1.13) | 0 |
| 15 mm | 8 | 3278/6617 (49.5) | 28 933/71538 (40.4) | 1.49 (1.26–1.77) | 78† | 1 | 0/2 (0) | 95/285 (32.3) | 0.40 (0.02–8.39) | — |
| 16 mm | 2 | 158/499 (31.7) | 15 699/53151 (29.5) | 1.10 (0.91–1.33) | 0 | 2 | 155/490 (31.6) | 15 710/53174 (29.5) | 1.11 (0.91–1.34) | 0 |
| 17 mm | 3 | 86/475 (18.1) | 8204/21259 (38.6) | 0.56 (0.14–2.15) | 92† | 1 | 0/0 (0) | 95/287 (33.1) | NE | — |
| 18 mm | 1 | 42/136 (30.9) | 15 728/53241 (29.5) | 1.07 (0.74–1.53) | — | 1 | 42/136 (30.9) | 15 728/53241 (29.5) | 1.07 (0.74–1.53) | — |
Data are given as n/N (%), unless stated otherwise.
Cochran's Q test P‐value < 0.05.
NE, not estimable; OR, odds ratio.
Figure 2.

Estimated effect of endometrial thickness (stratified by cut‐offs) on live‐birth rate: linear meta‐regression based on a random‐effects model for fresh (a) and frozen–thawed (b) embryo transfer. Line indicates linear prediction and shading represents 95% CI. Individual studies are denoted by circles, where the diameter is proportional to the weight of the study in the meta‐analysis estimate.
In the sensitivity analysis including only cohort studies with a NOS score ≥ 7 and rated as good quality according to AHRQ standards, the size of the estimated effects did not change significantly (Appendix S5). Exclusion of studies in which ET was cancelled based on endometrial thickness or pattern did not reveal relevant changes in global estimates (Appendix S5).
Meta‐analysis of proportions revealed significant differences in the estimated live‐birth rate when the reference group (≥ 6 to < 8 mm) (0.26 (95% CI, 0.22–0.30); I 2 = 94.3%) was compared to the groups with endometrial thickness of ≥ 4 to < 6 mm (0.17 (95% CI, 0.14–0.20); I 2 = 0%), ≥ 10 to < 12 mm (0.35 (95% CI, 0.28–0.42); I 2 = 99.2%), ≥ 12 to < 14 mm (0.43 (95% CI, 0.33–0.53); I 2 = 99.5%) and ≥ 14 to < 16 mm (0.39 (95% CI, 0.27–0.51); I 2 = 99.2%) (Appendix S6). Linear meta‐regression detected a significant positive correlation between live‐birth rate and endometrial thickness.
Clinical pregnancy
The quantitative synthesis for clinical pregnancy included 51 studies 16 , 17 , 18 , 19 , 20 , 21 , 22 , 25 , 26 , 28 , 29 33 , 34 , 35 , 36 , 37 , 38 , 39 , 40 , 41 , 42 , 43 , 45 , 46 , 47 , 48 , 49 , 50 , 51 , 52 , 54 , 55 , 56 , 57 , 58 , 60 , 61 , 63 , 64 , 65 , 66 , 68 , 69 , 70 , 71 , 74 , 75 , 79 , 81 , 83 , 84 analyzing the effect of endometrial thickness dichotomized by cut‐offs between 4 and 23 mm. The studies were pooled using a random‐effects model. Women with a thicker endometrium had a significantly higher rate of clinical pregnancy following fresh ET for cut‐off values ranging from ≥ 5 mm (OR, 11.02 (95% CI, 2.23–54.46); I 2 = 13%) to ≥ 17 mm (OR, 1.44 (95% CI, 1.01–2.06); I 2 = 0%) (Appendix S4). Within this range of cut‐off values, the effect size was associated linearly and inversely with the cut‐off used to categorize endometrial thickness (y = − 0.0195x + 0.323; P < 0.0001; R 2 = 71%) (Appendix S4). Sensitivity analyses including only good‐quality cohort studies and excluding studies that considered endometrial thickness or pattern as a criterion for ET cancellation did not show any relevant changes in estimated effects (Appendix S5). Meta‐analysis of proportions estimated a clinical pregnancy rate of 0.32 (95% CI, 0.26–0.37; I 2 = 97.7%) for fresh ET cycles with endometrial thickness of ≥ 6 to < 8 mm (Appendix S6). This was significantly lower compared with estimates for ≥ 10 to < 12 mm (0.44 (95% CI, 0.38–0.50); I 2 = 98.4%), ≥ 12 to < 14 mm (0.49 (95% CI, 0.42–0.56); I 2 = 98.2%) and ≥ 16 to < 18 mm (0.47 (95% CI, 0.38–0.56); I 2 = 48.8%). Nevertheless, meta‐regression did not reveal a significant linear correlation (Appendix S6).
Embryo implantation
Six descriptive studies 50 , 56 , 57 , 60 , 65 , 68 , all of which were rated as high quality using the JBI tool, reported on embryo implantation. Random‐effects meta‐analysis found a significant association between increased endometrial thickness and a higher implantation rate following fresh ET for all cut‐off values between 6 and 16 mm, with the exception of 12 mm and 15 mm (Appendix S4). The size of this effect decreased progressively from ≥ 6 mm (OR, 3.72 (95% CI, 2.04–6.76); I 2 = 0%) to ≥ 14 mm (OR, 1.21 (95% CI, 1.10–1.33); I 2 = 0%). The meta‐regression identified a significant linear correlation between the endometrial thickness cut‐off and the implantation rate (y = − 0.0171x + 0.300; P < 0.0001; R 2 = 28.6%) (Appendix S4). Sensitivity analysis for cohort study quality was not feasible, because all of the studies included in this meta‐analysis were descriptive. The sensitivity analysis excluding studies in which ET was canceled because of endometrial thickness or pattern did not show substantial changes in the overall estimates (Appendix S5).
The meta‐analysis of proportions was based on two studies 50 , 57 , and each of the estimates was based on data from a single study. The estimated rate of embryo implantation following fresh ET for the reference category was 0.17 (95% CI, 0.13–0.21). All pairwise comparisons with the other categories revealed significant differences (Appendix S6). There was a linear significant increase in the rate of embryo implantation as endometrial thickness increased (y = 0.032x − 0.004; P < 0.0001; R 2 = 82.0%).
Miscarriage
The random‐effects meta‐analysis, based on the results of 22 observational studies 18 , 21 , 25 , 26 , 27 , 28 , 29 , 34 , 36 , 37 , 38 , 45 , 50 , 52 , 60 , 61 , 62 , 65 , 68 , 70 , 73 , 75 , demonstrated that increased endometrial thickness was associated significantly with lower miscarriage rate following fresh ET for cut‐off values between ≥ 6 mm (OR, 0.57 (95% CI, 0.39–0.81); I 2 = 0%) and ≥ 10 mm (OR, 0.63 (95% CI, 0.41–0.98); I 2 = 96%) (Appendix S4). Above ≥ 10 mm, significant differences were detected upon stratifying by some cut‐off values (≥ 12, ≥ 14 and ≥ 15 mm) but not by others (≥ 11, ≥ 13, ≥ 16 and ≥ 17 mm). The meta‐regression between the size effect and the endometrial thickness cut‐off revealed a significant linear correlation (y = 0.0138x − 0.205; P < 0.05; R 2 = 19.1%) (Appendix S4). Sensitivity analyses that included only good‐quality cohort studies and excluded studies that cancelled ET cycles based on endometrial thickness or pattern yielded similar results (Appendix S5). Although meta‐regression detected a linear correlation, meta‐analysis of proportions revealed no significant differences in miscarriage rate between the reference category of endometrial thickness and thinner or thicker ranges (Appendix S6).
Ectopic pregnancy
The random‐effects meta‐analysis of seven studies 26 , 29 , 34 , 37 , 38 , 61 , 82 identified significant differences in the rate of ectopic pregnancy for four cut‐off values (≥ 8, ≥ 10, ≥ 12 and 15 mm) (Appendix S4). The linear meta‐regression was not significant (y = − 0.0001x − 0.130; P > 0.05; R 2 = 0) (Appendix S4). In the sensitivity analysis including only good‐quality cohort studies, only the estimated difference at the 15‐mm cut‐off remained significant (Appendix S5). The sensitivity analysis excluding studies in which the endometrial thickness or pattern was applied as a criterion for ET cancellation estimated a significant reduction in the rate of ectopic pregnancy at several cut‐offs, without a recognizable linear pattern (Appendix S5). Meta‐analysis of proportions, based on two studies 37 , 82 , did not detect significant differences in estimates between the reference category and other categories of endometrial thickness (Appendix S6).
Frozen–thawed embryo transfer cycles
Live birth
The random‐effects meta‐analysis, which included nine studies 18 , 23 , 28 , 30 , 35 , 37 , 59 , 73 , 78 , found an association between increased live‐birth rate in frozen–thawed ET cycles and greater endometrial thickness for cut‐offs between ≥ 5 mm (OR, 2.65 (95% CI, 1.23–5.72); I 2 = 0%) and ≥ 8 mm (OR, 1.17 (95% CI, 1.10–1.24); I 2 = 13%), and additionally for ≥ 10 mm (OR, 1.06 (95% CI, 1.03–1.11); I 2 = 0%) (Table 1). The changes in effect size per cut‐off point, expressed by risk difference, were linearly adjusted (y = − 0.0281x + 0.301; P < 0.0001; R 2 = 73.8%) (Figure 2b, Appendix S4). A sensitivity analysis including only good‐quality cohort studies revealed significant differences for only the ≥ 6, ≥ 7, ≥ 8 and ≥ 10 mm cut‐offs (Appendix S5). After excluding data from three studies that analyzed a limited number of endometrial preparations other than standard artificial cycles 30 , 37 , 59 , the estimates of effect size and direction did not change significantly (Appendix S5). Finally, the sensitivity analysis considering only studies that did not cancel ET cycles based on endometrial thickness or pattern identified significant differences in the live‐birth rate for five cut‐offs (≥ 5, ≥ 6, ≥ 7, ≥ 8 and ≥ 10 mm) (Appendix S5). Meta‐analysis of proportions did not reveal significant differences when the reference category of endometrial thickness was compared with thicker or thinner categories (Appendix S6). The value of the coefficient of determination (R 2) for the meta‐regression was 0%.
Clinical pregnancy
The meta‐analysis on clinical pregnancy rate included 12 studies that analyzed the effect of endometrial thickness in the range of 4–18 mm 18 , 23 , 24 , 28 , 30 , 35 , 37 , 53 , 59 , 72 , 76 , 78 . Estimates indicated that frozen‐thawed ET cycles performed with endometrial thickness above the cut‐off, in the range of 6–8 mm, had a significantly higher rate of clinical pregnancy, but that the magnitude of this effect decreased progressively as the cut‐off value increased (≥ 6 mm: OR, 1.82 (95% CI, 1.41–2.36), I 2 = 23%; ≥ 8 mm: OR, 1.19 (95% CI, 1.10–1.28), I 2 = 36%) (Appendix S4). Significant differences in the clinical pregnancy rate were also determined at ≥ 10, ≥ 12 and ≥ 14 mm cut‐offs. The effects of endometrial thickness on the clinical pregnancy risk difference were linearly adjusted (y = − 0.0148x + 0.217; P < 0.05; R 2 = 69.2%) (Appendix S4). Sensitivity analysis including only good‐quality cohort studies estimated significant differences in the frequency of clinical pregnancy at lower cut‐off points (≥ 6, ≥ 7, ≥ 8, ≥ 10 and ≥ 12 mm) (Appendix S5). The sensitivity analysis excluding studies that considered some natural or modified–natural cycles 30 , 37 , 59 , 76 provided similar results (Appendix S5). The sensitivity analysis excluding studies that cancelled ET based on endometrial thickness or pattern showed that a thicker endometrium was favored at several cut‐offs (≥ 6, ≥ 7, ≥ 8, ≥ 9, ≥ 10 and ≥ 12 mm) (Appendix S5). The clinical pregnancy rate following frozen–thawed ET for each considered 2‐mm interval of endometrial thickness, estimated by meta‐analysis of proportions, did not differ significantly from that of the reference category (Appendix S6).
Embryo implantation
Estimates for embryo implantation could not be determined because of a lack of data that could be aggregated for a pooled analysis for more than one cut‐off value (Appendix S4). Sensitivity analysis was not feasible for the same reason (Appendix S5).
Miscarriage
A random‐effects meta‐analysis based on data from seven studies 18 , 28 , 30 , 37 , 59 , 73 , 80 revealed a significant difference in the risk of miscarriage following frozen–thawed ET only for the ≥ 6 mm cut‐off (OR, 0.54 (95% CI, 0.29–0.99); I 2 = 0%) (Appendix S4). This was also true for the sensitivity analysis excluding studies that cancelled ET based on a thin endometrium or unfavorable endometrial pattern (Appendix S5). However, meta‐regression analysis identified a significant linear correlation between endometrial thickness cut‐off and miscarriage rate (y = 0.051x − 0.485; P < 0.0005), albeit with a 0% coefficient of determination (Appendix S4). The estimated miscarriage rate in the meta‐analysis of proportions did differ significantly between the reference category and any other category (Appendix S6).
Ectopic pregnancy
Data on the effects of endometrial thickness on ectopic pregnancy rate were derived from five studies 31 , 37 , 59 , 77 , 80 . Aggregate estimates, based on a random‐effects model, showed a decreased rate of ectopic pregnancy following frozen–thawed ET in cycles with endometrial thickness at or above the threshold for four of the five cut‐off values analyzed (≥ 8, ≥ 10, ≥ 12 and ≥ 14 mm) (Appendix S4). The linear meta‐regression did not indicate a statistically significant correlation between endometrial thickness cut‐off and the magnitude of impact on the rate of ectopic pregnancy (y = − 0.0005x − 0.014; P > 0.05; R 2 = 4.5%) (Appendix S4). The quality‐based sensitivity analysis included data from only two good‐quality cohort studies 31 , 37 , and found a significantly higher rate of ectopic pregnancy in cycles performed in women with a thinner endometrium for the 8‐mm cut‐off (Appendix S5). All overall estimates were derived from studies that included some non‐artificial cycles, so their exclusion for the purpose of sensitivity analysis rendered it impossible to obtain estimates for any cut‐off values (Appendix S5). Sensitivity analysis excluding studies in which ET was canceled because of endometrial thickness or pattern did not show any relevant changes compared with the overall analysis (Appendix S5). The meta‐analysis of proportions was based on two studies 37 , 77 and did not detect significant differences between the reference category and any other category (Appendix S6).
Risk of bias across studies
Funnel plots in Appendix S7 illustrate reporting bias and the potential impact of small‐study effects for each comparison included in the main analysis. This evaluation was complemented by Egger's test (Appendix S7). It was determined that reporting bias might affect some of the cut‐off‐based analysis of fresh ET cycles for live birth and clinical pregnancy, and that of frozen ET cycles for miscarriage.
Certainty of evidence
Appendix S8 summarizes the quality of evidence and certainty of the estimated effects according to GRADE criteria. Certainty of evidence was rated as very low in 70% of assessments, both for the primary outcome and the analysis as a whole.
DISCUSSION
Several previous meta‐analyses have evaluated the relationship between endometrial thickness and the outcome of ET 5 , 6 , 7 , 8 , 9 , 85 : six focused on fresh ET cycles, analyzing endometrial thickness cut‐offs at the time of triggering 5 , 6 , 7 , 8 , 9 , 85 , and two of these also analyzed the effect of endometrial thickness measured on the day of exogenous progesterone initiation in frozen–thawed ET cycles 7 , 85 . The studies of Momeni et al. 5 and Wu et al. 9 compared mean endometrial thickness between cycles with and those without subsequent pregnancy. Furthermore, Kasius et al. 6 and Craciunas et al. 7 assessed the discriminative ability of endometrial thickness using the area under the receiver‐operating‐characteristics curve, sensitivity, specificity, predictive values and likelihood ratios.
Regarding fresh ET cycles, our study analyzed live birth as the primary outcome, whereas previous meta‐analyses by Kasius et al. 6 and Gao et al. 85 combined live birth with ongoing pregnancy as a composite outcome. Liao et al. 8 analyzed separately the live‐birth rate using two strata (< 7 mm vs > 7 mm and > 14 mm vs 7–14 mm). Our study found a significant linear association between greater endometrial thickness and increased live‐birth rate across a wide range of cut‐off values (5–15 mm), which is consistent with the findings of Gao et al. 85 and Liao et al. 8 , but contrasts with those of Kasius et al. 6 , albeit with limited comparability between the studies. In our study, the meta‐analysis of proportions aligns with the cut‐off‐based analysis, which reinforces the reliability of our findings because the meta‐analysis of proportions is not affected by the cumulative effect that could bias the cut‐off‐based approach. According to our estimates of risk difference, the harmful effect of performing ET with an endometrial thickness < 7 mm decreases by half when it is performed with an endometrial thickness < 12 mm.
Clinical pregnancy is the outcome that has been analyzed most widely by previous studies, which have reported consistently a detrimental effect of a thinner endometrium, in terms of both mean comparisons 5 , 9 and cut‐off‐based analysis 6 , 7 , 8 , 85 . The studies of Kasius et al. 6 and Craciunas et al. 7 reported lower rates of clinical pregnancy for a thinner endometrium, with a gradual decline in effectiveness as cut‐off values increased 6 , 7 , a pattern also reflected in our analysis. In the present study, meta‐analysis of proportions revealed a lower clinical pregnancy rate in the reference category compared with categories of greater endometrial thickness. Estimations of risk difference suggested a relevant decrease in clinical pregnancy rate when fresh ET cycles with endometrial thickness < 7 mm were compared with those with < 12 mm. Implantation rates followed a similar trend.
The miscarriage rate was associated inversely with endometrial thickness, as reported in the literature 8 , 85 . Our study, which expanded the range of cut‐off values compared with previous analyses, found significant differences between exposed and non‐exposed cycles at several cut‐offs in a discontinuous pattern. However, meta‐analysis of proportions did not identify significant differences between the reference category and any other category, possibly because of the small number of included studies. No significant effects on ectopic pregnancy were identified by meta‐analysis of proportions, although even fewer primary studies were available for this outcome.
Regarding frozen–thawed ET cycles, we found an association between live‐birth rate and endometrial thickness in line with the findings of Gao et al. 85 , although these authors analyzed the composite variable of live birth plus ongoing pregnancy. A similar concordance was observed in the analysis of clinical pregnancy 85 . For both outcomes, our analysis indicated a significantly lower respective rate in ET cycles with a thinner endometrium across multiple cut‐off values. However, these associations were not continuous, and meta‐analysis of proportions did not detect significant differences between the reference category of endometrial thickness and any other category. A significant association between endometrial thickness and miscarriage rate was found only for the ≥ 6‐mm cut‐off, although the 95% CI nearly includes 1. Although meta‐regression of the cut‐off‐based analysis showed a significant linear trend of decreasing miscarriage risk with increasing endometrial thickness threshold, this was not supported by the meta‐analysis of proportions. For ectopic pregnancy, the risk was lower with a thicker endometrium at cut‐offs of ≥ 8, ≥ 10, ≥ 12 and ≥ 14 mm, but neither the linear trend nor the meta‐analysis of proportions was significant.
We acknowledge several limitations to our meta‐analysis, notably the non‐randomized nature of most studies, the predominance of descriptive over analytical study designs and the preponderance of retrospective over prospective study types. According to Mathyk et al. 10 , clinical heterogeneity affecting included studies derives from differences in sample size, cut‐off values, study design, control of confounders and potential selection bias. Our study controlled for some sources of heterogeneity, such as the type of treatment (fresh ET vs frozen–thawed ET) and the day of measurement of endometrial thickness, which was an inclusion criterion. Furthermore, no studies reported on the accuracy of ultrasound measurement, which is a potential source of bias.
The quantitative synthesis included mainly studies rated as being of good or fair quality; sensitivity analyses focused on the quality rating did not reveal substantial changes in results. Some estimates, especially those related to extreme categories of endometrial thickness, were derived from a small number of studies, limiting the generalizability and accuracy of the analyses. In addition, seven studies included natural or modified–natural ET cycles without reporting the results separately. This limitation was addressed by a specific sensitivity analysis when feasible. The evidence supporting these findings was rated as very low in certainty, due mainly to risk of bias and imprecision.
Other limitations of our study include language restrictions and changes in clinical procedures over time. Sensitivity analyses regarding study quality, type of frozen–thawed ET cycle and cancellation of ET cycles based on endometrial thickness or pattern did not reveal relevant changes in the estimates, although these potential confounding effects cannot be excluded completely. Adjustments were made to ensure consistency across studies and to make it possible to perform the pooled analysis, and substantial statistical heterogeneity required the use of random‐effects models. The coefficient of determination of some meta‐regressions was low, which may limit the accuracy or even the reliability of some inferences. The heterogeneity of the interval limits and cut‐off values of the primary studies precluded the inclusion of some studies in the meta‐analysis of proportions, which had to be constructed for 2‐mm intervals of endometrial thickness to obtain more accurate estimates. The reference category of ≥ 6 to < 8 mm was chosen because it includes 7 mm, the most commonly accepted prognostic cut‐off for ET, assuming a variability of around ± 1 mm in the transvaginal ultrasound measurement of endometrial thickness 2 . We deliberately did not evaluate the discriminative ability of ET, as no critical cut‐offs were identified in the literature for clinical decision‐making. Obstetric and perinatal outcomes were also excluded from this analysis.
Our results support the association of endometrial thickness on the day of triggering in fresh ET cycles with the rates of live birth, clinical pregnancy, embryo implantation and miscarriage. For frozen–thawed ET cycles, endometrial thickness on the first day of exogenous progesterone supplementation showed a positive linear correlation with the rates of live birth and clinical pregnancy and a negative correlation with miscarriage rate. Furthermore, an inverse association between endometrial thickness and the rate of ectopic pregnancy was identified in frozen–thawed ET cycles, although correlation analysis was not in accordance. Nevertheless, the rating of certainty supporting these findings was mostly low, and moderate in a few analyses. Therefore, recommendations should be stated as ‘weak in favor’ of considering endometrial thickness as a prognostic factor for these outcomes, according to the GRADE system. The risk difference estimates provide a practical approach for decision‐making in ET scheduling, suggesting that a threshold of 12 mm (or 9 mm for frozen–thawed cycles) reduces the adverse impact of ‘thin endometrium’ on reproductive outcomes by half. These findings align with the meta‐analyses of proportions.
In conclusion, our results do not support a minimum critical endometrial thickness below which ET should be avoided, but rather suggest a gradient of effectiveness. Given the low or very low certainty of the evidence supporting these findings, further well‐designed and adequately powered randomized controlled trials are warranted to better assess the effects of endometrial thickness intervals on the outcome of ET.
Supporting information
Appendix S1 Search strategy and results
Appendix S2 Selection and quality assessment of studies
Appendix S3 Results of individual studies
Appendix S4 Main analysis of secondary outcomes
Appendix S5 Sensitivity analyses
Appendix S6 Meta‐analysis of proportions
Appendix S7 Assessment of reporting bias
Appendix S8 GRADE assessment of certainty of evidence
ACKNOWLEDGMENT
We thank Prof. Matorras, from the Basque Country University, Bilbao, Spain, for his helpful suggestions on the complementary analyses.
F.P.‐M. and M.C.‐C. contributed equally to this study.
DATA AVAILABILITY STATEMENT
The data that supports the findings of this study are available in the supplementary material of this article.
REFERENCES
- 1. Delisle MF, Villeneuve M, Boulvain M. Measurement of endometrial thickness with transvaginal ultrasonography: is it reproducible? J Ultrasound Med. 1998;17(8):481‐484. [DOI] [PubMed] [Google Scholar]
- 2. De Geyter C, Schmitter M, De Geyter M, Nieschlag E, Holzgreve W, Schneider HPG. Prospective evaluation of the ultrasound appearance of the endometrium in a cohort of 1,186 infertile women. Fertil Steril. 2000;73(1):106‐113. [DOI] [PubMed] [Google Scholar]
- 3. Friedler S, Schenker JG, Herman A, Lewin A. The role of ultrasonography in the evaluation of endometrial receptivity following assisted reproductive treatments: a critical review. Hum Reprod Update. 1996;2(4):323‐335. [DOI] [PubMed] [Google Scholar]
- 4. Ata B, Mathyk B, Telek S, Kalafat E. Walking on thin endometrium. Curr Opin Obstet Gynecol. 2024;36(3):186‐191. [DOI] [PubMed] [Google Scholar]
- 5. Momeni M, Rahbar MH, Kovanci E. A meta‐analysis of the relationship between endometrial thickness and outcome of in vitro fertilization cycles. J Hum Reprod Sci. 2011;4(3):130‐137. [DOI] [PMC free article] [PubMed] [Google Scholar]
- 6. Kasius A, Smit JG, Torrance HL, et al. Endometrial thickness and pregnancy rates after IVF: a systematic review and meta‐analysis. Hum Reprod Update. 2014;20(4):530‐541. [DOI] [PubMed] [Google Scholar]
- 7. Craciunas L, Gallos I, Chu J, et al. Conventional and modern markers of endometrial receptivity: a systematic review and meta‐analysis. Hum Reprod Update. 2019;25(2):202‐223. [DOI] [PubMed] [Google Scholar]
- 8. Liao Z, Liu C, Cai L, et al. The effect of endometrial thickness on pregnancy, maternal, and perinatal outcomes of women in fresh cycles after IVF/ICSI: a systematic review and meta‐analysis. Front Endocrinol (Lausanne). 2021;12:814648. [DOI] [PMC free article] [PubMed] [Google Scholar]
- 9. Wu J, Sheng J, Wu X, Wu Q. Ultrasound‐assessed endometrial receptivity measures for the prediction of in vitro fertilization‐embryo transfer clinical pregnancy outcomes: a meta‐analysis and systematic review. Exp Ther Med. 2023;26(3):453. [DOI] [PMC free article] [PubMed] [Google Scholar]
- 10. Mathyk B, Schwartz A, DeCherney A, Ata B. A critical appraisal of studies on endometrial thickness and embryo transfer outcome. Reprod Biomed Online. 2023;47(4):103259. [DOI] [PMC free article] [PubMed] [Google Scholar]
- 11. Zegers‐Hochschild F, Adamson GD, Dyer S, et al. The International glossary on infertility and fertility care, 2017. Fertil Steril. 2017;108(3):393‐406. [DOI] [PubMed] [Google Scholar]
- 12. Wells GA, Shea B, O'Connell D, et al. The Newcastle‐Ottawa Scale (NOS) for assessing the quality of nonrandomised studies in meta‐analyses. Department of Epidemiology and Community Medicine, University of Ottawa. Accessed December 16th 2023, 2023. https://www.ohri.ca/programs/clinical_epidemiology/oxford.asp
- 13. Rostom A, Dubé C, Cranney A, et al. Quality Assessment Forms. Vol. Appendix D. 2004 Sep. 2014. Evidence Reports/Technology assessments .
- 14. Higgins JPT, Thompson SG. Quantifying heterogeneity in a meta‐analysis. Stat Med. 2002;21(11):1539‐1558. [DOI] [PubMed] [Google Scholar]
- 15. Handbook for grading the quality of evidence and the strength of recommendations using the GRADE approach. Updated October 2013. Accessed December 16th, 2023. https://gdt.gradepro.org/app/handbook/handbook.html
- 16. Al‐Mohammady M, Abdel Fattah G, Mahmoud M. The impact of combined endometrial thickness and pattern on the success of intracytoplasmic sperm injection (ICSI) cycles. Middle East Fertil Soc J. 2013;18(3):165‐170. [Google Scholar]
- 17. Rehman R, Fatima SS, Hussain M, Khan R, Khan TA. Effect of endometrial thickness on pregnancy outcome after intracytoplasmic sperm injection. J Pak Med Assoc. 2015;65(5):448‐451. [PubMed] [Google Scholar]
- 18. Deger U, Kali Z, Cagiran F. Endometrial thickness is a good predictor of clinical pregnancy and live birth rates in fresh and frozen‐thawed embryo transfer cycles. Eur Rev Med Pharmacol Sci. 2023;27(13):6351‐6358. [DOI] [PubMed] [Google Scholar]
- 19. Kovacs P, Matyas S, Boda K, Kaali SG. The effect of endometrial thickness on IVF/ICSI outcome. Hum Reprod. 2003;18(11):2337‐2341. [DOI] [PubMed] [Google Scholar]
- 20. Zhang XQ, Chen CH, Confino E, Barnes R, Milad MY, Kazer RR. Increased endometrial thickness is associated with improved treatment outcome for selected patients undergoing in vitro fertilization ‐ embryo transfer. Fertil Steril. 2005;83(2):336‐340. [DOI] [PubMed] [Google Scholar]
- 21. Richter KS, Bugge KR, Bromer JG, Levy MJ. Relationship between endometrial thickness and embryo implantation based on 1,294 cycles of in vitro fertilization with transfer of two blastocyst‐stage embryos. Fertil Steril. 2007;87(1):53‐59. [DOI] [PubMed] [Google Scholar]
- 22. Al‐Ghamdi A, Coskun S, Al‐Hassan S, Al‐Rejjal R, Awartani K. The correlation between endometrial thickness and outcome of in vitro fertilization and embryo transfer (IVF‐ET) outcome. Reprod Biol Endocrinol. 2008;6(5):37. [DOI] [PMC free article] [PubMed] [Google Scholar]
- 23. El‐Toukhy T, Coomarasamy A, Khairy M, et al. The relationship between endometrial thickness and outcome of medicated frozen embryo replacement cycles. Fertil Steril. 2008;89(4):832‐839. [DOI] [PubMed] [Google Scholar]
- 24. Dessolle L, Daraï E, Cornet D, et al. Determinants of pregnancy rate in the donor oocyte model: a multivariate analysis of 450 frozen‐thawed embryo transfers. Hum Reprod. 2009;24(12):3082‐3089. [DOI] [PubMed] [Google Scholar]
- 25. Wu Y, Gao XH, Lu X, et al. Endometrial thickness affects the outcome of in vitro fertilization and embryo transfer in normal responders after GnRH antagonist administration. Reprod Biol Endocrinol. 2014;12(5):96. [DOI] [PMC free article] [PubMed] [Google Scholar]
- 26. Ma NZ, Chen L, Dai W, Bu ZQ, Hu LL, Sun YP. Influence of endometrial thickness on treatment outcomes following in vitro fertilization/intracytoplasmic sperm injection. Reprod Biol Endocrinol. 2017;15(1):5. [DOI] [PMC free article] [PubMed] [Google Scholar]
- 27. Holden EC, Dodge LE, Sneeringer R, Moragianni VA, Penzias AS, Hacker MR. Thicker endometrial linings are associated with better IVF outcomes: a cohort of 6331 women. Hum Fertil (Camb). 2018;21(4):288‐293. [DOI] [PMC free article] [PubMed] [Google Scholar]
- 28. Liu KE, Hartman M, Hartman A, Luo ZC, Mahutte N. The impact of a thin endometrial lining on fresh and frozen‐thaw IVF outcomes: an analysis of over 40 000 embryo transfers. Hum Reprod. 2018;33(10):1883‐1888. [DOI] [PMC free article] [PubMed] [Google Scholar]
- 29. Ribeiro VC, Santos‐Ribeiro S, De Munck N, et al. Should we continue to measure endometrial thickness in modern‐day medicine? The effect on live birth rates and birth weight. Reprod Biomed Online. 2018;36(4):416‐426. [DOI] [PubMed] [Google Scholar]
- 30. Zhang T, Li Z, Ren X, et al. Endometrial thickness as a predictor of the reproductive outcomes in fresh and frozen embryo transfer cycles: a retrospective cohort study of 1512 IVF cycles with morphologically good‐quality blastocyst. Medicine (Baltimore). 2018;97(4):e9689. [DOI] [PMC free article] [PubMed] [Google Scholar]
- 31. Liu H, Zhang J, Wang B, Kuang Y. Effect of endometrial thickness on ectopic pregnancy in frozen embryo transfer cycles: an analysis including 17,244 pregnancy cycles. Fertil Steril. 2020;113(1):131‐139. [DOI] [PubMed] [Google Scholar]
- 32. Lv H, Li X, Du J, et al. Effect of endometrial thickness and embryo quality on live‐birth rate of fresh IVF/ICSI cycles: a retrospective cohort study. Reprod Biol Endocrinol. 2020;18(1):89. [DOI] [PMC free article] [PubMed] [Google Scholar]
- 33. Liao S, Wang R, Hu C, et al. Analysis of endometrial thickness patterns and pregnancy outcomes considering 12,991 fresh IVF cycles. BMC Med Inform Decis Mak. 2021;21(1):176. [DOI] [PMC free article] [PubMed] [Google Scholar]
- 34. Cagli F, Dolanbay M, Gülseren V, Disli Gurler A, Aygen EM. Does endometrial thickness affect pregnancy outcomes in isolated male infertility IVF cycles? A retrospective cohort study. J Obstet Gynaecol. 2022;42(7):3199‐3203. [DOI] [PubMed] [Google Scholar]
- 35. Mahutte N, Hartman M, Meng L, Lanes A, Luo ZC, Liu KE. Optimal endometrial thickness in fresh and frozen‐thaw in vitro fertilization cycles: an analysis of live birth rates from 96,000 autologous embryo transfers. Fertil Steril. 2022;117(4):792‐800. [DOI] [PubMed] [Google Scholar]
- 36. Xu J, Zhang S, Jin L, et al. The effects of endometrial thickness on pregnancy outcomes of fresh ivf/icsi embryo transfer cycles: an analysis of over 40,000 cycles among five reproductive centers in China. Front Endocrinol (Lausanne). 2022;12:12788706. [DOI] [PMC free article] [PubMed] [Google Scholar]
- 37. Kadour Peero E, Feferkorn I, Hadad‐Liven S, Dahan MH. Does it affect the live birth rates to have a maximum endometrial thickness of 7, 8, or 9 mm in in‐vitro fertilization‐embryo transfer cycles? Obstet Gynecol Sci. 2024;67(5):497‐505. [DOI] [PMC free article] [PubMed] [Google Scholar]
- 38. Dickey RP, Olar TT, Curole DN, Taylor SN, Rye PH. Endometrial pattern and thickness associated with pregnancy outcome after assisted reproduction technologies. Hum Reprod. 1992;7(3):418‐421. [DOI] [PubMed] [Google Scholar]
- 39. Noyes N, Liu HC, Sultan K, Schattman G, Rosenwaks Z. Endometrial thickness appears to be a significant factor in embryo implantation in in‐vitro fertilization. Hum Reprod. 1995;10(4):919‐922. [DOI] [PubMed] [Google Scholar]
- 40. Rinaldi L, Lisi F, Floccari A, Lisi R, Pepe G, Fishel S. Endometrial thickness as a predictor of pregnancy after in‐vitro fertilization but not after intracytoplasmic sperm injection. Hum Reprod. 1996;11(7):1538‐1541. [DOI] [PubMed] [Google Scholar]
- 41. Weissman A, Gotlieb L, Casper RF. The detrimental effect of increased endometrial thickness on implantation and pregnancy rates and outcome in an in vitro fertilization program. Fertil Steril. 1999;71(1):147‐149. [DOI] [PubMed] [Google Scholar]
- 42. Noyes N, Hampton BS, Berkeley A, Licciardi F, Grifo J, Krey L. Factors useful in predicting the success of oocyte donation: a 3‐year retrospective analysis. Fertil Steril. 2001;76(1):92‐97. [DOI] [PubMed] [Google Scholar]
- 43. Ayustawati SH, Obara H, et al. Influence of endometrial thickness and pattern on pregnancy rates in in vitro fertilization‐embryo transfer. Reprod Med Biol. 2002;1(1):17‐21. [DOI] [PMC free article] [PubMed] [Google Scholar]
- 44. Basir GS, WS O, WWK S, EHY N, Ho PC. Evaluation of cycle‐to‐cycle variation of endometrial responsiveness using transvaginal sonography in women undergoing assisted reproduction. Ultrasound Obstet Gynecol. 2002;19(5):484‐489. [DOI] [PubMed] [Google Scholar]
- 45. Dietterich C, Check JH, Choe JK, Nazari A, Lurie D. Increased endometrial thickness on the day of human chorionic gonadotropin injection does not adversely affect pregnancy or implantation rates following in vitro fertilization‐embryo transfer. Fertil Steril. 2002;77(4):781‐786. [DOI] [PubMed] [Google Scholar]
- 46. Yaman C, Ebner T, Jesacher K, Sommergruber M, Radner G, Tews G. Die sonographische Endometriumdicke als Prediktionsfaktor für eine Schwangerschaft in einem IVF‐Programm [Sonographic measurement of endometrium thickness as a predictive value for pregnancy through IVF]. Ultraschall Med. 2002;23(4):256‐259. [DOI] [PubMed] [Google Scholar]
- 47. Yoeli R, Ashkenazi J, Orvieto R, Shelef M, Kaplan B, Bar‐Hava I. Significance of increased endometrial thickness in assisted reproduction technology treatments. J Assist Reprod Genet. 2004;21(8):285‐289. [DOI] [PMC free article] [PubMed] [Google Scholar]
- 48. Amir W, Micha B, Ariel H, Liat LG, Jehoshua D, Adrian S. Predicting factors for endometrial thickness during treatment with assisted reproductive technology. Fertil Steril. 2007;87(4):799‐804. [DOI] [PubMed] [Google Scholar]
- 49. Giannaris D, Zourla A, Chrelias C, Loghis C, Kassanos D. Ultrasound assessment of endometrial thickness: correlation with ovarian stimulation and pregnancy rates in IVF cycles. Clin Exp Obstet Gynecol. 2008;35(3):190‐193. [PubMed] [Google Scholar]
- 50. Kumbak B, Erden HF, Tosun S, Akbas H, Ulug U, Bahçeci M. Outcome of assisted reproduction treatment in patients with endometrial thickness less than 7 mm. Reprod Biomed Online. 2009;18(1):79‐84. [DOI] [PubMed] [Google Scholar]
- 51. Okohue JE, Onuh SO, Ebeigbe P, et al. The effect of endometrial thickness on in vitro fertilization (IVF)‐embryo transfer/intracytoplasmic sperm injection (ICSI) outcome. Afr J Reprod Health. 2009;13(1):113‐121. [PubMed] [Google Scholar]
- 52. Chen SL, Wu FR, Luo C, et al. Combined analysis of endometrial thickness and pattern in predicting outcome of in vitro fertilization and embryo transfer: a retrospective cohort study. Reprod Biol Endocrinol. 2010;8:30. [DOI] [PMC free article] [PubMed] [Google Scholar]
- 53. Ashrafi M, Jahangiri N, Hassani F, Akhoond MR, Madani T. The factors affecting the outcome of frozen‐thawed embryo transfer cycle. Taiwan J Obstet Gynecol. 2011;50(2):159‐164. [DOI] [PubMed] [Google Scholar]
- 54. Singh N, Bahadur A, Mittal S, Malhotra N, Bhatt A. Predictive value of endometrial thickness, pattern and sub‐endometrial blood flows on the day of hCG by 2D doppler in in‐vitro fertilization cycles: a prospective clinical study from a tertiary care unit. J Reprod Sci. 2011;4(1):29‐33. [DOI] [PMC free article] [PubMed] [Google Scholar]
- 55. Sharma R, Rao K, Srinivas MS, Jones T. Is endometrial thickness on the day of ET really predictive of IVF outcome? Int J Infertil Fetal Med. 2012;3(2):40‐47. [Google Scholar]
- 56. Aydin T, Kara M, Nurettin T. Relationship between endometrial thickness and in vitro fertilization‐intracytoplasmic sperm injection outcome. Int J Fertil Steril. 2013;7(1):29‐34. [PMC free article] [PubMed] [Google Scholar]
- 57. Zhao J, Zhang Q, Wang YG, Li YP. Endometrial pattern, thickness and growth in predicting pregnancy outcome following 3319 IVF cycle. Reprod Biomed Online. 2014;29(3):291‐298. [DOI] [PubMed] [Google Scholar]
- 58. Abdel‐Kader MA, Abdelmeged A, Mahran A, Abu Samra MF, Bahaa H. The usefulness of endometrial thickness, morphology and vasculature by 2D Doppler ultrasound in prediction of pregnancy in IVF/ICSI cycles. Egypt J Radiol Nucl Med. 2016;47(1):341‐346. [Google Scholar]
- 59. Bu Z, Wang K, Dai W, Sun Y. Endometrial thickness significantly affects clinical pregnancy and live birth rates in frozen‐thawed embryo transfer cycles. Gynecol Endocrinol. 2016;32(7):524‐528. [DOI] [PubMed] [Google Scholar]
- 60. Fang R, Cai LY, Xiong F, Chen J, Yang WM, Zhao X. The effect of endometrial thickness on the day of hCG administration on pregnancy outcome in the first fresh IVF/ICSI cycle. Gynecol Endocrinol. 2016;32(6):473‐476. [DOI] [PubMed] [Google Scholar]
- 61. Yuan X, Saravelos SH, Wang Q, Xu YW, Li TC, Zhou CQ. Endometrial thickness as a predictor of pregnancy outcomes in 10787 fresh IVF‐ICSI cycles. Reprod Biomed Online. 2016;33(2):197‐205. [DOI] [PubMed] [Google Scholar]
- 62. Gallos ID, Khairy M, Chu J, et al. Optimal endometrial thickness to maximize live births and minimize pregnancy losses: analysis of 25,767 fresh embryo transfers. Reprod Biomed Online. 2018;37(5):542‐548. [DOI] [PubMed] [Google Scholar]
- 63. Hussain S, Al‐Murshidi Y, Jasim S. Association of endometrial thickness with pregnancy rate in infertile women undergoing ICSI program. Int J Pharm Res Allied Sci. 2018;7(3):166‐171. [Google Scholar]
- 64. von Wolff M, Fah M, Roumet M, et al. Thin endometrium is also associated with lower clinical pregnancy rate in unstimulated menstrual cycles: a study based on natural cycle IVF. Front Endocrinol (Lausanne). 2018;9:776. [DOI] [PMC free article] [PubMed] [Google Scholar]
- 65. Wang Y, Zhu Y, Sun Y, et al. Ideal embryo transfer position and endometrial thickness in IVF embryo transfer treatment. Int J Gynaecol Obstet. 2018;143(3):282‐288. [DOI] [PubMed] [Google Scholar]
- 66. Eftekhar M, Mehrjardi SZ, Molaei B, Taheri F, Mangoli E. The correlation between endometrial thickness and pregnancy outcomes in fresh ART cycles with different age groups: a retrospective study. Middle East Fertil Soc J. 2019;24(1):1‐6. [Google Scholar]
- 67. Ovayolu A, Gün I, Silfeler DB, Kutlu T. Live birth and endometrial thickness in unexplained infertility. Zeynep Kamil Tip Bulteni. 2019;50(3):142‐145. [Google Scholar]
- 68. Song J, Sun X, Qian K. Endometrial but not ovarian response is associated with clinical outcomes and can be improved by prolonged pituitary downregulation in patients with thin and medium endometrium. Reprod Sci (Thousand Oaks, Calif). 2019;26(11):1409‐1416. [DOI] [PubMed] [Google Scholar]
- 69. Nishihara S, Fukuda J, Ezoe K, et al. Does the endometrial thickness on the day of the trigger affect the pregnancy outcomes after fresh cleaved embryo transfer in the clomiphene citrate‐based minimal stimulation cycle? Reprod Med Biol. 2020;19(2):151‐157. [DOI] [PMC free article] [PubMed] [Google Scholar]
- 70. Simeonov M, Sapir O, Lande Y, et al. The entire range of trigger‐day endometrial thickness in fresh IVF cycles is independently correlated with live birth rate. Reprod Biomed Online. 2020;41(2):239‐247. [DOI] [PubMed] [Google Scholar]
- 71. Tomic V, Kasum M, Vucic K. Impact of embryo quality and endometrial thickness on implantation in natural cycle IVF. Arch Gynecol Obstet. 2020;301(5):1325‐1330. [DOI] [PMC free article] [PubMed] [Google Scholar]
- 72. Jalil A, Malik SS, Sadique I, Omer MA, Ashraf S, Siddique U. Rate of success of pregnancy on the basis of endometrial thickness and endometrial pattern at the time of ultrasound guided embryo transfer. Pak J Med Health Sci. 2021;15(3):642‐645. [Google Scholar]
- 73. Shakerian B, Turkgeldi E, Yildiz S, Keles I, Ata B. Endometrial thickness is not predictive for live birth after embryo transfer, even without a cutoff. Fertil Steril. 2021;116(1):130‐137. [DOI] [PubMed] [Google Scholar]
- 74. Yurci A, Gungor ND, Gurbuz T. High endometrial thickness does not affect IVF/ICSI outcomes. Eur J Ther. 2021;27(1):94‐98. [Google Scholar]
- 75. Zhang J, Sun YF, Xu YM, et al. Effect of endometrium thickness on clinical outcomes in luteal phase short‐acting GnRH‐a long protocol and GnRH‐ant protocol. Front Endocrinol (Lausanne). 2021;12:578783. [DOI] [PMC free article] [PubMed] [Google Scholar]
- 76. Tian H, Zhang H, Qiu H, Yang X, La X, Cui L. Influence of maternal age on the relationship between endometrial thickness and ongoing pregnancy rates in frozen‐thawed embryo transfer cycles: a retrospective analysis of 2,562 cycles. Front Endocrinol (Lausanne). 2022;13:821753. [DOI] [PMC free article] [PubMed] [Google Scholar]
- 77. Zhao Y, Liu D, Liu N, et al. An endometrial thickness < 8 mm was associated with a significantly increased risk of ectopic pregnancy after freeze‐thaw transfer: an analysis of 5,960 pregnancy cycles. Front Endocrinol (Lausanne). 2022;13:884553. [DOI] [PMC free article] [PubMed] [Google Scholar]
- 78. Ata B, Linan A, Kalafat E, et al. Effect of the endometrial thickness on the live birth rate: insights from 959 single euploid frozen embryo transfers without a cutoff for thickness. Fertil Steril. 2023;120(1):91‐98. [DOI] [PubMed] [Google Scholar]
- 79. Nishii S, Ezoe K, Nishihara S, et al. Association between endometrial thickness before ovulation, live birth, and placenta previa rates in clomiphene citrate‐treated cycles. AJOG Glob Rep. 2023;3(1):100161. [DOI] [PMC free article] [PubMed] [Google Scholar]
- 80. Song L, Bu Z, Sun Y. Endometrial thickness and early pregnancy complications after frozen‐thawed embryo transfers. Front Endocrinol (Lausanne). 2023;14:1066922. [DOI] [PMC free article] [PubMed] [Google Scholar]
- 81. Stanziano A, Bianchi FP, Caringella AM, et al. The use of real time strain endometrial elastosonography plus endometrial thickness and vascularization flow index to predict endometrial receptivity in IVF treatments: a pilot study. BMC Med Imaging. 2023;23(1):130. [DOI] [PMC free article] [PubMed] [Google Scholar]
- 82. Zhao Y, Xu A, Liu D, et al. An endometrium of type C along with an endometrial thickness of < 8 mm are risk factors for ectopic pregnancy after stimulated cycles with fresh embryo transfer. BMC Pregnancy Childbirth. 2023;23(1):713. [DOI] [PMC free article] [PubMed] [Google Scholar]
- 83. Chan JM, Sukumar AI, Ramalingam M, Ranbir Singh SS, Abdullah MF. The impact of endometrial thickness (EMT) on the day of human chorionic gonadotropin (hCG) administration on pregnancy outcomes: a 5‐year retrospective cohort analysis in Malaysia. Fertil Res Pract. 2018;4:5. [DOI] [PMC free article] [PubMed] [Google Scholar]
- 84. Jia Y, Qu T, Tan A, Hu S, Maldonado M. IVF pregnancy outcomes are associated with the stage of embryo transfer and endometrial ultrasonographic parameters: a prospective study. J Reprod Med. 2021;66(6):342‐350. [Google Scholar]
- 85. Gao G, Cui X, Li S, Ding P, Zhang S, Zhang Y. Endometrial thickness and IVF cycle outcomes: a meta‐analysis. Reprod Biomed Online. 2020;40(1):124‐133. [DOI] [PubMed] [Google Scholar]
Associated Data
This section collects any data citations, data availability statements, or supplementary materials included in this article.
Supplementary Materials
Appendix S1 Search strategy and results
Appendix S2 Selection and quality assessment of studies
Appendix S3 Results of individual studies
Appendix S4 Main analysis of secondary outcomes
Appendix S5 Sensitivity analyses
Appendix S6 Meta‐analysis of proportions
Appendix S7 Assessment of reporting bias
Appendix S8 GRADE assessment of certainty of evidence
Data Availability Statement
The data that supports the findings of this study are available in the supplementary material of this article.