

Abstract
Traditional lie detection relies on the experience of human interrogators, making it susceptible to subjective factors and leading to misjudgments. To solve this problem, we propose an emotion-enhanced deception detection model, Lie Detection using XGBoost with RoBERTa-based Emotion Features (LieXBerta). In this framework, the Robustly Optimized BERT Pretraining Approach (RoBERTa) is used to extract emotional features from interrogation texts. The emotional features are then combined with facial and action features and subsequently fed into an Extreme Gradient Boosting (XGBoost) classifier for deception detection. This approach aims to improve the objectivity and accuracy of deception detection in courtroom settings. For verifying the proposed algorithm, we develop a trial text dataset enriched with detailed emotional features. Simulation experiments demonstrate that the LieXBerta model incorporating emotional features outperforms baseline models that use only traditional features and several classical machine learning models. The experimental results show that after parameter tuning, the accuracy of the LieXBerta model increased to 87.50%, respectively, marking a 6.5% improvement over the baseline model. Moreover, the runtime of the tuned LieXBerta model with reduced features was reduced by 42%, significantly enhancing the training efficiency and prediction performance for deception detection.
Keywords: Courtroom interrogation, Deception detection, Emotional features, Machine learning, RoBERTa
Subject terms: Engineering, Mathematics and computing
Introduction
Courtroom interrogation is a critical component of legal proceedings. The effectiveness of interrogation is directly related to the fairness of the case and the accuracy of the judgment. Currently, most research utilizes the interrogation records of the individuals being questioned to perform lie detection on them. Traditional lie detection mainly relies on the experience and intuition of human interrogators. This method has certain limitations and is easily influenced by factors such as the interrogator’s personal judgment, emotional fluctuations, and biases, leading to misjudgments. Artificial intelligence technology can systematically analyze large amounts of data to avoid human interference and provide more objective and accurate lie detection results. Moreover, artificial intelligence can process complex multimodal data such as speech, text, and facial expressions, enhancing the accuracy and efficiency of detection1–3. Especially during prolonged interrogations, human interrogators can become fatigued, whereas machines can maintain stable judgment capabilities.
In recent years, large language models (LLMs) such as the Bidirectional Encoder Representations from Transformers (BERT) and the Robustly Optimized BERT Pretraining Approach (RoBERTa), as well as classical machine learning algorithms like Support Vector Machine (SVM), Logistic Regression, K-Nearest Neighbors, and Random Forest, have demonstrated strong performance in the field of deception detection4–6. These methods are gradually emerging as promising technologies for supporting courtroom interrogation processes. Among machine learning models that use linguistic features to detect whether the interrogated person is lying, Linear Regression has been verified to have the highest accuracy, reaching 71.69%4. Dan Barsever et al. successfully improved the classification accuracy on the Ott Deceptive Opinion Text dataset by training a classifier based on BERT5. Mimansa Jaiswal et al.6 proposed a data-driven approach that uses SVM to automatically detect deception in real trial data through visual and linguistic cues.
Hancock et al.7 argue that in high-pressure environments, the speech of interrogated individuals often carries emotions when they engage in deceptive behaviors. Detecting these emotions to identify deceptive behaviors in court can significantly improve the accuracy and efficiency of judgments. However, many studies primarily focus on the facial micro-movement features1,6,8,9, eye movement features1,8, and linguistic features4–6 of the interrogated individuals. There is a lack of trial datasets enriched with emotional features. It is worth noting that in recent years, LLMs have made significant progress in emotion classification tasks, demonstrating superior performance in recognizing complex emotions and capturing subtle emotional nuances2,10–17. To the best of our knowledge, there are no existing research publications that utilize emotional LLMs to enhance the accuracy and efficiency of deception detection during interrogations.
To address these issues, we applied emotional LLMS to obtain emotion classifier. The extracted emotional features were then combined with facial action features and action features as input to fit a machine learning model. Finally we obtain the deception detective model. By comparing the effectiveness of various automated deception detection models through simulation experiments, we propose a deception detection model that achieves the highest accuracy in lie detection. This demonstrating that the emotions of interrogated individuals are beneficial for detecting their deceptive behaviors in court. The main contributions of this paper are as follows:
A real trial dataset enriched with emotional features was constructed. We conducted manual emotional annotation on a Real Trial Dataset, developing a dataset enriched with ten refined emotional features. The large language model RoBERTa will be pre-trained on this dataset and then used to automatically annotate emotions in Real-Life Trial dataset.
An emotion-enhanced deception detection model: Lie Detection using XGBoost with RoBERTa-based Emotion Features (LieXBerta) is proposed in this study. Utilizing large language model Roberta, we extracted emotional feature values from interrogation texts and combined them with existing features before inputting them into XGBoost for deception detection. This approach not only enhances the accuracy of deception detection but also improves its efficiency.
Incorporating emotional features can improves deception detection performance. This study compares models with and without emotional features in terms of accuracy and F1 scores. The results demonstrate that the inclusion of emotional features significantly enhances the performance of machine learning models in deception detection during courtroom interrogations, highlighting the critical role of emotional expressions in identifying deceptive statements.
The structure of this paper is as follows. Section “Related work” reviews existing researches in the field of deception detection and emotion classification using large language models. Section “Dataset description” introduces the related dataset, including emotional features. Section “LieXBerta algorithm” presents the basic principles of the proposed emotion enhanced deception detection algorithm. Section “Experiments” verifies the effectiveness of the algorithm through simulation experiments and analyzes the results in terms of the accuracy, F1 score, efficiency, and the impact of emotional features on performance. Finally, section “Conclusion” concludes the paper and provides directions for future research.
Related work
In the field of deception detection, analyzing the lexical features of text is an important means of identifying lies. Barsever et al.5 used a BERT-based classifier to focus on identifying characteristics of deceptive texts. Their experiments on the Ott Deceptive Opinion Spam Corpus showed that the BERT model outperformed existing methods in deception classification accuracy. Ablation studies indicated that certain parts of the input, such as specific parts of speech, were more informative to the classifier. Further part-of-speech analysis revealed that deceptive texts are more formulaic and exhibit less variation compared to truthful texts. They also utilized a BERT-based Generative Adversarial Network to generate deceptive and truthful text samples, enhancing the understanding of differences between truth and deception. Nguyen et al.4 further contributed to this field by exploring the possibility of using traditional linguistic features combined with LLMs for deception detection in transcribed speech data. The study employed various Natural Language Processing techniques, including feature selection methods, to evaluate the effectiveness of these models. Experimental results on the Real-Life Trial dataset showed that a single-layer Bidirectional Long Short-Term Memory network , fine-tuned using early stopping mechanisms, outperformed other models, achieving an accuracy of 93.57% and an F1 score of 94.48%. This study demonstrates that combining traditional linguistic features with advanced deep learning models can significantly improve the effectiveness of deception detection from textual data.
In terms of facial action features, Demyanov et al.18 proposed a multi-stage automatic system that detects deception by extracting facial cues. They evaluated their system on a collected Mafia game dataset, and the results showed that using the extracted features, the classifier achieved an area under the receiver operating characteristic curve (AUC) of 0.61, which is significantly better than random guessing. Yu et al.19 investigated whether interaction asynchrony is a cue to deception. They proposed a data-driven framework based on visual cues, including facial tracking, head motion detection, facial expression recognition, and interaction synchrony estimation. Experimental results demonstrated that this framework can automatically extract meaningful synchrony features, learn classification models, and effectively distinguish deception from truth. Avola et al.9 proposed an automatic deception detection method using facial Action Units (AUs). AUs were extracted from video frames and classified using Support Vector Machines. Experimental results validated the effectiveness of this method on real courtroom data. Monaro et al.20 compared the performance of human evaluators and machine learning models in deception detection based on facial expressions. They found that using OpenFace to extract features and classifying them with Support Vector Machines, the AUC values reached 0.72 to 0.78, significantly outperforming human evaluators’ accuracy of 57%. The results indicate that artificial intelligence performs better than humans in lie detection tasks, even when humans have more information.
In the research on eye movement features, Nugroho et al.21 utilized pupil dilation and blink frequency to detect lies. They employed circular Hough transform and frame difference methods, combined with fuzzy logic, to design a lie detection system that achieved an accuracy of 84%. George et al.22 analyzed blink frequency and blink duration as indicators for deception detection. They conducted experiments on 50 subjects, and the results showed that when lying, the subjects’ blink duration and frequency both increased.
In research utilizing large language models for emotion classification, Devlin et al.23 proposed BERT, a pre-trained deep bidirectional representation language model widely applied in various natural language processing tasks, including emotion classification. Luo and Wang24 used a pre-trained BERT model and achieved excellent results in the EmotionX-2019 shared task through transfer learning and fine-tuning. Liu et al.25 introduced RoBERTa, an improved version of BERT’s pre-training method, significantly enhancing the model’s overall performance. In multi-label emotion classification tasks, Bölücü b et al.26 further improved classification accuracy by combining RoBERTa with multiple attention mechanisms. Kim and Vossen27 proposed Speaker-Aware Emotion Recognition in Conversation with RoBERTa, which significantly enhanced conversational emotion recognition by incorporating speaker information.
Building upon these advances in text-based models, several recent studies have demonstrated significant progress in multimodal and transformer-based emotion recognition, where LLMs continue to play a central role. For example, in HuBERT-CLAP, Nguyen et al.11 combined HuBERT and BERT/DistilBERT within a contrastive self-alignment framework to align audio and textual modalities, achieving improved performance in speech emotion recognition. Similarly, MemoCMT by Khan et al.2 underscores the pivotal role of LLMs, particularly BERT, in cross-modal emotion understanding. By integrating HuBERT for audio features and BERT for textual semantics within a cross-modal transformer, MemoCMT effectively captures and aligns phonetic and linguistic emotional cues, yielding state-of-the-art results on benchmarks like ESD. In parallel, Wang et al.28 proposed a contrastive learning-based multimodal framework that removes modality-specific negative information before fusion. Their system enhances unimodal signal quality and integrates it using an attention-enhanced transformer, significantly improving robustness and recognition performance on CMU-MOSI and MOSEI datasets. Another notable advancement is the Joint Multi-Scale Multimodal Transformer, also by Khan et al.12, which models intra- and inter-modal dependencies across audio and visual inputs via recursive cross-attention and leverages BERT for rich semantic extraction. Its efficient performance on consumer devices highlights the practical applicability of LLMs in real-world emotion recognition. Furthermore, RMER-DT, proposed by Zhu et al.13, introduces a diffusion-based transformer to address missing modality scenarios in conversational contexts, improving robustness and generalization. Moreover, Zhu et al.3 developed a multimodal client–server system that fuses facial, speech, text, and body cues for non-contact emotion recognition. The system achieved over 90 percent accuracy in speech and facial modalities, demonstrating the effectiveness of multimodal fusion in real-world clinical settings. Lastly, the CIME model by Wang et al.14 combines cross-attention and graph convolutional networks to enhance contextual interaction and semantic fusion across modalities, outperforming existing baselines in multimodal emotion classification tasks.
Furthermore, although initially designed for generative tasks, Generative Pre-trained Transformer (GPT) have proven highly effective in emotion classification. Mostafa M. Amin et al.29 found that GPT-3.5 and GPT-4 achieved high accuracy in affective computing tasks. Ghatora30 compared GPT-4 with traditional machine learning models for product review sentiment analysis, showing that GPT-4 excelled in capturing nuanced sentiments in detailed texts. Kheiri15 demonstrated a 22% F1-score improvement using GPT-3.5 Turbo for sentiment analysis, highlighting its strength in handling context and sarcasm. Huang16 introduced GPT-PERNIE, combining GPT with adversarial training for short-text sentiment analysis, enhancing robustness. Roumeliotis31 showed that GPT-4o outperformed BERT in classifying customer reviews with emotion. Jain17 evaluated GPT-2 and GPT-Neo for mental health sentiment detection, with GPT-2 achieving over 0.98 accuracy. These studies collectively confirm the practicality of GPT models in emotion analysis.
Recent studies in related domains also offer insights relevant to deception detection. Zhang et al.32 proposed a WiFi-based non-contact human presence detection method that uses neural networks and CSI features, achieving 99% accuracy in indoor environments. Zhu et al.33 introduced a dynamic spectral graph anomaly detection model combining Chebyshev convolution and self-attention to capture temporal anomalies, which could be adapted for identifying emotional inconsistencies. Zhang et al.34 designed a symmetrical and recursive neural network for image super-resolution; their architecture improves robustness and may inspire more stable multimodal deception detection systems.
Despite the aforementioned advances in deception detection and emotion classification, existing methods still face several limitations. Prior research on deception detection has primarily focused on traditional lexical and facial features4,5,9,18–20, while neglecting the critical role of emotional cues in identifying deceptive behavior. Moreover, most existing approaches are unimodal, relying solely on text, facial, or eye movement features5,9,21,22, and thus fail to exploit the full potential of multimodal integration. On the other hand, research in emotion classification has largely concentrated on domains such as product review analysis, with datasets typically drawn from TV show dialogues, social media chat logs or multimodal emotion corpora24,27, rather than from high-stress, emotionally charged settings like courtroom interrogations. In contrast, our proposed LieXBerta model is specifically fine-tuned on a real courtroom interrogation dataset, making it more effective at capturing the nuanced emotional states of individuals under interrogation. Furthermore, the extracted emotional features are integrated with action and facial cues to form a unified multimodal representation. This design enhances the model’s capability to detect deception in complex, high-pressure interrogation environments.
Dataset description
In the field of deception detection, datasets that include emotional annotations and can identify the veracity of courtroom texts are extremely scarce. Therefore, this study selects the Real-Life Trial dataset for emotional annotation, providing reliable data support for further exploration of the relationship between emotional features and deceptive behavior. The Real-Life Trial dataset8 is a public collection of courtroom trial videos gathered by Dr. Mihalcea’s team at the University of Michigan. This dataset contains a total of 121 short videos, divided into 61 real deception instances and 60 real honesty instances. Additionally, the dataset includes transcripts of each interviewee, along with manually annotated facial and action features such as mouth opening, head tilting, and frowning. In these annotations, a value of 1 indicates the presence of the corresponding facial or action feature, while a value of 0 indicates its absence. Table 1 provides the 21 facial features extracted from the dataset and their descriptions. These include 6 mouth features, 9 eye features, 4 eyebrow features, and 2 expression features. Table 2 provides the 18 action features extracted from the dataset, which include 10 head movement features and 8 hand movement features.
Table 1.
Facial feature descriptions.
| Feature name | Description |
|---|---|
| Smile | Whether a smile appears |
| Laugh | Whether laughter occurs |
| Scowl | Whether a scowl appears |
| otherEyebrowMovement | Other eyebrow movements |
| Frown | Whether a frown occurs |
| Raise | Whether eyebrows are raised |
| OtherEyeMovements | Other eye movements |
| Close-R | Whether the right eye is closed |
| X-Open | Whether the eyes open rapidly |
| Close-BE | Whether both eyes are closed |
| gazeInterlocutor | Whether gazing at the interlocutor |
| gazeDown | Whether looking down |
| gazeUp | Whether looking up |
| otherGaze | Other gaze behaviors |
| gazeSide | Whether gazing to the side |
| openMouth | Whether the mouth is open |
| closeMouth | Whether the mouth is closed |
| lipsDown | Whether the lips move downward |
| lipsUp | Whether the lips move upward |
| lipsRetracted | Whether the lips are retracted |
| lipsProtruded | Whether the lips protrude forward |
Table 2.
Action feature descriptions.
| Feature name | Description |
|---|---|
| OtherGestures |
Other unclassified gestures or movements |
| SideTurn |
Whether the head turns to the side |
| downR |
Whether the right side of the head tilts downward |
| sideTilt |
Whether the head tilts to the side |
| backHead |
Whether the head tilts backward |
| otherHeadM | Other head movements |
| sideTurnR |
Whether the head turns to the right side |
| sideTiltR |
Whether the head tilts to the right side |
| waggle |
Whether there is a shaking movement of the head |
| forwardHead |
Whether the head leans forward |
| downRHead |
Whether the right side of the head tilts downward |
| singleHand |
Whether gestures are made with one hand |
| bothHands |
Whether gestures are made with both hands |
| otherHandM | Other hand movements |
| complexHandM | Complex hand movements |
| sidewaysHand |
Whether the hands have sideways movements |
| downHands |
Whether the hands move downward |
| upHands |
Whether the hands move upward |
Emotional feature extraction
As shown in Table 3, A total of 10 emotional categories were used in this task. Among them, anger, fear, joy, and sadness were derived from Ekman’s discrete emotion theory35. In addition, we included six supplementary emotions, namely regret, hopeful, decisive, hesitate, agitated, and calm, based on the empirical observations of the dataset. These ten emotions, covering both basic and context-specific affective states, provide a comprehensive representation of the emotional features in interrogation texts.
Table 3.
Emotional feature descriptions.
| Feature Name | Description |
|---|---|
| anger |
Whether anger can be perceived from the text |
| fear |
Whether fear or being scared can be perceived from the text |
| joy |
Whether happiness or joy can be perceived from the text |
| regret |
Whether regret or remorse can be perceived from the text |
| sadness |
Whether sadness or melancholy can be perceived from the text |
| hopeful |
Whether hopefulness or optimism can be perceived from the text |
| decisive |
Whether decisiveness or determination can be perceived from the text |
| hesitate |
Whether hesitation or uncertainty can be perceived from the text |
| agitated |
Whether anxiety, irritability, or restlessness can be perceived from the text |
| calm |
Whether calmness or composure can be perceived from the text |
To fine-tune the RoBERTa-based emotion classification module, we conducted a dedicated emotion annotation task to create the labeled dataset. The annotation process followed the Comprehensive Guidelines for Emotion Annotation36. Each interrogation transcript was annotated at the document level, treating the entire text as a single unit. Emotions were labeled using a binary and multi-label scheme. For each emotion category, a value of 1 was assigned if the emotion was present, and 0 if absent. Multiple emotions could be assigned to the same transcript. The annotation was carried out by three English-proficient annotators. Each annotator labeled all 121 interrogation records based solely on the textual perspective, meaning that annotations were determined according to the content of the text itself, rather than the annotator’s personal emotional reaction. To ensure consistency, all annotators were provided with example sentences and corresponding labels for each emotion prior to the task. Disagreements were resolved through discussions between annotators and the research team to reach consensus.
As a result of this annotation process, we derived ten binary emotional features from the interrogation transcripts. These emotion features were subsequently utilized to support the fine-tuning of the RoBERTa-based emotion classification module. When combined with the original facial and action features from the dataset, they form a comprehensive multimodal feature representation. This integration enables a more thorough analysis of whether emotional features can enhance the performance of deception detection models.
LieXBerta algorithm
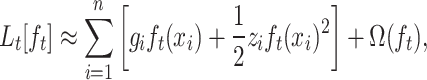
To reduce the time cost of manually assigning emotional features and simultaneously improve the efficiency and accuracy of deception detection, we design an automatic lie detection model called LieXBerta. As shown in Fig. 1, LieXBerta is mainly divided into two modules: an emotion classification module and a deception detection module. First, the emotion classification module uses a pretrained large language model, RoBERTa, to perform emotion classification on the text. Then, the emotional features are combined with the dataset’s original action and facial features. Finally, the deception detection module, based on the XGBoost, conducts deception detection by incorporating the new emotional features into the existing feature set.
Fig. 1.

Flowchart of the proposed LieXBerta framework.
Emotion classification module
In the emotion classification module, we decide to use the pre-trained large language model RoBERTa. RoBERTa, as a pre-trained language model, excels in emotion classification by capturing subtle emotional nuances through large-scale pre-training and fine-tuning, achieving high accuracy and robustness25,37,38. Its effectiveness is further demonstrated in various domains: integrating CNN and sentiment lexicons enhances sentiment analysis in bullet screens39, outperforming prompt engineering in hospitality review classification40, achieving 92.69% accuracy in social media emotion detection41, and improving multilabel emotion classification with advanced attention mechanisms42. These studies affirm RoBERTa’s adaptability and superior performance across diverse text-based emotion classification tasks.
In this work, we treat each emotional category as an independent classification target. For each emotional label, we construct a separate classification sub-task to determine whether the emotion is present in a given interrogation sentence. This design allows the model to support multilabel outputs, ensuring that multiple emotions can be simultaneously recognized within the same text. To accomplish this, we build an emotion classification model consisting of three major components: a text preprocessing layer, a RoBERTa encoding layer, and a classification output layer.
Text preprocessing layer
After extracting emotional features, each dataset contains the text and the corresponding emotion labels. First, the original text is cleaned by replacing non-printable characters, escape characters, newline characters, and carriage return characters with a space character, and converting all text to lowercase. After cleaning the interrogation texts, we use RoBERTa’s tokenizer to split the cleaned text into tokens. RoBERTa employs a tokenization method based on Byte-Pair Encoding, which effectively handles out-of-vocabulary words and subword units. Next, as shown below, we add [CLS] at the beginning of the token sequence and [SEP] at the end to obtain the original input X,
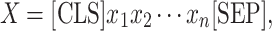 |
1 |
where n represents the sentence length; [CLS] denotes the special token indicating the start of the text sequence and [SEP] denotes the separator token between text sequences. This helps the model understand the start and end of the sequence.
Then, we convert the token sequence into a corresponding token ID sequence. RoBERTa’s tokenizer assigns a unique ID to each token based on its vocabulary. To ensure all input sequences have consistent lengths, we apply post-padding by appending zeros to the end of sequences that are shorter than the predefined maximum length. Through these steps, we transform the original interrogation texts into input representations  acceptable by the RoBERTa model. The transformation is defined as,
 |
2 |
where  ,
,  denotes the number of tokens in the sequence, and
  is the hidden layer dimension of RoBERTa.
RoBERTa encoding layer
After the preprocessing described in section “Text preprocessing layer”, the cleaned and tokenized inputs are fed into the RoBERTa model for training. The training process involves multiple epochs, where each epoch iterates over the entire dataset. To prevent overfitting during training, dropout regularization is applied within the RoBERTa layers. Specifically, certain neurons in the model are randomly deactivated during each forward pass, which encourages the model to learn more robust and generalizable features. In the RoBERTa encoding layer, the input representation passes through multiple layers of Transformers. By leveraging the self-attention mechanism, the model fully learns the semantic associations between each word in the sentence and ultimately obtains the contextual semantic representation of the sentence,
 |
3 |
where  represents the sequence of hidden states output by RoBERTa. The model uses the hidden layer representation corresponding to the [CLS] position, denoted as
  , whose value is constituted by the first component of h, since [CLS] is the first element of the input sequence.
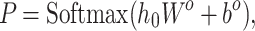
Classification output layer
After obtaining the hidden layer representation  at the [CLS] position, a fully connected layer is used to predict the classification label corresponding to the input text. Since our task is a binary classification for each emotion label, the output layer applies a softmax activation to produce a probability distribution
  , indicating whether the given emotion is present or absent in the text. The prediction is computed as,
 |
4 |
where  represents the weights of the fully connected layer;
  denotes the bias of the fully connected layer.
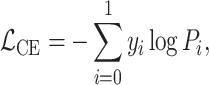
After obtaining the classification probability distribution P, we compute the cross-entropy loss with the true classification label y and update the model parameters through backpropagation,
 |
5 |
where  is the one-hot encoded true label vector. Specifically,
  indicates that the emotion is present in the input sample, while
  indicates that the emotion is absent. Similarly,
  denotes the predicted probability distribution over the two classes, where
  is the predicted probability that the emotion is absent, and
  is the predicted probability that the emotion is present.
The model parameters  are optimized using gradient descent,
 |
6 |
where  is the learning rate. After each parameter update in Eq. (6), the updated parameters
  are propagated back to the RoBERTa encoder in Eq. (3), enabling continued refinement of the contextual representation h. This training process is repeated iteratively over multiple epochs. After each epoch, the model evaluates the average training loss,
 |
7 |
where M denotes the total number of training samples, and  represents the cross-entropy loss of the j-th training sample. If this loss drops below a minimal threshold
  , the training is terminated early to prevent overfitting.
To ensure the model retains the best-performing parameters, we monitor the validation loss at each epoch. If the validation loss decreases compared to the previous best, the current model state is preserved. Once the optimal parameters are determined through the training procedure described above, the model utilizes these parameters to predict emotion labels for test set. Specifically, the input texts are reprocessed using the same tokenization and encoding pipeline, and passed through the trained RoBERTa encoder and classification layer. The predicted emotion label  for each input sequence is computed as,
 |
8 |
where  is obtained by selecting the index i with the highest predicted probability
  from P . Specifically,
  indicates that the emotion is predicted to be present, while
  indicates that the emotion is predicted to be absent.
This process is performed independently for each emotion category, resulting in individual binary predictions. Finally, we obtain the predicted results for each emotional category in each interrogation text, which are used in the subsequent deception detection module. The process of the Emotion Classification Module is presented in Algorithm 1.
Algorithm 1.

Emotion classification module
Deception detection module
XGBoost has proven to be highly effective in fraud detection, excelling in tasks like credit card fraud43 and customer transaction fraud44 due to its superior accuracy and F1 score. It employs regression trees based on the CART (Classification and Regression Tree) structure, optimized through gradient boosting to minimize loss. Its robustness is further validated in scam profile detection on Instagram, where it outperforms other models with 90% accuracy45, and in a large-scale fraud detection framework, achieving an impressive 99% accuracy46.
We adopt a feature-level fusion strategy by applying horizontal concatenation of the emotional, facial, and action feature vectors. All features are horizontally concatenated according to the sample index, ensuring that each feature vector represents a consistent multimodal description of the same data instance. Because XGBoost builds its trees incrementally and selects the most discriminative features at each split automatically, it can adaptively learn which features are most relevant for deception detection47,48. Therefore, we did not assign weights or priorities to features.
After concatenating the features, we form a unified input feature vector  , where d denotes the dimension of the input feature vector. For the input feature vector
  of the i-th sample, after training the t-th decision tree, its predicted value is updated as,
 |
9 |
where  is the learning rate, and
  is the prediction of the t-th tree for the sample
  . In the first round of training, since the model has not yet learned any information, the initial predicted value for all samples is set to 0.5,
 |
10 |
where  denotes the predicted value for the i-th sample before the first iteration. The objective of the
  -th boosting iteration is to minimize the following function,
 |
11 |
where n is the total number of samples and  denotes the loss function.
  represents the ground truth deception label for the
  -th sample, where 1 denotes a truthful instance and 0 denotes a deceptive one.
  represents the regularization term of all trees up to iteration
  , and
, and  is the complexity regularization term of the newly added tree at iteration
  . The definition of
  is given as follows,
 |
12 |
where T is the number of leaf nodes in the current tree,  is the regularization cost associated with adding a leaf node and
  is the L2 regularization coefficient. In a regression tree, the prediction for a sample
  is determined by the score of the leaf node it falls into. If sample
  falls into leaf
  , its prediction is determined as,
 |
13 |
where  is the structure function that maps sample
  to the index of the leaf it belongs to, and
  is the score assigned to leaf
To optimize efficiently, XGBoost uses a second-order Taylor expansion to approximate the loss function  . By ignoring constant terms, we obtain,
 |
14 |
where 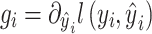 is the first-order derivative and
 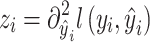 is the second-order derivative.
By integrating the regularization term in Eq. (12) and the leaf-wise prediction formulation in Eq. (13) into the second-order approximation in Eq. (14), the objective function can be reformulated as,
 |
15 |
where 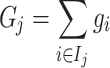 is the sum of first-order gradients of the samples in leaf node
  .
.  is the sum of second-order gradients of the samples in leaf node
By taking the derivative of the objective function with respect to  and setting it to zero, the optimal value for each leaf node is obtained as,
 |
16 |
where  denotes the optimal prediction score for leaf node
  . By substituting Eq. (16) into Eq. (15), we obtain,
 |
17 |
where  denotes the minimum value of the objective function achievable by the optimal decision tree
  in the t-th boosting iteration. Then,
 |
18 |
where  denotes the minimized value of the objective function before splitting a node. After splitting the node into left child L and right child R, the minimized objective becomes,
 |
19 |
where  is the sum of first-order gradients of all samples in the left child node L, and
  is the sum of first-order gradients in the right child node R. Similarly,
  and
and  denote the sums of second-order gradients in the left and right child nodes, respectively. Since the parent node’s gradient and Hessian sums are equal to the total sums of its left and right children, we have,
 |
20 |
 |
21 |
where  and
and  denote the first-order gradient sum and second-order gradient sum of the parent node, respectively. Then,
 |
22 |
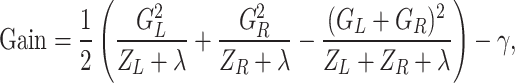
where Gain represents the improvement in the objective function by splitting the node. By substituting Eqs. (18), (19), (20), and (21) into Eq. (22), we can derive the expression for Gain,
 |
23 |
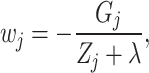
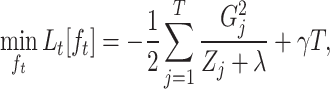
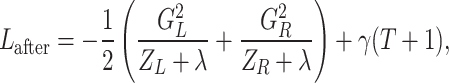
where Gain can be used to compute feature importance. During the node splitting process, we adopt a top-down greedy strategy as the split finding method. Specifically, for each node, the model processes each feature sequentially by sorting all values of that feature among the samples in the node and enumerating all possible split points. For each candidate split, the samples in the node are divided into left and right subsets. The corresponding Gain value is then calculated. Finally, the feature and split point that yield the highest Gain are selected to perform the node split. If the highest Gain is positive, the number of samples in the node exceeds the minimum child weight threshold, and the maximum depth constraint is not violated, then the node is split.
After completing the above steps, we can obtain the updated prediction  from the current tree. This prediction is then used to compute the loss and gradients in Eq. (11) for constructing the
  -th tree. The process repeats until the total number of trees is reached. The number of trees is determined by a predefined hyperparameter.
After all trees are constructed on the training set, we use the trained model to make predictions on the test set. The XGBoost model first outputs the raw prediction score  , which is the sum of outputs from all boosted trees. Then, a sigmoid function is applied to transform this score into a probability,
 |
24 |
Finally, the predicted label is determined by thresholding the probability at 0.5, where values greater than or equal to 0.5 are classified as 1, meaning truthful, and those below 0.5 as 0, meaning deceptive. The process of the Deception Detection Module is presented in Algorithm 2.
Algorithm 2.

Deception detection module
Experiments
Experimental setup
The total dataset size used in our study is 121 instances, each consisting of an interrogation text transcribed from video recordings, along with 21 facial features and 18 action features from the Real-Life Trial dataset8. Since Decision Tree49, Logistic Regression50, Support Vector Machine (SVM)51, and XGBoost52 have demonstrated strong performance in prior deception detection studies and are commonly used as standard baselines in this domain1,4,6,8,9,43–45, we include them as baseline models for comparison with the proposed model. For the baseline models, the input features consist of action and facial features, while for our proposed model, the input includes interrogation text, action features, and facial features. on this dataset, We also present the performance of previous deception detection methods, Long Short-Term Memory (LSTM)53 and Bidirectional Long Short-Term Memory (BiLSTM)54. The input feature of these two methods is interrogation text.
For the LSTM model, we used an embedding layer with a vocabulary size of 5000 and an embedding dimension of 128, followed by a unidirectional LSTM layer with 64 units, a dropout layer with a rate of 0.5, and a final dense layer with sigmoid activation for binary classification. The model was trained using the Adam optimizer with a learning rate of 0.001, a binary cross-entropy loss function, a batch size of 32, and 5 training epochs. For the BiLSTM model, except that the LSTM layer was wrapped in a Bidirectional wrapper to capture contextual information from both directions. All other training parameters, including embedding size, LSTM units, dropout rate, optimizer, and number of epochs, were kept consistent with the LSTM setting.
To compare the performance of different emotion classification algorithms in the emotion classification module, we use not only RoBERTa as the emotion classifier but also employs the BERT method25 and the GPT-4 method to extract emotional features from the interrogation texts. The parameter settings for each emotion classification method are shown in Table 4. We fine-tuned Bert and Roberta for emotion classification using 10-fold cross-validation. Specifically, the dataset is divided into 10 equal parts, and each part is used once as the validation set while the remaining nine parts are used for training. The model was trained for up to 100 epochs with an early stopping mechanism applied, where training was halted if the average training loss dropped below a threshold of 0.01. A dropout rate of 0.1 was employed. The training process was conducted using an NVIDIA GPU 4060 to accelerate computation.
Table 4.
Parameter settings for emotion classification methods.
| Parameter | Bert | Roberta | GPT-4 |
|---|---|---|---|
| Version/Model | bert-base-uncased | roberta-base | gpt-4o-mini (API-based) |
| Fine-tuning | Yes | Yes | No |
| Cross-validation | 10-fold | 10-fold | N/A |
| Training epochs | 100 | 100 | N/A |
Early stopping threshold ( ) ) |
0.01 | 0.01 | N/A |
| Dropout rate | 0.1 | 0.1 | N/A |
| Hardware configuration | GPU 4060 | GPU 4060 | N/A |
Similarly, to compare the performance of different machine learning algorithms in the deception detection module, we employ not only XGBoost as the deception detector but also uses Logistic Regression, SVM and Decision Tree for deception detection. For XGBoost, the number of trees is set to 100, with a learning rate of 0.3 and a maximum tree depth of 6. Both the subsample ratio and the column sampling ratio are set to 1.0. The minimum loss reduction required to make a further split is set to 0, encouraging the model to fully explore potential splits. The L1 and L2 regularization terms are set to 0 and 1, respectively, to control model complexity. The loss function used is logistic loss, which is suitable for binary classification tasks. Furthermore, the minimum child weight is set to 1, meaning that a node will only be split if it contains at least one training instance. In the case of Logistic Regression, the optimization algorithm used is Limited-memory Broyden–Fletcher–Goldfarb–Shanno, with a maximum iteration count of 1000 and L2 regularization. The SVM model adopts the Radial Basis Function as its kernel function. For Decision Tree, the Gini impurity was used as the splitting criterion. The minimum number of samples required to split an internal node was set to 2, and the minimum number of samples required to be at a leaf node was set to 1.
Evaluation metrics
Following the approach used by Tien Nguyen et al.4, we adopt accuracy and F1 score as the primary evaluation metrics for deception detection. Accuracy measures the proportion of correct predictions across all predictions and serves as a general indicator of overall model performance. Nevertheless, deception detection tasks often involve imbalanced class distributions, particularly in real-world courtroom scenarios where truthful instances are significantly more prevalent than deceptive ones. In such contexts, accuracy may not provide a reliable assessment of the model’s effectiveness, as a model that consistently predicts the majority class can still achieve high accuracy without truly learning to identify deceptive behavior. To provide a more comprehensive evaluation, we incorporate the F1 score, which is the harmonic mean of precision and recall. This metric is particularly well-suited for assessing the model’s performance on the minority class. By balancing the trade-off between precision and recall, the F1 score ensures that the model minimizes both false positives and false negatives, thereby offering a more accurate reflection of its ability to detect deceptive instances.
Experimental results and analysis
The experimental results presented in Table 5 demonstrate a clear comparison between the baseline models and the proposed emotion-enhanced models. All models are evaluated using stratified 10-fold cross-validation, with performance metrics reported as the average across folds. Among the baseline deception detectors, XGBoost achieved the best performance, with a training accuracy and F1 score of 98.53%, and a test accuracy and F1 score of 80.96% and 80.49%, respectively. This indicates that XGBoost has strong feature-capturing capabilities and better generalization performance, making it a solid baseline for deception detection.
Table 5.
Performance comparison between the proposed models and baseline models.
| Model | Train accuracy | Train F1 score | Test accuracy | Test F1 score |
|---|---|---|---|---|
| LSTM53 | 50.46% | 67.07% | 41.67% | 58.82% |
| BiLSTM54 | 95.41% | 95.41% | 66.67% | 71.43% |
| XGBoost52 | 98.53% | 98.53% | 80.96% | 80.49% |
| Logistic Regression50 | 88.63% | 88.63% | 77.63% | 77.52% |
| SVM51 | 95.04% | 95.04% | 78.43% | 78.16% |
| Decision Tree49 | 98.17% | 98.11% | 66.67% | 60.00% |
| BERT + XGBoost | 100.00% | 100.00% | 83.53% | 83.18% |
| BERT + LR | 91.94% | 91.93% | 80.97% | 80.42% |
| BERT + SVM | 96.48% | 96.48% | 80.23% | 80.10% |
| BERT + DT | 100.00% | 100.00% | 71.15% | 69.49% |
| RoBERTa + XGBoost | 100.00% | 100.00% | 84.23% | 83.82% |
| RoBERTa + LR | 92.16% | 92.15% | 81.10% | 80.72% |
| RoBERTa + SVM | 97.11% | 97.11% | 81.03% | 80.92% |
| RoBERTa + DT | 100.00% | 100.00% | 71.15% | 70.85% |
| GPT-4o-mini + XGBoost | 100.00% | 100.00% | 81.77% | 81.64% |
| GPT-4o-mini + LR | 94.63% | 94.63% | 78.47% | 78.39% |
| GPT-4o-mini + SVM | 96.69% | 96.69% | 74.30% | 73.86% |
| GPT-4o-mini + DT | 100.00% | 100.00% | 65.96% | 64.44% |
Significant values are in [bold].
LR = Logistic Regression, DT = Decision Tree
Incorporating the emotion classifiers such as BERT, RoBERTa, and GPT-4o-mini, can dramatically increase the test accuracy and test F1 score. Among them, the combinations of XGBoost with emotion classifiers achieved the best results, exhibiting extremely high accuracy and F1 scores (100%) on the training set, highlighting its strong fitting capability.
More importantly, Models combined with emotion classifiers generally outperformed the baseline models on the test set. For example, the baseline XGBoost model achieved a test accuracy of 80.96%, which increased to 84.23% when combined with the RoBERTa emotion classifier. Among these, LieXBerta achieved the highest test accuracy (84.23%) and F1 score (83.82%), representing a 3.27% improvement over the baseline model, demonstrating outstanding performance in deception detection.
In Fig. 2, the comparison of emotion classifiers demonstrated that RoBERTa consistently delivered the highest performance across all deception detection models, followed by BERT. These findings underscore the crucial role of emotional features in enhancing deception detection capabilities. Notably, GPT-4o-mini also outperformed the baseline models in most cases–particularly when paired with XGBoost and Logistic Regression. This indicates that while emotional features generally improve detection accuracy, their effectiveness can vary depending on the specific classification model used.
Fig. 2.

Comparison of test accuracy between baseline and emotion-enhanced models.
Feature importance calculation
To further improve the proposed optimal model–LieXBerta, which incorporates automatic emotional annotation for deception detection–we conducts a feature importance analysis based on the average gain from XGBoost’s decision tree splits. The calculation formula is given by,
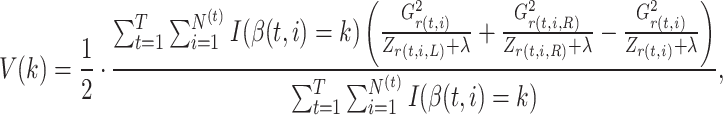 |
25 |
where  represents the average information gain of feature
  when used as a splitting attribute during the entire training process.
  denotes the total number of trees.
  denotes the number of non-leaf nodes in the
  -th tree.
  indicates the splitting feature used at the
  -th non-leaf node of the
  -th tree. Therefore,
  .
.  is the indicator function, which returns 1 when feature
  is used to split the node, and 0 otherwise.
  and
and  represent the sum of the first-order gradients at the left and right child nodes of the
  -th non-leaf node in the
  -th tree, respectively.
  and
and  denote the sum of the second-order gradients at the left and right child nodes of that node.
  denotes the sum of the first-order gradients of the
  -th non-leaf node in the
  -th tree.
  denotes the sum of the second-order gradients of the
  -th non-leaf node in the
  -th tree.
The larger the value of  , the greater the average gain in the objective function when feature
  is used to split a node. This indicates that feature
  contributes more significantly to reducing the loss during the boosting process. Therefore, features with higher
  values are considered more important, as they provide greater discrimination power and are more frequently selected in the decision-making process of the model.
Feature importance analysis
Tables 6 respectively present the facial features, action features, and emotional features with importance values greater than 0, along with their corresponding scores. The ranking of these features highlights distinct contributions from each modality in enhancing deception detection performance.
Table 6.
Feature importance of the LieXBerta model.
| FF | Value | AF | Value | EF | Value |
|---|---|---|---|---|---|
| OtherEyeMovements | 0.0455 | otherHandM | 0.1727 | calm | 0.2337 |
| gazeDown | 0.1014 | OtherGestures | 0.2533 | fear | 0.2740 |
| lipsUp | 0.1411 | sideTurnR | 0.3547 | hesitate | 0.4166 |
| gazeSide | 0.2121 | bothHands | 0.3618 | agitated | 0.4385 |
| Smile | 0.2636 | downRHead | 0.5900 | decisive | 0.5412 |
| gazeInterlocutor | 0.2798 | singleHand | 0.6813 | anger | 0.8201 |
| openMouth | 0.5646 | complexHandM | 0.7511 | hopeful | 0.8450 |
| Raise | 0.6552 | SideTurn | 1.1452 | sadness | 1.7624 |
| otherEyebrowMovement | 0.7352 | upHands | 1.2608 | ||
| lipsDown | 0.7500 | sideTilt | 1.3928 | ||
| X-Open | 0.8359 | ||||
| Close-R | 1.0600 | ||||
| Frown | 1.6585 | ||||
| Scowl | 2.2090 |
FF = Facial Feature, AF = Action Feature, EF = Emotional Feature
Emotional features such as sadness, anger, and hopeful appear at the higher end of the importance spectrum, indicating that affective cues play a valuable role in identifying deceptive behavior. These emotions are often associated with internal psychological tension or moral conflict, which are more likely to surface during deception. While some emotional features such as calm, fear or regret show lower importance, the overall inclusion of emotional features provides complementary signals that are difficult to capture through visual observation alone.
Facial features dominate the top ranks, with features like Scowl, Frown, and openMouth contributing significantly to model predictions. These cues often reflect expressions of discomfort, anxiety, or emotional leakage–signals that are highly correlated with deceptive intent. The model heavily relies on such facial micro-expressions, which serve as immediate and involuntary indicators of underlying emotional states.
Action features such as sideTilt, SideTurn, Close-R, and upHands also show high importance, revealing the significance of body movement patterns in deceptive contexts. These subtle micro-movements may reflect behavioral hesitation, evasion, or tension and tend to align with facial expressions that suggest discomfort or unease. Less relevant action features, on the other hand, exhibit low importance and have minimal effect on the final prediction.
Parameters adjustment
The total training time complexity of the deception detection module with K trees is  , where d is the total number of features and n is the number of training samples. Therefore, reducing either the number of features or the number of training samples leads to a reduction in the overall runtime of the model. Based on the feature importance analysis, we decided to remove features with an importance value of 0 from the LieXBerta model (including backHead, close-BE, closeMouth, downHands, downR, gazeUp, joy, Laugh, lipsProtruded, lipsRetracted, otherGaze, otherHeadM, regret, sideTiltR, sidewaysHand, and waggle) to improve computational efficiency. The results show that after removing these features, the model’s accuracy and F1 score remained unchanged, but the runtime efficiency significantly improved.
To further enhance the accuracy and efficiency of the LieXBerta model, we conducted multiple rounds of hyperparameter tuning. Specifically, we employed a randomized search strategy to explore different combinations of key model parameters. This approach involved randomly sampling 500 parameter configurations from a predefined search space and evaluating each configuration using 10-fold cross-validation. The search focused on sampling-related parameters such as the fraction of features used per tree (colsample_bytree) and the fraction of training instances used per tree (subsample). Based on the the highest average validation accuracy, both parameters were set to 0.85.
Table 7 shows different settings of LieXBerta. Specifically, LieXBerta(1) enables feature selection and uses full sampling for both columns and rows (colsample_bytree = 1 and subsample = 1). LieXBerta(2) disables feature selection while retaining full sampling rates. LieXBerta(3) disables feature selection and applies partial sampling (colsample_bytree = 0.85, subsample = 0.85).
Table 7.
Different settings of LieXBerta.
| Model | Feature selection |
colsample_bytree | subsample |
|---|---|---|---|
| LieXBerta(1) | Yes | 1 | 1 |
| LieXBerta(2) | No | 1 | 1 |
| LieXBerta(3) | No | 0.85 | 0.85 |
Deception detection results of LieXBerta under different settings
Figure 3 clearly demonstrate that parameter tuning are effective methods for improving the performance and efficiency of the model. Without parameter tuning (colsample_bytree=1, subsample=1), the test accuracy and F1 score of LieXBerta(1) and LieXBerta(2) were 84.23% and 83.82%, respectively. After parameter tuning (colsample_bytree=0.85, subsample=0.85), the test accuracy and F1 score of LieXBerta(3) increased to 87.50% and 87.13%, respectively, indicating a significant improvement in the model’s generalization capability.
Fig. 3.

Deception detection results of LieXBerta under different settings.
Figure 4 shows the confusion matrix of LieXBerta(3), providing a detailed view of its classification performance. The model correctly identifies 56 honest samples and 50 deceptive samples, while misclassifying 5 honest and 10 deceptive instances. This results in an overall accuracy of approximately 87.60%, which aligns with the average accuracy reported earlier in Fig. 3. The confusion matrix reveals that LieXBerta(3) demonstrates a well-balanced classification ability between honest and deceptive categories. The small number of misclassified samples reflects the model’s robustness and effectiveness in practical deception detection tasks. The low rates of both false positives and false negatives indicate that the model is capable of delivering reliable predictions in real courtroom interrogation scenario.
Fig. 4.

Confusion matrix of LieXBerta(3) evaluated using 10-fold cross-validation.
Runtime results of LieXBerta under different settings
Figure 5 shows the runtime results of LieXBerta under different settings. Without feature selection or parameter tuning, the total runtime of LieXBerta(2) was 0.1636 s. After feature selection, the total runtime LieXBerta(1) decreased to 0.1481 s, representing an approximately 10% speedup. When only parameter tuning (colsample_bytree=0.85, subsample = 0.85) was applied, the total runtime further of LieXBerta(3) decreased to 0.0953 seconds, achieving a 42% speedup compared to the untuned model. These results indicate that parameter tuning not only improves prediction accuracy and F1 score but also significantly reduces overall runtime. Feature selection serves as a complementary strategy, further reducing runtime and enhancing training efficiency.
Fig. 5.

Runtime results of LieXBerta under different settings.
Generalization capability of LieXBerta
The proposed LieXBerta model has strong generalization ability when applied to new datasets, under noisy conditions or in the presence of an expanded feature set. This robustness stems from the architectural characteristics of both its core components: the emotion classification module and the deception detection module.
The Emotion Classification Module is based on Roberta. As a pre-trained large language model, RoBERTa has been trained on vast and diverse corpora, enabling it to capture rich semantic and contextual information from textual data25. In our study, LieXBerta was further fine-tuned on emotion-labeled interrogation texts from a real courtroom dataset, which reflects the psychological pressure and linguistic complexity of high-stress interrogation environments. This fine-tuning allows the model to adapt to domain-specific nuances, making it particularly effective in recognizing subtle emotional cues under stress. Furthermore, LieXBerta’s subword tokenization and transformer architecture enhance its tolerance to noisy inputs, such as typos, irregular grammar, or ambiguous emotional expressions. Specifically, the subword tokenization mechanism based on Byte-Pair Encoding allows rare or misspelled words to be broken down into familiar subunits, enabling the model to extract meaning from unfamiliar or distorted terms. Additionally, the transformer architecture employs self-attention mechanisms that model long-range dependencies and global context across the entire sentence. This allows the model to infer the intended emotional semantics when local word usage is noisy or grammatically irregular55. Therefore, LieXBerta will perform effectively when applied to new datasets containing noise and outliers.
In Deception Detection Module, LieXBerta adaptively selects the most informative features during training through a greedy tree-splitting strategy based on gain maximization. This property enables the model to suppress the influence of low-quality or irrelevant signals in the feature space, including mislabeled facial expressions or inconsistent gesture data. Moreover, we incorporates regularization mechanisms and partial sampling to prevent overfitting and improve generalization in deception detection module. This enables LieXBerta to maintain stable performance when the feature set is expanded.
Conclusion
In response to the existing limitations in lie detection during courtroom interrogations, we proposes and implements an automated emotion-enhanced deception detection model LieXBerta. By performing refined emotional feature annotations on a real interrogation text dataset, this study has constructed an interrogation text dataset rich in emotional information, providing a solid data foundation for subsequent emotion analysis and deception detection.
In terms of model design, LieXBerta combines emotional features, facial action features, and action features, using the RoBERTa model for emotion classification, and inputs the extracted emotional features into the XGBoost machine learning model for deception detection. Experimental results show that the LieXBerta model, with the inclusion of emotional features, achieved 87.50% accuracy and an F1 score of 87.13% on the test set, significantly outperforming the baseline model that used only traditional features (80.96% accuracy). These results confirm the important role of emotional features in enhancing the accuracy and efficiency of deception detection.
Furthermore, through experimental combinations with various emotion classifiers and deception detectors, we further demonstrates RoBERTa’s superiority in emotion feature extraction and XGBoost’s strong classification ability in deception detection tasks. Although the model exhibited extremely high accuracy on the training set, its performance slightly declined on the test set, suggesting a degree of overfitting. In response, future research will focus on expanding the diversity of training data to enhance the model’s generalization capability, thereby further improving its stability and reliability in real-world applications. Future work can further explore multimodal data integration and more advanced deep learning methods to advance lie detection technology in courtroom interrogations, aiming for more objective, accurate, and efficient judicial decisions.
Author contributions
C.Z. developed the methodology, implemented the experiments, and drafted the main manuscript. Y.Z. supervised the research, designed the emotion classification framework, and revised the manuscript. C.L. assisted with data preprocessing and statistical analysis. S.Z. contributed to the experimental validation and result interpretation. All authors reviewed and approved the final manuscript.
Data availability
The data that support the findings of this study are available from the corresponding author upon reasonable request.
Competing interests
The authors declare no competing interests.
Footnotes
Publisher’s note
Springer Nature remains neutral with regard to jurisdictional claims in published maps and institutional affiliations.
References
- 1.Krishnamurthy, G., Majumder, N., Poria, S. & Cambria, E. A deep learning approach for Multimodal deception detection. In Computational Linguistics and Intelligent Text Processing (ed. Gelbukh, A.) 87–96 (Springer, Cham, 2023). 10.1007/978-3-031-23793-5_8. [Google Scholar]
- 2.Khan, M., Tran, P.-N., Pham, N. T., Saddik, A. E. & Othmani, A. Memocmt: multimodal emotion recognition using cross-modal transformer-based feature fusion. Sci. Rep.15(1), 5473. 10.1038/s41598-025-89202-x (2025). [DOI] [PMC free article] [PubMed] [Google Scholar]
- 3.Zhu, X. et al. A client-server based recognition system: Non-contact single/multiple emotional and behavioral state assessment methods. Comput. Methods Programs Biomed.260, 108564. 10.1016/j.cmpb.2024.108564 (2025). [DOI] [PubMed] [Google Scholar]
- 4.Nguyen, T., Abri, F., Namin, A.S. & Jones, K.S. Deception and lie detection using reduced linguistic features, deep models and large language models for transcribed data. In 2024 IEEE 48th Annual Computers, Software, and Applications Conference (COMPSAC) 376–381 (2024). 10.1109/COMPSAC61105.2024.00059.
- 5.Barsever, D., Singh, S. & Neftci, E. Building a better lie detector with bert: the difference between truth and lies. In 2020 International Joint Conference on Neural Networks (IJCNN) 1–7 (2020). 10.1109/IJCNN48605.2020.9206937.
- 6.Jaiswal, M., Tabibu, S. & Bajpai, R. The truth and nothing but the truth: Multimodal analysis for deception detection. In 2016 IEEE 16th International Conference on Data Mining Workshops (ICDMW) 938–943 (2016). 10.1109/ICDMW.2016.0137.
- 7.Hancock, J.T., Curry, L.E., Goorha, S. & Woodworth, M.T. Lies in conversation: An examination of deception using automated linguistic analysis. In Proceedings of the Annual Meeting of the Cognitive Science Society, vol. 26 (2004).
- 8.Pérez-Rosas, V., Abouelenien, M., Mihalcea, R., & Burzo, M. Deception detection using real-life trial data. In Proceedings of the 2015 ACM on International Conference on Multimodal Interaction. ICMI ’15, pp. 59–66. Association for Computing Machinery, New York, NY, USA (2015). 10.1145/2818346.2820758.
- 9.Avola, D., Cinque, L., Foresti, G.L. & Pannone, D. Automatic deception detection in rgb videos using facial action units. In Proceedings of the 13th International Conference on Distributed Smart Cameras. ICDSC 2019. Association for Computing Machinery, New York, NY, USA (2019). 10.1145/3349801.3349806.
- 10.Adoma, A.F., Henry, N.-M. & Chen, W. Comparative analyses of bert, roberta, distilbert, and xlnet for text-based emotion recognition. In 2020 17th International Computer Conference on Wavelet Active Media Technology and Information Processing (ICCWAMTIP) 117–121 (2020). 10.1109/ICCWAMTIP51612.2020.9317379.
- 11.Nguyen, L.H., Pham, N.T., Khan, M., Othmani, A. & EI Saddik, A. Hubert-clap: Contrastive learning-based multimodal emotion recognition using self-alignment approach. In Proceedings of the 6th ACM International Conference on Multimedia in Asia. MMAsia ’24. Association for Computing Machinery, New York, NY, USA (2024). 10.1145/3696409.3700183.
- 12.Khan, M. et al. Joint multi-scale multimodal transformer for emotion using consumer devices. IEEE Trans. Consum. Electron.71(1), 1092–1101. 10.1109/TCE.2025.3532322 (2025). [Google Scholar]
- 13.Zhu, X. et al. Rmer-dt: robust multimodal emotion recognition in conversational contexts based on diffusion and transformers. Inf. Fusion123, 103268. 10.1016/j.inffus.2025.103268 (2025). [Google Scholar]
- 14.Wang, R., Guo, C., Cambria, E., Rida, I., Yuan, H., Piran, M.J., Feng, Y. & Zhu, X. Cime: contextual interaction-based multimodal emotion analysis with enhanced semantic information. 10.22541/au.173750886.60448227/v1 (2025).
- 15.Kheiri, K. & Karimi, H. Sentimentgpt: Leveraging gpt for advancing sentiment analysis. In 2024 IEEE International Conference on Big Data (BigData) 7051–7060 (2024). 10.1109/BigData62323.2024.10825350.
- 16.Huang, J., He, P., Li, C., He, Y. & Yang, Y. A gpt-pernie model for short text sentiment analysis. In Proceedings of the 2024 8th International Conference on Big Data and Internet of Things. BDIOT ’24, pp. 149–155. Association for Computing Machinery, New York, NY, USA (2024). 10.1145/3697355.3697380.
- 17.Jain, B., Goyal, G. & Sharma, M. Evaluating emotional detection & classification capabilities of gpt-2 & gpt-neo using textual data. In 2024 14th International Conference on Cloud Computing, Data Science & Engineering (Confluence) 12–18 (2024). 10.1109/Confluence60223.2024.10463396.
- 18.Demyanov, S., Bailey, J., Ramamohanarao, K. & Leckie, C. Detection of deception in the mafia party game. In Proceedings of the 2015 ACM on International Conference on Multimodal Interaction. ICMI ’15, pp. 335–342. Association for Computing Machinery, New York, NY, USA (2015). 10.1145/2818346.2820745.
- 19.Yu, X. et al. Is interactional dissynchrony a clue to deception? insights from automated analysis of nonverbal visual cues. IEEE Trans. Cybern.45(3), 492–506. 10.1109/TCYB.2014.2329673 (2015). [DOI] [PubMed] [Google Scholar]
- 20.Monaro, M., Maldera, S., Scarpazza, C., Sartori, G. & Navarin, N. Detecting deception through facial expressions in a dataset of videotaped interviews: a comparison between human judges and machine learning models. Comput. Hum. Behav.127, 107063. 10.1016/j.chb.2021.107063 (2022). [Google Scholar]
- 21.Nugroho, R.H., Nasrun, M. & Setianingsih, C. Lie detector with pupil dilation and eye blinks using hough transform and frame difference method with fuzzy logic. In 2017 International Conference on Control, Electronics, Renewable Energy and Communications (ICCREC) 40–45 (2017). 10.1109/ICCEREC.2017.8226697.
- 22.George, S., Manohara Pai, M.M., Pai, R.M. & Praharaj, S.K. Eye blink count and eye blink duration analysis for deception detection. In 2017 International Conference on Advances in Computing, Communications and Informatics (ICACCI) 223–229 (2017). 10.1109/ICACCI.2017.8125844.
- 23.Devlin, J., Chang, M.-W., Lee, K. & Toutanova, K. BERT: Pre-training of deep bidirectional transformers for language understanding. In: Burstein, J., Doran, C., Solorio, T. (eds.) Proceedings of the 2019 Conference of the North American Chapter of the Association for Computational Linguistics: Human Language Technologies, Volume 1 (Long and Short Papers), pp. 4171–4186. Association for Computational Linguistics, Minneapolis, Minnesota. 10.18653/v1/N19-1423 (2019).
- 24.Luo, L. & Wang, Y. Emotionx-hsu: Adopting pre-trained BERT for emotion classification. CoRR arxiv:1907.09669 (2019).
- 25.Liu, Y., Ott, M., Goyal, N., Du, J., Joshi, M., Chen, D., Levy, O., Lewis, M., Zettlemoyer, L. & Stoyanov, V. Roberta: A robustly optimized BERT pretraining approach. CoRR arxiv:1907.11692 (2019).
- 26.Ameer, I. et al. Multi-label emotion classification in texts using transfer learning. Expert Syst. Appl.213, 118534. 10.1016/j.eswa.2022.118534 (2023). [Google Scholar]
- 27.Kim, T. & Vossen, P. Emoberta: Speaker-aware emotion recognition in conversation with roberta. CoRR arxiv:2108.12009 (2021).
- 28.Wang, R. et al. Contrastive-based removal of negative information in multimodal emotion analysis. Cogn. Comput.17(3), 107. 10.1007/s12559-025-10463-9 (2025). [Google Scholar]
- 29.Amin, M. M., Mao, R., Cambria, E. & Schuller, B. W. A wide evaluation of chatgpt on affective computing tasks. IEEE Trans. Affect. Comput.15(4), 2204–2212. 10.1109/TAFFC.2024.3419593 (2024). [Google Scholar]
- 30.Ghatora, P. S., Hosseini, S. E., Pervez, S., Iqbal, M. J. & Shaukat, N. Sentiment analysis of product reviews using machine learning and pre-trained llm. Big Data Cogn. Comput.8, 12. 10.3390/bdcc8120199 (2024). [Google Scholar]
- 31.Roumeliotis, K. I., Tselikas, N. D. & Nasiopoulos, D. K. Leveraging large language models in tourism: a comparative study of the latest gpt omni models and bert nlp for customer review classification and sentiment analysis. Information15, 12. 10.3390/info15120792 (2024). [Google Scholar]
- 32.Zhang, Y., Wang, X., Wen, J. & Zhu, X. Wifi-based non-contact human presence detection technology. Sci. Rep.14(1), 3605. 10.1038/s41598-024-54077-x (2024). [DOI] [PMC free article] [PubMed] [Google Scholar]
- 33.Zheng, J. et al. Dynamic spectral graph anomaly detection. Proc. AAAI Conf. Artif. Intell.39(12), 13410–13418. 10.1609/aaai.v39i12.33464 (2025). [Google Scholar]
- 34.Gao, M. et al. Towards trustworthy image super-resolution via symmetrical and recursive artificial neural network. Image Vis. Comput.158, 105519. 10.1016/j.imavis.2025.105519 (2025). [Google Scholar]
- 35.Ekman, P. An argument for basic emotions. Cogn. Emot.6(3–4), 169–200. 10.1080/02699939208411068 (1992). [Google Scholar]
- 36.Islam, M.A., Mukta, M.S.H., Olivier, P. & Rahman, M.M. Comprehensive guidelines for emotion annotation. In Proceedings of the 22nd ACM International Conference on Intelligent Virtual Agents. IVA ’22. Association for Computing Machinery, New York, NY, USA. 10.1145/3514197.3549640 (2022).
- 37.Kamath, R., Ghoshal, A., Eswaran, S. & Honnavalli, P. An enhanced context-based emotion detection model using roberta. In 2022 IEEE International Conference on Electronics, Computing and Communication Technologies (CONECCT) 1–6 (2022). 10.1109/CONECCT55679.2022.9865796.
- 38.Mengi, R., Ghorpade, H. & Kakade, A. Fine-tuning t5 and roberta models for enhanced text summarization and sentiment analysis. The Great Lakes Botanist12, 856 (2023). [Google Scholar]
- 39.Liu, Y., Wang, S. & Yu, S. A bullet screen sentiment analysis method that integrates the sentiment lexicon with roberta-cnn. Electronics13, 20. 10.3390/electronics13203984 (2024). [Google Scholar]
- 40.Botunac, I., Brkić Bakarić, M. & Matetić, M. Comparing fine-tuning and prompt engineering for multi-class classification in hospitality review analysis. Appl. Sci.14, 14. 10.3390/app14146254 (2024). [Google Scholar]
- 41.Nabiilah, G. Z. Effectiveness analysis of roberta and distilbert in emotion classification task on social media text data. Eng. MAth. Comput. Sci. J. (EMACS)7(1), 47–52 (2025). [Google Scholar]
- 42.Labib, F. H., Elagamy, M. & Saleh, S. N. Emoberta-x: advanced emotion classifier with multi-head attention and des for multilabel emotion classification. Big Data Cogn. Comput.9, 2. 10.3390/bdcc9020048 (2025). [Google Scholar]
- 43.Abdulghani, A.Q., UCAN, O.N. & Alheeti, K.M.A. Credit card fraud detection using xgboost algorithm. In 2021 14th International Conference on Developments in eSystems Engineering (DeSE) 487–492 (2021). 10.1109/DeSE54285.2021.9719580.
- 44.Zhang, Y., Tong, J., Wang, Z. & Gao, F. Customer transaction fraud detection using xgboost model. In 2020 International Conference on Computer Engineering and Application (ICCEA) 554–558 (2020). 10.1109/ICCEA50009.2020.00122.
- 45.Bokolo, B. G. & Liu, Q. Advanced algorithmic approaches for scam profile detection on instagram. Electronics13, 8. 10.3390/electronics13081571 (2024). [Google Scholar]
- 46.Li, C., Rao, J. & Zhang, Q. LLM-enhanced XGBoost-driven fraud detection and classification framework. Int. J. Multidiscipl. Res. Growth Eval.6(1), 1987–1990. 10.54660/.IJMRGE.2025.6.1.1987-1990 (2025). [Google Scholar]
- 47.Fuhnwi, G.S., Revelle, M. & Izurieta, C. Improving network intrusion detection performance : An empirical evaluation using extreme gradient boosting (xgboost) with recursive feature elimination. In 2024 IEEE 3rd International Conference on AI in Cybersecurity (ICAIC) 1–8 (2024). 10.1109/ICAIC60265.2024.10433805.
- 48.Gohil, N. P. & Meniya, A. D. Click ad fraud detection using xgboost gradient boosting algorithm. In Comput. Sci. Commun. Secur. (eds Chaubey, N. et al.) 67–81 (Springer, Cham, 2021). [Google Scholar]
- 49.Quinlan, J. R. Induction of decision trees. Mach. Learn.1(1), 81–106. 10.1007/BF00116251 (1986). [Google Scholar]
- 50.Peng, C.-Y.J. & Lee, K. L. An introduction to logistic regression analysis and reporting. J. Educ. Res.96(1), 3–14. 10.1080/00220670209598786 (2002). [Google Scholar]
- 51.Cortes, C. & Vapnik, V. Support-vector networks. Mach. Learn.20(3), 273–297. 10.1007/BF00994018 (1995). [Google Scholar]
- 52.Chen, T. & Guestrin, C. Xgboost: A scalable tree boosting system. In Proceedings of the 22nd ACM SIGKDD International Conference on Knowledge Discovery and Data Mining. KDD ’16, pp. 785–794. Association for Computing Machinery, New York, NY, USA. 10.1145/2939672.2939785 (2016).
- 53.Girgis, S., Amer, E. & Gadallah, M. Deep learning algorithms for detecting fake news in online text. In 2018 13th International Conference on Computer Engineering and Systems (ICCES) 93–97 (2018). 10.1109/ICCES.2018.8639198.
- 54.Liu, W., Jing, W. & Li, Y. Incorporating feature representation into bilstm for deceptive review detection. Computing102(3), 701–715. 10.1007/s00607-019-00763-y (2020). [Google Scholar]
- 55.Vaswani, A. et al. Attention is all you need. Adv. Neural Inf. Process. Syst.30, 856 (2017). [Google Scholar]
Associated Data
This section collects any data citations, data availability statements, or supplementary materials included in this article.
Data Availability Statement
The data that support the findings of this study are available from the corresponding author upon reasonable request.