

Abstract
A new finite multi-layer model coupled with real gas law is successfully established using statistical physics theory and applied to theoretically characterize the docking process of vanillin key food odorant on human hOR8H1, chimpanzee cOR8H1, and horse hoOR8H1 olfactory receptors. To deeply comprehend and analyze the mechanism of adsorption involved in the sense of smell, stereographic, van der Waals, and energetic metrics are interpreted. Indeed, modeling findings reveal that the vanillin molecules are non-parallelly docked on the binding sites of the three mammalian olfactory receptors. The van der Waals parameters serve as valuable tools for assessing the stability of the formed complexes during adsorption. The molar adsorption energy values, ranging from 18.26 to 20.75 kJ/mol, suggest that the vanillin molecules are exothermically-physisorbed on hOR8H1, cOR8H1, and hoOR8H1. In addition, the energetic parameter may also be deployed to quantitatively characterize the interactions between the vanillin molecules and the three mammalian receptors.
Keywords: Adsorption, Statistical physics theory, Finite multi-layer model coupled with real gas law, Threshold concentration
Subject terms: Biochemistry, Computational biology and bioinformatics, Physics
Introduction
The detection of a wide range of smells begins when odorants, particularly those relevant to food aroma such as key food odors (KFOs), interact with G protein-coupled receptors (GPCRs) in the mammalian nasal cavity1. These receptors are encoded by approximately 400 olfactory receptor genes in humans2,3. Olfactory receptors can be narrowly tuned to specific odors4,5 or more broadly tuned6–9. At the receptor level, the interaction of appropriate stimuli frequently follows a combinatorial code. This means that an individual olfactory receptor can identify numerous odorants, and an individual odorant can be detected by multiple olfactory receptors10,11, which is leading to specific activity patterns in the olfactory central nervous system12. Dunkel et al.13 have approximately demonstrated that 230 aroma-relevant key food odors (KFOs) are both sufficient and necessary olfactory stimuli to elicit the aroma-typical chemosensory percepts associated with most foods13. Moreover, several studies including those by this group and others, have consistently shown that KFOs serve as the most effective natural agonists for several vertebrate and invertebrate olfactory receptors such as OR2W1, OR1A1, MhOR5, mOR-EG,… etc.4,5,13–18.
Vanillin, the primary component found in vanilla, imparts a sweet aromatic flavor. It is classified as an aldehyde that can replace vanilla extract. Vanillin was identified in various food products encompassing chocolate, ice cream, cake, dairy products, and others. Hence, according to Dunkel et al.13, this vanilla odorant is categorized as a key food odorant (KFO). This can be attributed to the application of three stringent criteria13 for the inclusion of aroma compounds in their meta-analysis: (1) determining the most potent odorants in serially diluted aroma extracts through activity-based localization using gas chromatography olfactometry; (2) identifying key odorants by comparing mass spectrometric data, chromatographic retention times, and sensory information; and (3) conducting thorough quantitative analyses of all key food odorants using analytical techniques.
Even though a quantitative number of odorants have been discovered for various olfactory receptors, many of these receptors have not been widely investigated especially in species other than humans and mice. For example, the chimpanzee cOR8H1 and horse hoOR8H1, which are orthologs of human hOR8H1, have not been characterized because they lack X-ray crystal structures. Hence, it may then be deduced that characterizing an olfactory receptor is only possible with a non-destructive modeling method. In this case, theoretical study is a challenge due to the lack of morphological and crystallographic frameworks of the tested olfactory receptors to understand the mechanism of the olfactory perception at a molecular level. In this context, vanillin KFO plays a crucial role in the olfactory perception of humans, chimpanzees, and horses. The choice of vanillin as a stimulus for the three olfactory receptors is not arbitrary, due to several key reasons. Firstly, vanillin, which is the primary component of vanilla extract, has a distinct and well-recognized smell. Secondly, it is known to interact with certain olfactory receptors, particularly those involved in detecting sweet or vanilla-like scents, such as mouse mOR-EG and human OR10G4. Finally, this KFO is generally recognized as safe for mammalian exposure, which makes it a suitable and ethical choice for research. Thus, these characteristics make vanillin a practical and effective choice for investigating olfactory receptor response.
In detail, many biologists have studied several vertebrate and invertebrate concentration–response curves of KFOs using many classical models, including Biedler and Hill. These theoretical models are deployed to obtain a quick and preliminary analysis of the olfactory responses of KFOs on different olfactory receptors in terms of maximum response and half saturation concentration19. However, these models do not permit a theoretical characterization of the studied olfactory systems. Previous theoretical models14–16 have utilized statistical physics to study the docking process of odorants on olfactory receptors of vertebrates and invertebrates under ideal conditions. In this work, a novel approach is introduced to investigate the olfactory perception of vanillin molecules on human hOR8H1, chimpanzee cOR8H1, and horse hoOR8H1 receptors by focusing on their different olfactory threshold concentrations. The threshold concentration (Cth) for the olfactory response is estimated and analyzed using statistical physics methods. Notably, to the best of human knowledge, this is the first application of the statistical physics theory to the three mammalian olfactory systems, considering the effect of olfactory threshold concentration. Hence, to properly understand the olfactory perception at a molecular level, a new model coupled with real gas law is performed to offer an advanced microscopic and macroscopic analysis of the olfaction mechanism.
This study offers innovative and novel theoretical insights into the docking process of vanillin on three mammalian olfactory receptors, which could be applicable to various olfactory systems.
Materials and methods
Chemicals
The following chemicals, which are purchased from Sigma-Aldrich, are used: DMEM(#D6429), FBS (#F7524), L-glutamine (#G2150), penicillin/streptomycin (#P4458), calcium chloride dihydrate CaCl2(#C5670), D-glucose (#158,968), dimethyl sulfoxide DMSO (#472,301), HEPES (#H4034), potassium chloride KCl (#60,142), sodium chloride NaCl (#S3014), and beetle luciferin sodium salt or D-Luciferin sodium salt(#L6882).
The following odorant is used: 4-hydroxy-3-methoxybenzaldehyde(vanillin; CAS: 106–24-1) (#W250716).
Cloning of olfactory receptors
The molecular cloning of olfactory receptors involves several steps. The protein-coding regions of human hOR8H1, chimpanzee cOR8H1, and horse hoOR8H1 are amplified from genomic DNA via PCR (polymerase chain reaction) using specific primers. These regions are then ligated into an expression plasmid using T4-DNA ligase and EcoRI/NotI enzymes. The constructs are confirmed through Sanger sequencing. The DNA of chimpanzees and horsesis sourced from saliva samples. Additionally, in this study, all human olfactory receptor coding regions are cloned and ligated into the pFN210A expression plasmid and purified using a PureYield plasmid midiprep system.
Cell culture
In the present experiments, a cloned derivative human embryonic kidney cell line (HEK-293 cells), which are originally derived from human embryonic kidney cells grown in tissue culture and obtained from ATCC (#CRL-1573), is used as the experimental platform for assessing the functional expression of recombinant olfactory receptors. These cells are cultured under standard conditions at 37 °C with 100% humidity, and 5% CO2 in Dulbecco’s Modified Eagle Medium (DMEM) supplemented with 4.5 g/L D-glucose, 10% fetal bovine serum (FBS), 2 × 10⁻³ mol/L L-glutamine, 100 U/mL streptomycin, and 100 U/mL penicillin.
Luminescence assay
For luminescence experiments, cells are seeded in a 96-well plate format at a density of 12,000 cells per well. The following day, transfection is carried out using ViaFect™ Transfection Reagent (Promega) with 20 ng/well of the corresponding plasmid-DNA and 10 ng of each of the following: the G protein subunit Gαolf, the transport protein RTP1S2, and the pGloSensor™-22F5 (Promega) per well. The pGloSensor™-22F is a luciferase enzyme engineered with a cAMP binding pocket, enabling the immediate measurement of a luminescence signal dependent on cAMP levels. As a control, transfection is carried out using the vector plasmid pFN210A, which lacks coding information for an olfactory receptor, along with plasmid-DNA encoding RTP1S, cAMP-luciferase, and Gαolf. The transfected plasmid-DNA amount is kept consistent between cells, which are transfected with olfactory receptor and those transfected with the mock control. Luminescence assays are conducted 42 h post-transfection. Prior to experimentation, cells are incubated with a physiological salt buffer (pH 7.5) containing 10 × 10–3 mol/L HEPES (4-(2-hydroxyethyl)-1-piperazineethanesulfonic acid), 140 × 10–3 mol/L NaCl, 10–3 mol/L CaCl2, 10 × 10–3 mol/L glucose, 5 × 10⁻³ mol/L KCl, and 2% beetle luciferin sodium salt (Promega). Luminescence measurements are performed using the GloMax® Discover instrument (Promega). After a one-hour dark incubation period, the basal luminescence signal of each well is recorded. Subsequently, the odorant, which is serially diluted in the physiological salt buffer, is applied to the cells. Vanillin stock solutions are prepared in DMSO and diluted 1:1000 in the physiological salt buffer to achieve a final DMSO concentration of 0.1% on the cells. For each well, the real-time luminescence signals are measured four minutes after the odorant application.
Responsiveness of human hOR8H1, chimpanzee cOR8H1, and horse hoOR8H1 to vanillin KFO
To explore the relationship between the equilibrium concentration of odorant and the olfactory response, the interaction between the tested odorant and the three mammalian olfactory receptors is modeled as an adsorption process, assumed to be the main part of the olfactory detection mechanism. Accordingly, the concentration–response data of vanillin KFO on human hOR8H1, chimpanzee cOR8H1, and horse hoOR8H1, each representing a distinct adsorption system, are plotted in Fig. 1a. Indeed, the experimental concentration–response curves of human hOR8H1, chimpanzee cOR8H1, and horse hoOR8H1, activated by vanillin KFO, show concentrations over a range from 10–7 to 10–3 mol/L.
Fig. 1.

Experimental concentration-olfactory response curves of vanillin on human hOR8H1 (gray symbol), chimpanzee cOR8H1 (orange symbol), and horse hoOR8H1 (yellow symbol) at 295 K (a) and fitted data using the finite multi-layer model (L = 1) (b).
Theoretical background
In theory, classical adsorption equations offer a potential avenue for mathematical modeling adsorption systems. However, their limited scope often fails to provide significant insights into the underlying adsorption mechanisms. For instance, the famous Langmuir model assumes that the adsorbent can form a mono-layer with the adsorbate molecules as one molecule per binding site under any experimental condition. Assuming that only one odorant molecule is docked on one receptor binding site (n = 1), the olfactory system follows the Beidler model, which is equivalent to the Langmuir model. This model describes the olfactory response as a function of the stimulus concentration in solution (e.g., mucus). It involves only two fitting parameters: maximum response and concentration at half-maximal response. However, this model provides an incomplete representation of the odorant adsorption process, as it neglects the stoichiometric coefficient n, which plays a critical role in characterizing and interpreting the adsorption equilibrium. The incorporation of statistical physics models with experimental data can be considered a solution to better characterize the equilibrium of adsorption, assess adsorbent performance, and understand the docking mechanism of specific adsorbate-adsorbent systems such as odorant-olfactory receptor systems.
In fact, the theoretical development of statistical physics models necessitates considering certain assumptions. One such assumption posits that the reservoir of vanillin molecules in solution serves as a reservoir of particles in equilibrium with the olfactory receptor surface. Consequently, it is postulated that the system under study adheres to a grand canonical situation20.
This section is designed to introduce the equation of the physical model. It is worth noting that adsorption onto an adsorbent surface typically occurs in two ways: either as a mono-layer, such as the Langmuir or Hill models, or as a multi-layer process with multiple layers (designated as L layers). For instance, in the B.E.T model, L tends toward infinity. In this study, a finite multi-layer model with one type of binding site occupancy is established.
The equilibrium of the adsorption reaction is represented by the adsorption reaction. Hence, the docking reaction involving the free phase (vanillin) and the adsorbed state (vanillin-olfactory receptor binding site) is succinctly expressed in the following equation:
| 1 |
where V represents the vanillin molecule; n is a stoichiometric coefficient, L denotes the number of formed layers, S is the human, chimpanzee, or horse olfactory receptor binding site, and VLn-S is the complex formed during the adsorption reaction. The overall nature of the adsorption process, whether it is a multi-interaction process (n < 1) or a multi-molecular process (n ≥ 1), is determined via the parameter n, which specifies the number of vanillin molecules per site21.
As mentioned above, the theoretical modeling of concentration–response curves necessitates employing the grand canonical ensemble. Following this approach, it may initiate from defining the grand canonical partition function, which characterizes the microscopic states of the investigated olfactory systems. Thus, it is presumed that each formed layer is associated with an adsorption energy level (E). Additionally, the occupation number Ni may be employed to denote the situation in which the studied olfactory receptor site is placed. Consequently, it may be noted that a binding site can be vacant (Ni = 0), occupied by one layer (Ni = 1), and so forth up to L layers (Ni = L). The grand canonical partition function for a single binding site is expressed as follows14:
| 2 |
where β is the Boltzmann factor (β = 1/kBT).
To incorporate the influence of lateral interactions among vanillin molecules, the chemical potential μr of the target odorant, which is assumed to behave as a real gas under the van der Waals approximation, can be represented as follows16,22:
| 3 |
where μr is the real gas chemical potential, which is applied in the study of the adsorption problem, μi is the ideal gas chemical potential while N is the number of vanillin molecules. The co-volume b as well as the pressure of cohesion a are utilized to show the expression of lateral interactions that encompass the odorant molecules at free state16,23.
The real gas chemical potential μr may also be expressed as a function of vanillin equilibrium concentration (C—Cth) as follows:
| 4 |
where
| 5 |
where Cth is the threshold concentration and S is the vanillin solubility in aqueous solution.
The subsequent step in the statistical physics methodology involves computing the occupancy number No expressed as follows20:
| 6 |
where D is the density or number of the effectively occupied binding sites of human, chimpanzee, and horse olfactory receptors.
Using Eq. 2 and Eq. 4, the occupation number No, relative to the finite multi-layer model, can be expressed as follows:
| 7 |
The occupation number No may also be written as a function of Em = E/n and μg = μr/n, which are the adsorption energy of an odorant molecule and the chemical potential in equilibrium state, respectively.
| 8 |
At half saturation, the energetic parameter XHS, which may be used to calculate the adsorption energy to energetically characterize the olfactory systems, can be given by the following expression:
| 9 |
where Cth is the threshold concentration, S is the vanillin solubility in aqueous solution, β is the Boltzmann factor, and T is the absolute temperature (~ 295 K), and Em the adsorption energy of an odorant molecule in equilibrium state.
Ultimately, the theoretical formulations of the olfactory response Rolfactory, corresponding to the finite multi-layer model coupled with real gas considerations, can be derived by multiplying the transduction coefficient α (specifically an olfactory response is registered when α = 1 and none when α = 0) with the occupation number No as follows20:
| 10 |
| 11 |
where RM = α × No.
The olfactory response expression may also be written as follows:
 |
12 |
From Eq. 12, it is possible to observe that the theoretical expression of the finite multi-layer model coupled with real gas law involves seven physico-chemical parameters. These parameters can be classified as stereographic (the number of layers of vanillin L, the maximum olfactory response RM, and the number of vanillin molecules docked on one binding site n), energetic (the energetic parameters XHS and Cth), and van der Waals (the cohesion pressure a and the co-volume b).
According to Eq. 9, the energetic parameter XHS may also be written as a function of the molar adsorption energy ΔE as follows23:
| 13 |
where S is the vanillin solubility in aqueous solution, R is the ideal gas constant, and T is the absolute temperature (~ 295 K).
In this study, the statistical physics simulation of the different olfactory responses is limited to ten layers (i.e., L = 10) via the application of the finite multi-layer model coupled with real gas law (Eq. 12).
Modeling results and discussion
Modeling results
A numerical computer program is employed to assess the performance of the finite multi-layer model (from L = 1 to L = 10) on the experimental concentration–response curves, i.e., the evaluation of the coherence between the adsorption model and the experimental data24,25. The numerical fitting is realized using a multi-variable non-linear regression program “Origin 8.5”23,24. The correlation coefficient (R2), the root mean square error coefficient (RMSE), and the Akaike information criterion coefficient (AIC) are deployed as standardized measures of the goodness of fit. To determine the suitable statistical physics model, these three adjustment coefficients may be considered:
1. The coefficient RMSE is the lowest.
2. The coefficient R2 is the highest.
3. The coefficient AIC is the lowest.
The numerical values of R2, RMSE, and AIC are presented in Table 1. Based on the outcomes, the finite multi-layer model (L = 1) appears suitable for analyzing the vanillin olfactory responses on hOR8H1, cOR8H1, and hoOR8H1. This choice is based on R2 values, which are the closest to unity, and RMSE and AIC values, which are the lowest. The obtained plots show sigmoid shapes, which allow predicting that the most probable adequate model is a mono-layer model20. So, the statistical physics simulation of the different olfactory responses is limited to ten layers to justify the previous prediction. However, other systems with different forms of experimental data may use this model. Furthermore, the fitted parameter values of the selected model for human, chimpanzee, and horse olfactory systems are presented in Table 2. The adjustment of vanillin concentration–response curves, according to the finite multi-layer model (L = 1), is depicted in Fig. 1b.
Table 1.
Values of R2, RMSE, and AIC deduced from the adjustment of the experimental data of the three olfactory systems with the finite multi-layer model (from L = 1 to L = 10).
| Olfactory system | Vanillin-hOR8H1 | Vanillin-cOR8H1 | Vanillin-hoOR8H1 |
|---|---|---|---|
| Correlation coefficient R2 | |||
| L = 1 | 0.99955 | 0.99911 | 0.99730 |
| L = 2 | 0.99883 | 0.99865 | 0.99650 |
| L = 3 | 0.99847 | 0.99822 | 0.99615 |
| L = 4 | 0.99655 | 0.99634 | 0.99576 |
| L = 5 | 0.99642 | 0.99540 | 0.99428 |
| L = 6 | 0.99525 | 0.99412 | 0.99405 |
| L = 7 | 0.99310 | 0.99302 | 0.99379 |
| L = 8 | 0.99289 | 0.99244 | 0.99163 |
| L = 9 | 0.99145 | 0.99113 | 0.99122 |
| L = 10 | 0.99122 | 0.99077 | 0.99064 |
| Residual root mean square error coefficient RMSE | |||
| L = 1 | 0.01254 | 0.01488 | 0.02245 |
| L = 2 | 0.01987 | 0.02446 | 0.02616 |
| L = 3 | 0.02577 | 0.02899 | 0.03698 |
| L = 4 | 0.04685 | 0.05120 | 0.05517 |
| L = 5 | 0.04998 | 0.05768 | 0.06122 |
| L = 6 | 0.05445 | 0.05892 | 0.06355 |
| L = 7 | 0.07125 | 0.07214 | 0.07994 |
| L = 8 | 0.07785 | 0.08454 | 0.08867 |
| L = 9 | 0.09475 | 0.09575 | 0.09788 |
| L = 10 | 0.09845 | 0.09915 | 0.09990 |
| Akaike Information Criterion coefficient AIC | |||
| L = 1 | 1.24572 | 2.54870 | 3.44775 |
| L = 2 | 3.12548 | 3.99545 | 4.11246 |
| L = 3 | 3.54545 | 5.69744 | 7.69448 |
| L = 4 | 5.25870 | 6.22550 | 7.98845 |
| L = 5 | 7.24587 | 6.88117 | 9.77111 |
| L = 6 | 7.65884 | 7.98786 | 10.1252 |
| L = 7 | 8.02650 | 8.22981 | 10.8745 |
| L = 8 | 9.47556 | 10.7465 | 13.3470 |
| L = 9 | 10.2458 | 11.8712 | 14.5546 |
| L = 10 | 14.6587 | 15.9877 | 17.6994 |
Table 2.
Modeling values of stereographic, van der Waals, and energetic parameters using the finite multi-layer model (L = 1).
| Olfactory system | Vanillin-hOR8H1 | Vanillin-cOR8H1 | Vanillin-hoOR8H1 |
|---|---|---|---|
| RM (a, u) | 1.00 ± 0.006 | 0.45 ± 0.005 | 0.24 ± 0.01 |
| n | 1.58 ± 0.03 | 1.44 ± 0.08 | 1.02 ± 0.05 |
| a(J L/mol) | 3.15 × 10⁻¹⁹ ± 1.22 × 10⁻²⁰ | 5.44 × 10⁻¹⁹ ± 1.45 × 10⁻²⁰ | 8.16 × 10⁻¹⁹ ± 4.28 × 10⁻²⁰ |
| b(L/mol) | 9.49 × 10⁻¹⁷ ± 3.12 × 10⁻¹⁸ | 6.41 × 10⁻¹⁷ ± 2.78 × 10⁻¹⁹ | 4.50 × 10⁻¹⁷ ± 3.20 × 10⁻¹⁸ |
| Cth (mol/L) | 2.07 × 10⁻⁷ ± 2.14 × 10⁻⁸ | 2.22 × 10⁻⁷ ± 4.28 × 10⁻⁸ | 2.11 × 10⁻⁶ ± 2.37 × 10⁻⁷ |
| XHS (mol/L) | 9.71 × 10⁻⁶ ± 2.21 × 10⁻⁷ | 1.45 × 10⁻⁵ ± 6.56 × 10⁻⁷ | 2.84 × 10⁻⁵ ± 1.67 × 10⁻⁶ |
| ΔE (kJ/mol) | 20.75 ± 0.54 | 19.75 ± 0.75 | 18.26 ± 0.89 |
Stereographic analysis
The parameters n and RM serve as stereographic physico-chemical parameters15. These parameters are associated with the mono-layer adsorption capacity, putatively involved in the mammalian olfactory perception.
The role of n is to estimate the number of vanillin molecules that may be docked on one human hOR8H1, chimpanzee cOR8H1, and horse hoOR8H1 binding site. Therefore, a value of n superior to one indicates an enhanced ability to accommodate numerous vanillin molecules on a single binding site.
According to Table 2, it is evident that the values of n for the three olfactory systems are found to be superior to one. This observation leads to the conclusion that vanillin adsorption is governed by a multi-molecular mechanism, i.e., aggregation phenomenon occurs during the putative process of adsorption. Indeed, the findings of this modeling show values of n between 1 and 2, which is the result of an aggregation phenomenon14, and the vanillin molecules are arranged non-parallelly on the surface of the three olfactory receptors. The aggregation of two vanillin molecules occurs due to the formation of a hydrogen bond between an oxygen atom in the carbonyl group (C = O) and a hydrogen atom in the hydroxyl group (O–H). The studied olfactory receptors cannot be characterized using spectroscopic technique. Hence, it may then be deduced that characterizing an olfactory receptor is only possible with a non-destructive modeling method16.
When the number of odorant molecules per site is equal or greater than 1, a binding site can be occupied by one or more molecules. In this scenario, it can be assumed that the molecules are adsorbed non-parallelly on the receptor surface. Although n is normally an integer, the fitted values are not, as they represent an average of some successive integers. To simplify, n may be treated as an average of the two closest integer values, 1 and 2. Indeed, the connection between the percentage of a single docking process as one molecule per binding site denoted as x and the double docking process as two-aggregated molecules per binding site represented by 1-x can be mathematically expressed by the following equation26:
| 14 |
For vanillin-hOR8H1 system: x × 1 + (1—x) × 2 = 1.58, it is found that x is equal to 0.42 and 1—x is equal to 0.58. Hence, 42% and 58% of vanillin molecules are adsorbed as one- and two-aggregated vanillin molecule(s) on one human hOR8H1 binding site, respectively.
For vanillin-cOR8H1 system: x × 1 + (1—x) × 2 = 1.44, it is found that x is equal to 0.56 and 1—x is equal to 0.44. It may then be deduced that 56% and 44% of vanillin molecules are docked as one- and two-aggregated KFO molecule(s) on one chimpanzee cOR8H1 binding site, respectively.
For vanillin-hoOR8H1 system: x × 1 + (1—x) × 2 = 1.02, it is found that x is equal to 0.98 and 1—x is equal to 0.02. Thus, 98% and 2% of vanillin molecules are adsorbed as one- and two-aggregated vanilla odor molecule(s) on one horse hoOR8H1 binding site, respectively.
On the other hand, the parameter RM represents the maximum olfactory response of the studied olfactory receptors. According to statistical physics theory, the maximum olfactory response may be expressed as16,25:
 |
15 |
After the olfactory threshold, i.e., C > Cth, the transduction coefficient α is equal to one and an olfactory response is registered. However, no olfactory response is observed in the opposite case.
The parameter D denotes the density of occupied binding sites of human, chimpanzee, and horse olfactory systems, providing insights into the number of sites accessible for occupation by the studied odorant at saturation. Consequently, an increase in RM corresponds to an augmentation in the quantity of formed complexes.
Furthermore, Table 2 indicates that the fitted values of RM show the following behaviors:
RM (hOR8H1) = 1.00 (a, u) > RM (cOR8H1) = 0.45 (a, u) > RM (hoOR8H1) = 0.24 (a, u).
The above difference in the behavior of the olfactory response at the saturation level for the three olfactory systems may be explained by the type of interactions such as van der Waal, hydrogen bonds(conventional hydrogen bond and carbon hydrogen bond), and hydrophobic (alkyl, sigma-alkyl, and pi-alkyl,…etc.)16. These weak interactions may occur between the vanilla molecules and some of the amino acid residues that form the tested olfactory receptors.
From the above stereographic results, it may be deduced that the value of RM is maximal when the value of n is maximal, i.e., the higher the degree of aggregation.
Lateral interaction analysis
The van der Waals parameters a and b serve as valuable tools for assessing the stability of the formed complexes during the process of adsorption23. The cohesion pressure a denotes the lateral interaction between the vanillin molecules in mucus. Consequently, a higher value of a indicates a stronger vanillin-vanillin interaction, making the mucus more attractive for the vanillin particles than the olfactory receptor surface. As a result, the olfactory response is reduced. Therefore, the olfactory system that presents the lowest value of a is the most stable. It is important to highlight that the co-volume b has an opposing effect on the docking process compared to the cohesion pressure a. Hence, a higher value of b suggests a higher distance between vanillin molecules thereby facilitating the docking process and expanding the olfactory response. Consequently, the olfactory system, which displays the highest value of b, is the most suitable for vanillin adsorption.
From Table 2, it can be noted that the human olfactory system shows the lowest value of a and the highest value of b: a (vanillin-hOR8H1) < a (vanillin-cOR8H1) < a (vanillin-hoOR8H1) and b (vanillin-hOR8H1) > b (vanillin-cOR8H1) > b (vanillin-hoOR8H1). It may then be deduced that the lateral interactions between the vanillin molecules during the docking process are the lowest in the case of vanillin-hOR8H1system. The above analysis is in good agreement with the experimental data illustrated in Fig. 1. However, it necessitates strong validation through the calculation of the molar adsorption energies for the three olfactory systems.
Energetic analysis
The threshold concentration is an energetic parameter that typically marks the point where the energy required for adsorption shifts. This affects the adsorption capacity of vanillin molecules, reflecting the balance between the concentration of the KFO and the binding energy. It is a critical parameter in the context of vanillin-hOR8H1/cOR8H1/hoOR8H1 recognition and receptor activation. Notably, Cth values are found to be distinct for hOR8H1, cOR8H1, and hoOR8H1. Therefore, the little difference in the genome sequence of hOR8H1 and its orthologs cOR8H1 and hoOR8H1 can provide the difference in olfactory threshold and adsorption capacity.
It may be deduced from Table 2 that the olfactory receptor which presents the greatest olfactory threshold concentration Cth, shows the highest half saturation concentration CHS.
The energetic investigation of the human, chimpanzee, and horse olfactory systems is also dependent on the nature of interaction between the vanillin KFO and the three olfactory receptors. Indeed, the identification and description of the type of interaction is carried out via the calculation of the molar adsorption energies.
The XHS representing an energetic parameter is related to the molar adsorption energy of the vanillin molecule on the surface of the human, chimpanzee, and horse olfactory receptors from the dissolved state. The values of the different molar adsorption energies ΔE may then be calculated by referring to the following expression23,27:
| 16 |
By fitting experimental concentration–response curves, the concentration XHS may be estimated. From Table 2, it may be noted that the values of XHS are slightly different for the three studied systems. According to Eq. 16, it may be noted that the higher the XHS, the lower the ΔE, and the weaker the interaction between the vanillin molecule and the olfactory receptor.
On the one hand, the molar adsorption energy value may be positive or negative. A positive ΔE value indicates that the odorant molecule releases energy to the mucus during the mechanism of adsorption resulting in an exothermic process. In such cases, the interaction between the odorant molecule and the olfactory receptor is higher than that with the mucus. Conversely, a negative ΔE value suggests that the odorant molecule absorbs energy from the mucus to facilitate its adsorption on the olfactory receptor. This leads to an endothermic adsorption process. Consequently, the interaction of this odorant with the mucus is higher than that with the olfactory receptor.
On the other hand, ΔE value may be superior or inferior to 40 kJ/mol22–25,28,29. A ΔE value superior to 40 kJ/mol indicates that the adsorption is a chemisorption process22–25,28,29, which occurs via strong interactions such as covalent and ionic23. A ΔE value inferior to 40 kJ/mol suggests that the adsorption is a physisorption process22–25,28,29, which occurs via weak interactions such as van der Waals, hydrogen bond, hydrophobic, etc.23,25. Physical adsorption (physisorption) is typically a reversible process, indicating weak interactions between the adsorbate (vanillin) and the adsorbent (olfactory receptor).
, and allowing for the possibility of desorption. The nature of the interaction can often be inferred from the magnitude of the adsorption energy. For example, hydrogen bonding usually exhibits adsorption energies below 30 kJ/mol23. Other physisorption mechanisms include hydrophobic interactions (~ 5 kJ/mol), van der Waals forces (from 4 to 10 kJ/mol), dipole interactions (from 2 to 29 kJ/mol), and coordination exchange (~ 40 kJ/mol)23.
From Table 2, it may be noted that all ΔE values, relative to human, chimpanzee, and horse olfactory systems, are positive and inferior to 21 kJ/mol (ranging from 18.26 to 20.75 kJ/mol). These energetic findings show that the putative mechanism of adsorption, which is involved in olfactory perception, is an exothermic and physisorption process.
Theoretical characterization of hOR8H1, cOR8H1, and hoOR8H1
The energetic characterization of human hOR8H1, chimpanzee cOR8H1, and horse hoOR8H1, activated by vanillin KFO, may be realized via the estimation of the site energy distribution (SED) using the finite multi-layer model (L = 1) coupled with real gas law and the Polanyi expression30.
The Polanyi expression may be expressed as16,30:
| 17 |
where C is the odorant equilibrium concentration and S is the vanillin solubility in aqueous solution.
The solubility can be written as a function of the energetic parameter XHS and the molar adsorption energy ΔE as:
| 18 |
According to previous studies31,32, the site energy distribution  may then be given by the following expression:
| 19 |
Figure 2 depicts the site energy distribution (SED) as a function of the adsorption energy for human, chimpanzee, and horse olfactory systems. It may be noted from this plot that the three distributions show Gaussian shapes. The different distributions may be divided into three sections:
1) For E < Em, the SED function sharply increases with rising site adsorption energy (E) until reaching the energy corresponding to the peak Em. This suggests that a relatively smaller fraction of vanillin molecules docked on binding sites with lower energy.
2) For E > Em, the SED function initially decreases rapidly followed by a slower decline toward 0 as E increases. This trend indicates that the proportion of binding sites with very high energy is minimal. KFO molecules tend to occupy binding sites with higher adsorption energy levels.
3) For E = Em, the highest site energy Em corresponds to the distribution peak indicating the highest frequency of occurrence. Hence, this peak corresponds to the main adsorption energy for all olfactory receptor binding sites or the molar adsorption energy ΔE previously calculated using the metrics involved in the finite multi-layer model (L = 1) coupled with real gas law.
Fig. 2.

Site energy distributions (SEDs) of human hOR8H1, chimpanzee cOR8H1, and horse hoOR8H1 activated by vanillin KFO.
Indeed, the SEDs of the different mammalian olfactory systems are spread out from 10 to 30 kJ/mol for human hOR8H1, from 10 to 28 kJ/mol for chimpanzee cOR8H1, and from 8 to 28 kJ/mol for horse hoOR8H1. The corresponding adsorption energy bands are situated between 16.19 and 25.30 kJ/mol, between 15.14 and 24.50 kJ/mol, and between 12.43 and 24 kJ/mol, respectively. At the end of this section, it may then be deduced that these adsorption energy spectrums exhibit three bands of energies activated by vanillin molecules in human, chimpanzee, and horse olfactory perceptions.
Based on the vibrational theories proposed by Dyson, Wright, and Turin16, it may then be deduced that the approximate adsorption energy bands (SED bands) associated with the docking of vanillin on hOR8H1, cOR8H1, and hoOR8H1 can be interpreted as corresponding to vibrational modes involved in the olfactory process. These modes are likely responsible for the perception of distinct odors within the olfactory system. Consequently, these adsorption energy bands may serve as vectors of the olfactory signal, enabling specific characterization of the olfactory response. Based on this energetic analysis, the approximate olfactory bands for vanillin KFO docked on hOR8H1, cOR8H1, and hoOR8H1, can be defined as the SED bands, ranging from 16.19 to 25.30 kJ/mol for hOR8H1, from 15.14 to 24.50 kJ/mol for cOR8H1, and from 12.43 to 24 kJ/mol for hoOR8H1.
Thermodynamic study
To gain a deeper understanding of the macroscopic phenomena observed during the docking of vanillin KFO on hOR8H1, cOR8H1, and hoOR8H1, the variations in internal energy, adsorption entropy, Gibbs free energy, and enthalpy are analyzed as function of odorant concentration (Fig. 3).
Fig. 3.

Behavior of the internal energy (a), adsorption entropy (b), Gibbs free energy (c), and enthalpy (d) for vanillin KFO adsorption on human hOR8H1, chimpanzee cOR8H1, and horse hoOR8H1 at 295 K.
Internal energy
To investigate the interactions between vanillin molecules and human hOR8H1, chimpanzee cOR8H1, and horse hoOR8H1, the internal energy Eint is estimated using the statistical physics theory as follows33:
| 20 |
The internal energy analytical expression may be calculated using Eq. 20, and the grand partition function expression relative to the finite multi-layer model (L = 1) coupled with real gas law as follows:
 |
21 |
Figure 3a presents the behavior of the internal energy versus the concentration of vanillin in the case of human hOR8H1, chimpanzee cOR8H1, and horse hoOR8H1 olfactory receptors. It may be noted from this figure that all Eint values are negative indicating the exothermic nature of the putative mechanism of adsorption involved in the olfactory perception. At olfactory threshold, vanillin-hOR8H1/cOR8H1/hoOR8H1 interactions are strong since the internal energy starts by a maximum value. Subsequently, the internal energy exhibits a decrease as vanillin concentration increases showing a diminished interaction between the vanilla KFO and the mammalian olfactory receptor. Energetically speaking, it may also be deduced that the human olfactory system (vanillin-hOR8H1) is the most energetic.
Adsorption entropy
The information obtained from the adsorption entropy is crucial for the macroscopic characterization of the behavior of the docked KFO molecules. Thus, the entropy quantifies the disorder within an investigated olfactory system. This configurational entropy can be computed using the statistical physics theory as follows24,25,33,34:
| 22 |
The adsorption or configuration entropy expression may be estimated using Eq. 22 and the grand partition function expression relative to the finite multi-layer model (L = 1) by the following expression:
 |
23 |
Figure 3b depicts the behavior of the adsorption entropy versus the concentration of vanillin in the case of human hOR8H1, chimpanzee cOR8H1, and horse hoOR8H1 olfactory receptors. It can be seen from this figure that the entropy variations present similar shapes and show two trends before and after the values of the energetic parameters XHS-Cth.
From the olfactory threshold (at the beginning of the process of adsorption) until half saturation, the disorder increases with increasing vanillin concentration since there is a huge number of vacant binding sites, which offers KFO molecules numerous possibilities for being docked.
At half saturation, the disorder reaches its maximum at XHS-Cth. It may be noted that half of the binding sites are occupied at this critical point25.
From half saturation until the saturation phenomenon, an opposite behavior is observed since the number of empty binding sites decreases more and more. Hence, the odorant molecules possess low probability of finding empty binding sites and the disorder decreases until all the binding sites are fully occupied. The saturation is then reached, and the entropy attains zero.
Gibbs free energy
The Gibbs free energy G, another thermodynamic function, elucidates the spontaneity of the adsorption system under examination. The theoretical expression of G may be calculated using the theory of statistical physics as follows33:
| 24 |
The expression of G may be determined using Eq. 24 and the expression of the grand partition function relative to the finite multi-layer model (L = 1) as follows:
 |
25 |
Figure 3c illustrates the behavior of the Gibbs free energy versus the concentration of vanillin in the case of human hOR8H1, chimpanzee cOR8H1, and horse hoOR8H1 olfactory receptors. It can be seen from this figure that all G values are negative whence the mechanism of adsorption putatively involved in the sense of smell is spontaneous. The Gibbs free energy increases in algebraic value at the saturation showing that the lateral interactions prevent or hinder the docking process of vanillin molecules on binding sites at high concentration22. Lastly, it may also be noted that the human olfactory system (vanillin-hOR8H1) is the most spontaneous.
Enthalpy
Enthalpy H is a state function, similar to internal energy. Its value depends solely on the system’s initial and final states, independent of the process or path taken. It does not account for intermediate steps. Enthalpy reflects the total energy of a thermodynamic system, including internal energy. The theoretical expression of H may be calculated using the theory of statistical physics as follows33:
| 26 |
The expression of H may be estimated using Eq. 26 and the expression of the grand partition function relative to the finite multi-layer model (L = 1) as follows:
 |
27 |
The variation of system enthalpy with respect to vanillin concentration in the case of human hOR8H1, chimpanzee cOR8H1, and horse hoOR8H1 olfactory receptors is shown in Fig. 3d.
This figure demonstrates the evolution of the tested systems versus vanillin concentration. Since the values of the enthalpy H are negative, the change in enthalpy ΔH is also negative, indicating that the adsorption process putatively involved in the olfaction mechanism is exothermic35.
Molecular docking calculations
Molecular docking analysis is a well-established tool for evaluating the binding efficiency of a compound with its target receptor36. This technique enables the visualization of the intermolecular forces involved in the docking process, offering both 2D and 3D schematic representations of the interaction between the tested odorant and the olfactory receptor. In recent years, molecular docking has also proven to be a valuable complement to experimental and theoretical characterizations, aiding in the validation of a compound’s potential for biological, chemical, and pharmaceutical applications37–39.
The obtained stereographic findings may also be applied to improve the investigation of the docking mechanism of vanillin molecules on the three mammalian olfactory receptors, which show non-parallel orientations as one or two-aggregated molecules per binding site with different percentages. In this study, the docking mechanism of single vanillin and two-aggregated vanillin molecules on human hOR8H1, chimpanzee cOR8H1, and horse hoOR8H1 using structural data given from the AlphaFold Protein Structure Database is investigated: human hOR8H1 (https://alphafold.ebi.ac.uk/entry/Q8NGG4) (Fig. 4a), chimpanzee cOR8H1 (https://alphafold.ebi.ac.uk/entry/A0A2R9B715) (Fig. 4b), and horse hoOR8H1 (https://alphafold.ebi.ac.uk/entry/F6TM11) (Fig. 4c). Single vanillin and two-aggregated vanillin structures are obtained with .mol format using the ChemSketch (ACD/3DViewer). Docking calculations are conducted with the AutoDock Tools software40. The number of rotatable bonds (torsion number) is 3/32 for single vanillin (8/32 for two-aggregated molecules of vanillin). In addition, a grid box with dimensions of 40 × 40 × 40 points is defined along the X, Y, and Z axes. The binding sites of hOR8H1, cOR8H1, and hoOR8H1 are predicted and identified within restricted cubic grids (6.309 Å × 6.035 Å × -4.371 Å), (8.603 Å × 0.447 Å × -3.854 Å), and (-1.105 Å × -1.665 Å × 2.374 Å), respectively. The flexibility of the proteins (i.e., hOR8H1, cOR8H1, and hoOR8H1) is not taken into consideration, and only the ligands (i.e., single vanillin and two-aggregated vanillin molecules) are mobile. The interactions and binding affinities between single vanillin and two-aggregated vanillin molecules and amino acid residues of hOR8H1, cOR8H1, and hoOR8H1 are analyzed using the PMV program. Finally, 2D and 3D interaction diagrams illustrating the activation of hOR8H1, cOR8H1, and hoOR8H1 by single vanillin and two-aggregated vanillin molecules are generated using the Discovery Studio Visualizer program41,42. Indeed, comprehensive docking analysis is performed and visualized in both 2D and 3D formats to elucidate the molecular mechanism underlying vanillin’s excitatory potential on the studied receptors.
Fig. 4.
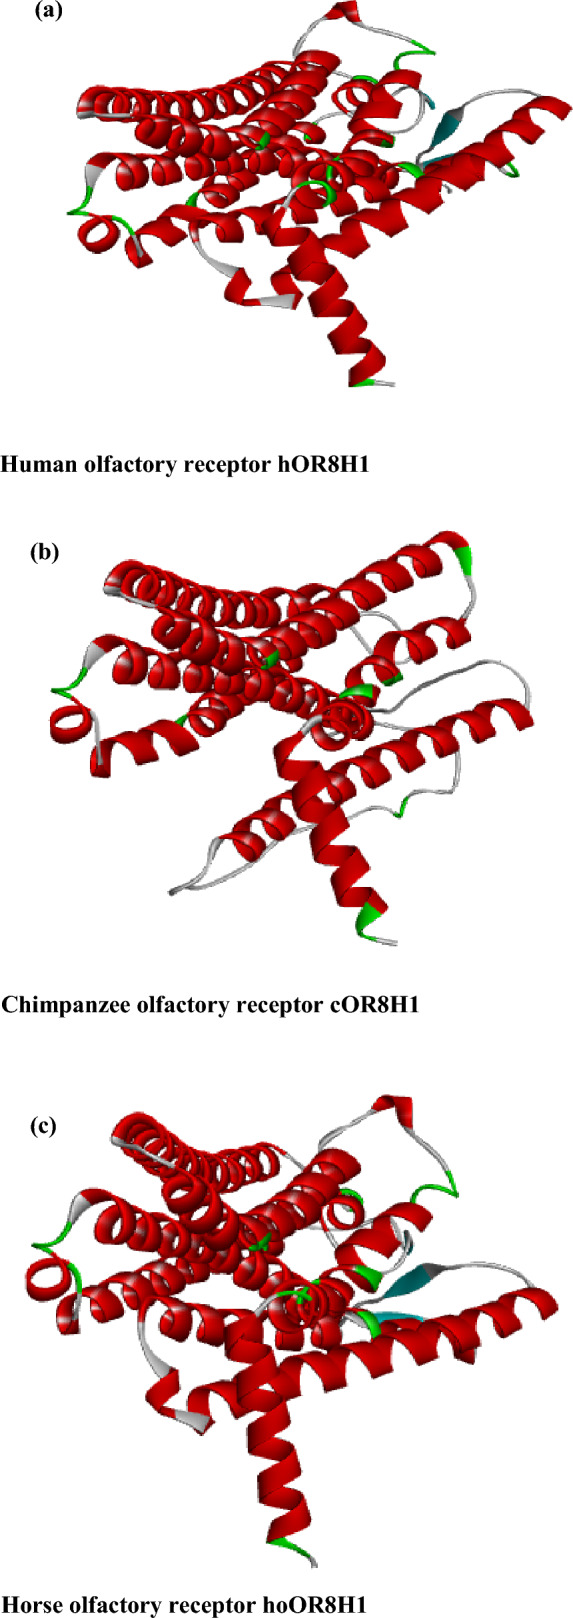
Crystal structure of human hOR8H1 (a), chimpanzee cOR8H1 (b), and horse hoOR8H1 (c).
Figure 5 visualizes the 2D and 3D docking representations, along with the most stable binding models of single vanillin and two-aggregated vanillin molecules, exhibiting an average docking energy of 21.57 kJ/mol (Table 3). Docking analysis reveals that vanillin molecules interact with hOR8H1 through conventional and carbon hydrogen bonds, in addition to pi-alkyl, alkyl, pi-pi T-shaped, and van der Waals interactions.
Fig. 5.

Molecular docking simulation between vanillin KFO and human hOR8H1.
Table 3.
Values of molar adsorption energy ΔE, single docking energy SDE, double docking energy DDE, and average docking energy ADE for the three olfactory systems.
| KFOs | ΔE (kJ/mol) | SDE (kJ/mol) | DDE (kJ/mol) | ADE (kJ/mol) |
|---|---|---|---|---|
| Vanillin-hOR8H1 | 20.75 | 21.33 | 21.75 | 21.57 |
| Vanillin-cOR8H1 | 19.75 | 20.50 | 21.33 | 20.86 |
| Vanillin-hoOR8H1 | 18.26 | 19.24 | 20.08 | 19.25 |
For cOR8H1, molecular docking calculation shows that the stable conformations of single vanillin and two-aggregated vanillin molecules are maintained with an average docking energy of 20.86 kJ/mol (Table 3). As illustrated in Fig. 6, the KFO is stabilized through conventional and carbon hydrogen bonds, as well as additional interactions such as pi-anion, pi-pi T-shaped, pi-pi stacked, pi-sigma, alkyl, van der Waals, and pi-alkyl interactions.
Fig. 6.

Molecular docking simulation between vanillin KFO and chimpanzee cOR8H1.
Concerning the hose hoOR8H1, subsequent to docking analysis, the stable conformations of single vanillin and two-aggregated vanillin molecules are maintained with an average docking energy of 19.25 kJ/mol (Table 3). Figure 7 indicates that the systems are stabilized through the formation of conventional and carbon hydrogen bonds, alongside additional interaction including, pi-sulfur, alkyl, and pi-alkyl, amide-pi stacked, pi-pi stacked, and van der Waals interactions.
Fig. 7.

Molecular docking simulation between vanillin KFO and horse hoOR8H1.
A comparison indicates that the docking mechanism of the two-aggregated vanillin differs from that of the single vanillin docking process. This highlights the limitation of conventional molecular docking simulations involving only a single ligand to fully capture the complexity of olfactory receptor interactions. Indeed, the application of statistical physics approach provides a more comprehensive understanding by enabling the estimation of aggregation degrees and their corresponding percentages during the docking process. This theoretical framework allows for a detailed molecular-level description of the olfactory systems.
Finally, it may be deduced that the energetic findings based on the statistical physics model are consistent with the molecular docking results for human, chimpanzee, and horse olfactory systems, as evidenced by the comparable values of molar adsorption energies and average docking energies.
Conclusion
In this study, the docking process of vanillin on human hOR8H1, chimpanzee cOR8H1, and horse hoOR8H1 olfactory receptors is theoretically investigated using an advanced method. To gain deeper insights into the putative adsorption process underlying the olfaction sense, three experimental concentration-olfactory response curves are fitted and analyzed via a new finite multi-layer model coupled with real gas law (L = 1). This new approach is more profound and more general compared to previous studies, which typically employed classical or statistical physics models coupled with ideal gas law to study biological systems.
The analysis of the stereographic, van der Waals, and energetic parameters of this model allows for the retrieval of valuable insights into the molecular mechanism of the adsorption of vanillin on the investigated olfactory receptors. One significant finding shows that the docked KFO molecules display a non-parallel orientation on the human hOR8H1, chimpanzee cOR8H1, and horse hoOR8H1 surfaces (1 < n < 2). This observation implies that each binding site could simultaneously be occupied by one- or two-aggregated molecules of vanillin. Additionally, the second stereographic parameter indicates that the human olfactory receptor hOR8H1 shows the highest vanillin olfactory response at saturation with respect to chimpanzee cOR8H1and horse hoOR8H1. Hence, it may be deduced that the human olfactory system is more sensitive to vanilla odor than the other systems.
Another modeling finding shows that the lateral interactions between the vanillin molecules during the docking process are the lowest in the case of vanillin-hOR8H1system. It may then be concluded that the human olfactory system is the most stable.
Energetically, the putative mechanism of adsorption, which is involved in the mechanism of olfaction, is exothermic and physical.
The adsorption energy spectrums exhibit three bands of energies activated by vanillin molecules ranging from 16.19 to 25.30 kJ/mol for hOR8H1, from 15.14 to 24.50 kJ/mol for cOR8H1, and from 12.43 to 24 kJ/mol for hoOR8H1.
The thermodynamic assessment, focusing on the analysis of the behavior of the entropy, shows that the peak of the disorder occurs at the level of the energetic parameter. The spontaneity and the exothermicity of the three mammalian olfactory systems are deduced by the negative values of Gibbs free energy and enthalpy, respectively. The increase of Gibbs free energy values at the saturation level indicates that the lateral interactions prevent or hinder the docking process of vanillin molecules on binding sites at high concentration.
The theoretical study of the three mammalian olfactory systems using the formalism of statistical physics focuses exclusively on the intensitif and quantitative aspects of the sense of smell. It is assumed that hedonic and qualitative factors are involved in the concentration-olfactory response curves. Additionally, the experimental conditions, such as temperature and solution pH, are biologically constrained and the study of their effects is not possible.
Acknowledgements
The authors express their gratitude to Princess Nourah bint Abdulrahman University Researchers Supporting Project (Grant No. PNURSP2025R46), Princess Nourah bint Abdulrahman University, Riyadh, Saudi Arabia. The authors extend their appreciation to the Deanship of Scientific Research at Northern Border University, Arar, KSA for funding this research work through the project number “NBU-FFR-2025-2226-02".
Author contributions
CRediT authorship contribution statement Ismahene Ben Khemis: Conceptualization, Data curation, Formal analysis, Methodology, Software, Supervision, Project administration, Investigation, Writing—Original Draft. FatmaAouaini: Conceptualization, Formal analysis. Salah Knani: Formal analysis, Methodology. Besma Graba: Investigation. Nizar Lefi: Software. Abdelmottaleb Ben Lamine: Writing—Original Draft.
Data availability
The data that support the findings of this study are available from Fatma Aouaini but restrictions apply to the availability of these data, which were used under license for the current study, and so are not publicly available. Data are however available from the corresponding author upon reasonable request and with permission of Fatma Aouaini.
Declarations
Competing interests
The authors declare no competing interests.
Footnotes
Publisher’s note
Springer Nature remains neutral with regard to jurisdictional claims in published maps and institutional affiliations.
References
- 1.Barwich, A. S. What is so special about smell? Olfaction as a model system in neurobiology. Postgrad. Med. J.92, 27–33 (2016). [DOI] [PubMed] [Google Scholar]
- 2.Malnic, B., Godfrey, P. A. & Buck, L. B. The human olfactory receptor gene family. Proc. Natl. Acad. Sci. U. S. A.101(8), 2584–2589 (2004). [DOI] [PMC free article] [PubMed] [Google Scholar]
- 3.Olender, T. et al. Personal receptor repertoires: Olfaction as a model. BMC Genom.13, 414 (2012). [DOI] [PMC free article] [PubMed] [Google Scholar]
- 4.Haag, F., Di Pizio, A. & Krautwurst, D. The key food odorant receptive range of broadly tuned receptor OR2W1. Food Chem.375, 131680 (2021). [DOI] [PubMed] [Google Scholar]
- 5.Noe, F. et al. IL6–HaloTag® enables live-cell plasma membrane staining, flow cytometry, functional expression, and de-orphaning of recombinant odorant receptors. J. Biol. Methods4, e81 (2017). [DOI] [PMC free article] [PubMed] [Google Scholar]
- 6.Baud, O. et al. The Mouse Eugenol Odorant Receptor: Structural and Functional Plasticity of a Broadly Tuned Odorant Binding Pocket. Biochemistry50, 843–853 (2011). [DOI] [PubMed] [Google Scholar]
- 7.Geithe, C., Noe, F., Kreissl, J. & Krautwurst, D. The Broadly Tuned Odorant Receptor OR1A1 is Highly Selective for 3-Methyl-2,4 nonanedione, a Key Food Odorant in Aged Wines, Tea, and Other Foods. Chem. Senses42, 181–194 (2017). [DOI] [PubMed] [Google Scholar]
- 8.Li, J., Haddad, R., Chen, S., Santos, V. & Luetje, C. W. A broadly tuned mouse odorant receptor that detects nitrotoluenes. J. Neurochem.121, 881–890 (2012). [DOI] [PMC free article] [PubMed] [Google Scholar]
- 9.Tazir, B., Khan, M., Mombaerts, P., Grosmaitre, X. & Foxe, J. The extremely broad odorant response profile of mouse olfactory sensory neurons expressing the odorant receptor MOR256-17 includes trace amine-associated receptor ligands. Eur. J. Neurosci.43, 608617 (2016). [DOI] [PMC free article] [PubMed] [Google Scholar]
- 10.Malnic, B., Hirono, J., Sato, T. & Buck, L. B. Combinatorial receptor codes for odors. Cell96, 713–723 (1999). [DOI] [PubMed] [Google Scholar]
- 11.Nara, K., Saraiva, L. R., Ye, X. & Buck, L. B. A large-scale analysis of odor coding in the olfactory epithelium. J. Neurosci.31, 9179–9191 (2011). [DOI] [PMC free article] [PubMed] [Google Scholar]
- 12.Oka, Y., Omura, M., Kataoka, H. & Touhara, K. Olfactory receptor antagonism between odorants. Eur. Mol. Biol. Organ. J.23, 120–126 (2004). [DOI] [PMC free article] [PubMed] [Google Scholar]
- 13.Dunkel, A. et al. Nature’s chemical signatures in human olfaction: A foodborne perspective for future biotechnology. Angewandte Chemie (Int. Ed. Engl.)53, 7124–7143 (2014). [DOI] [PubMed] [Google Scholar]
- 14.Ben Khemis, I., Mechi, N. & Ben Lamine, A. Investigation of mouse eugenol olfactory receptor activated by eugenol, vanillin and ethyl vanillin: steric and energetic characterizations. Int. J. Biol. Macromol.163, 2325–2333 (2020). [DOI] [PubMed] [Google Scholar]
- 15.Ben Khemis, I., Oueslati, K., Bouzid, M., Mechi, N. & Ben Lamine, A. Interpretations of key food odorant dose-olfactory response curves using statistical physics method. J. Mol. Liq.322, 114553 (2020). [Google Scholar]
- 16.Ben Khemis, I. et al. Statistical physics investigation of the docking process of fruity odorants on Machilis hrabei MhOR5: New microscopic interpretations. J. Mol. Liq.405, 125068 (2024). [Google Scholar]
- 17.Marcinek, P., Haag, F., Geithe, C. & Krautwurst, D. An evolutionary conserved olfactory receptor for foodborne and semiochemical alkylpyrazines. FASEB J.35, e21638 (2021). [DOI] [PMC free article] [PubMed] [Google Scholar]
- 18.Saraiva, L. R. et al. A transcriptomic atlas of mammalian olfactory mucosae reveals an evolutionary influence on food odor detection in humans. Sci. Adv.5(7), eaax0396 (2019). [DOI] [PMC free article] [PubMed] [Google Scholar]
- 19.Haag, F. et al. The multi-faceted food odorant 4-methylphenol selectively activates evolutionary conserved receptor OR9Q2. Food Chem.426, 136492 (2023). [DOI] [PubMed] [Google Scholar]
- 20.Ben Lamine, A. & Bouazra, Y. Application of statistical thermodynamics to the olfaction mechanism. Chem. Senses22, 67–75 (1997). [DOI] [PubMed] [Google Scholar]
- 21.Sellaoui, L. et al. Understanding the adsorption of Pb2+, Hg2+ and Zn2+ from aqueous solution on a lignocellulosic biomass char using advanced statistical physics models and density functional theory simulations. Chem. Eng. J.365, 305–316 (2019). [Google Scholar]
- 22.Aouaini, F., Ben Yahia, M., Alyousef, H. & Alotaibi, B. M. Effective adsorption of metals on porphyrins: Experiments and advanced isotherms modeling. Arab. J. Chem.14, 103203 (2021). [Google Scholar]
- 23.Ben Yahia, M., AlZahrani, H. Y. S. & Ben Yahia, M. Application of advanced statistical physics modeling for the physicochemical analysis of adsorption isotherms of manganese (II) on porphyrins H2TPP and H2TTP. Braz. J. Chem. Eng.38, 373–388 (2021). [Google Scholar]
- 24.Bouzid, M., Bouaziz, N., Ben Torkia, Y. & Ben Lamine, A. Statistical physics modeling of ethanol adsorption onto the phenol resin based adsorbents: Stereographic, energetic and thermodynamic investigations. J. Mol. Liq.283, 674–687 (2019). [Google Scholar]
- 25.Knani, S., Khalfaoui, M., Hchicha, M. A., Mathlouthi, M. & Ben Lamine, A. Interpretation of psychophysics response curves using statistical physics. Food Chem.151, 487–499 (2014). [DOI] [PubMed] [Google Scholar]
- 26.Dotto, G. L., Pinto, L. A. A., Hachicha, M. A. & Knani, S. New physicochemical interpretations for the adsorption of food dyes on chitosan films using statistical physics treatment. Food Chem.171, 1–7 (2015). [DOI] [PubMed] [Google Scholar]
- 27.Khalfaoui, M. et al. Study on adsorption of herbicide onto functionalized cellulose extracted from JuncusacutusL. plant: experimental results and theoretical modeling. Ind. Crops Prod.67, 169–178 (2015). [Google Scholar]
- 28.Alyousef, H., Aouaini, F. & Ben Yahia, M. New insights on physicochemical investigation of water adsorption isotherm into seed of dates using statistical physics treatment: pore size and energy distributions. J. Mol. Liq.298, 112041 (2020). [Google Scholar]
- 29.Mechi, N. et al. Investigation of the adsorption mechanism of methylene blue (MB) on Cortaderia selloana lower spikes (FSs) and on Cortaderia selloana flower spikes derived carbon fibers (CFs). J. Mol. Liq.280, 268–273 (2019). [Google Scholar]
- 30.Aouaini, F. et al. Investigation of pore size and energy distributions by statistical physics formalism applied to agriculture products. Physica A439, 150–159 (2015). [Google Scholar]
- 31.Ben Khemis, I. et al. Advanced analysis of the adsorption mechanism for sweet odorant on mouse and human olfactory receptors via statistical physics theory. J. Mol. Liq.400, 124479 (2024). [Google Scholar]
- 32.Ben Khemis, I. et al. Quantitative investigations of Zebrafish olfactory receptor ORA1 responsiveness to three pheromones: Microscopic and macroscopic characterizations via an advanced statistical physics treatment. Int. J. Biol. Macromol.257, 128726 (2024). [DOI] [PubMed] [Google Scholar]
- 33.Diu, B., Guthmann, C., Lederer, D., and Roulet, B. Physique statistique. (1989).
- 34.Yazidi, A. et al. Ternary adsorption of cobalt, nickel and methylene blue on a modified chitin: Phenomenological modeling and physical interpretation of the adsorption mechanism. Int. J. Biol. Macromol.158, 595–604 (2020). [DOI] [PubMed] [Google Scholar]
- 35.Sghaier, W., Ben Torkia, Y., Bouzid, M. & Ben Lamine, A. CO2 adsorption investigation by statistical physics: Thermodynamic analysis for cooling cycle application. J. Environ. Chem. Eng.9, 105108 (2021). [Google Scholar]
- 36.Hazra, S. et al. On the Significant Importance of Hg···Cl Spodium Bonding/σ/π-Hole/Noncovalent Interactions and Nanoelectronic/Conductivity Applications in Mercury Complexes: Insights from DFT Spectrum. Cryst. Growth Des.24, 7246–7261 (2024). [Google Scholar]
- 37.Igbokwe, C. J. et al. Novel antioxidant peptides identified from coix seed by molecular docking, quantum chemical calculations and invitro study in HepG2 cells. Food Chem.440, 138234 (2024). [DOI] [PubMed] [Google Scholar]
- 38.Dacrory, S. Anti-proliferative, antimicrobial, DFT calculations, and molecular docking 3D scaffold based on sodium alginate, chitosan, neomycin sulfate and hydroxyapatite. Int. J. Biol. Macromol.270, 132297 (2024). [DOI] [PubMed] [Google Scholar]
- 39.Wei, C. et al. Discovery of novel inhibitors of dengue viral RNA-dependent RNA polymerase by molecular docking, in vitro assay, DFT, and MD simulations. Int. J. Biol. Macromol.305, 141328 (2025). [DOI] [PubMed] [Google Scholar]
- 40.Trott, O. & Olson, A. J. AutoDock Vina: Improving the speed and accuracy of docking with a new scoring function, efficient optimization, and multithreading. J. Comput. Chem.31, 455–461 (2010). [DOI] [PMC free article] [PubMed] [Google Scholar]
- 41.Ben Khemis, I., Sagaama, A., Issaoui, N. & Ben Lamine, A. Steric and energetic characterizations of mouse and human musk receptors activated by nitro musk smelling compounds at molecular level: Statistical physics treatment and molecular docking analysis. Int. J. Biol. Macromol.188, 333–342 (2021). [DOI] [PubMed] [Google Scholar]
- 42.Sagaama, A. & Issaoui, N. Design, molecular docking analysis of an anti-inflammatory drug, computational analysis and intermolecular interactions energy studies of 1-benzothiophene-2-carboxylic acid. Comput. Biol. Chem.88, 107348 (2020). [DOI] [PMC free article] [PubMed] [Google Scholar]
Associated Data
This section collects any data citations, data availability statements, or supplementary materials included in this article.
Data Availability Statement
The data that support the findings of this study are available from Fatma Aouaini but restrictions apply to the availability of these data, which were used under license for the current study, and so are not publicly available. Data are however available from the corresponding author upon reasonable request and with permission of Fatma Aouaini.