

Abstract
Background
Uterine fibroids(UF), while histologically benign, constitute a pervasive yet inequitable epidemiological phenomenon characterized by disproportionately distributed morbidity burdens that correlate asymmetrically with regional development levels, compounded by intersecting socioeconomic determinants and genetic susceptibilities. We aimed to assess the global and regional burden of age-standardized UF in women from 1990 to 2021.
Methods
Age-standardized incidence, prevalence, and years lived with disability (YLDs) rates attributable to UF were obtained from the Global Burden of Disease (GBD) Study 2021. Temporal trends were evaluated using the average annual percentage change (AAPC), and future projections were conducted using the autoregressive integrated moving average (ARIMA) model.
Results
From 1990 to 2021, the global Age-standardized prevalence rate (ASPR) increased (AAPC = 0.05; 95% CI: 0.03 to 0.08), with the high increases occurring in Brazil, India, and Georgia. The Age-standardized incidence rate (ASIR) also increased globally (AAPC = 0.23; 95% CI: 0.19 to 0.27), although it declined in Poland. Age-standardized years lived with disability (YLDs) followed a similar global upward trend (AAPC = 0.09; 95% CI: 0.07 to 0.12) but decreased in some regions, including China, and Australia. The high-middle-SDI regions exhibited declining trends, whereas the low-middle-SDI regions exhibited increasing trends. Our projections suggested stabilization of these indicators by 2050.
Conclusions
UF remain the most common benign gynecological tumors and pose a substantial health care burden. Socioeconomic factors, diagnostic advancements, and lifestyle changes influence the long-term trends associated with their prevalence, incidence, and other related parameters. Increased epidemiological surveillance and more public health interventions are needed.
Keywords: Uterine fibroids, Years lived with disability, Socioeconomic disparities, Epidemiological trends, Global burden of diseases studies, Forecasting
1 Introduction
Uterine fibroids(UF), referred to as leiomyomas or myomas, represent the most prevalent benign neoplasms within the female reproductive system and impact the well-being of millions of women globally [1]. Common clinical manifestations of UF include menorrhagia, pelvic discomfort, and impaired reproductive function [2]. Although UF do not pose an immediate threat to life, their profound effects on women’s physical health, psychological well-being, and financial stability underscore their significance as major public health issues [3].
In the past thirty years, various demographic shifts and epidemiological transitions have shaped the global uterine fibroid burden [4]. The increasing life expectancy, expanding population size, and changing reproductive patterns, including postponed childbearing, have collectively driven an increase in the global prevalence of UF [5, 6]. Moreover, improvements in diagnostic techniques, particularly advanced imaging modalities such as ultrasound and magnetic resonance imaging (MRI), have significantly increased the detection rates of these neoplasms, especially in high-income regions [7]. Nevertheless, these advancements highlight persistent inequities in health care accessibility and diagnostic resources, potentially resulting in an underestimation of disease burden in low- and middle-income nations. Various epidemiological determinants contributing to uterine fibroid development include genetic predisposition, race, reproductive history, sex steroid hormone levels, lifestyle choices, environmental exposures, and deficiencies in vitamin D [8]. Growing evidence indicates notable racial and ethnic disparities in both the prevalence and severity of UF, with individuals of African ancestry experiencing a disproportionately greater burden [9, 10]. This inequity highlights the critical need to incorporate both sociocultural influences and genetic predispositions when evaluating the worldwide impact of UF. Moreover, the economic burden of uterine fibroid management, which involves medical therapies, surgical procedures, and productivity losses, places significant financial strain on both affected individuals and health care infrastructures [11, 12]. According to a study on the annual economic uterine fibroid burden in the United States, the financial impact of this condition increased from $34.4 billion in 2010 to $41.4 billion in 2022 [13].
Several studies have explored the epidemiology and clinical impact of UF, yet their scope and focus vary significantly. Epidemiological research conducted in the United States has underscored racial inequities and established associations between fibroid prevalence and both hormonal and environmental determinants [14, 15]. Concurrently, studies conducted in sub-Saharan Africa highlight the influence of genetic susceptibility and restricted health care availability in contributing to the elevated prevalence of UF [16]. In contrast, studies conducted in East Asia often focus on the implications of lifestyle factors, such as diet and stress, in fibroid development [17, 18]. Comparisons of these studies revealed regional differences in diagnostic criteria, data collection methods, and health care infrastructure. However, comprehensive population-based research utilizing standardized criteria to assess the global UF burden is lacking.
In the present study, we used data from the the Global Burden of Disease (GBD) database to conduct a systematic evaluation of the uterine fibroid health burden and its trends across global, regional, and national populations between 1990 and 2021. To address demographic heterogeneity, age-standardized metrics were implemented to adjust for variations in population structure. We further employed ARIMA modeling to forecast prevalence, incidence, and YLDs trends through 2050, generating projections critical for long-term health care preparedness [19].
2 Materials and methods
2.1 Data sources
Epidemiological estimates for UF were derived from GBD 2021 study, which was made available by the Institute for Health Metrics and Evaluation through the Global Health Data Exchange (GHDx; https://ghdx.healthdata.org/gbd-results-tool). The GBD framework integrates data from diverse sources such as vital registration systems, hospital records, outpatient datasets, population-based surveys, and cancer registries. It encompasses 204 countries and territories, covering 369 disease and injury categories, 286 causes of death, and 87 behavioral, environmental, and metabolic risk factors [20]. To ensure consistency across time and geography, standardized case definitions, data harmonization procedures, and quality adjustment protocols were applied. Variations in data completeness and reporting accuracy were addressed using DisMod-MR 2.1, a Bayesian meta-regression model that enables internal consistency and imputes missing values. UF were identified using the diagnostic codes D25-D26.9 and D28.2, according to the International Classification of Diseases, 10th Revision (ICD-10). This study followed the Guidelines for Accurate and Transparent Health Estimates Reporting (GATHER), and ethical clearance was waived because of the publicly available, anonymized nature of the data, as approved by the Institutional Review Board of the University of Washington [21].
2.2 Definitions
To assess the disease burden, we selected years lived with disability (YLDs) and the corresponding age-standardized rate as the key parameters. YLDs represent the nonfatal component of disease burden, which is calculated as the prevalence multiplied by a disability weight that quantifies health loss severity. YLDs are a core metric within the GBD framework, capturing both the frequency and impact of a health condition.
SDI serves as a composite proxy for development and is derived from lag-distributed income per capita, average years of schooling, and the total fertility rate under age 25. The SDI ranges from 0 to 1, with higher values reflecting greater socioeconomic development. Countries and regions were stratified into five SDI levels: high, high-middle, middle, low-middle, and low [22].
2.3 Statistical analysis
All disease burden metrics including incidence, prevalence, and YLDs were analyzed as age-standardized rates (ASRs) per 100,000 people. Age standardization was performed using the direct method, which applies age-specific rates from the study population to a standard population structure to control for differences in age distribution. Specifically, ASRs were calculated by multiplying the estimated disease rate within each five-year age group by the corresponding weight of that age group in the GBD reference population, followed by summing across all age strata.
Age-standardized estimates for incidence, prevalence, and YLDs were obtained from the GBD 2021 Results Tool and are presented with corresponding 95% uncertainty intervals (UIs). The 95% UIs represent Bayesian credible intervals generated through posterior simulation in the DisMod-MR 2.1 meta-regression framework. They differ from classical confidence intervals, which incorporate multiple sources of uncertainty, including stochastic error, data sparsity, model structure, covariate effects, and prior distributions, across all stages of the estimation process [23].
To evaluate temporal trends in the UF burden, joinpoint regression analysis was performed using the Joinpoint Regression Program (version 4.9.1.0). This method fits segmented log-linear models to time series data and detects statistically significant changes in slope over time. For each continuous segment, the annual percent change (APC) was estimated, and for the entire study period, the average annual percent change (AAPC) was calculated as a weighted average of the segment-specific APCs, weighted by segment length. The 95% confidence intervals (CIs) for AAPC were computed on the basis of the standard errors of the regression slopes under the assumption of normally distributed residuals. These intervals reflect the degree of statistical uncertainty around the estimated rate of change in disease burden. If the CI of an AAPC estimate excludes zero, the trend is considered statistically significant. Conversely, intervals overlapping zero indicate a stable trend with no significant change. In this study, AAPC values and their CIs were used to assess the direction, magnitude, and statistical significance of changes in age-standardized incidence, prevalence, and YLDs rates from 1990 to 2021 across global, regional, and national levels [24]. Univariate autoregressive integrated moving average (ARIMA) models were applied to age-standardized time series data for global incidence, prevalence, and YLDs rates of UF from 1990 to 2021. Model identification was conducted using the Box‒Jenkins approach, with optimal parameters (p, d, q) selected through examination of autocorrelation and partial autocorrelation structures, as well as minimization of the Akaike information criterion (AIC) [25]. Forecasts were extrapolated to the year 2050, and 95% prediction intervals were derived from the residual variance and parameter estimation error, allowing probabilistic characterization of trend uncertainty. All statistical analyses and data visualization were conducted using R version 4.2.2 (R Foundation for Statistical Computing, Vienna, Austria) and Joinpoint Regression Program version 4.9.0.0 (National Cancer Institute, Rockville, MD, USA). A significance level of α = 0.05 was used, with P < 0.05 considered statistically significant.
3. Results
3.1 Trends in the prevalence of uterine fibroids
Globally, the ASPR of UF demonstrated a slight upward trend from 1990 to 2021, with an AAPC of 0.05% (95% CI: 0.03 to 0.08) (Table 1). Analysis of the SDI revealed that ASPR trends decreased in high-SDI regions (AAPC = − 0.09; 95% CI: − 0.13 to − 0.06) and high-middle-SDI regions (AAPC = − 0.45; 95% CI: ‒0.49 to − 0.41). However, increasing trends were observed in low-SDI regions (AAPC = 0.27; 95% CI: 0.22 to 0.32), lower-middle-SDI regions (AAPC = 0.54; 95% CI: 0.52 to 0.55), and middle-SDI regions (AAPC = 0.47, 95% CI: 0.46–0.49) (Fig. 1).
Table 1.
The age-standardized prevalence (ASPR), incidence (ASIR), and years lived with disability (ASR-YLDs) of uterine fibroids in 1990 and 2021, and their average annual percent changes (AAPCs) between 1990 and 2021, by global, SDI, and GBD regions
| location | 1990 | 2021 | AAPC(95%CI) | ||||||
|---|---|---|---|---|---|---|---|---|---|
| ASPR per 100,000 |
ASIR per 100,000 |
ASR-YLDs (No.×104) |
ASPR per 100,000 |
ASIR per 100,000 |
YLDs (No.×104) |
AAPC for ASPR (1990–2021) |
AAPC for ASIR (1990–2021) |
AAPC for YLDs (1990–2021) |
|
| global |
2799.88 (2133.46, 3650.54) |
234.36 (171.06, 309.92) |
1.52 (0.88, 2.6) |
2841.07 (2164.43, 3682.27) |
250.93 (183.44, 330.94) |
1.57 (0.91, 2.71) |
0.05* (0.03, 0.08) |
0.23* (0.19, 0.27) |
0.09* (0.07, 0.12) |
| SDI region | |||||||||
| High SDI |
3269.37 (2493.42, 4222.12) |
262.24 (192.80, 342.64) |
1.30 (0.68, 2.36) |
3184.07 (2450.98, 4074.76) |
265.52 (193.64, 348.39) |
1.21 (0.64, 2.21) |
−0.09* (−0.13, −0.06) |
0.03 (−0.03, 0.09) |
−0.24* (−0.29, −0.20) |
| High-middle SDI |
3362.22 (2550.54, 4368.41) |
277.83 (202.22, 366.07) |
1.63 (0.92, 2.88) |
2913.18 (2224.94, 3741.19) |
256.86 (188.01, 334.87) |
1.32 (0.73, 2.35) |
−0.45* (−0.49, −0.41) |
−0.25* (−0.27, −0.24) |
−0.67* (−0.70, −0.64) |
| Low SDI |
2498.63 (1882.29, 3295.87) |
221.80 (160.21, 296.73) |
1.94 (1.14, 3.18) |
2703.75 (2040.97, 3559.58) |
237.87 (171.82, 315.92) |
1.97 (1.16, 3.29) |
0.27* (0.22, 0.32) |
0.24* (0.18, 0.29) |
0.06** (0.01, 0.10) |
| Low-middle SDI |
2525.24 (1909.01, 3321.83) |
223.03 (162.64, 297.72) |
1.83 (1.09, 2.98) |
2978.72 (2242.12, 3893.50) |
262.69 (191.79, 350.05) |
2.05 (1.20, 3.43) |
0.54* (0.52, 0.55) |
0.54* (0.49, 0.59) |
0.37* (0.33, 0.41) |
| Middle SDI |
2247.14 (1696.96, 2941.02) |
197.65 (143.77, 263.13) |
1.29 (0.75, 2.22) |
2600.71 (1987.89, 3347.17) |
238.21 (174.87, 313.82) |
1.44 (0.82, 2.48) |
0.47* (0.46, 0.49) |
0.61* (0.59, 0.63) |
0.34* (0.32, 0.36) |
| GBD region | |||||||||
| Andean Latin America |
5982.45 (4525.01, 7837.45) |
512.27 (373.95, 686.87) |
3.47 (1.88, 6.12) |
6101.66 (4649.90, 7894.76) |
521.33 (380.49, 694.99) |
2.71 (1.44, 4.79) |
0.06* (0.04, 0.08) |
0.05* (0.03, 0.08) |
−0.80*(−0.80, −0.80) |
| Australasia |
982.11 (718.38, 1304.30) |
88.04 (62.91, 116.19) |
0.36 (0.18, 0.69) |
979.30 (737.69, 1282.38) |
87.86 (63.79, 117.13) |
0.35 (0.17, 0.68) |
−0.01 (−0.03, 0.00) |
−0.01** (−0.02, 0.00) |
−0.10** (−0.20, −0.10) |
| Caribbean |
4190.07 (3151.77, 5488.69) |
361.08 (260.13, 480.93) |
2.45 (1.40, 4.21) |
4278.48 (3209.62, 5612.04) |
367.58 (263.71, 497.19) |
2.47 (1.41, 4.29) |
0.06* (0.05, 0.08) |
0.05* (0.03, 0.07) |
0.00 (0.00, 0.10) |
| Central Asia |
4682.51 (3503.28, 6086.54) |
411.92 (296.63, 547.76) |
3.04 (1.77, 5.11) |
4956.97 (3739.86, 6335.94) |
436.75 (315.72, 568.20) |
3.11 (1.78, 5.16) |
0.18* (0.15, 0.21) |
0.18* (0.14, 0.22) |
0.10 (0.00, 0.10) |
| Central Europe |
2937.95 (2261.20, 3716.03) |
254.24 (186.78, 329.19) |
1.47 (0.83, 2.53) |
2874.02 (2232.88, 3584.04) |
248.04 (185.24, 316.71) |
1.33 (0.72, 2.33) |
−0.08* (−0.11, −0.04) |
−0.08* (−0.12, −0.04) |
−0.30** (−0.40, −0.30) |
| Central Latin America |
5110.30 (3814.75, 6680.34) |
454.30 (325.84, 603.09) |
2.10 (1.10, 3.81) |
4989.57 (3806.85, 6381.87) |
446.82 (319.89, 588.04) |
1.96 (1.02, 3.50) |
−0.08* (−0.10, −0.06) |
−0.05* (−0.07, −0.04) |
−0.20** (−0.30, −0.20) |
| Central Sub-Saharan Africa |
2881.51 (2158.42, 3817.14) |
254.53 (184.18, 341.19) |
2.30 (1.31, 3.83) |
3040.03 (2283.84, 4001.45) |
267.88 (195.21, 353.82) |
2.02 (1.14, 3.47) |
0.18* (0.15, 0.22) |
0.18* (0.13, 0.23) |
−0.40** (−0.50, −0.30) |
| East Asia |
1432.60 (1061.94, 1905.58) |
125.52 (91.02, 170.75) |
0.73 (0.4, 1.28) |
1493.93 (1141.77, 1930.89) |
136.50 (101.31, 177.06) |
0.63 (0.34, 1.09) |
0.14* (0.09, 0.20) |
0.29* (0.22, 0.35) |
−0.50** (−0.50, −0.40) |
| Eastern Europe |
6873.77 (5206.09, 8872.85) |
605.27 (441.11, 791.73) |
3.42 (1.93, 6.05) |
6934.45 (5230.48, 8997.04) |
610.42 (445.44, 798.58) |
3.25 (1.83, 5.70) |
0.03* (0.02, 0.03) |
0.03* (0.02, 0.03) |
−0.2** (−0.20, −0.20) |
| Eastern Sub-Saharan Africa |
2260.43 (1711.92, 2965.21) |
200.48 (145.14, 265.73) |
1.50 (0.89, 2.49) |
2327.56 (1749.64, 3025.59) |
206.20 (149.22, 275.53) |
1.39 (0.81, 2.37) |
0.10** (0.03, 0.18) |
0.10** (0.02, 0.17) |
−0.20** (−0.20, −0.20) |
| High-income Asia Pacific |
3536.65 (2694.80, 4648.84) |
281.14 (200.23, 379.46) |
1.48 (0.76, 2.77) |
3502.52 (2685.33, 4493.03) |
296.79 (219.27, 386.14) |
1.36 (0.71, 2.55) |
−0.03 (−0.06, 0.00) |
0.19* (0.12, 0.26) |
−0.30** (−0.30, −0.20) |
| North Africa and Middle East |
1314.84 (990.43, 1726.29) |
118.25 (85.80, 158.20) |
0.81 (0.45, 1.39) |
1368.71 (1025.08, 1810.34) |
122.58 (88.51, 163.47) |
0.76 (0.42, 1.31) |
0.13* (0.11, 0.14) |
0.11* (0.09, 0.13) |
−0.2** (−0.30, −0.20) |
| North Africa and Middle East |
1314.84 (990.43, 1726.29) |
118.25 (85.80, 158.20) |
0.81 (0.45, 1.39) |
1368.71 (1025.08, 1810.34) |
122.58 (88.51, 163.47) |
0.76 (0.42, 1.31) |
0.13* (0.11, 0.14) |
0.11* (0.09, 0.13) |
−0.20** (−0.30, −0.20) |
| Oceania |
1444.05 (1088.60, 1908.75) |
129.49 (94.03, 175.69) |
1.14 (0.64, 1.92) |
1550.37 (1182.17, 2044.04) |
139.06 (101.13, 189.15) |
1.11 (0.58, 1.93) |
0.23* (0.21, 0.24) |
0.21* (0.19, 0.22) |
−0.10* (−0.30, 0.00) |
| South Asia |
2750.65 (2056.95, 3631.37) |
243.08 (175.73, 326.15) |
2.18 (1.29, 3.50) |
3384.79 (2527.93, 4468.71) |
296.47 (213.91, 395.25) |
2.56 (1.49, 4.32) |
0.69* (0.66, 0.72) |
0.66* (0.63, 0.70) |
0.50* (0.50, 0.60) |
| Southeast Asia |
1542.01 (1179.19, 1984.53) |
135.24 (98.92, 179.53) |
0.95 (0.56, 1.63) |
1641.67 (1253.93, 2108.75) |
144.48 (106.40, 191.70) |
0.92 (0.52, 1.58) |
0.20* (0.19, 0.22) |
0.21* (0.19, 0.23) |
−0.10** (−0.10, −0.10) |
| Southern Latin America |
3036.50 (2262.83, 4094.69) |
259.53 (187.13, 358.71) |
1.23 (0.60, 2.28) |
3251.72 (2405.37, 4329.64) |
276.55 (193.62, 371.61) |
1.25 (0.61, 2.33) |
0.22* (0.18, 0.26) |
0.20* (0.16, 0.25) |
0.10 (0.00, 0.10) |
| Southern Sub-Saharan Africa |
6183.72 (4640.80, 8072.97) |
532.06 (387.20, 710.22) |
3.63 (2.14, 6.19) |
6223.91 (4683.93, 8138.92) |
534.10 (390.68, 720.81) |
3.34 (1.95, 5.61) |
0.02 (−0.01, 0.05) |
0.01 (−0.01, 0.02) |
−0.30** (−0.30, −0.20) |
| Tropical Latin America |
2289.76 (1829.24, 2871.33) |
181.39 (137.14, 233.57) |
1.38 (0.81, 2.29) |
3120.36 (2379.43, 3983.68) |
278.54 (204.44, 365.57) |
1.72 (0.97, 2.95) |
1.00* (0.94, 1.06) |
1.38* (1.31, 1.45) |
0.70* (0.60, 0.80) |
| Western Europe |
4186.76 (3131.54, 5501.91) |
356.50 (258.03, 474.32) |
1.55 (0.78, 2.83) |
4088.41 (3090.51, 5352.23) |
345.03 (250.25, 460.96) |
1.43 (0.73, 2.64) |
−0.07* (−0.09, −0.05) |
−0.11* (−0.13, −0.08) |
−0.20** (−0.30, −0.20) |
| Western Sub-Saharan Africa |
2965.85 (2235.08, 3891.12) |
261.40 (189.80, 348.89) |
2.21 (1.32, 3.63) |
3099.78 (2340.60, 4077.08) |
272.75 (198.05, 364.30) |
2.31 (1.39, 3.80) |
0.13* (0.12, 0.15) |
0.14* (0.11, 0.17) |
0.20* (0.10, 0.20) |
Fig. 1.
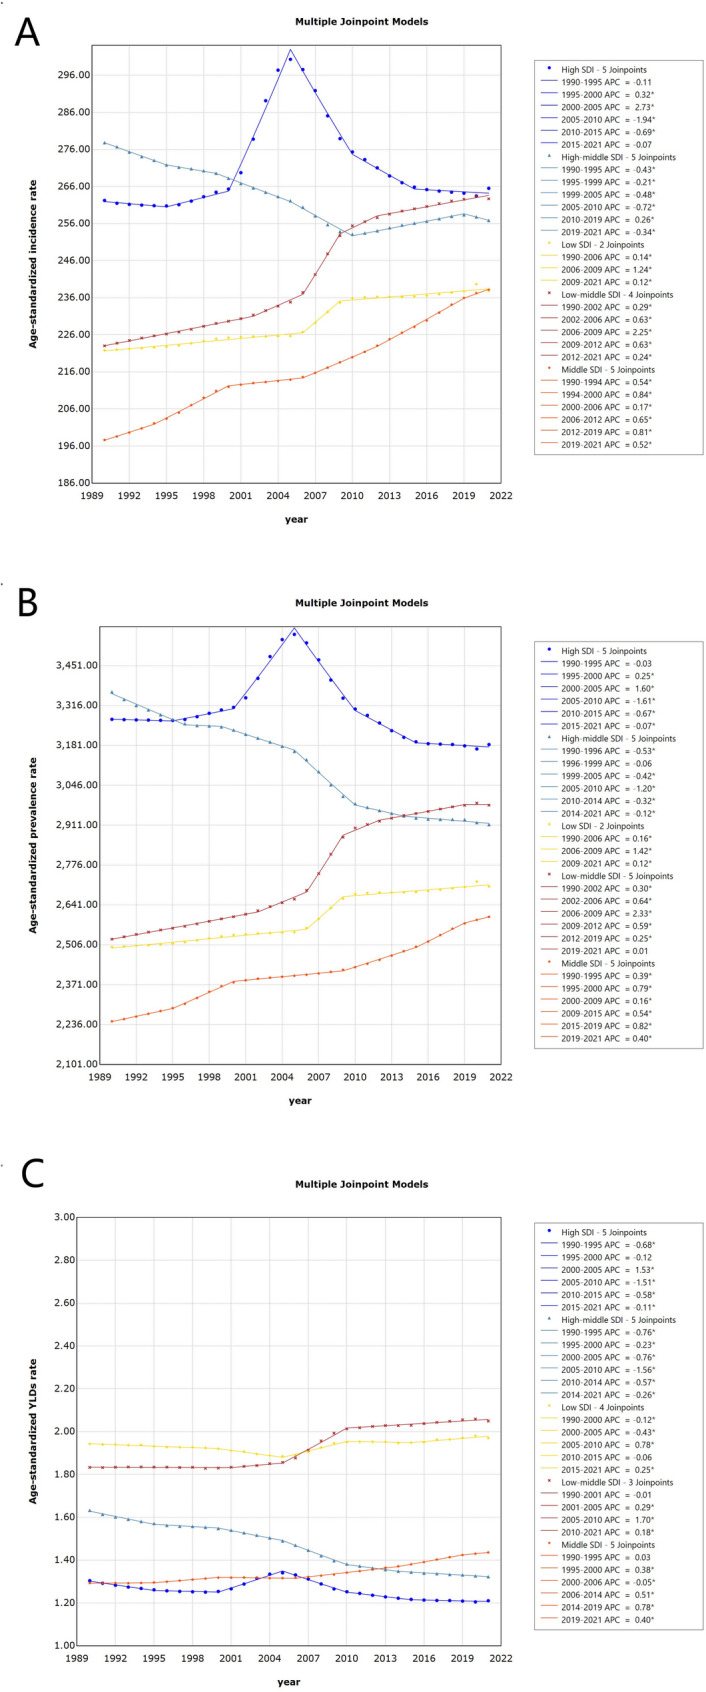
Age-standardized incidence rates (ASIR), prevalence rates (ASPR), and years lived with disability rates (ASR-YLDs) of uterine fibroids from 1990 to 2021 across five SDI regions
Geographically, most regions presented increasing trends in ASPRs, with the notable increase occurring in tropical Latin America (AAPC = 1.00, 95% CI: 0.94 to 1.06), followed by South Asia (AAPC = 0.69, 95% CI: 0.66 to 0.72) and Central Asia (AAPC = 0.18, 95% CI: 0.15 to 0.21). Decreasing trends were observed in Australasia, Central Europe, Central Latin America, high-income Asia Pacific and Western Europe, with AAPCs of − 0.01% (95% CI: − 0.03 to 0.00), − 0.08% (95% CI: − 0.11 to − 0.04), − 0.08% (95% CI: − 0.10 to 0.06), − 0.03% (95% CI: − 0.06 to − 0.00), and − 0.07% (95% CI: − 0.09 to − 0.05), respectively (Fig. 2). Among the 204 countries and territories assessed in 2021, significant decreasing trends in ASPR were predominantly observed in Poland (AAPC = − 0.57; 95% CI: − 0.63 to − 0.50), New Zealand (AAPC = − 0.43; 95% CI: − 0.47 to − 0.40), and Portugal (AAPC = − 0.29; 95% CI: − 0.40 to − 0.19). In contrast, increasing trends were noted in Brazil (AAPC = 1.02; 95% CI: 0.96 to 1.08), India (AAPC = 0.81; 95% CI: 0.78 to 0.84), Georgia (AAPC = 0.50; 95% CI: 0.43 to 0.57), and the Maldives (AAPC = 0.47; 95% CI: 0.44 to 0.51).
Fig. 2.

Map of age-standardized incidence, prevalence and YLDs rate due to uterine fibroids in 2021
3.2 Trends in the incidence of uterine fibroids
From 1990 to 2021, the ASIR of UF demonstrated an increasing trend, with an AAPC of 0.23% (95% CI: 0.19 to 0.27). Stratified analysis by the SDI revealed a decline exclusively in regions with a medium-high SDI (AAPC = − 0.25; 95% CI: − 0.27 to − 0.25), whereas other regions exhibited varying degrees of increase. Geographically, incidence trends increased across the majority of regions, with a relatively more pronounced increase observed in Tropical Latin America (AAPC = 1.38; 95% CI: 1.31 to 1.45), followed by South Asia (AAPC = 0.66; 95% CI: 0.63 to 0.70) and East Asia (AAPC = 0.29; 95% CI: 0.22 to 0.35). Conversely, modest declining trends were identified in Central Latin America (AAPC = − 0.05; 95% CI: − 0.07 to − 0.04) and Western Europe (AAPC = − 0.11; 95% CI: − 0.13 to − 0.08). At the national level, the AAPC of ASIR showed a declining trend in Poland, the United Kingdom, New Zealand, Portugal, Italy, and Sweden, with rates of − 0.61% (95% CI: − 0.70 to − 0.51), − 0.43% (95% CI: − 0.48 to − 0.37), − 0.40% (95% CI: − 0.45 to − 0.36), − 0.30% (95% CI: − 0.38 to − 0.21), − 0.20% (95% CI: − 0.22 to − 0.18), and − 0.17% (95% CI: − 0.30 to − 0.04), respectively. In contrast, Brazil and India exhibited relatively high AAPC values for ASIR, at 1.41% (95% CI: 1.34 to 1.48) and 0.79% (95% CI: 0.76 to 0.83), respectively.
3.3 Trends in the YLDs caused by uterine fibroids
From 1990 to 2021, ASR-YLDs attributable to UF showed an overall increasing trend, with an AAPC of 0.09% (95% CI: 0.07 to 0.12). ASR-YLDs of UF increased in the majority of regions, with relatively greater growth observed in lower-middle-SDI regions (AAPC = 0.37; 95% CI: 0.33 to 0.41), whereas a statistically significant decline was noted in high-middle-SDI regions (AAPC = − 0.67; 95% CI: − 0.70 to − 0.64). A decreasing trend in the ASR-YLDs was identified across several regions, notably in the People’s Republic of China (AAPC = − 0.49; 95% CI: − 0.55 to − 0.43) and Australia (AAPC = − 0.09; 95% CI: − 0.13 to − 0.05). In contrast, increasing trends were observed in Malaysia and the Republic of Benin, with AAPCs of 1.10% (95% CI: 0.93 to 1.28) and 0.78% (95% CI: 0.72 to 0.84), respectively.
3.4 The worldwide analysis
In 2021, the ASPR of UF ranged from 936.62 (95% UI: 746.30 to 1165.40) to 8043.96 (95% UI: 6015.09 to 10504.40). The ASIR of UF in 2021 ranged from 83.69 (95% UI: 63.38 to 106.30) to 686.95 (95% UI: 480.42 to 918.98). As showed in the figure, regions with higher latitudes, such as Russia, presented higher ASIRs for UF in 2021. In mid-latitude regions, countries such as Western Europe, Kazakhstan, Mongolia, and Spain had relatively high ASIRs, whereas in low-latitude countries such as Mexico, Colombia, and Peru, the ASIRs were also elevated. In 2021, the ASR-YLDs of UF ranged from 0.33 (95% CI: 0.17 to 0.61) to 3.78 (95% CI: 2.04 to 6.42) (Fig. 2).
3.5 Age-specific disease burden caused by uterine fibroids
According to the GBD 2021 dataset, the analysis included women aged 15 to ≥ 70 years diagnosed with UF. We examined the age-specific burden by assessing the absolute numbers of prevalent cases and YLDs, as well as the corresponding age-stratified prevalence, incidence, and crude YLD rates. In 2021, both the number of prevalent cases and the prevalence rate of UF increased with age during early reproductive years, peaking at 40–44 years, and subsequently declined with advancing age. A similar pattern was observed for incidence: the number of new cases and incidence rates rose from adolescence, peaked in the 35–39 age group, and then dropped sharply among women aged 40–44 years and older. The age distribution of YLDs showed a comparable trajectory, gradually increasing from ages 15–19, reaching a maximum in the 40–44 age group, and then decreasing with advancing age (Fig. 3).
Fig. 3.

Age-specific prevalence, incidence, and YLDs of uterine fibroids in 2021
3.6 Global projections of the prevalence, incidence, and YLDs of uterine fibroids
Over the next three decades, ASPR, ASIR, and YLD rate of UF are projected to remain relatively stable globally. The global ASPR of UF in females is projected to decline moderately, declining from 2841.07 (95% CI: 2164.43 to 3682.27) per 100,000 people in 2021 to 2836.62 (95% CI: 2707.31 to 2965.94) per 100,000 people by 2050, with a percentage change of − 0.16%. The ASIR is expected to exhibit a slight downward trend, declining from 250.93 (95% CI: 183.44 to 330.94) per 100,000 people in 2021 to 248.74 (95% CI: 231.53 to 265.94) per 100,000 people in 2050, representing a percentage change of −0.87%. Similarly, the age-standardized rate of years lived with disability (YLDs) attributable to UF is projected to decrease marginally from 1.56 (95% CI: 0.91 to 2.71) per 100,000 people in 2021 to 1.57 (95% CI: 1.47 to 1.68) per 100,000 people by 2050, reflecting a percentage change of − 4.64% (Fig. 4).
Fig. 4.

Projected prevalence, incidence and YLDs of Uterine Fibroids in 2050
3. Discussion
In this study, we systematically evaluated the temporal trends in the prevalence and incidence of UF and the attributable years lived with disability (YLD) rates over the past three decades. Globally, from 1990 to 2021, the ASPRs, ASIRs and YLDs of UF exhibited a sustained upward trajectory. In the coming decades, UF are expected to remain a significant global health concern. Accordingly, it is imperative to prioritize preventive strategies and implement region-specific allocation of medical resources to address the disease burden effectively.
Across different SDI regions, heterogeneous patterns in the ASPR of UF were observed, reflecting underlying regional disparities. In high- and high-middle-SDI regions, a modest decline in prevalence was noted; conversely, in middle-, lower-middle-, and low-SDI regions, the ASPR exhibited a notable upward trend. Geographically, the substantial increases in ASPR were observed in tropical Latin America, South Asia, and East Asia. These trends are likely driven by an interplay of metabolic, reproductive, and behavioral risk factors that disproportionately affect transitioning populations. Currently, obesity is a significant risk factor for the development of UF, as adipose tissue increases estrogen levels in the body, stimulating the proliferation of uterine smooth muscle cells and thereby increasing the risk of uterine fibroid development [26]. Given that high-fat diets are a key driver of weight gain and adiposity, such dietary patterns may serve as upstream contributors to fibroid pathogenesis through hormonal modulation [27]. Notably, countries such as Italy and Spain have adopted public health strategies encouraging adherence to the Mediterranean diet, and many areas in Central Latin America have retained traditional dietary patterns rich in fruits and vegetables [28]. Such dietary structures, enriched with antioxidants and dietary fiber, have been suggested to be associated with a reduced risk of uterine fibroid development [29]. Previous studies have demonstrated that declining parity and delayed childbearing, which are characteristic of urbanization and socioeconomic transitions, extend the cumulative duration of endogenous estrogen exposure [30]. At the same time, these reproductive shifts, compounded by increasing overweight and obesity prevalence, collectively foster a pro-estrogenic internal milieu [31]. Additionally, recent decades have witnessed a notable expansion of gynecological screening infrastructure across rapidly developing regions, a trend that profoundly influences the epidemiological understanding of UF. Health statistics from various countries suggest that in urban areas of East Asia, South Asia, and Latin America, the rates of gynecological screening and coverage have substantially improved in recent years, leading to the detection of more early-stage or asymptomatic UF [13]. This expanded access to routine examinations may have facilitated the identification of more early-stage or asymptomatic cases, potentially contributing to the observed increase in reported prevalence and the emergence of surveillance artifacts. Nonetheless, in low-SDI regions such as sub-Saharan Africa and South Asia, limited utilization of diagnostic imaging may result in underdiagnosis of uterine fibroids and consequent underestimation of disease burden. These limitations highlight the critical need to strengthen diagnostic capacity and surveillance systems to achieve more accurate burden estimates in resource-constrained settings [32].
Globally, the ASIR of UF in 2021 showed an overall increasing trend. In different SDI regions, the ASIR of UF varied, with high-middle-SDI regions being the only regions that showed a decreasing trend. In contrast, the incidence rates in the lower-middle and low-SDI regions significantly increased. In terms of geographic differences, tropical Latin America and South Asia have experienced the significant increases in incidence, with the decreases in incidence rates occurring in Central Latin America and Western Europe. Among the differences observed across 204 countries, nations such as Poland, the United Kingdom, and New Zealand presented significant declines in the ASIRs of UF. The declining incidence of uterine fibroids in countries such as Poland, the United Kingdom, and New Zealand may reflect the influence of well-established gynecological care systems and early intervention mechanisms [33]. In contrast, countries such as Brazil, India, and the United States have experienced rapid increases in incidence rates, which may result from ethnogenetic susceptibility and environmental exposures. Data from the Centers for Disease Control and Prevention (CDC) show that African American women have a 2–3 times greater risk of developing UF than white women do [34].This disparity arises from complex interactions between genetic predispositions and environmental influences. While genetic factors (such as higher frequencies of MED12 mutations) establish baseline susceptibility in Black women, parallel research reveals that environmental triggers constitute a universal risk amplifier [35]. Research on environmental pollution and endocrine-disrupting chemicals (EDCs) suggests that EDC exposure from environmental pollution may promote fibroid growth via estrogenic pathways in experimental models [36, 37].
From 1990 to 2021, global YLDs due to UF showed an increasing trend, reaching 15.7 million in 2021. With the continuous increase in total YLDs, the age-standardized rate (ASR) increased by an average of 0.1% per year, indicating that population aging and overall population growth are the main drivers of the increase in YLDs. In low–middle-SDI regions, YLDs increased significantly. In contrast, a declining trend observed in high–middle-SDI regions. Disease burden patterns across SDI regions appear to generally correspond with their levels of economic development, suggesting that socioeconomic context plays an important role in shaping health system capacity and disease outcomes. In lower-SDI regions, resource constraints may limit access to timely diagnosis and advanced treatment options, potentially contributing to a greater disease burden. In comparison, higher-SDI regions are more likely to benefit from stronger healthcare infrastructure, wider coverage of screening services, and broader therapeutic availability, which may help reduce the impact of disease [3, 38].Nevertheless, the management of UF remains constrained by both therapeutic limitations and pronounced disparities in health care resource allocation. Pharmacological treatments such as gonadotropin-releasing hormone (GnRH) analogs and selective progesterone receptor modulators (SPRMs) are effective at relieving symptoms but are often associated with hypoestrogenic side effects and are unsuitable for long-term use [39, 40]. Surgical interventions, including myomectomy and hysterectomy, remain the cornerstone of treatment in many regions, yet they pose significant risks, such as postoperative complications, loss of fertility, and high recurrence rates, particularly after conservative procedures. The application of minimally invasive treatments for UF, such as uterine artery embolization (UAE) and high-intensity focused ultrasound (HIFU), remains largely restricted to high-SDI countries because of their requirements for advanced infrastructure, high procedural costs, and specialized clinician training [41, 42]. Consequently, given the considerable financial implications associated with UF management, especially in low-resource settings, consequently, greater efforts may be required to reduce health disparities and alleviate the long-term burden on both patients and healthcare systems. This includes improving access to clinically effective and financially accessible advanced medical technologies in low-resource settings, with a particular focus on minimally invasive procedures that balance therapeutic efficacy with affordability for patients. Expanding insurance coverage for a wider range of UF treatments may also help reduce out-of-pocket expenses and lower financial barriers to care.
The age-specific pattern of uterine fibroid burden observed in this study highlights the particular vulnerability of women in reproductive years. The highest incidence occurred among women aged 35–39 years, while the prevalence and YLDs peaked in the 40–44 age group. Importantly, this elevated burden during peak reproductive years has direct implications for fertility, pregnancy outcomes, and overall quality of life. UF is a leading cause of infertility, recurrent pregnancy loss, and obstetric complications such as preterm birth and abnormal placentation [5, 30]. The functional consequences, including chronic pelvic pain and heavy menstrual bleeding, also affect daily functioning and work productivity [43, 44]. Therefore, reproductive-age women, particularly those between 30 and 45 years, should be prioritized for public health interventions. The targeted strategies include expanded access to uterine-sparing therapies and individualized hormonal treatments for symptomatic women of reproductive age. Concurrently, efforts to integrate fibroid screening into routine gynecologic care, especially for women approaching their mid-30s, could enable earlier identification and reduce downstream surgical burdens [33]. In contrast, although UF burden tends to decline after menopause, its clinical significance in postmenopausal women should not be overlooked. Several studies have indicated a potential overlap in genetic susceptibility and risk factors between uterine fibroids and endometrial cancer [45, 46]. Some postmenopausal women may continue to experience symptoms due to residual fibroid volume or coexisting gynecologic conditions such as adenomyosis or endometrial pathology, potentially obscuring underlying malignant risks. This underscores the importance of maintaining vigilance and ensuring accessible gynecological care for postmenopausal populations, while also highlighting the need for provider training in differential diagnosis and risk stratification to support appropriate management of persistent or atypical presentations [47].
In the future, targeted early intervention strategies will be essential for mitigating the uterine fibroid burden. In low-SDI regions, such strategies should prioritize the strengthening of reproductive health services, improving access to minimally invasive therapies, and promoting preventive measures such as healthy dietary patterns and obesity control [48]. In contrast, although high-SDI regions have shown a declining trend in disease burden, it remains necessary to evaluate the effectiveness of existing public health responses. Further efforts should focus on systematically planning evidence-based policies and expanding research to refine fibroid prevention and management frameworks in pursuit of global equity.
This study is the first to utilize GBD 2021 data and combine AAPC analysis with the ARIMA model to assess temporal trends and forecast the global age-standardized burden of uterine fibroids, providing valuable insights for future prevention and control strategies. There are several limitations in our study. Although the GBD incorporates epidemiological research and health statistics from a wide range of countries and regions, data scarcity or variability in data quality in certain settings, particularly in low-income countries or areas with incomplete reporting, may affect the accuracy of the results. Moreover, as our forecasts are derived from historical trends, they may have limited capacity to capture unexpected disruptions such as changes in diagnostic protocols, healthcare accessibility, or other unforeseen public health events. To enhance predictive accuracy, future research should explore context-specific modeling strategies and assess the long-term impact of targeted interventions across diverse settings. Third, it is worth noting that during the COVID-19 pandemic, delays in non-urgent medical visits, reduced availability of gynecological services, and postponed diagnoses may have compromised data completeness and accuracy, potentially introducing bias into recent estimates of the uterine fibroid disease burden. Future analyses may benefit from incorporating COVID-19 related variables through supplementary data sources or refined modeling strategies to better understand their implications for women’s reproductive health. Fourth, although the GBD framework standardizes disease classification by mapping multiple versions of the International Classification of Diseases (ICD) to a unified cause list, structural differences in coding systems and diagnostic criteria over time may still introduce residual inconsistencies. These discrepancies could affect the ascertainment of uterine fibroid cases and, in turn, influence the comparability of long-term trends.
Conclusion
UF remain the most common benign gynecological tumors, posing a substantial health care burden. Socioeconomic factors, diagnostic advancements, and lifestyle changes influence long-term trends. Strengthened epidemiological surveillance and public health interventions are needed.
Acknowledgements
None.
Permission to reuse and copyright
All data copyright belongs to the author.
Abbreviations
- UF
Uterine fibroids
- SDI
Socio-demographic Index
- GBD 2021
Global Burden of Disease Study 2021
- ASPR
Age-Standardized Prevalence Rate
- ASIR
Age-Standardized Incidence Rate
- ASR-YLDs
Age-Standardized Rate of YLDs
- YLDs
Years Lived with Disability
- AAPC
Average Annual Percentage Change
- CI
Confidence Interval
- UIs
Uncertainty Intervals
Authors’ contributions
Each author significantly contributed to the conception and development of this research. ZZ contributed to data collection, model construction, and initial manuscript drafting. HH conducted statistical analyses and led result validation. KJ participated in study design and completed the literature review. W L performed regional data calibration and visualization. YX and WL oversaw study design, guided model optimization, ensured academic rigor, revised the manuscript, coordinated interdisciplinary collaboration, and managed manuscript submission and academic correspondence. All authors participated in result interpretation and final manuscript approval, in compliance with international authorship guidelines.
Funding
This research was supported by the following grants: (1) National Natural Science Foundation of China, Grant No. 72204069; (2) National Natural Science Foundation of China, Grant No. 72464012; (3) Academic Enhancement Support Program of Hainan Medical University, Grant No. XSTS2025071.
Data availability
Epidemiological estimates for UF were derived from GBD 2021 study, which was made available by the Institute for Health Metrics and Evaluation through the Global Health Data Exchange (GHDx; https://ghdx.healthdata.org/gbd-results-tool). The GBD framework integrates data from diverse sources such as vital registration systems, hospital records, outpatient datasets, population-based surveys, and cancer registries. It encompasses 204 countries and territories, covering 369 disease and injury categories, 286 causes of death, and 87 behavioral, environmental, and metabolic risk factors. To ensure consistency across time and geography, standardized case definitions, data harmonization procedures, and quality adjustment protocols were applied.
Ethics approval and consent to participate
Not applicable, this study was entirely an analysis of data from published secondary sources, and there was not any specific human subject involved.
Consent for publication
Not applicable.
Competing interests
The authors declare no competing interests.
Footnotes
Publisher’s Note
Springer Nature remains neutral with regard to jurisdictional claims in published maps and institutional affiliations.
References
- 1.De La Cruz MS, Buchanan EM. Uterine fibroids: diagnosis and treatment. Am Fam Physician. 2017;95(2):100–7. PMID: 28084714. [PubMed] [Google Scholar]
- 2.Freytag D, Günther V, Maass N, Alkatout I. Uterine fibroids and infertility. Diagnostics (Basel). 2021;11(8):1455. 10.3390/diagnostics11081455. [DOI] [PMC free article] [PubMed] [Google Scholar]
- 3.Ghant MS, Sengoba KS, Recht H, Cameron KA, Lawson AK, Marsh EE. Beyond the physical: a qualitative assessment of the burden of symptomatic uterine fibroids on women’s emotional and psychosocial health. J Psychosom Res. 2015;78(5):499–503. 10.1016/j.jpsychores.2014.12.016. [DOI] [PubMed] [Google Scholar]
- 4.Yu O, Scholes D, Schulze-Rath R, Grafton J, Hansen K, Reed SD. A US population-based study of uterine fibroid diagnosis incidence, trends, and prevalence: 2005 through 2014. Am J Obstet Gynecol. 2018;219(6):e5911–8. 10.1016/j.ajog.2018.09.039. [DOI] [PubMed] [Google Scholar]
- 5.Balasch J, Gratacós E. Delayed childbearing: effects on fertility and the outcome of pregnancy. Fetal Diagn Ther. 2011;29(4):263–73. 10.1159/000323142. [DOI] [PubMed] [Google Scholar]
- 6.Millien C, Manzi A, Katz AM, Gilbert H, Smith Fawzi MC, Farmer PE, et al. Assessing burden, risk factors, and perceived impact of uterine fibroids on women’s lives in rural haiti: implications for advancing a health equity agenda,a mixed methods study. Int J Equity Health. 2021;20(1):1. 10.1186/s12939-020-01327-9. [DOI] [PMC free article] [PubMed] [Google Scholar]
- 7.Medema AM, Zanolli NC, Cline B, Pabon-Ramos W, Martin JG. Comparing magnetic resonance imaging and ultrasound in the clinical evaluation of fibroids prior to uterine artery embolization. Curr Probl Diagn Radiol. 2024;53(2):308–12. 10.1067/j.cpradiol.2024.01.028. [DOI] [PubMed] [Google Scholar]
- 8.Giuliani E, As-Sanie S, Marsh EE. Epidemiology and management of uterine fibroids. Int J Gynaecol Obstet. 2020;149(1):3–9. 10.1002/ijgo.13102. [DOI] [PubMed] [Google Scholar]
- 9.Jacoby VL, Fujimoto VY, Giudice LC, Kuppermann M, Washington AE. Racial and ethnic disparities in benign gynecologic conditions and associated surgeries. Am J Obstet Gynecol. 2010;202(6):514–21. 10.1016/j.ajog.2010.02.039. [DOI] [PMC free article] [PubMed] [Google Scholar]
- 10.Sengoba KS, Ghant MS, Okeigwe I, Mendoza G, Marsh EE. Racial/ethnicdifferences in women’s experiences with symptomatic uterine fibroids: a qualitative assessment. J Racial Ethn Health Disparities. 2017;4(2):178–83. 10.1007/s40615-016-0216-1. [DOI] [PMC free article] [PubMed] [Google Scholar]
- 11.Harrington A, Bonine NG, Banks E, Shih V, Stafkey-Mailey D, Fuldeore RM, et al. Direct costs incurred among women undergoing surgical procedures to treat uterine fibroids. J Manag Care Spec Pharm. 2020;26(1–a Suppl):S2–10. 10.18553/jmcp.2020.26.1-a.s2. [DOI] [PMC free article] [PubMed] [Google Scholar]
- 12.Cardozo ER, Clark AD, Banks NK, Henne MB, Stegmann BJ, Segars JH. The estimated annual cost of uterine leiomyomata in the united States. Am J Obstet Gynecol. 2012;206(3):e2111–9. 10.1016/j.ajog.2011.12.002. [DOI] [PMC free article] [PubMed] [Google Scholar]
- 13.Li B, Wang F, Chen L, Tong H. Global epidemiological characteristics of uterine fibroids. Arch Med Sci. 2023;19(6):1802–10. 10.5114/aoms/171786. [DOI] [PMC free article] [PubMed] [Google Scholar]
- 14.Gleason JL, Thoma ME, Zukerman Willinger N, Shenassa ED. Endometriosis and uterine fibroids and their associations with elevated C-reactive protein and leukocyte. J Womens Health (Larchmt). 2022;31(7):1020–8. 10.1089/jwh.2021.0044. telomere length among a representative sample of US women: data from the National Health and Nutrition Examination Survey, 1999–2002. [DOI] [PubMed]
- 15.Martin CL, Huber LR, Thompson ME, Racine EF. Serum micronutrient concentrations and risk of uterine fibroids. J Womens Health (Larchmt). 2011;20(6):915–22. 10.1089/jwh.2009.1782. [DOI] [PubMed] [Google Scholar]
- 16.Ginindza V, Nyirenda M, Hlongwa M, Ginindza TG. Mapping evidence onthe distribution of uterine fibroids in sub-Saharan africa: a scoping review protocol. PLoS ONE. 2024;19(7):e0298246. 10.1371/journal.pone.0298246. [DOI] [PMC free article] [PubMed] [Google Scholar]
- 17.He Y, Zeng Q, Dong S, Qin L, Li G, Wang P. Associations between uterine fibroids and lifestyles including diet, physical activity and stress: a case-control study in China. Asia Pac J Clin Nutr. 2013;22(1):109–17. 10.6133/apjcn.2013.22.1.07. [DOI] [PubMed] [Google Scholar]
- 18.Vafaei S, Alkhrait S, Yang Q, Ali M, Al-Hendy A. Empowering strategiesfor lifestyle interventions, diet modifications, and environmental practices for uterine fibroid prevention; unveiling the LIFE UP awareness. Nutrients. 2024;16(6):807. 10.3390/nu16060807. [DOI] [PMC free article] [PubMed] [Google Scholar]
- 19.Burden of intracerebral haemorrhage. In europe: forecasting incidence and mortality between 2019 and 2050. Lancet Reg Health Eur. 2024;38:100842. 10.1016/j.lanepe.2024.100842. [DOI] [PMC free article] [PubMed] [Google Scholar]
- 20.GBD 2021 Gout Collaborators. Global, regional, and National burden of gout, 1990–2020, and projections to 2050: a systematic analysis of the global burden of disease study 2021. Lancet Rheumatol. 2024;6(8):e507–17. 10.1016/S2665-9913(24)00303-5. [DOI] [PMC free article] [PubMed] [Google Scholar]
- 21.GBD 2021 Anaemia Collaborators. Prevalence, years lived with disability, and trends in anaemia burden by severity and cause, 1990–2021: findings fromthe global burden of disease study 2021. Lancet Haematol. 2023;10(9):e713–34. 10.1016/S2352-3026(23)00160-6. [DOI] [PMC free article] [PubMed] [Google Scholar]
- 22.GBD 2019 Demographics Collaborators. Global age-sex-specific fertility, mortality, healthy life expectancy (HALE), and population estimates in 204 countries and territories, 1950–2019: a comprehensive demographic analysis for the global burden of disease study 2019. Lancet. 2020;396(10258):1160–203. 10.1016/S0140-6736(20)30977-6. [DOI] [PMC free article] [PubMed] [Google Scholar]
- 23.Kong Q, Xu X, Li M, Meng X, Zhao C, Yang X. Global, regional, and National burden of myocarditis in 204 countries and territories from 1990 to 2019: updated systematic analysis. JMIR Public Health Surveill. 2024;10:e46635. 10.2196/46635. [DOI] [PMC free article] [PubMed] [Google Scholar]
- 24.Deng Y, Li H, Wang M, et al. Global burden of thyroid cancer from 1990 to 2017. JAMA Netw Open. 2020;3(6):e208759. 10.1001/jamanetworkopen.2020.8759. [DOI] [PMC free article] [PubMed] [Google Scholar]
- 25.Schaffer AL, Dobbins TA, Pearson SA. Interrupted time series analysis using autoregressive integrated moving average (ARIMA) models: a guide for evaluating large-scale health interventions. BMC Med Res Methodol. 2021;21(1):58. 10.1186/s12874-021-01235-8. [DOI] [PMC free article] [PubMed] [Google Scholar]
- 26.Wise LA, Radin RG, Kumanyika SK, Ruiz-Narváez EA, Palmer JR, Rosenberg L. Prospective study of dietary fat and risk of uterine leiomyomata. Am JClin Nutr. 2014;99(5):1105–16. 10.3945/ajcn.113.073635. [DOI] [PMC free article] [PubMed] [Google Scholar]
- 27.Wiseman MJ. Nutrition and cancer: prevention and survival. Br J Nutr. 2019;122(5):481–7. 10.1017/S0007114518002222. [DOI] [PubMed] [Google Scholar]
- 28.Bombana M, Wensing M, Wittenborn L, Ullrich C. Health education aboutlifestyle-related risk factors in gynecological and obstetric care: a qualitative study of healthcare providers’ views in Germany. Int J Environ Res Public Health. 2022;19(18):11674. 10.3390/ijerph191811674. [DOI] [PMC free article] [PubMed] [Google Scholar]
- 29.Wise LA, Radin RG, Palmer JR, Kumanyika SK, Boggs DA, Rosenberg L. Intake of fruit, vegetables, and carotenoids in relation to risk of uterine leiomyomata. Am J Clin Nutr. 2011;94(6):1620–31. 10.3945/ajcn.111.016600. [DOI] [PMC free article] [PubMed] [Google Scholar]
- 30.McWilliams MM, Chennathukuzhi VM. Recent advances in uterine fibroid etiology. Semin Reprod Med. 2017;35(2):181–9. 10.1055/s-0037-1599090. [DOI] [PMC free article] [PubMed] [Google Scholar]
- 31.Jebb SA, Moore MS. Contribution of a sedentary lifestyle and inactivity tothe etiology of overweight and obesity: current evidence and research issues. Med Sci Sports Exerc. 1999;31(11 Suppl):S534–41. 10.1097/00005768-199911001-00008. [DOI] [PubMed] [Google Scholar]
- 32.World Health Organization. Medical devices: managing the mismatch: an outcome of the priority medical devices project. Geneva: World Health Organization; 2010. https://apps.who.int/iris/handle/10665/44407. [Google Scholar]
- 33.Chandrakumar DL, Aref-Adib M, Odejinmi F. Advancing women’s health: the imperative for public health screening of uterine fibroids for personalized care. Eur J Obstet Gynecol Reprod Biol. 2024;296:16–9. 10.1016/j.ejogrb.2024.06.014. [DOI] [PubMed] [Google Scholar]
- 34.Fuldeore MJ, Soliman AM. Patient-reported prevalence and symptomatic burden of uterine fibroids among women in the united states: findings from a cross-sectional survey analysis. Int J Womens Health. 2017;9:403–11. 10.2147/IJWH.S133212. [DOI] [PMC free article] [PubMed] [Google Scholar]
- 35.Al-Hendy A, Myers ER, Stewart E. Uterine fibroids: burden and unmet medical need. Semin Reprod Med. 2017;35(6):473–80. 10.1055/s-0037-1607264. [DOI] [PMC free article] [PubMed] [Google Scholar]
- 36.Bariani MV, Rangaswamy R, Siblini H, Yang Q, Al-Hendy A, Zota AR. The role of endocrine-disrupting chemicals in uterine fibroid pathogenesis. CurrOpin Endocrinol Diabetes Obes. 2020;27(6):380–7. 10.1097/MED.0000000000000578. [DOI] [PMC free article] [PubMed] [Google Scholar]
- 37.Prins GS, Hu WY, Shi GB, Hu DP, Majumdar S, Li G, et al. Bisphenol A promotes human prostate stem-progenitor cell self-renewal and increases in vivo carcinogenesis in human prostate epithelium. Endocrinology. 2014;155(3):805–17. 10.1210/en.2013-1955. [DOI] [PMC free article] [PubMed] [Google Scholar]
- 38.Evans J, Jones K. The role of socioeconomic status in uterine fibroid awareness and treatment: a narrative review. Ther Adv Reprod Health. 2024;18:26334941241297634. 10.1177/26334941241297634. [DOI] [PMC free article] [PubMed] [Google Scholar]
- 39.Ali M, Raslan M, Ciebiera M, Zaręba K, Al-Hendy A. Current approachesto overcome the side effects of GnRH analogs in the treatment of patients with uterine fibroids. Expert Opin Drug Saf. 2022;21(4):477–86. 10.1080/14740338.2022.1989409. [DOI] [PMC free article] [PubMed] [Google Scholar]
- 40.Donnez J, Dolmans MM. Fibroids and medical therapy: bridging the gap from selective progesterone receptor modulators to gonadotropin-releasing hormone antagonist. Fertil Steril. 2020;114(4):739–41. 10.1016/j.fertnstert.2020.07.028. [DOI] [PubMed] [Google Scholar]
- 41.Chen J, Li Y, Wang Z, McCulloch P, Hu L, Chen W, et al. Evaluation ofhigh-intensity focused ultrasound ablation for uterine fibroids: an IDEAL prospective exploration study. BJOG. 2018;125(3):354–64. 10.1111/1471-0528.14689. [DOI] [PubMed] [Google Scholar]
- 42.Zhang Q, Liang X, Chen Z. An updated review of thermal ablation technology for uterine fibroids and adenomyosis: focusing on protecting fertility. Int J Womens Health. 2024;16:1551–63. 10.2147/IJWH.S47300. [DOI] [PMC free article] [PubMed] [Google Scholar]
- 43.Soliman AM, Anand SB, Coyne KS, Castelli-Haley J, Snabes M, Owens CD. Examining the relationship between symptomatic burden and self-reported productivity losses among patients with uterine fibroids in the united States. J Occup Environ Med. 2017;59(10):974–81. 10.1097/JOM.0000000000001105. [DOI] [PubMed] [Google Scholar]
- 44.Schoep ME, Adang EMM, Maas JWM, De Bie B, Aarts JWM, Nieboer TE. Productivity loss due to menstruation-related symptoms: a nationwide cross-sectional survey among 32,748 women. BMJ Open. 2019;9(6):e026186. 10.1136/bmjopen-2018-026186. [DOI] [PMC free article] [PubMed] [Google Scholar]
- 45.Kho PF, Mortlock S, Endometrial Cancer Association Consortium, International Endometriosis Genetics Consortium, Rogers PAW, Nyholt DR, Montgomery GW, Spurdle AB, Glubb DM, O’Mara TA. Genetic analyses of gynecologicaldisease identify genetic relationships between uterine fibroids and endometrial cancer, and a novel endometrial cancer genetic risk region at the WNT4 1p36.12 locus. Hum Genet. 2021;140:1353–65. 10.1007/s00439-021-02332-3. [DOI] [PubMed] [Google Scholar]
- 46.Kim JJ, Kurita T, Bulun SE. Progesterone action in endometrial cancer, endometriosis, uterine fibroids, and breast cancer. Endocr Rev. 2013;34(1):130–62. 10.1210/er.2012-1043. [DOI] [PMC free article] [PubMed] [Google Scholar]
- 47.Ulin M, Ali M, Chaudhry ZT, Al-Hendy A, Yang Q. Uterine fibroids in menopause and perimenopause. Menopause. 2020;27(2):238–42. 10.1097/GME.0000000000001438.]. [DOI] [PMC free article] [PubMed] [Google Scholar]
- 48.Black KI, Fraser IS. The burden of health associated with benign gynecological disorders in low-resource settings. Int J Gynaecol Obstet. 2012;119(Suppl1):S72–5. 10.1016/j.ijgo.2012.05.002. [DOI] [PubMed] [Google Scholar]
Associated Data
This section collects any data citations, data availability statements, or supplementary materials included in this article.
Data Availability Statement
Epidemiological estimates for UF were derived from GBD 2021 study, which was made available by the Institute for Health Metrics and Evaluation through the Global Health Data Exchange (GHDx; https://ghdx.healthdata.org/gbd-results-tool). The GBD framework integrates data from diverse sources such as vital registration systems, hospital records, outpatient datasets, population-based surveys, and cancer registries. It encompasses 204 countries and territories, covering 369 disease and injury categories, 286 causes of death, and 87 behavioral, environmental, and metabolic risk factors. To ensure consistency across time and geography, standardized case definitions, data harmonization procedures, and quality adjustment protocols were applied.