

Abstract
Hydrostatic pressure may affect the intracellular pH of microorganisms by (i) enhancing the dissociation of weak organic acids and (ii) increasing the permeability of the cytoplasmic membrane and inactivation of enzymes required for pH homeostasis. The internal pHs of Lactococcus lactis and Lactobacillus plantarum during and after pressure treatment at 200 and 300 MPa and at pH values ranging from 4.0 to 6.5 were determined. Pressure treatment at 200 MPa for up to 20 min did not reduce the viability of either strain at pH 6.5. Pressure treatment at pH 6.5 and 300 MPa reduced viable cell counts of Lactococcus lactis and Lactobacillus plantarum by 5 log after 20 and 120 min, respectively. Pressure inactivation was faster at pH 5 or 4. At ambient pressure, both strains maintained a transmembrane pH gradient of 1 pH unit at neutral pH and about 2 pH units at pH 4.0. During pressure treatment at 200 and 300 MPa, the internal pH of L. lactis was decreased to the value of the extracellular pH during compression. The same result was observed during treatment of Lactobacillus plantarum at 300 MPa. Lactobacillus plantarum was unable to restore the internal pH after a compression-decompression cycle at 300 MPa and pH 6.5. Lactococcus lactis lost the ability to restore its internal pH after 20 and 4 min of pressure treatment at 200 and 300 MPa, respectively. As a consequence, pressure-mediated stress reactions and cell death may be considered secondary effects promoted by pH and other environmental conditions.
Regulation of the cytoplasmic or internal pH (pHin) is a fundamental requirement for the survival and viability of microorganisms. The pHin is critical for the control of many cellular processes, such as ATP synthesis, RNA and protein synthesis, DNA replication, and cell growth. Furthermore, it is the major component of proton motive force, which plays an important role in secondary transport of several compounds, including sugars and amino acids (4). Lactic acid bacteria maintain a fairly constant pHin even when the pH of the external medium (pHex) decreases. However, a point occurs at which the difference between the pHin and the pHex (ΔpH) will collapse or approach zero, resulting in loss of cell viability (18).
The pH value of buffered solutions is influenced by pressure, because the dissociation constants (pKa values) of water and weak acids or weak bases depend on the absolute value of pressure. Because the pKas of phosphate and carboxylic acids are decreased by pressure, a decrease in pH is observed during pressure application in most biological systems. Such a decrease in pH may promote protein denaturation and inactivation of microorganisms in food (9). Furthermore, hydrostatic pressure induces a phase transition of the cytoplasmic membrane from the physiological liquid-crystalline to the gel phase and thus increases the membrane permeability and induces leakage of sodium and calcium ions (25). Although the irreversible, pressure-induced denaturation of proteins in aqueous solution generally requires pressures greater 300 MPa, pressures as low as 200 MPa have been shown to inactivate the membrane-bound transporters of F0F1 ATPase and HorA, a multidrug resistance (MDR) transporter of the ATP-binding cassette family, in Lactobacillus plantarum (29, 30).
Wouters et al. (30) investigated the effect of treatment at 250 MPa on the regulation of the pHin and the activity of F0F1 ATPase in Lactobacillus plantarum cells grown at pHs 5.0 and 7.0. They found that cells grown at pH 5.0 were more resistant to pressures than cells grown at pH 7.0. This difference in resistance may be explained by a higher F0F1 ATPase activity, a better ability to maintain a transmembrane pH gradient, or a higher acid efflux of the cells grown at pH 5.0. After pressure treatment, the ATPase activity was decreased, the ability to maintain a ΔpH was reduced, and the acid efflux was impaired as the cells lost viability. However, the pHin had already decreased before the number of CFU was reduced (30).
Abe et al. (1, 2) described the effect of hydrostatic pressure on the cell growth and on the vacuolar acidification of Saccharomyces cerevisiae. The pHin was measured during high-hydrostatic-pressure treatment using pH-sensitive fluorescent probes. Application of hydrostatic pressure caused a delay or cessation of cell growth and promoted the acidification of vacuoles in a manner dependent on the magnitude of the pressure applied (up to 60 MPa). Pressure-induced vacuole acidification is caused by the production of carbon dioxide. The ionization of H2CO3 (HCO3− plus H+) is facilitated by elevated pressure because the reaction is accompanied by a decrease in volume. Consequently, a large number of protons is produced in the cytoplasm, which becomes more acidic at elevated pressures. Abe et al. proposed that the yeast vacuole takes up protons from the cytoplasm to maintain a favorable cytoplasmic pH under high-pressure conditions, thereby functioning as a proton sequestrant (1, 2).
One of the main difficulties in understanding pressure inactivation is that the effects on cells are usually analyzed after decompression. For this reason, the aim of the present work was to investigate and to measure in situ the effects of both pHex and high pressure on the pHin and viability of Lactococcus lactis and Lactobacillus plantarum. Furthermore, the ability of the treated cells to restore the ΔpH was determined. To perform pHin measurements, a fluorescent method using 5 (and 6)-carboxyfluorescein succimidyl ester (cFSE) (7, 8) was adapted to Lactococcus lactis and Lactobacillus plantarum.
MATERIALS AND METHODS
Chemicals.
HEPES, MES [2-(N-morpholino)ethanesulfonic acid], valinomycin, and nigericin were obtained from Sigma-Aldrich (Steinheim, Germany), and 5 (and 6)-carboxyfluorescein diacetate N-succimidyl ester (cFDASE) was obtained from Fluka (Buchs, Switzerland). All other chemicals and M17 and MRS media were of analytical grade and obtained from Merck (Darmstadt, Germany).
Milk buffer.
The milk buffer was chosen to contain the same amounts of minerals and lactose as whey from rennet casein; the buffer contained the following compounds (in grams per liter): KCl, 1.10; MgSO4·7H2O, 0.71; Na2HPO4·2H2O, 1.87; CaSO4·2H2O, 1.00; CaCl2·2H2O, 0.99; citric acid, 2.00; and lactose, 52.00. The pH was adjusted to 6.5, 6.0, 5.0, and 4.0 with KOH (1 M).
Bacterial strain and culture conditions.
Lactococcus lactis subsp. cremoris MG1363 was grown at 30°C in M17 broth supplemented with 1% glucose (GM17 broth). Lactobacillus plantarum TMW1.460 was grown at 30°C in MRS medium.
Labeling of cells with cFSE for pHin determination.
The fluorescence method developed by Breeuwer et al. (8) was adapted to Lactococcus lactis subsp. cremoris MG1363 and Lactobacillus plantarum. Harvested cells were washed and resuspended in 50 mM HEPES buffer, pH 8.0. Subsequently, the cells were incubated for 15 min at 30°C in the presence of 10.0 μM cFDASE, washed, and resuspended in 50 mM potassium phosphate buffer, pH 7.0. To eliminate nonconjugated cFSE, glucose (final concentration, 10 mM) was added and the cells were incubated for an additional 30 min at 30°C. The cells were then washed twice, resuspended in corresponding milk buffer, and placed on ice until required.
Offline measurement of pHin at ambient pressure.
Stained cells were placed in a 2-ml cuvette (Sarstedt, Nümbrecht, Germany) and placed in the cuvette holder of a spectrometer (luminescence spectrometer model LS-50B; Perkin-Elmer, Überlingen, Germany). Fluorescence intensities were measured at excitation wavelengths of 485 and 410 nm by rapidly alternating the monochromator between both wavelengths. The emission wavelength was 520 nm, and the excitation and emission slit widths were 5 and 4 nm, respectively. The ratios of intensities at 485 nm to those at 410 nm were corrected for the background of the buffer. The incubation temperature was 30°C. Calibration curves were determined in buffers with pH values ranging from 4.0 to 8.0. Buffers were prepared from citric acid at pHs 4.0 and 5.0 (50 mM); MES at pHs 5.5, 6.0, and 6.5 (50 mM); and HEPES at pHs 7.0, 7.5, and 8.0 (50 mM). The pH was adjusted with either NaOH or HCl. The pHin and pHex were equilibrated by addition of valinomycin (1 μM) and nigericin (1 μM), and the ratios were determined as described previously. Calibration curves were established for experiments performed on a single day.
Pressurization of cell suspensions.
The cells of an overnight culture were harvested by centrifugation (15 min at 5500 × g), washed, and resuspended in milk buffer to about 109 CFU·ml−1. The cells were suspended in 2-ml portions in sterile plastic micro test tubes, sealed with silicon stoppers, and stored on ice until they were pressurized. The pressure chamber was heated or cooled to a desired level prior to pressurization with a thermostat jacket connected to a water bath. The pressure level, time, and temperature of pressurization were controlled by a computer program. The compression-to-decompression rate was 200 MPa min−1, the temperature was 20°C, and the temperature rise due to compression was 6°C or less. Samples were energized with 10 mM glucose and placed in the pressure chamber 5 min prior to treatment to equilibrate the sample temperature. Cells were exposed to a pressure of 200 or 300 MPa for various time intervals (0 to 120 min). Following the release of pressure the samples were stored on ice for determination of viable cell counts.
Enumeration of viable cells.
The cell suspensions from each vial were serially diluted with saline immediately after the pressurization treatment and were surface plated on GM17 or MRS agar. The plates were incubated for 24 h at 30°C. Selective agars were obtained with the addition of 3% NaCl to GM17 agar and 4% to MRS agar. Data presented are means ± standard deviations obtained from two to three independent experiments.
In situ measurement of pHin.
Fluorescence under hydrostatic pressures was measured in a pressure chamber equipped with a cylindrical sapphire window (10 × 8 mm) as described previously (11). Two milliliters of stained cells was placed in the pressure chamber and energized with 10 mM glucose. The lid was closed, and the device was connected with an optical fiber to a spectrometer (Perkin-Elmer luminescence spectrometer LS-50B). Fluorescence intensities were measured at excitation wavelengths of 485 and 410 nm by rapidly alternating the monochromator between both wavelengths. The emission wavelength was 520, and the excitation and emission slit widths were 15 nm to compensate for the loss of fluorescence intensity caused by the optical fiber. The incubation temperature was 20°C, and 5 min was allowed to pass prior to high-pressure treatment to equilibrate the temperature.
Calibration curves were determined in buffers with pH values ranging from 4.0 to 8.0. Buffers were prepared from milk buffers of pH 4.0, 5.0, and 6.0, and 50 mM HEPES buffer at pHs 7.0 and 8.0. The pH was adjusted with either NaOH or HCl for HEPES buffers and with KOH for the milk buffers. The pHin and pHex were equilibrated by addition of valinomycin (1 μM) and nigericin (1 μM), and the fluorescence was determined as described above. Since the signal-to-noise ratio during measurements in the pressure chamber decreased compared to the measurement in the cuvette, the fluorescence intensities were measured over a period of 5 min at either 0.1, 200, or 300 MPa and the means were calculated for each buffer. A calibration curve was established for each culture stained and pressure treated on a single day.
Reversibility test.
After the pressure treatment at pH 6.5, 1 ml of the pressure-treated samples was placed in a cuvette and the fluorescence intensities were determined as described above. After 3 min of equilibration, glucose was added to a final concentration of 10 mM and the changes in pHin were monitored over up to 30 min. The ΔpH of treated cells (pHin versus pHex) after 30 min of incubation was calculated.
Computation of the pH values during pressure treatment.
Various approaches have been proposed to calculate changes in pKa values of water and weak acids (16, 19). In this communication the following relation described by El'yanov and Hamman (10) was used:
 |
(1) |
where p denotes pressure, the superscript 0 denotes the value at atmospheric pressure, ΔVm is the molal volume change between the associated and dissociated forms of the buffering acid in solution, R is the universal gas constant (8,3145 J/kmol), T is the absolute temperature, and b is a universal constant (9.2 Pa−1). El'yanov and Hamman showed that this equation fits very well to experimental data obtained with various buffers and pressures of up to 120 MPa. This equation was found empirically and is in good agreement with the electrostatic theory of Born for the interactions between ions in solutions (6).
The application of equation 1 to mixtures of buffer salts exploits the balance of H3O+ ions. The pH value at ambient pressure, e.g., that measured with a pH glass electrode, must be known. Furthermore, the dissociation constant of water (pKw) and pKa and ΔV values at ambient pressure for all reactions must be available from data in the literature. It is sufficient to know the sum of the concentrations at ambient pressure (c0) of all components from one species, e.g.,
 |
to calculate the concentration of all components upon pressure shift with the law of mass action.
Equation 1 can be used to calculate the pKw and pKa values at high pressure. For a starting pHi (the subscript i is for iteration) the concentrations of all components are calculated based on the law of mass action. Based on the change of these concentrations, the number of H3O+ ions formed or consumed by a reaction is calculated. Equation 2 shows an example for calculation of ΔH3O+ for phosphoric acid and its salts.
 |
(2) |
Here c0 and c denote the concentrations at ambient and high pressure of the subscripted component, respectively. Water is treated like an acid (equation 3).
 |
(3) |
The iteration has converged if the predicted sum of H3O+ formed by individual dissociation reactions is equal to the predicted change in pH (in equation 4 denoted ΔH3OpH+).
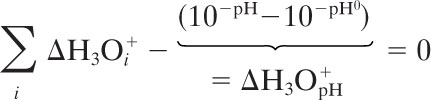 |
(4) |
If equation 4 (with pHi instead of pH) yields a figure lower than 0, one has to start the calculation with a smaller value of pHi and vice versa.
RESULTS
Effect of the buffer pH (pHex) on the pHin.
The pHin of energized cells of Lactococcus lactis and Lactobacillus plantarum were measured in HEPES, MES, and citrate buffer with pHex values ranging from 4.0 to 8.0 at atmospheric pressure (Fig. 1). Both lactic acid bacteria decreased their pHin values as a function of the pHex. The observed values of pHin of Lactobacillus plantarum were slightly lower than the corresponding values of Lactococcus lactis. Both organisms maintained an pHin between values of 6.3 and 8.0 at a buffer pHs of 4.0 and 8.0, respectively. Consequently, under acidic conditions (pHex < 5) the ΔpH across the cell membrane was maintained at around 2.0 whereas under alkaline conditions it was dissipated.
FIG. 1.

pHin of Lactococcus lactis subsp. cremoris MG1363 cells (•) and Lactobacillus plantarum TMW1.460 cells (○) in the presence of 10 mM glucose at different values of pHex. The assays were performed at 30°C and 0.1 MPa pressure. The buffers were prepared from citric acid (50 mM), MES (50 mM), and HEPES (50 mM). The pH was adjusted with either NaOH or HCl. Symbols represent means ± standard deviations of results from two independent experiments.
Calibration curve for measuring pHin under high pressure.
For the determination of pH effects on pHin values during high-pressure treatment, it must be taken into account that both temperature and pressure cause a pH shift and that each buffer exhibits a characteristic response to shifts in the p/T plane. Considering these effects, the changes in pH in buffers induced by high pressure were calculated and taken into account for the calibration of pHin values at 200 and 300 MPa. The final values of the pHs of the various buffers under high-pressure conditions are shown in Table 1. The calibration curves for measuring pHin under high-pressure conditions were obtained by addition of valinomycin and nigericin (1 μM) to cells of Lactococcus lactis or Lactobacillus plantarum suspended in milk buffer at pH 4.0, 5.0, or 6.0 or in HEPES buffer at pH 7.0 or 8.0. Examples for these calibration curves are shown in Fig. 2. In the presence of antibiotics dissipating the ΔpH, pressure application had only minor effects on the fluorescence of cFDASE located intracellularly, indicating its suitability as a probe for pHin during high-pressure treatments. However, because the pKa value of cFDASE is 6.5, the fluorescence ratios determined at pHs 4.0 and 5.0 almost coincided. The baseline noise of the ratio data collection was caused mainly by the rapid alteration of the emission monochromator between the two wavelengths. This mode of data collection was nevertheless preferred over a mere intensity measurement because differences in fluorescence intensity between individual samples and pressure ramps do not affect the fluorescence ratios. Generally, the experimental error for in situ pHin determinations was less than 0.5 pH units in the pH range of 5.0 to 8.0 and less than 1 pH unit for values below pH 5.0.
TABLE 1.
Changes of buffer pH at 20°C induced by high pressure
| Buffer | pH at indicated pressure (MPa)
|
|||
|---|---|---|---|---|
| 0.1a | 100b | 200b | 300b | |
| Phosphate buffer | 7.00 | 6.58 | 6.22 | 5.92 |
| HEPES buffer | 8.00 | 7.92 | 7.86 | 7.80 |
| HEPES buffer | 7.00 | 6.92 | 6.86 | 6.80 |
| Milk buffer | 4.00 | 3.64 | 3.49 | |
| Milk buffer | 5.00 | 4.54 | 4.35 | |
| Milk buffer | 6.00 | 5.34 | 5.09 | |
| Milk buffer | 6.50 | 5.79 | 5.52 | |
Reference values determined with glass electrode.
Calculated values.
FIG. 2.

Calibration of the assay for pHin determination using Lactococcus lactis at pHs of 8.0, 7.0, and 4.0 at a pressure of 300 MPa. To equilibrate pHex and pHin values, 1 μM concentrations (each) of valinomycin and nigericin were added prior to treatment. Shown is the ratio of fluorescence intensities measured at 485 and 410 nm. The shaded area indicates the pressure ramp up time (90 s from 0.1 to 300 MPa). The pH values indicated on the left axis indicate measured pH values at ambient pressure; the pH values indicated on the right axis indicate calculated pH values at 300 MPa.
Inactivation of Lactococcus lactis and Lactobacillus plantarum in milk buffer with different pHs.
The influence of cFDASE incorporation on the viability of Lactococcus lactis was determined by comparing inactivation curves from stained and unstained cells at 300 MPa. No significant differences in the numbers of viable cells were observed in treatments carried out with stained or native cells (data not shown). Further inactivation kinetics were determined with stained cells.
At 300 MPa of pressure, the curves showing inactivation of Lactococcus lactis in milk buffer with different pH values were sigmoid and asymmetric when they were plotted in a logarithmic scale, as previously described for Lactobacillus plantarum (data not shown and reference 28). After 8 min of pressure holding time, a reduction of cell counts by 2 log units was observed at pH 6.5 whereas a reduction of >5 log units was observed at pH 4.0. After 20 min of pressure holding time, a reduction of cell counts by 6 log units was achieved independent of the buffer pH. As opposed to pH effects on viable cell counts, the pH did not affect the numbers of sublethally injured cells.
Lactobacillus plantarum showed a greater resistance than Lactococcus lactis to pressure inactivation at 300 MPa. Treatments at pHs 4.0 and 5.0 reduced cell counts by 4 to 5 log units within 20 min, whereas treatment at pH 6.0 required 120 min to achieve a 5-log reduction, and at pH 6.5 the reduction was only 3 log units after 120 min. Sublethal injury of 90 to 99.9% of the population could be observed during pressure treatments at pHs 6.0 and 6.5; however, almost no sublethal injury was observed after treatments at pHs 4.0 and 5.0, indicating that injured cells were not able to survive.
Effect of high-pressure on the pHin of Lactococcus lactis.
The intracellular pH was determined by measuring the 485-nm/410-nm-wavelength fluorescence ratio of cFDSE-labeled cells during pressure treatments. The ratios of fluorescence intensities of Lactococcus lactis during pressure treatment at 300 MPa are shown in Fig. 3. The fluorescence ratios are compared to the viable cell counts. Based on the calibration samples, the pHin values at ambient pressure and at high pressure were calculated and are indicated in the graphs. The pHin measured at normal pressure corresponded within experimental error to those values shown in Fig. 1. Pressure treatment at 300 MPa and pH values ranging from 3.5 to 5.5 resulted in a drop in the pHin of Lactococcus lactis cells (Fig. 3), which indicates that the regulation of the pHin was impaired in these cells. The pHin approached the respective values of pHex during the first 90 s of treatment, corresponding to the compression of the samples to 300 MPa. However, a compression-decompression cycle had no apparent effect on cell viability at any pH. During the first 4 min of pressure holding time, greater than 90% of the cells were inactivated at any pH, yet the values for the pHin remained constant during the pressure holding time.
FIG. 3.

Ratios of fluorescence at 485 nm to that at 410 nm (lines), viability (circles), and pHins of cFSE-labeled Lactococcus lactis subsp. cremoris MG1363 during treatment at 0.1 and 300 MPa and 20°C in milk buffer at pH values ranging from 4.0 to 6.5. Samples were energized with 10 mM glucose and placed in the pressure chamber 5 min prior to treatment to equilibrate the sample temperature. The pHin at 0.1 and 300 MPa was calculated using the mean of the fluorescence ratios at 0.1 MPa (0 to 5 min) and using the mean fluorescence ratios at 300 MPa (8 to 12 min), respectively. (A) pH 4.0; (B) pH 5.0; (C) pH 6.0; (D) pH 6.5. The compression rate was 200 MPa min−1, and the ramp-up time was 90 s. The shaded area indicates the ramp-up time. Fluorescence ratios are representative for two independent experiments. The pHin values and cell counts represent means ± standard deviations for two independent experiments. The cell count of untreated cultures was 3.8 × 10⁹ ± 0.9 × 10⁹ CFU ml−1.
The fluorescence ratios of cFDASE-labeled cells of Lactococcus lactis during treatment at 200 MPa are shown in Fig. 4. A decrease in pHin was observed during compression of the sample. As opposed to the treatments at 300 MPa, the ΔpH was not fully dissipated after the ramp-up time but only after 1 min of pressure holding time. Thereafter, the values of pHin corresponded to the values of pHex. Despite the fast drop of pHin during treatments at 200 MPa, a reduction in cell viability was not observed during 6 min of pressure holding time at any pH (data not shown).
FIG. 4.

Ratios of fluorescence at 485 nm to that at 410 nm and pHins of cFSE-labeled Lactococcus lactis subsp. cremoris MG1363 during treatment at 200 MPa and 20°C in milk buffer at pH values ranging from 4.0 to 6.5. Samples were energized with 10 mM glucose and placed in the pressure chamber 5 min prior to treatment to equilibrate the sample temperature. The pHin at 0.1 and 200 MPa was calculated using the mean of the fluorescence ratios at 0.1 MPa (0 to 5 min) and the mean fluorescence ratios at 200 MPa (9 to 12 min), respectively. (A) pH 4.0; (B) pH 5.0; (C) pH 6.0; (D) pH 6.5. The compression rate was 200 MPa min−1, and the ramp-up time was 60 s. The shaded area indicates the ramp-up time. The cell count of untreated cultures was 3.8 × 10⁹ ± 0.9 × 10⁹ CFU ml−1, and significant changes in cell counts were not observed after 6 min of pressure treatment at any pH.
pH homeostasis of Lactococcus lactis after pressure treatment.
To control the reversibility of damage related to pH homeostasis, the cells pressure treated at pH 6.5 for various pressure holding times were incubated with glucose (10 mM) after decompression and the pHin was monitored. The results are compared to viable cell counts in Table 2. The dissipation of pHin values by pressure treatment was largely reversible after mild pressure treatments (less than 20 min at 200 MPa or less than 2 min at 300 MPa) but irreversible at treatment conditions resulting in appreciable inactivation of cells. The pressure holding time necessary for irreversible inactivation of cellular systems involved in pH homeostasis at 200 and 300 MPa (4 and 40 min, respectively) corresponded to the pressure holding time required for a decrease in cell viability. Sublethal pressure treatments thus sufficed to reversibly dissipate the ΔpH and to reduce the capacity of the cells to restore a pH gradient upon pressure treatment.
TABLE 2.
Cell counts and internal pHs of Lactococcus lactis and Lactobacillus plantarum after pressure treatment at 200 or 300 MPa
| Time (min)a |
Lactococcus lactis
|
Lactobacillus plantarum
|
||||
|---|---|---|---|---|---|---|
| 200 MPa
|
300 MPa
|
300 MPa
|
||||
| Cell count (%)b | ΔpH postpressurec | Cell count (%) | ΔpH postpressure | Cell count | ΔpH postpressure | |
| 0 | 103 ± 21 | 0.84 ± 0.21 | 108 | 0.70 ± 0.04 | 64 ± 34 | 0 |
| 1 | 76 ± 54 | 0.4 ± 0.2 | 58 ± 54 | 0 | ||
| 2 | 39 ± 53 | 0.3 ± 0.2 | 60 ± 57 | 0 | ||
| 4 | 8 ± 11 | 0.03 ± 0.1 | 97 ± 4 | 0 | ||
| 8 | 85 ± 19 | 0.30 ± 0.26 | 0.9 × 10⁻³ ± 1.3 | 0 ± 0 | 4 ± 5.7 | 0 |
| 20 | 95 ± 37 | 0.16 ± 0.07 | 1.5 × 10⁻³ ± 2 × 10⁻³ | 0 ± 0 | 1.4 ± 1.9 | 0 |
| 40 | 40 ± 40 | 0 ± 0 | 5.5 × 10⁻³ ± 3 × 10⁻³ | |||
| 60 | 25 ± 30 | 1.4 × 10⁻³ ± 0.6 × 10⁻³ | ||||
Pressure holding time, where 0 min indicates compression to 200 or 300 MPa followed by decompresion without a pressure holding time.
Cell counts (percentages of number of cells in untreated control sample). Values are means ± standard deviations of results from two independent experiments.
Ten millimolar glucose was added to pressure-treated samples, the evolution of the internal pH was monitored over 30 min, and the ΔpH values were calculated. Untreated cells had a ΔpH of 1.2 ± 0.1. Values are means ± standard deviations of results from two (200 MPa) or three (300 MPa) independent experiments.
Effect of high pressure on the pHin of Lactobacillus plantarum.
The ratios of fluorescence at wavelengths of 485 nm to those at 410 nm and the pHin values of Lactobacillus plantarum during treatments at 200 MPa and pH 4.0, 5.0, 6.0, or 6.5 are shown in Fig. 5. Neither pressure treatment resulted in appreciable inactivation of cells at pressure holding times of 6 min or less. In accordance with data shown in Fig. 1, values of pHin prior to compression to either 200 or 300 MPa (Fig. 6.) were about 7.6 at buffer pHs of 6.5 and 6.0 and about 7.5 and 6.5 at a buffer pHs of 5.0 and 4.0, respectively. During the pressure treatment, the pHin dropped with the build-up time of pressure and the final value of pHin was reached after the 60 s of the ramp. The final value of pHin at pH 4.0, namely, pH 3.6, corresponded well to the external pH (pH 3.5). However, at buffer pHs of 5.0, 6.0, and 6.5, the pHin remained above the pHex throughout the pressure treatment. This indicates that Lactobacillus plantarum, as opposed to Lactococcus lactis, was able to maintain a transmembrane proton potential even during incubation at 200 MPa. Accordingly, the pHin of Lactobacillus plantarum after pressure treatment in milk buffer at pH 6.5 and 200 MPa for 0, 1, 2, or 4 min corresponded to the value determined with untreated, energized cells (data not shown).
FIG. 5.

Ratios of fluorescence at 485 nm to that at 410 nm and pHins of cFSE-labeled Lactobacillus plantarum TMW 1.460 during treatment at 200 MPa and 20°C in milk buffer at pH values ranging from 4.0 to 6.5. Samples were energized with 10 mM glucose and placed in the pressure chamber 5 min prior to treatment to equilibrate the sample temperature. The pHin at 0.1 and 200 MPa was calculated using the mean of the fluorescence ratios at 0.1 MPa (0 to 5 min) and the mean fluorescence ratios at 200 MPa (9 to 12 min), respectively. (A) pH 4.0; (B) pH 5.0; (C) pH 6.0; (D) pH 6.5. The compression rate was 200 MPa min−1, and the ramp-up time was 60 s. The shaded area indicates the ramp-up time. The cell count of untreated cultures was 1.1 × 10⁹ ± 0.9 × 10⁹ CFU ml−1, and significant changes in cell counts were not observed after 6 min of pressure treatment at any pH.
FIG. 6.

Ratios of fluorescence at 485 nm to that at 410 nm (lines), viability (circles), and pHins of cFSE-labeled Lactobacillus plantarum TMW 1.460 during treatment at 300 MPa and 20°C in milk buffer at pH values ranging from 4.0 to 6.5. Samples were energized with 10 mM glucose and placed in the pressure chamber 5 min prior to treatment to equilibrate the sample temperature. The pHin at 0.1 and 300 MPa was calculated using the mean of the fluorescence ratios at 0.1 MPa (0 to 5 min) and the mean fluorescence ratios at 300 MPa (8 to 12 min), respectively. (A) pH 4.0; (B) pH 5.0; (C) pH 6.0; (D) pH 6.5. The compression rate was 200 MPa min−1, and the ramp-up time was 90 s. The shaded area indicates the ramp-up time. Fluorescence ratios are representative for two independent experiments. The pHin values and cell counts represent means ± standard deviations for two independent experiments. The cell count of untreated cultures was 1.1 × 10⁹ ± 0.9 × 10⁹ CFU ml−1.
The fluorescence ratios and internal pHins of Lactobacillus plantarum during pressure treatment at 300 MPa are shown in Fig. 6. The fluorescence ratio is compared to the viable cell counts under each condition. At 300 MPa, the pHin dropped concomitantly with compression time to 300 MPa and reached the value of the buffer pH within 90 s of pressure holding time. Significant effects of pressure on cell viability were observed only after 4 to 8 min of pressure holding time. As opposed to Lactococcus lactis, cells of Lactobacillus plantarum were not able to restore a partial ΔpH after pressure treatments at 300 MPa (Table 2). The results of the reversibility test did not show an increase of the pHin after pressure release. Even mild treatments, e.g., compression to 300 MPa and decompression without pressure holding time, caused an irreversible reduction of the pHin.
DISCUSSION
Hydrostatic pressure may affect the intracellular pH of microorganisms by (i) enhanced dissociation of weak organic acids and (ii) increased permeability of the cytoplasmic membrane and inactivation of enzymes required for pH homeostasis. In this study it was shown by in situ determination of pHin values that sublethal high-pressure treatments decreased the pHin of Lactococcus lactis and Lactobacillus plantarum cells to the level of the external pH. A reversible reduction of the pHin occurred concomitantly with compression prior to a reduction of viable cell counts. Furthermore, the regeneration of the ΔpH upon pressure release was monitored.
The cFSE method for pH determination is based on the internal conjugation of cFSE in the cytoplasm of cells, followed by the elimination of free probe by an incubation in the presence of a fermentable sugar. Efflux of fluorescent probe during high-pressure treatment, that may permeabilize the cells envelope were avoided because the succinimidyl group of cFSE is conjugated with the aliphatic amines of intracellular proteins (14). The useful range of fluorescent pH indicators is determined by their pKas; cFSE has a pKa of 6.5, compatible for working in the range expected for the pHins of our microorganisms. For lower pHin, the cFSE may be replaced with 5 (and 6)-carboxy-2′,7′-dichlorofluorescein succinimidyl ester, which has a pKa of 3.9 in buffer and a pKa of 4.9 when it is incorporated in bacterial cells (7, 24). The effects of cFSE incorporation on the cells prior to high-pressure treatments were negligible, since the viable counts of cells stained with cFSE were not different from those observed with unstained cells. Furthermore, the pHex did not affect either the cell viability or the pHin during storage of cells for up to 3 h at ambient pressure. The values for the pHin at atmospheric pressure of Lactococcus lactis and Lactobacillus plantarum at pHex values ranging from 4.0 to 8.0 determined in this work were comparable to those reported previously for Lactococcus lactis and Lactobacillus plantarum (4, 8, 24, 30). In both species investigated in this work, the pHin decreased with decreasing buffer pH, resulting in ΔpH values between 1.9 and 2.1 pH units at pH 4.0.
It is well established that a reduction in the pH of the suspending medium causes a progressive increase in the sensitivity of bacteria to pressure (3, 13, 17, 18, 22, 23). For example, pressurization at 345MPa and a pH values of 4.5 increased the viability loss of Staphylococcus aureus, Listeria monocytogenes, Escherichia coli and Salmonella enteritidis by an additional 1.2 to 3.9 log cycles compared to pressurization at pH 6.5 (3). The data on pressure inactivation kinetics at acidic and near neutral pH values presented in this study are consistent with these literature data. Both Lactococcus lactis and Lactobacillus plantarum were less pressure sensitive at pH 6.5 than at pH 4.0. However, independent of the buffer pH, a fraction of about 1 in 106 cells withstood pressure treatment for up to 120 min. For either strain, a greater degree of sublethal injury was observed at pH values of 6.5 and 6.0 compared to pressure treatment at pH 4.0 and 5.0. This indicates that at a pH value near neutral, sublethally injured cells survive and recover eventually upon transfer to a rich medium. At acidic pH values, sublethally injured cells are inactivated during pressure treatment.
Wouters et al. (30) reported a decrease on pHin of Lactobacillus plantarum after high-pressure treatment. Our results confirmed and extended these observations by pH measurements during pressure treatment, which allow the distinction between reversible and irreversible effects of pressure treatment on pH homeostasis. Compression of the samples resulted in a fast and reversible decrease of the pHin. At 300 MPa, the pHin was equal to the external pH with completion of the pressure up ramp, prior to a reduction of viable cell counts. The observation that the decrease of pHin occurred virtually in equilibrium with the pressure build up suggest that both the membrane permeability and the activity of proton pumps were affected by high pressure treatment.
Membrane and membrane-bound enzymes are a major target for the pressure inactivation of microorganisms (26). Under high-pressure the membrane lipids undergo a phase transitions from the liquid crystalline phase to the gel phase. This phase transition enhances the permeability of the membrane to ions, and inflicts cell injury because some transport proteins only function in a liquid-crystalline membrane (5). The sensitivity of bacteria is markedly affected by membrane properties (27, 29).
In Lactobacillus plantarum, pressure treatment caused partial inactivation of the F0F1 ATPase such that the ability of cells to maintain a ΔpH was reduced, and the acid efflux mechanism was impaired (30). Direct denaturation, dissociation of the quaternary structure, or the dislocation of the enzyme from the membrane may account for this effect. Ulmer et al. (28, 29) reported that inactivation of transport proteins is an early event during pressurization of microorganisms. Recent works at our laboratory with L. lactis confirmed the pressure inactivation of the membrane-bound multidrug transporter LmrP in Lactococcus lactis before a reduction on the CFU was observed (unpublished).
Remarkable differences in barotolerance pH homeostasis during pressure treatment were observed between Lactococcus lactis and Lactobacillus plantarum. The minimum pH permissive for growth of Lactococcus lactis is 4.0, whereas Lactobacillus plantarum is a highly acid tolerant beer spoiling organism growing at pH values of 3.5 or lower (12). In Lactococcus lactis, pH homeostasis was irreversibly disturbed after 4 min of pressure holding time at 300 MPa and after 40 min at 200 MPa. The loss of viability related not to the decrease of the pHin but to the loss of ability to restore the ΔpH after pressure treatment. Lactobacillus plantarum was more pressure tolerant that Lactococcus lactis at any pH value. The transmembrane proton potential was not fully dissipated by treatments at 200 MPa. The sensitivity of Lactobacillus plantarum to treatments at 300 MPa was affected to a greater extend by low pH conditions than that of Lactococcus lactis. This observation may relate to the inability of Lactobacillus plantarum to restore a ΔpH upon pressurization at 300 MPa even after 0 min pressure holding time. Our data thus support the hypothesis that pressure treatment restricts the pH range tolerated by bacteria as a consequence of the irreversible inhibition of ATPase-dependent transfer of protons and cations (23). Pagán et al. (20, 21) reported a sensitization of E. coli cells to acid by a pressure treatment. Because the lowering of the pHin upon pressure treatment did not explain the death of pressure damaged cells under acidic conditions, the authors suggested that this acid sensitivity is caused by the loss of protective or repair functions rather than to the loss a transmembrane ΔpH per se. Garcia-Graells et al. (13) reported a secondary inactivation of E. coli during storage in fruit juices at low pH after a primary pressure treatment inflicting sublethal injury to a large proportion of cells. This observation was confirmed for pressure resistant strains of E. coli O157 and Listeria monocytogenes (15). Survival and growth of lactic acid bacteria in beer was prevented by pressure treatments that resulted in a reduction of 50 to 99% of viable cell counts only but fully eliminated hop resistance of lactobacilli (12, 29).
The observation that the ability of microorganisms to survive in harsh environments is eliminated by pressure treatment allows the distinction between primary and secondary effects of high pressure treatments. The reversible or irreversible loss of concentration gradients across the cytoplasmic membrane may be considered as a primary effect of pressure treatment. Cell death may be considered a secondary event depending not primarily on pressure or pressure holding time, but on the environmental conditions during and after pressure treatment. This concept may prove useful to study the relevance of membrane properties in the bacterial response to environmental stress, and is especially relevant for the design of high-pressure processes for food preservation.
Acknowledgments
This work was supported by grant FOR 358/1 of the Deutsche Forschungsgemeinschaft.
We thank our students Micha Hoffmann, Lydia Tänzer, and Michaela Hampel for their contributions to this work.
REFERENCES
- 1.Abe, F., and K. Horikoshi. 1997. Vacuolar acidification in Saccharomyces cerevisiae induced by elevated hydrostatic pressure is transient and is mediated by vacuolar H+-ATPase. Extremophiles 1:89-93. [DOI] [PubMed] [Google Scholar]
- 2.Abe, F., C. Kato, and K. Horikoshi. 1999. Pressure-regulated metabolism in microorganisms. Trends Microbiol. 7:447-453. [DOI] [PubMed] [Google Scholar]
- 3.Alpas, H., N. Kalchayanand, F. Bozoglu, and B. Ray. 2000. Interactions of high hydrostatic pressure, pressurization temperature and pH on death and injury of pressure-resistant and pressure-sensitive strains of foodborne pathogens. Int. J. Food Microbiol. 60:33-42. [DOI] [PubMed] [Google Scholar]
- 4.Belguendouz, T., R. Cachon, and C. Diviès. 1997. pH homeostasis and citric acid utilization: differences between Leuconostoc mesenteroides and Lactococcus lactis. Curr. Microbiol. 35:233-236. [Google Scholar]
- 5.Beney, L., and P. Gervais. 2001. Influence of the fluidity of the membrane on the response of microorganisms to environmental stresses. Appl. Microbiol. Biotechnol. 57:34-42. [DOI] [PubMed] [Google Scholar]
- 6.Born, M. 1920. Volumen und Hydratationswärme der Ionen. Z. Physik 1:45. [Google Scholar]
- 7.Breeuwer, P., J. L. Drocourt, N. Bunschoten, H. M. Zwietering, F. Rombouts, and T. Abee. 1995. Characterization of uptake and hydrolysis of fluorescein diacetate and carboxyfluorescein diacetate by intracellular esterases in Saccharomyces cerevisiae, which result in accumulation of fluorescent product. Appl. Environ. Microbiol. 61:1614-1619. [DOI] [PMC free article] [PubMed] [Google Scholar]
- 8.Breeuwer, P., J. L. Drocourt, F. Rombouts, and T. Abee. 1996. A novel method for continuous determination of the intracellular pH in bacteria with the internally conjugated fluorescent probe 5 (and 6-)-carboxyfluorescein succinimidyl ester. Appl. Environ. Microbiol. 62:178-183. [DOI] [PMC free article] [PubMed] [Google Scholar]
- 9.Cheftel, J. C. 1995. High-pressure, microbial inactivation and food preservation. Food Sci. Technol. Int. 1:75-90. [Google Scholar]
- 10.El'yanov, B. S., and S. D. Hamann. 1975. Some quantitative relationships for ionization reactions at high pressures. Aust. J. Chem. 28:945-954. [Google Scholar]
- 11.Gänzle, M. G., and R. F. Vogel. 2001. On-line fluorescence determination of pressure mediated outer membrane damage in Escherichia coli. Syst. Appl. Microbiol. 24:477-485. [DOI] [PubMed] [Google Scholar]
- 12.Gänzle, M. G., H. M. Ulmer, and R. F. Vogel. 2001. High pressure inactivation of Lactobacillus plantarum in a model beer system. J. Food Sci. 66:1174-1181. [Google Scholar]
- 13.Garcia-Graells, C., K. J. A. Hauben, and C. W. Michiels. 1998. High-pressure inactivation and sublethal injury of pressure-resistant Escherichia coli mutants in fruit juices. Appl. Environ. Microbiol. 64:1566-1568. [DOI] [PMC free article] [PubMed] [Google Scholar]
- 14.Haugland, R. P. 1992. Succinimidyl esters and carboxylic acids, p. 24-33. In K. D. Larison (ed.), Handbook of fluorescent probes and research chemicals. Molecular Probes Inc., Eugene, Oreg.
- 15.Jordan, S. L., C. Cascual, E. Bracey, and B. M. Mackey. 2001. Inactivation and injury of pressure-resistant strains of Escherichia coli O157 and Listeria monocytogenes in fruit juices. J. Appl. Microbiol. 91:463-469. [DOI] [PubMed] [Google Scholar]
- 16.Lown, D. A., H. R. Thiersk, and L. Wynne-Jones. 1970. Temperature and pressure dependence of volume of ionization of acetic acid in water from 25 to 225°C and 1 to 3000 bars. Trans. Faraday Soc. 66:51. [Google Scholar]
- 17.Mackey, B. M., K. Foretière, and N. Isaacs. 1995. Factors affecting the resistance of Listeria monocytogenes to high hydrostatic pressure. Food Biotechnol. 9:1-11. [Google Scholar]
- 18.Nannen, N. L., and R. W. Hutkins. 1991. Proton-translocating adenosine triphosphatase activity in lactic acid bacteria. J. Dairy Sci. 74:747-751. [Google Scholar]
- 19.Owen, B. B., and S. R. Brinkley. 1941. Calculation of the effect of pressure upon ionic equilibria in pure water and in salt solutions. Chem. Rev. 29:461-474. [Google Scholar]
- 20.Pagán, R., S. Jordan, A. Benito, and B. Mackey. 2001. Enhanced acid sensitivity of pressure-damaged Escherichia coli O157 cells. Appl. Environ. Microbiol. 67:1983-1985. [DOI] [PMC free article] [PubMed] [Google Scholar]
- 21.Pagán, R., and B. Mackey. 2000. Relationship between membrane damage and cells death in pressure-treated Escherichia coli cells: differences between expontential- and stationary-phase cells and variaton among strains. Appl. Environ. Microbiol. 66:2829-2834. [DOI] [PMC free article] [PubMed] [Google Scholar]
- 22.Rademacher, B. 1999. Hochdruckbehandlung von Milch, Untersuchung von Mikroorganismen und Enzymen und deren kinetische Beschreibung. VDI Verlag, Düsseldorf, Germany.
- 23.Ritz, M., F. Jugiau, F. Rama, P. Courcoux, M. Semenou, and M. Federighi. 2000. Inactivation of Listeria monocytogenes by high hydrostatic pressure: effects and interactions of treatment variables studied by analysis of variance. Food Microbiol. 17:375-382. [Google Scholar]
- 24.Siegumfeldt, H., K. B. Rechingerand, and M. Jakobsen. 2000. Dynamic changes of intracellular pH in individual lactic acid bacterium cells in response to a rapid drop in extracellular pH. Appl. Environ. Microbiol. 66:2330-2335. [DOI] [PMC free article] [PubMed] [Google Scholar]
- 25.Smelt, J. P. P. M. 1998. Recent advances in the microbiology of high pressure processing. Trends Food Sci. Technol. 9:152-158. [Google Scholar]
- 26.Smelt, J. P. P. M., A. G. F. Rijke, and A. Hayhurst. 1994. Possible mechanism of high-pressure inactivation of microorganisms. High Pressure Res. 12:199-203 [Google Scholar]
- 27.ter Steeg, P. F., J. C. Hellemons, and A. E. Kok. 1999. Synergistic actions of nisin, sublethal ultrahigh pressure, and reduced temperature on bacteria and yeast. Appl. Environ. Microbiol. 65:4148-4154. [DOI] [PMC free article] [PubMed] [Google Scholar]
- 28.Ulmer, H. M., M. G. Gänzle, and R. F. Vogel. 2000. Effects of high pressure on survival and metabolic activity of Lactobacillus plantarum TMW1.460. Appl. Environ. Microbiol. 66:3966-3973. [DOI] [PMC free article] [PubMed] [Google Scholar]
- 29.Ulmer, H. M., H. Herberhold, S. Fahsel, M. G. Gänzle, R. Winter, and R. F. Vogel. 2002. Effects of pressure induced membrane phase transitions on inactivation of HorA, an ATP-dependent multidrug resistance transporter, in Lactobacillus plantarum. Appl. Environ. Microbiol. 68:1088-1095. [DOI] [PMC free article] [PubMed] [Google Scholar]
- 30.Wouters, P., E. Glaasker, and J. P. P. M. Smelt. 1998. Effects of high pressure on inactivation kinetics and events related to proton efflux in Lactobacillus plantaruam. Appl. Environ. Microbiol. 64:509-514. [DOI] [PMC free article] [PubMed] [Google Scholar]