

Abstract
Dominant Optic Atrophy is the leading cause of childhood blindness, with 60–80% of cases caused by mutation of the gene encoding the protein Optic Atrophy 1, OPA11. This condition dysregulates the GTPase mediated fusion process of the mitochondrial inner- and outer-membranes2. OPA1 is critical to the dynamic organization and regulation of the mitochondria due to its role in cristae remodeling and GTPase-mediated fusion of the inner mitochondrial membrane3. Here, we solved helical structures of OPA1 assembled on lipid membrane tubes, in the presence and absence of nucleotide, by cryo-electron microscopy methods. These helical assemblies organize into densely packed protein rungs with minimal inter-rung connectivity and exhibit nucleotide-dependent dimerization of the GTPase domains, a hallmark of dynamin superfamily proteins4. Still, OPA1 contains several unique secondary structures in the paddle domain that strengthen its membrane association including unique membrane inserting helices. The novel structural features identified in this study shed light on the effects of pathogenic point mutations upon protein folding, inter-protein assembly, and membrane interactions. Further, mutations chosen to disrupt OPA1 assembly interfaces and membrane binding cause mitochondrial fragmentation in cell-based assays, demonstrating the biological relevance of these interactions.
Mitochondria are doubly-enveloped organelles with the inner mitochondrial membranes (IMM) marked by invaginated cristae3,5,6. Membrane fusion and fission processes of mitochondrial membranes, driven by dynamin superfamily proteins (DSPs), are critical to the dynamic organization and regulation of mitochondria3,5,7. For the outer mitochondrial membrane (OMM), mitofusins-1 and −2 (Mfn1/2) and dynamin-related protein (DRP1) mediate fusion and fission, respectively3,8–13. For the IMM, Optic Atrophy 1 (OPA1) mediates fusion, cristae remodeling, mitochondrial DNA maintenance, and potentially fission (Fig. 1a)2,3,14,15. OPA1 exists in two forms in vivo; the transmembrane, long-form is IMM tethered, while the short, soluble form (s-OPA1) results from proteolytic cleavage in the inner membrane space (IMS) (Fig. 1b)5,14,16.
Fig. 1: The cryoEM structure of s-OPA1 in the presence of GDP-AlFx, highlighting oligomeric interfaces within the helical assembly.

a, Cartoon of two fusing mitochondria (Created with BioRender.com). OPA1 is shown in its dual roles: IMM fusion (top inset) and cristae morphological regulation (bottom inset). OPA1 is colored by domain: GTPase, green; BSE, pink; stalk, blue; paddles, orange; hinge-1, light gray; N-term, dark gray. Top inset, OPA1 is slightly transparent to visualize the underlying membrane. B, Sequence diagram of OPA1 colored by domain and with residue positions labeled above. The OPA1 isoform-1 S1 cleavage site is shown with a yellow arrow at residue 195. C, Model of s-OPA1 GDP-AlFx, colored as in (b) with DOA point mutations highlighted as side-chain sticks on the model. Kinks and turns in the stalk are colored light blue and membrane inserting regions are colored a lighter orange in the paddle. Alpha-helices in the model are labeled according to the sequence diagram in Supplementary Fig. 2. D, CryoEM map of s-OPA1 GDP-AlFx assembled on membrane (top view) with the dimer model colored. E, Model of s-OPA1 dimer with 3 distinct interfaces (circled numbers). Interface-1 is between the stalks of the monomers (denoted monomer A and B). Interface-2 is between the stalk and paddle of the opposing monomers. Interface-3 is between the paddles of the dimer. Monomer A is colored as above and monomer B is shown in lighter hues. The membrane bilayer surface is shown in gray. f, Side view of s-OPA1 GDP-AlFx assembled on membrane with the s-OPA1 tetramer colored. G, Model of s-OPA1 where the tetramer forms through interface-4 between the paddle-hinges of monomer A from dimer-1 and monomer B from dimer-2. Paddle alpha-helices are labeled as in Supplementary Fig. 2.
The OPA1 gene is the most frequently mutated gene in the disease Dominant Optic Atrophy (DOA), the leading cause of childhood blindness1,17–20. The LOVD database currently has over 640 unique mutations of OPA1, where pathogenic mutations can cause progressive vision loss, hearing loss, ataxia, and myopathy1,17–20. Molecularly, this results from mitochondrial dysfunction, including mitochondrial network fragmentation, mitochondrial-DNA loss, and loss of respiratory function15,17,20. The urgency to develop a DOA treatment has led to significant interest in OPA1, yet the mechanics of its roles in membrane remodeling remain elusive3,14,15,21. Previous structural studies of OPA1 have suggested similarities to other DSPs, but insight from these studies on pathological OPA1 mutations is limited by the use of shortened constructs, or the absence of a membrane environment that facilitates the formation of higher-order assemblies22,23.
The eight isoforms of OPA1 all contain an N-terminal S1 cleavage site for the protease OMA1, which responds to membrane depolarization. Four isoforms contain a second S2 cleavage site for YME1L coupled to mitochondrial respiration, and one isoform contains a third S3 cleavage site for YME1L (Fig. 1b, Supplementary Fig. 2)14–16,24. These cleavage events result in a dynamic ratio of long- and short-OPA1 which regulate mitochondrial morphology and function14,15,25. During fusion, the two forms of OPA1 must bring together two IMM leaflets from distinct mitochondria5,15,25.
Two X-ray structures have been solved for the s-OPA1 homolog (s-MGM1) from C. thermophilum and S. cerevisiae26,27. As in other DSPs, the C. thermophilum structure is tetrameric, with similar protein:protein interfaces (PDBID:6QL4)26,28. The S. cerevisiae structure captured s-MGM1 as a trimer in the presence of guanosine diphosphate (GDP) (PDBID:6JSJ)27. Still, the low ~30% sequence identity of MGM1 to OPA1 hinders their ability to inform on the human pathologies associated with DOA26,27. There are also low-resolution cryo-electron microscopy (cryoEM) structures of s-MGM1 and an N-terminally cleaved OPA1 construct (ΔN-OPA1, residues 253–960) solved as helical assemblies22,26. Curiously, s-MGM1 assembled on both the outside and inside of lipid tubes26, where the inner helical lattice presents a possible mechanism for cristae remodeling (PDBID:6RZV,6RZW)26. The outer s-MGM1 and ΔN-OPA1 helical assemblies were solved for two states (Apo and GTPγS) at low resolutions (~15–23 Å). Surprisingly, the GTPase domain dimerization typical of DSPs was not observed in either of these structures25,26, although a nucleotide-dependent GTPase domain dimer was seen for a minimal GTPase:BSE construct in the presence of GDP-BeFx (PDBID:6JTG)29.
CryoEM reveals novel s-OPA1 interfaces
Here, we present two cryoEM structures of human s-OPA1 assembled around a cardiolipin (CL) containing lipid bilayer (DOPS:CL) in the absence and presence of nucleotide (GDP-AlFx) (Fig. 1c–g, Extended Data Fig. 1). The full helical maps resolved to 5.48 Å with nucleotide and 9.68 Å without (Fig. 1d,f, Extended Data Fig. 1a,b). Z-clipping to 50% of the full map improved the resolutions to 3.86 Å and 5.8 Å, respectively (Extended Data Fig. 1c–f). We further improved the resolution using local non-uniform refinements (Extended Data Fig. 2, Supplementary Fig. 3)30,31 to 3.1–6.5 Å, from which we built models of s-OPA1 (Fig. 1c,e,g and Extended Data Figs. 3, 4). The observed domain organization of s-OPA1 parallels other DSPs with GTPase, BSE, and stalk domains (Fig. 1b,c)3,28,29. However, s-OPA1 has a uniquely kinked stalk26, an N-terminal coiled-coil juxta-membrane linker, and a cardiolipin specific paddle domain20,32. Using these models, we could locate DOA-associated point mutations and hypothesize how clinically significant mutations disrupt OPA1 function (Fig. 1c, Extended Data Table 1).
The s-OPA1 assemblies have outer diameters of 38.2 nm and 40.5 nm for the nucleotide-bound and nucleotide-free states, respectively, while the inner lumens are nearly identical in both states (~9.4 vs 9.5 nm) (Fig. 1d,f, Extended Data Fig. 1a,b). From these structures we were able to define novel oligomeric and membrane binding interfaces, identify the canonical nucleotide-dependent dimerization of the GTPase domains, and observe a new inter-rung N-terminal coiled-coil interface (Figs. 1e,g, 2). While the s-OPA1 maps possess substantial flexibility due to minimal inter-rung connectivity, as evidenced by the inherent curvature of the s-OPA1 tubes, they also display dense intra-rung packing (Extended Data Fig. 2a, Supplementary Fig. 3h,p).
Fig. 2: Interfaces involved in s-OPA1 helical assembly.

(a-g) Interfaces between chains of s-OPA1 GDP-AlFx are numbered and circled. In each case, the s-OPA1 monomers involved in the interface are colored by domain (see Fig. 1) with chain A and B a darker and lighter hue respectively. S-OPA1 chains not involved in the interfaces are colored gray. Left, insets show the s-OPA1 units in the context of the full helical map. a, Tetramer interface-4. B, GTPase dimer interface-5 between and A-chain of dimer-1 and B-chain of dimer-2. C, Tetramer interface-6 between the GTPase and stalk domains with A-chains (left) or B-chains (right). D, Interface-7 connecting the rungs of the helix through the paddle domains. E, The second interface between adjacent rungs, interface-8, involving the N-terminal coiled-coiled domain between dimer-1 A-chain and dimer-2 B-chain. N-terminal domains are colored purple with chain A and B a darker and lighter hue. F, A third interface within the tetramer, interface-9, between the N-terminal helix and the BSE from the dimers A-chains (left) or B-chains (right). N-terminal domains are colored as in (f). Interfaces were determined using PDBePISA33.
Local refinements also improved the resolution of novel interfaces that define the oligomerization of s-OPA1. The building block of s-OPA1 helical assemblies is a dimer, which is defined by 3 interfaces (interfaces 1–3) (Fig. 1e, Extended Data Figs. 3, 4a). A pair of dimers then assemble into a tetramer through a paddle:paddle contact, interface-4, and a smaller interface near the BSE domain (interface-9) (Figs. 1g, 2a,f, Extended Data Fig. 4b,g), with successive tetramers forming the full biological rung (Supplementary Fig. 3h,p). In the nucleotide-bound state, the helical assembly is further stabilized by the GTPase domain dimer (interface-5) and GTPase:stalk contact (interface-6) within the biological rung (Fig. 2b,c, Extended Data Fig. 4c,d, Supplementary Fig. 3h). Finally, two inter-rung contacts involve the paddle (interface-7) and N-terminal (interface-8) domains (Fig. 2d,e, Extended Data Fig. 4e,f), further stabilizing s-OPA1’s oligomerization.
While the s-OPA1 helix is overall similar to other DSPs, there are unique features across each stage of assembly. In the dimer, the stalk-dimer interface (interface-1) occurs along the opposite face of the stalk’s 4-helix bundle compared to s-MGM126. This results in a compressed, “W”-shaped, interface due to the tightly interlocked, kinked-stalk (interface-1; Fig. 1e,g, Extended Data Figs. 3a,d, 5a). Further, interface-1’s position within the s-OPA1 GDP-AlFx dimer causes the buried surface area between stalk and paddle domains to extend into two additional interfaces: between the stalk and paddle (interface-2), and between two Pα5 paddle helices (interface-3) (Fig. 1e, Extended Data Fig. 3a,d, Supplementary Table 1)33. Together, the buried surface area for a dimeric unit of s-OPA1 with GDP-AlFx bound covers an average area of 1330 Å2 (Extended Data Fig. 3a, middle, Supplementary Table 1)33, 11% more than in s-MGM126. Additional assembly into a tetramer involves an asymmetric contact at the membrane surface (interface-4) through Pα6 in the paddle-hinge of each s-OPA1 dimer (Figs. 1g, 2a, Extended Data Fig. 3a,d, Supplementary Table 1).
Upon nucleotide binding, the helical assembly compacts due to dimerization of the GTPase domain (Supplementary Video 1). This GTPase dimer interface (interface-5), is the largest interface in the s-OPA1 oligomer and resides intra-rung, whereas in other DSPs the GTPase dimer is inter-rung (Fig. 2b, Extended Data Fig. 4c, Supplementary Fig. 3h). Formation of interface-5 involves the GTPase domain and BSE swinging 25–27° along hinge-1, between the BSE and stalk domains (Fig. 3a,b). The GTPase interface and nucleotide binding pocket resemble the crystal structure of the minimal OPA1 GTPase domain dimer bound to GDP-BeFx (PDBID:6JTG, RMSD=2.995 Å), but with increased asymmetry along the dimer interface (Extended Data Fig. 5b,c)29. Incorporation into the helical assembly also results in a small swing of the BSE region, which is less resolved, likely due to heterogeneity or pull from the N-terminal region. Consistent with this, mapping the per-particle heterogeneity of both assemblies in cryoDRGN showed continuous transitions within the N-terminal and GTPase dimer regions (Supplementary Fig. 3r–t and Video 2)31. Relative to the crystal structure, the BSE helices of the GDP-AlFx bound assembly are offset 30.31° in the A-chain and 22.26° in the B-chain (Extended Data Fig. 5c). These shifts in the BSE suggest potential energy is stored in the assembled state to assist in the eventual disassembly upon GTP hydrolysis, as shown by our supernatant/pellet assay (Extended Data Fig. 2b).
Fig. 3: A comparison of s-OPA1 dimers and assembly in the apo and GDP-AlFx bound states.

A, Side view of s-OPA1 apo (left) and GDP-AlFx (right) helical structures with a dimer of s-OPA1 colored by domain (see Fig. 1). Models below highlighting the transition from the apo to the GDP-AlFx states, a shift to tighter stalk and paddle interfaces, and a 25–27° swing through hinge-1 of the GTPase and BSE domains. Helices are labeled as in the sequence alignment in Supplementary Fig. 2. B, GTPase dimer formation from apo (left) to GDP-AlFx states (right, interface-5). Membrane location shown in gray. Top left corner, orientation of models shown in cryoEM maps. C, Top, s-OPA1 apo helical structure with a dimer of s-OPA1 colored by domain. Bottom, minimal paddle domain insertion in the membrane. D, Top, s-OPA1 GDP-AlFx helical structure with a dimer of s-OPA1 colored by domain. Bottom, model revealing a deeper paddle domain insertion into the membrane. (c-d) Insets show the membrane-inserting loop that contains Pα2, the membrane-inserting Pα6, and a closer membrane contact for Pα1 and Pα5.
Previous structural studies of dynamin observed the BSE swing along hinge-2, referred to as the powerstroke, during the GTPase hydrolysis cycle34. This is in contrast to the swing we observed in s-OPA1 around hinge-1 upon nucleotide binding. In the proposed dynamin powerstroke, the BSE is in the up position in the GTP-bound state and swings down upon hydrolysis (Extended Data Fig. 5d)34. The positioning of the s-OPA1 BSE, relative to the GTPase domain, is in the down position, like dynamin in the presence of GDP-AlFx35. Curiously, the positioning of the BSE in a pre-powerstroke or up position has not been observed for OPA1 or MGM1, even in the presence of GTPγS, a GTP-bound state22,26.
In the paddle domain, interface-7 provides a rare inter-rung contact through Pα4 (Fig. 2d, Extended Data Figs. 3a,d, 4e), with similar buried surface area in the two states (Supplementary Table 1)33. Strikingly, in the GDP-AlFx bound state we also resolved a second inter-rung interface (interface-8) that resides above interface-7 and consists of a coiled-coil domain assembled from the N-terminal α-helix, Nα1 (Fig. 2e, Extended Data Fig. 4f). This region is unique to s-OPA1 homologs and has not been previously resolved in other ΔN-OPA1 structures. Additionally, despite its inherent flexibility, we found the N-terminal domain also interacts with the BSE domain (interface-9) (Fig. 2f, Extended Data Fig. 4g, Supplementary Table 1)33. We also observe electron density for the N-terminal region in the apo state and given that it is known to dimerize in the absence of nucleotide we expect this region still plays a major role in the apo assembly22. Overall, the decreased buried surface area and fewer interfaces of the apo state illustrates s-OPA1 is more loosely packed prior to nucleotide addition and correlates with increased variance in apo state diameters, explaining the apo structure’s reduced resolution (Extended Data Fig. 2b and Supplementary Table 1)33.
s-OPA1 paddle is primed to bind the IMM
Our s-OPA1 structure reveals a unique lipid binding motif in the paddle domain that has evolved to include both membrane-proximal and monotopic, membrane-inserting helices (Fig. 3c,d). These novel features result in more extensive membrane contact and insertion than in s-MGM126. In both s-OPA1 and s-MGM1, the paddle domain connects to the stalk through hinge-3, which includes a conserved disulfide bond that defines the paddle-hinge (OPA1 residues 856C-874C) (Extended Data Fig. 6b,d). However, the paddle-hinge of s-OPA1 is extended by the membrane-inserting Pα6 helix, with three more positively charged or aromatic residues (Extended Data Fig. 6b,c,d)26. Additionally, in the paddle-tip along the opposite surface of the paddle, the turn between the Pα1 and Pα3 helices is extended in s-OPA1 by a flexible membrane-inserting loop which contains the Pα2 helix, which has nine additional charged or aromatic residues. In the GDP-AlFx state, Pα2 inserts up to 16 Å into the bilayer and appears to interact with heterogeneous cardiolipin density (Fig. 3b–d, Extended Data Fig. 6c–j). s-OPA1 also has two central helices, Pα1 and Pα5, which are interfacial and similar in length to s-MGM1, but OPA1 has five more positively charged residues (Extended Data Fig. 6c,d). These extended helices better align the s-OPA1 paddle with the membrane surface. Finally, s-OPA1 has a Pα4 helix which forms interface-7 with a neighboring paddle domain and is anchored to the membrane through residue 824R (Fig. 2d, Extended Data Fig. 6c). s-MGM1 may compensate for the lack of Pα4 through the presence of an extended loop projecting out of the stalk, with five positively charged or aromatic residues (glycine-rich loop; Extended Data Fig. 6b)26. Overall, these differences in paddle composition and structure suggest the OPA1 paddle has evolved to enhance interactions with the IMM, through an extended paddle domain that supports a higher degree of hydrophobic insertion.
Comparing the apo and GDP-AlFx s-OPA1 states, the paddle domains are more closely associated to the membrane in the nucleotide-bound case, with more insertion of the paddle-tip (Pα2–4) and paddle-hinge (Pα6) helices (Fig. 3c,d). With nucleotide, the Pα2 helix is embedded 16 Å into the bilayer, 5 Å more than the average insertion in the apo state (~11 Å). Additionally, the Pα1, Pα3, and Pα5 helices rest on the membrane surface in the GDP-AlFx bound case, but are shallowly associated in the apo state (Fig. 3c,d). We propose that the increased membrane interactions upon nucleotide binding are driven by the GTPase domain dimerization, leading to a more compact structure that forces the paddle deeper into the membrane.
This insertion is most dramatic for the membrane-inserting loop with Pα2, which appears to play a critical role in membrane curvature remodeling and destabilization for fusion. Like other monotopic proteins, embedding the Pα2 helix displaces lipid molecules in the outer leaflet of the bilayer, driving positive curvature of the bilayer and helical assembly36,37. To enhance the resolution of the paddle-membrane interaction, we performed local refinements focusing on a section of the bilayer outer-leaflet. This improved the resolution around the inserted Pα2 helix (Extended Data Fig. 6e–j). Altering the threshold of the resulting maps also reveals conical, wedge-like densities that we propose are heterogeneous cardiolipin colocalization around the membrane-inserting loop and Pα2 helix (Extended Data Fig. 6e–j)38,39. These features are located at the protein interface within the bilayer outer-leaflet and allow for the charged and hydrophobic regions of the flexible cardiolipin molecule to align with the paddle (Extended Data Fig. 6g–j). A similar cardiolipin binding mode has been observed or proposed in other cardiolipin binding proteins39–43 and is supported by the flexibility of Pα2 and its enrichment in positively charged, hydrophobic, and aromatic residues (Extended Data Fig. 6d,j, Supplementary Video 2). Residues near the modeled cardiolipin include: T782, R774, K779, N780, W775, and W778.
Electrostatics in s-OPA1 assembly
Electrostatics appear to play a prominent role in the two s-OPA1 assemblies compared to other DSPs (Extended Data Fig. 7a–f). Putatively, the initial attraction between s-OPA1 and the cardiolipin containing membrane is aided both by electrostatic contact and hydrophobic insertion (Extended Data Fig. 7a–l). The Pα1, Pα3, and Pα5 helices are largely positively charged (blue), which would be interfacial to the negatively charged lipid headgroups of the bilayer (Extended Data Fig. 7b). The hydrophobic (gold), aromatic rich helices (Pα2 and Pα6) would then be stabilized by insertion into the lipid tails of the membrane (Extended Data Fig. 7h). Overall, the OPA1 paddle possesses more propensity for charged and hydrophobic membrane interactions that likely optimizes its IMM affinity (Extended Data Figs. 6d,h–j, 7).
The s-OPA1 dimer and tetramer interfaces also have large contributions from aligned electrostatic potential. The s-OPA1 dimer is striated in positive and negative charge and the alignment of interface-1 results in alternating charges throughout the helical bundle, electrostatically stitching together in-register interfaces while contributing to heterogeneity when they fall out-of-register (Extended Data Fig. 7c). This results in a large buried-surface area throughout the s-OPA1 dimer in the GDP-AlFx bound state (1330 Å2), which is considerably reduced in the apo state (1014 Å2) due to a looser interface-1 between stalk domains. This reduces in-register charge within the interface (Extended Data Fig. 7d) and results in approximately half the buried surface area (433 Å2 compared to 743 Å2) and a wider stalk dimer (48 Å) than the GDP-AlFx state (38 Å) (Extended Data Fig. 3a,d, Supplementary Table 1). There is very little change in buried surface area between the paddle and stalk (interface-2); but the interface between Pα5 helices (interface-3) is significantly smaller in the apo state (40 Å2 vs. 90 Å2), illustrating the tighter packing when nucleotide is bound (inter-rung GDP-AlFx interfaces bury 4278 Å2 vs. apo 1493 Å2) (Extended Data Fig. 3a,d, Supplementary Table 1). The inter-rung interfaces, in particular interface-7 between the paddles and interface-8 between the N-terminal domains, also appear to have electrostatic contributions which are in better register for the GDP-AlFx bound state (intra-rung interfaces bury GDP-AlFx:1085 Å2, apo:756 Å2) (Extended Data Fig. 7e,f). In contrast, hydrophobic burial does not appear to have as much impact on assembly (Extended Data Fig. 7i–l), with the exception of tetramer Interface-4 (Extended Data Fig. 7h).
DOA mutants in s-OPA1 assemblies
The novel interfaces and membrane binding surfaces identified within our s-OPA1 structures allow us to predict the molecular basis of how 86 mutants identified in DOA patients lead to disease (Extended Data Fig. 8, Supplementary Tables 1, 2). Of the 238 sites with point mutations (Fig. 1c) in OPA1, 37 have multiple substitutions, resulting in 284 mutants expected to disrupt OPA1 function1,18–20. As expected, many (121) are in the GTPase domain19, with the rest scattered throughout the structure. In the monomer, 84 mutations are within the hinge regions and may disturb protein folding, oligomerization, and the putative powerstroke. There are 101 DOA mutations that disrupt charged residues, 39 proline or glycine helix breakers, and 15 that introduce cysteines. For s-OPA1 GDP-AlFx, most sites (187, 87%) are surface exposed, with 86 within membrane binding sites or assembly interfaces identified in this paper. Of these, 65 are in the protein:protein interfaces involved in helical assembly, 17 are membrane facing and could disrupt lipid binding, and 21 are likely involved in GTP hydrolysis. Intriguingly, 24 more DOA mutations are just 1–2 amino acids away from our tightly defined interfaces. These observations illustrate the importance of membrane binding and helical assembly in OPA1 pathogenicity.
Assembly mutants fragment mitochondria
To determine the cellular impact of disrupting the s-OPA1 helical interfaces and membrane-binding regions, we transfected OPA1-GFP mutants into HeLa-M cells and characterized their mitochondrial morphology using a single cell-based assay (Fig. 4, Extended Data Figs. 9, 10). In total, we assayed 14 interfacial and membrane-binding mutants that span eight interfaces and the Pα2 (in the membrane-inserting loop) and Pα6 helices. Of these, 13 included known atrophy mutants (bolded in Extended Data Fig. 9). We also assayed four control mutations that lie outside the identified interfaces within the N-terminal, GTPase, and stalk domains. We hypothesized that the expression of even small amounts of GFP-tagged OPA1 mutants in wild-type cells would alter mitochondrial morphology by poisoning the function of endogenous OPA1. Observed expression levels were indeed low, with OPA1-GFP fluorescence appearing only 2–3-fold brighter than background after immunostaining with secondary antibody (Extended Data Fig. 10d–f). As expected, cells transfected with GFP-tagged versions of WT OPA1 and the four non-interfacial mutants exhibited primarily filamentous mitochondria (Fig. 4, Extended Data Figs. 9, 10 for examples of fragmented, intermediate, and filamentous mitochondria). By contrast, and consistent with our hypothesis, cells transfected with each OPA1 interface and membrane binding mutant exhibited fragmented mitochondria (Fig. 4, Extended Data Fig. 9b–o). Importantly, quantitation of OPA1-GFP expression in every cell scored for mitochondrial phenotype showed no significant variation in expression level between WT and mutant OPA1s, indicating that our results are not confounded by possible differences in expression level (Extended Data Fig. 10d–g).
Fig. 4: Examining the functional impact of OPA1 interface and membrane binding mutants.

(a-d) Images of HeLa-M cells transfected with WT or mutant OPA1-GFP. Left, mitochondria immunostained against Tom20. Middle, OPA1-GFP localization to the mitochondrial network. Right, colocalization of OPA1-GFP and mitochondria immunostained against Tom20. The scale bar measures 10 μm and 3 μm in the zoomed insets. A, WT Opa1-GFP display filamentous mitochondria. b-d, OPA1-GFP interface-1(b) mutant (E626A:T630A:K668A:E671A) (b), OPA1-GFP interface-7 mutant (K819A, N820A) (c), and the membrane-inserting loop, Pα2, OPA1-GFP mutant (W771A:K772A:K773A:R774A:W775A:L776A:Y777A:W778A:K779A:N780A: R781A) (d) all cause fragmentation of the mitochondrial network. E-g, Models of the OPA1 mutants transfected in (b-d) with s-OPA1 colored by domain (see Fig. 1), mutated residues labeled and colored as red sticks and other H-bonding residues in the interface shown as sticks colored by domain. Residues in red associated with DOA mutations are bolded. H, Table summarizing mitochondrial network fragmentation for each mutant. Mitochondrial networks were measured and categorized as filamentous (blue), intermediate (orange), or fragmented (gray) and plotted as a percentage of total cells. The number (N) of cells counted appear above each bar. The alanine mutations introduced into the OPA1-GFP sequence were: R627A:K663A:R683A (I1(a), Interface-1), E626A:T630A:K668A:E671A (I1(b), Interface-1), Q659A (I1(c), Interface-1), E679A (I1(d), Interface-1), H631A (I1(e), Interface-1), K614A:H615A:D835A (I2, Interface-2), F860A:Y861A:Y862A:Y863A:Q864A:R865A:H866A:F867A (I4(a)/Pα6, Interface-4 and Pα6 membrane binding), I735A (I4(b), Interface-4), E444A (I5, Interface-5), D716A (I6, Interface-6), K819A:N820A (I7, Interface-7), R235A (I8, Interface-8), E213A:Q217A:R557A:D565A (I9, Interface-9), W771A:K772A:K773A:R774A:W775A:L776A:Y777A:W778A:K779A:N780A: R781A (Pα2, Pα2 membrane binding), L243A (C1, non-interfacial control 1), L248A (C2, non-interfacial control 2), K369A (C3, non-interfacial control 3), T651A (C4, non-interfacial control 4). Detailed images and statistics for each interface mutant can be found in Extended Data Fig. 9 and 10. Experiments were repeated 3 times, each experiment was repeated independently with similar results.
The OPA1 mutants causing the most and the least fragmented mitochondria were the stalk:stalk dimer interface mutant (interface-1,I1e) and the interface-4 mutant (I4b), respectively. This latter result could be due to the apparent heterogeneity of interface-4. Strikingly, mutants in the novel s-OPA1 N-terminal interfaces (I8, I9) produced substantial fragmentation, implying that N-terminal contacts are essential for stabilizing a fusion-competent assembly. The presence of strongly fragmented mitochondria for all tested interfaces, pertinent to all stages of assembly from dimer to higher-order intra- and inter-rung interfaces, underlies the apparent significance of OPA1 helical assemblies in vivo. Regarding membrane binding, both the membrane-inserting loop (Pα2) and Pα6 mutants fragmented the mitochondrial network, highlighting OPA1:membrane interactions during fusion. Interestingly, one of the most fragmented phenotypes was seen for Pα2, possibly due to its direct interaction with cardiolipin. Furthermore, the presence of atrophy mutations within the identified s-OPA1 interfaces and membrane-binding regions supports the assertion that many atrophy mutations arise from disruption of OPA1 assemblies.
While the fragmentation phenotypes exhibited by cells expressing OPA1 with interfacial or membrane-binding mutations could be caused by defects in the assembly of OPA1 on membranes, they could also be caused by defects in OPA1 processing or mitochondrial cristae organization. Importantly, the ratio of long to short OPA1-GFP isoforms present in transfected cells (~0.78:1) were comparable to the ratio for endogenous OPA1 in the same samples (i.e. to the OPA1 present in both transfected and non-transfected cells; ~0.8:1), and to the ratio in the non-transfected control (~0.8:1) (Extended Data Fig. 10c). These results, together with the fact that the transfection efficiencies for all the mutants tested by Western blotting were very similar (Extended Data Fig. 10c, bottom), argue that the fragmentation phenotypes are not caused by alterations in OPA1 processing. Finally, we examined cristae morphology in control cells and cells co-transfected with mutant OPA1-GFP and mScarlet mitochondrial matrix marker by correlating light microcopy with both focused-ion-beam scanning electron microscopy (FIB-SEM) and transmission electron microscopy (TEM) (see Methods for details). Representative images reveal normal cristae morphology in all the mutants tested, arguing that mitochondrial fragmentation was not secondary to disrupted cristae architecture (Extended Data Fig. 10h–m)44,45. Taken together, our results show that mutating OPA1’s interfacial and membrane-binding regions results in fusion-deficient phenotypes, and they argue that these phenotypes arise from disruption of OPA1 assembly on membranes rather than from altered OPA1 processing or defective cristae morphology46.
Discussion
Our results support a model where IMM fusion is driven by fluid helical assemblies of OPA1 (Fig. 5)22,26,47. As shown previously, OPA1 interacts with the IMM through transmembrane tethering and its cardiolipin specific paddle domain5,25,48–50. The transmembrane domain of long-OPA1 may provide the initial localization of OPA1 to the fusion site and nucleate further s-OPA1 assembly3,15,25. Once at the membrane surface, formation of s-OPA1 helices would induce bilayer curvature37. At this stage, the loosely connected assemblies of varying diameters are stabilized by electrostatic contacts and shallow membrane insertion. During the GTP hydrolysis cycle, the GTPase domains dimerize, compacting the oligomer by tightening the stalk and paddle interfaces, increasing buried surface area, aligning interfacial charges, and forcing deeper insertion of the hydrophobic paddle helices into the bilayer49,51. This monotopic insertion of the paddle and concurrent recruitment of cardiolipin to Pα2 would drive mechanical destabilization and further curve the bilayer36,37,52–54. The helical assembly would also provide a pre-fusion scaffold for the membranes from each mitochondrion until they become close enough for fusion. The destabilized outer leaflets would then have a lower energy-barrier for lipid mixing, facilitating fusion, after which the negatively curved, fusion-pore/stalk would be stabilized by the previously recruited cardiolipin55–57. Additionally, insertion of the long-OPA1 transmembrane domain may lower the fusion energy barrier, amplifying the lipid remodeling caused by the s-OPA1 paddles48. Upon GTP hydrolysis, the protein falls off the membrane, although the structural mechanism that leads to disassembly remains elusive. As with other DSPs, it is possible OPA1 undergoes a powerstroke to aid disassembly of the organized helix and contribute energy toward fusion, but a similar s-OPA1 powerstroke has not yet been observed.
Fig. 5: A model of inner mitochondrial membrane fusion by s-OPA1.

Left, mitochondria in the early stages of fusion. OMM fusion joins the IMS of two mitochondria and brings their IMMs into proximity. a, A zoomed view of the IMS following OMM fusion. Initially, OPA1 proteins from the two mitochondria exist as dynamic oligomers within the merging IMS (dark blue) proximal to their respective IMMs (light blue, checked). The s-OPA1 oligomers (colored by domain, see Fig. 1) contact the IMMs through their paddle domains and interact with membrane-anchored, full-length OPA1. b, Upon the proper mitochondrial stimulus, apo OPA1 enters a primed state where it assembles into two flexible helices of varying diameter on the IMM bilayers, budding the membranes and bringing the two IMMs closer together. c, Nucleotide-binding orders and tightens the helical assemblies, bringing the IMMs close enough to promote fusion. During this stage, OPA1 scaffolds the positively curved membrane and the Pα2 paddle insertion deepens, which enhances curvature of the outer leaflet membrane. The inserted Pα2 helix also binds to and sequesters negative curvature inducing cardiolipin, destabilizing the bilayer. d, Fusion occurs and the IMM is merged producing a single mitochondrion. As the merged IMM collapses back toward the OMM, OPA1 helices disassemble and diffuse from the site of fusion (shown in zoomed and partial-zoomed view, right).
After fusion, the membrane surface would rapidly relax from its highly curved state as the fusion-pore collapses. Additionally, considering the GTPase dimer has only been observed in the presence of a transition-state mimic (PDBID:6JTG)29, it is likely to dissociate post-fusion. Together, the collapsing pore and GTP hydrolysis would induce conformational changes in OPA1 assembly, leading to rapid dissociation after the fusion event. Alternatively, the elastic nature of OPA1 and its propensity for forming helical structures of varied diameters and conformations, may temporarily accommodate a wider, loosely packed post-fusion assembly. This would result in a slower disruption of the OPA1 helix, or reflect alternative pathways along the mitochondrial fusion landscape, such as transient pore kiss-and-run or organelle-hitchhiking events46,58.
Compared to the previous helical structure by Zhang et al.22, our assemblies have narrower diameters. We propose that our structures represent a state just prior to membrane fusion, whereas the previous apo assembly of ΔN-OPA1 and tomogram of ΔN-OPA1 with GTPγS are an earlier state of OPA1 oligomerization on the membrane22. Consistent with this, the ΔN-OPA1 assembly was generated at a lower temperature and low salt, where two additional interfaces (back stalk-I1 and BSE:BSE), suggest a more electrostatically driven, looser OPA1 lattice22. Also, the ΔN-OPA1 assembly contained a higher percentage of negative-curvature inducing lipids (PE:CL, 22:25)43, which would stabilize a wider diameter lipid tube22. While the resolution is limited, fitting our s-OPA1 model into the prior apo densities highlights several similar interfaces, allowing us to render a morph towards our narrower diameter assembly, and revealing a potential pathway towards fusion (Supplementary Video 3). This morph highlights a decrease in assembly diameter, accompanied by a helical stretch, that would bring the pre-fusion membranes into closer apposition. One contention with this model is that the prior ΔN-OPA1 helix becomes wider upon GTPγS addition, possibly due to the back stalk-I1 and BSE:BSE interfaces that would need to break prior to GTPase dimer formation, which likely would be disfavored by the low temperature and ionic strength used in the previous study22.
Overall, the present s-OPA1 assemblies provide a window into the pre-fusion IMM intermediate. They reveal a novel GTPase dimer association, interface-5, consistent with other dynamin-family proteins, and establish a potential pathway between previous assemblies of OPA122, which may represent the early stages of assembly, to our pre-fusion state captured using GDP-AlFx. Several novel interfaces are present in our assemblies, both in comparison to prior work with ΔN-OPA1 and other DSPs. In addition to the novel GTPase dimer association (interface-5), the s-OPA1 assembly in the presence of GDP-AlFx displays a markedly different interface-1 orientation than s-MGM1. A further five interfaces (interface-1,−2,−3,−4,−7) were similar to the previous ΔN-OPA1 assembly but absent in other DSPs, with the remaining three (interface-6,−8,−9) novel to this work. Additionally, these assemblies reveal an unseen role for the N-terminus of s-OPA1 in stabilizing the helical assembly and highlight the plasticity of membrane interactions with the s-OPA1 paddle domain.
The relevance of these assemblies and membrane interactions was further supported by OPA1 mutagenesis in cells, where all tested interfaces resulted in significantly more fragmented mitochondrial networks than WT OPA1 or control mutants. Crucially, increased fragmentation was seen for transfection levels far below endogenous OPA1, without alteration of the ratio of s- and l-OPA1 or changes in cristae morphology44,45. This indicates that the interfacial mutants displayed dominant-negative phenotypes that did not arise from an altered equilibrium of OPA1 isoforms or from OPA1-GFP over-expression or variability46. Of note, the mutants within interface-1 and −4 also fall into similar apo dimer and tetramer interfaces within the previously published OPA1 assembly22, supporting the idea that these interfaces are common to OPA1 assemblies across diameters. Further, mutation of the membrane-inserting Pα6 and Pα2 paddle helices also fragmented mitochondrial networks. The Pα2 helix is unique to OPA1 and may serve to recruit cardiolipin. These results are not only the first high-resolution observation of the OPA1 paddle domain binding and inserting into membrane, but also the first direct observation of a paddle:cardiolpin contact. Finally, they also provide the first direct evidence that mutating the paddle domain disrupts IMM fusion.
Given the apparent relevance of these assembly interfaces and membrane binding regions to OPA1 function, we also examined their correspondence with known DOA mutants. We found that 86 previously identified DOA determinants were located within the membrane binding sites or assembly interfaces identified in this paper. The majority (65) were located within s-OPA1 helical interfaces, 17 potentially disrupt membrane contacts within the paddle, and 21 may disrupt GTPase-dimer formation and thus GTP hydrolysis. Given that our cellular data showed significant phenotypes for small disruptions of all tested interfaces and membrane binding helices in the paddle domain, we propose that these DOA determinants arise from impaired protein:protein or protein:membrane contacts that impair the ability of OPA1 to function as a higher order, helical assembly. A further 24 known DOA mutations are proximal to our interfaces, likely reflecting the conformational plasticity of OPA1 assemblies. Still, the interfacial and membrane contacts of s-OPA1 appear to be tightly tuned, as often a single mutation is sufficient to produce DOA. Overall, the OPA1 structures provide insight into the mechanism of mitochondrial IMM fusion and a foundation for the classification of pathogenic DOA mutations in the structural context of OPA1 and its higher-order assemblies.
Methods
Expression and purification of the s-OPA1 construct
The short OPA1, isoform 1 was expressed and purified with modifications from plasmid and protocols provided by Dr. David Chan (Caltech). s-OPA1 (residues 195–960) was expressed in BL21-DE3(RIL) cells using a pET28a vector with an N-terminal 6xHIS tag. Cells were grown in terrific broth (TB) media to an OD600 of 1.2–1.3. Cells were then cold shocked for 30 minutes at 4°C and induced with 0.5 mM IPTG. After an overnight incubation at 16°C with 300 rpm shaking, cells were harvested by centrifugation.
s-OPA1 was purified using TALON metal affinity resin (Takara Bio) and size exclusion chromatography (SEC). In brief, pelleted cells were resuspended in lysis buffer (20 mM Tris pH 8, 500 mM NaCl, 5 mM Imidazole) with the addition of 1 mg/mL of lysozyme, 0.01% DNAse, and a protease inhibitor tablet (EDTA free, Roche), incubated for 1 hour at 4°C, and lysed via probe sonication (1 minute process time, 1 second on, 5 seconds off at 90% amplitude). Cell debris was pelleted via ultracentrifugation at 230,000 xg for 1 hour at 4°C. Clarified lysate was transferred to TALON resin and treated with wash buffer (20 mM Tris pH 8, 500 mM NaCl, 20 mM imidazole) and elution buffer (20 mM Tris pH 8, 500 mM NaCl, 250 mM imidazole). Fractions containing s-OPA1 were pooled, concentrated, and washed into SEC buffer (20 mM Tris pH 8, 300 mM NaCl, 1 mM DTT) using a 30 kDa AmiconUltra concentrator. Protein precipitation was pelleted by centrifugation at 13,000 xg for 1 minute, and the sample was run over an S650 size exclusion column (BioRad). After examination by SDS-PAGE, fractions containing s-OPA1 were pooled, exchanged into HCB150 buffer (20 mM HEPES, pH 7.2, 150 mM KCl, 1 mM MgCl2, 2 mM EGTA, 1 mM DTT) and concentrated to ~2mg/mL. Protein was quantified by absorbance at 280 nm, flash frozen in liquid nitrogen, and stored at −80°C.
GTPase Assay
Basal GTP hydrolysis of s-OPA1 was measured using the colorimetric malachite-green assay described by Leonard et al59. Reactions were performed at 37°C using s-OPA1 at 2 μM in HCB150 buffer (20 mM HEPES, pH 7.2, 150 mM KCl, 1 mM MgCl2, 2 mM EGTA, 1 mM DTT) in the presence of GTP (Jena Biosciences). Data were fit to the equation, ν = (kcat [E0] [S])/(KM+[S]), where ν is the initial rate of GTP hydrolysis, E0 is the concentration of the s-OPA1 enzyme, S is the concentration of the GTP substrate, KM is the Michaelis constant, and kcat is the turnover number. Source data are available under the Extended Data Fig. 2a tab.
Liposome Preparation
Large unilamellar vesicles composed of 75% 1,2-dioleoyl-sn-glycero-3-phospho-L-serine (DOPS) and 25% 18:1 cardiolipin (CL)’(1’,3’-bis[1,2-dioleoyl-sn-glycero-3-phospho]-glycerol) were prepared via extrusion (Avanti Polar Lipids). Vesicles were prepared by solubilizing the lipid mixture in chloroform then drying with rotation in a warm water bath under argon. Mixtures were further dried under in a desiccator under vacuum overnight. Lipid film was then solubilized to 0.8 mg/mL in a warm water bath, with occasional vortexing, into HCB150 buffer (20 mM HEPES, pH 7.2, 150 mM KCl, 1 mM MgCl2, 2 mM EGTA, 1 mM DTT). 0.8 μm LUVs were then generated via extrusion using an extruder by Avanti polar lipid using a 0.8 μm pore size polycarbonate membrane (Avanti).
s-OPA1 Lipid Tubulation
s-OPA1 and a lipid mixture, diluted to 0.4 mg/mL of 75:25 DOPS:CL liposomes in HCB150 buffer (20 mM HEPES, pH 7.2, 150 mM KCl, 1 mM MgCl2, 2 mM EGTA, 0.1 mM DTT) containing 10 % ethylene glycol to a final concentration of a 1.4 mg/mL protein to 0.12 mg/mL ratio were combined, briefly vortexed, then immediately bath sonicated for 5 minutes. Post-sonication tubes were incubated between 25–60 minutes. For tubes in the presence of nucleotide, GDP-AlFx was then added to a final concentration of 1 mM and allowed to incubate for another 10 minutes. A GDP-AlFx stock was generated by combining GDP, AlCl3, and NaF to final concentrations of 10 mM, 60 mM, and 300 mM, prepared within the 10 minutes preceding addition to s-OPA1:lipid tubes.
Negative Stain
s-OPA1:lipid mixtures were loaded onto carbon-coated, 15 second glow discharged, nickel formvar (FCF400 Ni-NA) grids and incubated for 1 minute, followed by staining with 1% uranyl acetate. Grids were visualized on a FEI Technai 12, as part of the NIDDK core facility.
Plunge Freezing
3 μL of s-OPA1:lipid tubes were aliquoted onto carbon coated, 90 second glow discharged, C-flat gold grids (CF-1.2/1.3–4Au50), incubated for 30 seconds, blotted with filter paper for 3 seconds (4°C with 95% humidity) and then plunged into liquid ethane using a Leica EM Grid Plunger (Leica Microsystems). Vitrified grids were stored in liquid nitrogen before examination using cryo-electron microscopy (cryoEM).
CryoEM
Samples were screened a TF20 microscope (FEI) at 200 kV at a 29,000x magnification, with a nominal defocus range of 1.5 to 3.0 μm using a K2 summit camera (Gatan) in counting mode. High-resolution images of OPA1 lipid tubes in the presence of GDP-AlFx were recorded on a Titan Krios G3 microscope (Thermo-Fisher) operating at 300 kV on a Gatan K3 camera. 6,319 images were collected at a magnification of 105,000x with calibrated pixel size of 0.415 Å, nominal defocus range of 0.3 to 2.4 μm, 24 frames, and 60 e-/Å2 electron exposure per movie. Images of OPA1 lipid tubes in the apo state were recorded on a Glacios cryo-TEM microscope (Thermo-Fisher) operating at 200 kV on a Gatan K3 camera. 2,830 images were collected at a magnification of 36,000x calibrated pixel size 0.58 Å, nominal defocus range 0.6 to 2.4 μm, 22 frames, and 24.86 e-/Å2 electron exposure per movie. All data was collected using Serial EM.
Preliminary CryoEM Processing and determination of helical parameters in RELION 3.1, FIJI, and HELIXPLORER
Preliminary micrographs from the FEI TF20 of s-OPA1:lipid tubes with GDP-AlFx were motion corrected and dose-weighted with MotionCor2 in RELION 3.160,61. CTF estimation was determined in RELION 3.1 using Ctffind462. Particle selection was performed manually in RELION 3.160,63. Extracted particles were used to generate initial 2D reference classes for real space analysis of helical parameters. Motion corrected particles generated in RELION 3.1 were also used to generate stacks of averaged power spectrum for Fourier Bessel analysis in FIJI v2.9.064,65. Suspected helical parameters were then input into HELIXPLORER (Esterozi, L, French National Centre for Scientific Research, Paris) in order to determine a range of potential solutions64.
CryoEM Processing in cryoSPARC 3.2.0 and cryoDRGN
Final images of s-OPA1:lipid tubes in the GDP-AlFx or apo state were processed using cryoSPARC v3.2.0 and v3.3.0–3.3.230 66. Images were gain corrected, motion-corrected, binned, and dose-weighted using Patch Motion Correction in cryoSPARC30 66. CTF estimation was determined using Path CTF estimation in cryoSPARC30 66. Particle selection was performed by generating a template, by manually selecting a subset of desired s-OPA1 tubes, 2D classifying, then template tracing and extracting particles with a 1.2018 Å/pixel size and a 500-pixel box size, for the GDP-AlFx bound dataset, and a 1.2518 Å/pixel size and a 480-pixel box size for the apo dataset. Selected particles were then examined and filtered according to a 6 Å CTF resolution using the curate exposures job. Particles were then pruned using 1 round of 2D classification. Initial tube alignment was performed using the ab initio reconstruction job and helical maps were generated using the helical refinement (Beta) pipeline. Suspected helical symmetry, determined above, was cross-examined using the symmetry search tool in cryoSPARC66. Due to heterogeneity in tube diameter for apo OPA1 images, multiple rounds of iterative 2D classification, selection, and helical refinement were performed to produce the final helical map. After generating an initial helical map with a z-clipped region of 0.518, a local refinement was performed to focus in on a 30% z-clipped region to better compare to maps generated in RELION 3.160,63,67. Local Refinements on s-OPA1 and the outer leaflet of the bilayer were performed using the Local Refine (Beta) pipeline in cryoSPARC using masks generated in Chimera30 66. Masks resulting from MolMaps were the product of iterative s-OPA1 model building or hand-built lipid monolayers. Local resolution maps were also generated in cryoSPARC30 66.
To sort heterogeneity of the apo sample, a subset of particles were selected from outputs in cryoDRGN v0.3.431, which were re-imported and refined using cryoSPARC’s helical and local refine Beta pipelines30,66. Maps generated in cryoSPARC were post-processed using deepEMhancer in order to sharpen protein densities and also sharpened in cryoSPARC as a cross-comparison for model building68. DeepEMhancer was not used for ligand densities. Neither deepEMhancer nor cryoSPARC sharpening were applied to the lipid monolayer local refinements.
Diameter Measurements
The diameter distribution of s-OPA1 tubes in apo and GDP-AlFx bound state was determined using 2D classifications in cryoSPARC. Particles were divided into ~500 2D classes per state. The tube diameter of each class was measured using Fiji. The resulting stacked bar chart was created using Plotly. Source data are available under the ED Fig. 2b(left-nuc) and Fig. 2b(left-apo) tabs.
Supernatant/Pellet Assay
s-OPA1 lipid tubes, generated as described above, were incubated for 30 minutes with and without GTP. Samples were centrifuged at 100,000 × g for 15 min at 4 °C in a Beckman TLA 100 rotor. The resultant supernatant and pellet fractions were then analyzed by SDS-polyacrylamide gel electrophoresis, stained with Coomassie Brilliant Blue, and quantitated by using FIJI. Source data are available under the Fig. 2b(right) tab. Raw images for Extended Data Figure 2b are available in Supplementary Fig. 1.
Model Building and Refinement
Initial fitting of s-OPA1-MGD (GTPase dimer reference) into cryoEM helical maps was done manually in UCSF Chimera69 with the PDB ID:6JTG29. To perform local refinements in cryoSPARC, initial models were then extended from the s-OPA1-MGD, de novo, using COOT 0.970. The initial model was iteratively refined in COOT as the map resolution improved and features became more apparent70. Upon the release of the AlphaFold database, the initial model was hybridized with the AlphaFold OPA1 structure, AF-O60313-F1, in COOT v0.9.0 and v0.9.2 to produce a model for refinement70,71. Model refinement was performed using Rosetta r280, COOT v0.9.0 and v0.9.2, and Phenix v1.19.2–4158 then assessed using MolProbity and Phenix70,72–75. The cryoEM data collection, final refinement, and validation statistics for the model are presented in Supplementary Table 2. Structural analysis, measurements and figures were prepared in Chimera 1.15 and ChimeraX 1.2.569. Interfacial areas were calculated using the PDBePISA server33.
Summary of Helical Assemblies
Visually, the biological twist and rise of the densely packed rungs of both s-OPA1 assemblies are left-handed (Supplementary Fig. 3h,p). However, we chose to define the helical parameters along the opposing lattice in right-handed coordinates which allowed us to minimize the rise and pitch of a full turn. This maximized the number of units for a given box size, which had computationally limited our attempts at left-handed solutions66,67.
In the right-handed solution space, both assemblies are 1-start, with a pitch of 12.59 nm (Supplementary Fig. 3a–d) in the GDP-AlFx bound map and 13.60 nm in the apo map (Supplementary Fig. 3i–l). The GDP-AlFx bound assembly had a twist of 37.439° and rise of 12.933 Å (Supplementary Fig. 3e) while the apo assembly instead had a twist of 37.25° and rise of 14.07 Å (Supplementary Fig. 3m). The helical maps were z-clipped in cryoSPARC to 50% of the full map (Extended Data Fig. 1c–d)30,66. The flexibility and continuous heterogeneity were examined and minimized for the apo assembly using cryoDRGN (Supplementary Fig. 3q–t and Supplementary Video 2)31.
An alternative minimal left-handed lattice of the GDP-AlFx bound would be a 4-start helix with a pitch of 33.29 nm (Supplementary Fig. 3f), compared to an 8-start helix with a pitch of 64.45 nm for the apo assembly (Supplementary Fig. 3n). The left-handed GDP-AlFx bound assembly has a twist of −49.0° and rise of 45.33 Å (Supplementary Fig. 3g) compared to a twist of 62.3° and rise of 111.6 Å for the apo assembly (Supplementary Fig. 3o).
The apparent biological rung of the helical assembly is based on visual packing. The biological assemblies form left-handed, 9-start helical lattices of ~16 tetrameric dimers-of-dimers. A full turn for the GDP-AlFx bound map has a pitch of 182.3 nm (Supplementary Fig. 3h) and the apo case has a pitch of 179.5 nm (Supplementary Fig. 3p). The GDP-AlFx bound helix has a twist of −22.93° and rise of 116.1 Å (Supplementary Fig. 3h) while the apo helix has a twist of −25.16° and rise of 125.5 Å (Supplementary Fig. 3p).
Mutations of full length OPA1 for imaging
Full length human OPA1, isoform 1 cDNA was obtained, courtesy of Dr. David Chan (Caltech), through Addgene (#70173). The OPA1 cDNA sequence was then ligated into a pEGFP-N1 vector (Clonetech), attached through an 8 amino acid linker, GLALPVAT, to an adjoining GFP fluorescent protein tag using the In-Fusion HD Cloning kit (Clonetech, 638911) following manufacturer’s instructions. Alanine mutations were introduced into the FL OPA1-GFP sequence as single mutations by site-directed mutagenesis using the Quikchange II XL Site-Directed Mutagenesis Kit following manufacturer’s instructions for the following mutants: E444A (Interface-5), Q659A (Interface-1(c)), E679A (Interface-1(d)), H631A (Interface-1(e)), I735A (Interface-4(b)), D716A (Interface-6), R235A (Interface-8), L243A (C1, non-interfacial control 1), L248A (C2, non-interfacial control 2), K369A (C3, non-interfacial control 3), T651A (C4, non-interfacial control 4). Multiple alanine mutations were introduced into the FL OPA1-GFP sequence using the QuikChange Lightning Multi Site-Directed Mutagenesis Kit (Agilent Technologies) following manufacturer’s instructions for the following mutants: R627A:K663A:R683A (Interface-1(a)), E626A:T630A:K668A:E671A (Interface-1(b)), K819A:N820A (Interface-7), and K614A:H615A:D835A (Interface-2), E213A:Q217A:R557A:D565A (Interface-9). Sequential alanine mutations were introduced into the FL OPA1-GFP sequence as nucleotide substitutions using the Q5® Site-Directed Mutagenesis Kit (New England Biolabs), for mutants: W771A:K772A:K773A:R774A:W775A:L776A:Y777A:W778A:K779A:N780A:R781A (the membrane-inserting loop, Pα2) and F860A:Y861A:Y862A:Y863A:Q864A:R865A:H866A:F867A (Pα6 and Interface-4(a)). Primers were synthesized by Eurofins. Plasmid concentration and purity was checked using a NanoDrop (Thermo Scientific). The coding sequences were verified by Sanger sequencing (Psomagen) and the integrity of the full-length plasmids were further verified by nanopore sequencing (Plasmidsaurus). Primers can be found in Supplementary Table 3.
Evaluation of OPA1 expression levels and mitochondrial network morphologies
HeLa-M cells were cultured in DMEM (Gibco Life Technologies) supplemented with 10% heat-inactivated FBS (Gibco by Life Technologies) and 1% Antibiotic-Antimycotic solution (Gibco Life Technologies), and were maintained at 37°C in a humidified, 5% CO2 incubator. Cells were plated in glass-bottom, 4- or 8-well chamber slides (Cellvis, C4–1.5H-N) that had been coated with Fibronectin (10 ng/ml; Gibco Life Technologies, 33016015), and were transfected with GFP-tagged WT and mutant OPA1 constructs using Lipofectamine-3000 according to the manufacturer’s instructions (Invitrogen Thermo Fisher Scientific, L3000–001). After 24 to 28 hours, cells were fixed with 4% paraformaldehyde, 0.25% glutaraldehyde in 0.1 M sucrose, and 0.1 M cacodylate (pH 7.0) for 15 minutes at 37°C. The samples were then permeabilized for 10 minutes using 0.1% Triton-X100, and blocked with 5% bovine serum albumin in PBS (Thermo Fisher, WL335677) for 1 hour. To enhance the GFP signal present in transfected cells, and to visualize mitochondria morphology, fixed samples were stained with a 1:200 dilution of rabbit anti-GFP (Rockland, 600–401-215) and a 1:200 dilution of mouse anti-TOM20 (F-10) (Santa Cruz., sc-17764) for 1 hour at room temperature. After washing three times with 5% BSA in PBS, the cells were stained with a 1:500 dilution of both Alexa-488 anti-rabbit secondary antibody (Invitrogen, A11034) and Alexa-594 anti-mouse secondary antibody (Invitrogen, A32742) for 1 hour at room temperature, and then washed with PBS. All images were captured using a Zeiss LSM 780 confocal microscope equipped with a 60X 1.40 NA oil objective. A zoom setting of 1 was used to give 8–15 cells in each field of view (~135 μm2). For each field of view, a Z-stack spanning the full thickness of the cells was taken in 0.6 μm intervals. Maximum projections of the Z-stacks were then used to quantitate OPA1 expression and to score mitochondrial morphology as described next. Regarding quantitating the expression of WT and mutant OPA1 constructs, the transfected cells within each field of view were first outlined based on their footprints. The total fluorescence in the 488 channel was then determined for each cell by summing the fluorescent intensities in each plane of the Z-stack using FIJI. Cells that showed a 488 signal that was above the background exhibited by non-transfected cells in the same field of view, and that showed colocalization between the anti-GFP signal and the TOM20 signal, were then scored for mitochondrial length. Representative examples of each category (fragmented, intermediate, or filamentous mitochondria) are shown in Extended Data Fig. 10a,b. The data in Extended Data Fig. 10d–g are representative of at least three independent experiments. The fold increases in anti-GFP fluorescence over background for each category of mitochondrial morphology obtained were compared using the Student’s t-test (two-tailed) (Extended Data Fig. 10g). HeLa-M cells (a gift from A. Peden University of Sheffield) were early passaged stocks, which tested mycoplasma-free. Source data for Extended Data Fig. 10d are available under the ED Fig. 10d tab, Source data for Extended Data Fig. 10e are available under the ED Fig. 10e tab, Source data for Extended Data Fig. 10f are available under the ED Fig. 10f tab. Raw images for Extended Data Fig. 10c are available in Supplementary Fig. 1.
Western blotting
Cells were harvested 2 days after transfection, pelleted, and resuspended in 1X PBS. Whole cell lysates were prepared by adding an equal volume of 2X sample buffer (10% SDS, 5% 2-mercaptoethanol, 15% sucrose, 1 mM EDTA, 0.004% bromophenol blue, 0.15 M Tris-HCl, pH 6.8), followed by boiling for 10 min. The samples were then passed through 1 mL TB syringe with BD Precision Glide 25-gauge needle to shear the genomic DNA, loaded on Novex WedgeWell 4–12% or 6% Tris-Glycine gels (ThermoFisher Scientific, XP04210BOX or XP00060BOX), and transferred onto nitrocellulose membranes (Bio-Rad, 162–0251) using a semi-dry transfer system (Bio-Rad, TRANS-BLOT SD Semi-Dry Transfer Cell). The transfer buffer was composed of 48 mM Tris, 39 mM glycine, 1.3 mM SDS, 20% methanol (pH 9.2). The membranes were blocked in TBST (Tris Buffered Saline (pH 7.4), 0.02% Tween 20), supplemented with 5% powdered milk for 2 hours, and incubated overnight at 4°C with the following primary antibodies: anti-GFP (1:1,000 dilution, rabbit polyclonal, Rockland #600–401-215), anti-OPA1 (1:1,000 dilution, mouse monoclonal, BD Biosciences, #612606), anti-beta-actin (1:10,000 dilution, mouse monoclonal, Abcam, #ab6276). The membranes were then washed with TBST for 1hour, incubated in horseradish peroxidase-conjugated secondary antibodies (Peroxidase conjugated AffiniPure Goat Anti-Rabbit IgG (H+L), #111–035-003 or Peroxidase AffiniPure Goat Anti-Mouse IgG (H+L), #115–035-003) at RT for 2 hours, and washed with TBST for 1 hour. Proteins were detected using the SuperSignal West Pico Plus Chemiluminescent Substrate (ThermoFisher Scientific, 34577) and quantitated using an Amersham Imager 600 (GE Healthcare Life Sciences). The transfection efficiencies for the cells harvested for Western blotting were determined by fixing and staining parallel samples with anti-GFP. Raw images for Western blots are available in Supplementary Fig. 1.
FIB-SEM and TEM, examining mitochondrial cristae morphology
HeLa-M cells were cultured as stated above, with the modification that cells were plated on 35 mm dishes with a gridded coverslip bottom (MatTek, P35G-1.5–14-C-GRD). The cells were co-transfected with GFP-tagged WT- and mutant-OPA1 constructs together with mScarlet-tagged Mito Matrix construct using the same transfection method as above. After 24 hours transfection, live cells were imaged using the Zeiss LSM 880 microscope equipped with a 40X 1.40 NA oil objective and an environmental chamber to maintain the cells at 37C and 5% CO2. To localize transfected cells on the grid, a 5×5 tile scan was performed to cover a 1 mm2 area using both DIC and fluorescence channels. FIB-SEM and TEM were performed on mutant OPA1-expressing cells possessing mitochondria that were both red and fragmented.
After light microscopy imaging, cells were fixed with a mixture of 2.5% glutaraldehyde and 1% paraformaldehyde in 0.1 M sodium cacodylate buffer at 4°C overnight. The next morning, the cells were washed with 0.1 M sodium cacodylate buffer 5 times 3 minutes each. Cells were then incubated in 2% osmium tetroxide in 1.5% potassium ferricyanide made in 0.1 M sodium cacodylate buffer for 1 hour on ice and then rinsed with water 5 times 3 minutes each. All subsequent water washes mentioned here consist of 5 washes for 3 minutes each. The cells were then incubated in 1% thiocarbohydrazide in water for 20 minutes at room temperature followed by water washes. This was followed by an incubation in 2% osmium tetroxide in water for 30 minutes on ice and subsequent water washes at room temperature. Cells were then incubated in 1% uranyl acetate in water overnight at 4°C. The following day, cells were washed in water and then placed in a solution of 0.066% lead aspartate for 30 minutes at 60°C. After water washes, cells were dehydrated with a series of graded ethanol in water incubations consisting of 30%, 50%, 70%, 90%, and 3 100% ethanol for 5 minutes each. This was followed by infiltration with Epon resin (Embed 812, Electron Microscopy Sciences) using increasing concentrations of resin dissolved in ethanol over the course of 16 hours. The cells were then embedded in a thin layer of fresh Epon resin and cured in a 60°C oven for two days.
After embedment, the glass coverslip at the bottom of the dish was dissolved in hydrofluoric acid (Sigma Aldrich). This left the resin with the alphanumeric grid exposed on the surface of the block and visible with a dissecting microscope. The region at the center of the 35 mm dish containing the grid and cells was separated from the remaining plastic dish using a thin saw. This was mounted on an SEM stub with the grid facing up and then coated with a 20 nm layer of gold using a sputter coater (Electron Microscopy Sciences). Focused ion beam scanning electron microscopy (FIB-SEM) imaging was done using a Crossbeam 540 (Zeiss). Since the alphanumeric grid was visible under the SEM beam, the cells of interest for FIB-SEM imaging were easily identified based on the coordinates seen in the light microscopy images. FIB-SEM images were acquired at 3 nm and 6 nm in XY and a slice thickness of 6 nm. The SEM beam was set to 1.5 kV and 1.2 nA and the FIB was set to 30 kV. Images were acquired with the back-scatter detector with a grid voltage set to 500 V. After the volume acquisition, the contrast of the images was inverted and the stack was registered using the Atlas 5 (Zeiss) registration module.
For TEM, cells prepared as above. Transfected cells were relocated on a large resin surface based on the grid imprint and coarsely trimmed with a jeweler’s saw. Coarsely trimmed blocks were attached to a prepared Epon block using cyanoacrylate glue and finely trimmed close to the cell of interest using a Diatome trimtool (Electron Microscopy Sciences, Hatfield, PA). Ultrathin sections (65 nm) were cut from the block surface using a Leica EM UC7 ultramicrotome and digital micrographs were acquired on JOEL JEM 1200 EXII TEM operating at 80Kv and equipped with AMT XR-60 digital camera.
Extended Data
Extended Data Fig. 1: Helical Assemblies of s-OPA1 coating cardiolipin containing membranes with and without GDP-AlFx.

a, Left, top view of s-OPA1 with GDP-AlFx bound, with 38.2 nm outer diameter and a 9.4 nm inner lumen diameter of the membrane. Center, side view of the helical map with 10 modeled tetramers which define a single helical turn are colored by domain (see Fig. 1). Right, a central slice of the helix is shown in comparison to a 2D classification generated in RELION (right-corner). A radial profile plot is shown above the sliced helix. b, Left, top view of apo s-OPA1, with 40.5 nm outer diameter and a 9.5 nm inner lumen diameter of the membrane. Center, side view of the helical map with 10 tetramers which define a single turn are colored as in (a). Right, a central slice of the helix is shown in comparison to a corresponding apo 2D classification generated in RELION (right-corner). A radial profile plot is shown above the sliced helix. c, A Z-clipped refinement focusing on the central ~30% of the GDP-AlFx bound helix is colored by domain, shown as a top view (left), side view (center), and centrally sliced (right) with a single s-OPA1 dimer highlighted in darker hues. d, Domains of s-OPA1, moving from the outer diameter of the GDP-AlFx helix toward the membrane bilayer. Left, GTPase domains and BSE regions colored green and pink, respectively. Center, stalks shown in blue. Right, paddles colored orange. e, and f, same as (c) and (d) for the apo helix. g, s-OPA1 GDP-AlFx map with density colored by domain as in (a) and refined in cryoSPARC without dynamic masking. Insets highlight the N-term colored gray.
Extended Data Fig. 2: Workflow for determining s-OPA1 helical assembly and corresponding local refinements using cryoSPARC.

a, Sample preparation workflow for s-OPA1 purification, GTPase activity assay, and tube formation. Images for the GDP-AlFx and apo states were collected on a Titan Krios and Glacios, respectively. GTPase activity data are presented as mean values +/− SD of n=3 independent experiments. b, Left, s-OPA1 tube diameters for both the apo (orange) and GDP-AlFx (blue) states. Asterisks mark diameters used for cryoEM image processing. Right, Sup/Pellet assay showing GTP-mediated protein disassembly from membrane. SDS-PAGE gel (top) of Sup/Pellet assay with protein alone (*), and s-OPA1 tubes before (Apo) and after GTP addition (GTP). Bar-graph (bottom) of Sup/Pellet assay with supernatant (blue) and pellet (orange) for the same conditions (data are presented as mean values +/− SD of n=3 independent experiments). c, Outline of data processing. Each dataset followed a standard workflow including patch motion correction and patch CTF correction. Segments of tubes were then manually selected, 2D classified to generate templates to trace the particles, extracted and curated to a 6 Å CTF cutoff. Particles were 2D classified and particles of similar identity and diameter were selected and aligned through ab initio modeling. The selected ab initio models were then refined with non-uniform helical refinement. For GDP-AlFx tubes, helical symmetry was determined using a combination of Fourier and real space analysis employing HELIXPLORER and RELION61–63. For Apo tubes, symmetry parameters were determined in cryoSPARC. Each set of parameters was examined with the cryoSPARC helical search tool28,64. To assess the interfaces of each OPA1 in the assembly, local refinements were performed by first symmetry expanding the particles in the helical refinements. Areas of interest were masked in chimera. Masks were then expanded and padded within cryoSPARC for particle subtraction, followed by non-uniform local refinements. The resulting maps were used to build the model of s-OPA1, which was generated using COOT, Rosetta, and Phenix65–67.
Extended Data Fig. 3: A closer examination of the stalk and paddle interfaces within the s-OPA1 dimer.

a, A side view of a GDP-AlFx s-OPA1 dimer fit into a locally refined map. Monomers colored as by domain (see Fig. 1). Chain A is colored a dark hue and chain B a light hue. The interlocked stalk interface-1 is shown above and paddle:paddle interface-3, where the paddle is rotated 180° showing the membrane-facing region, is displayed below. Insets: Interface-4 between the paddle-hinges and interface-7 between the inter-rung paddles are highlighted. b, Top view of isolated interfaces for the s-OPA1 stalk and paddle regions. The full dimeric interface between the stalks and paddles is shown fit into the locally refined density (center) and colored as in (a). Interface-2 between the stalk of an s-OPA1 monomer and the paddle of the second monomer is shown for the A- to B-chain (top) and the B- to A-chain (bottom). c, A representative fit of each domain of the s-OPA1 model into the map density. d,e, same as in (a,b) for the apo dimer.
Extended Data Fig. 4: The interfaces involved in s-OPA1 GDP-AlFx helical assembly.

a, Left, the s-OPA1 dimer with its three interfaces labeled. Monomers colored as by domain (see Fig. 1). Chain A is colored a dark hue and chain B a light hue. Top and side views of the helical map with a single dimer highlighted shown in top corners of dimer. Right, zoom views of each isolated interface with buried residues shown as sticks. b-g, s-OPA1 interfaces involved in higher order assembly. In each case, colors are as in (a). Chains of each s-OPA1 dimer not involved in the interface are grayed. Top corners, s-OPA1 in the context of the full helical map. Insets show residues buried in each interface as sticks. b, Two dimers of s-OPA1 assemble into a tetramer through interface-4. c, In the presence of GDP-AlFx, GTPase domains dimerize between dimer-1 A-chain and dimer-2 B-chain and form interface-5. d, In the presence of GDP-AlFx, interface-6 forms by a GTPase domain:stalk interaction between dimers A-chains (left) B-chains (right). e, Between rungs, interface-7 involves paddles of dimer-1 A-chain and dimer-2 B-chains. f, Another inter-rung interface, interface-8, appears between two N-terminal coiled-coils (purple) of dimer-1 A-chain and dimer-2 B-chain. g, Interface-9 is an N-terminal:BSE dimer interface between dimers A-chains (left) B-chains (right). Interfaces were determined using PDBePISA33.
Extended Data Fig. 5: Comparison between s-OPA1 and Dynamin stalk domain and GTPase dimer.

a, s-OPA1 stalk (blue) is kinked 30° relative to dynamin-1 stalk (PDBID:6DLV, white). b, GTPase dimer (green) highlighted in helical map. Inset, GTPase domain dimer (interface-5) with monomers colored as by domain (see Fig. 1). Chain A is colored a dark hue and chain B a light hue. The crystal dimer (PDBID:6JTG, white) is aligned to our model. c, Our s-OPA1 model versus the 6JTG dimer, colored as in A from the top (left) and two side views (center, right) to highlight differences in dimer conformation. The BSE domains of both chains swing to accommodate the angular difference of hinge-1 connecting the stalks, resulting in the A- and B-chains fitting with slight asymmetry compared to the crystal structure. Interface-5 is labeled and circled. d, Our s-OPA1 model versus the dynamin-1 (PDBID:3ZYC) dimer with GMPPCP bound, colored as in (a) from the top (left) and two side views (center, right) to highlight differences in dimer conformation. The orientational difference at hinge-2 in the BSE domains is expected from the powerstroke model for DSPs.
Extended Data Fig. 6: Human s-OPA1 compared to s-MGM126 and enhanced s-OPA1 membrane binding.

a, A sequence comparison between s-OPA1 and s-MGM1 (gray). s-OPA1 is colored as by domain (see Fig. 1). b, An overlay of s-OPA1 with s-MGM1 (gray) (PDBID:6QL4) highlighting similar domains. s-OPA1 domains are colored according to (a). Unique regions in s-MGM1 and s-OPA1 are highlighted: kinked-stalks, paddle domains, and the stalk-paddle hinge disulfide-bond. Inset shows a 180° rotation of the zoomed paddle-tip highlighting differences in secondary structure and domain angle. Top left, s-OPA1monomer highlighted in helical map. Helices are labeled as in Supplementary Fig. 2. c, A 90° rotation of s-OPA1 and s-MGM1(gray), with an s-OPA1 monomer colored in helical map, top left. The membrane is drawn in gray highlighting increased s-OPA1 membrane-insertion, the membrane-inserting loop (Pα2) and Pα6 and closer OPA1 paddle-tip membrane association (inset). d, A table comparing structural features and sequences between OPA1 and MGM1. Positively charged residues are blue and aromatics are orange. e, Locally refined map of the bilayer outer-leaflet with proposed cardiolipin density proximal to the Pα2 helix. s-OPA1 paddles are colored as in (a), cardiolipin is colored magenta, unidentified lipids are white. To orient, a cylinder representing the membrane with a box representing the refined region appear, top left. f, A view of the map, rotated 180° from (e). g, Three views of cardiolipin modeled into the map. h, s-OPA1 paddle with a possible cardiolipin orientation shown (sticks and surface views). Membrane-inserting, positively charged (blue) and aromatic (white) residues appear (sticks). A representative cylinder with the boxed region (top left). i, A 90° rotation of (h). j, A zoomed view of the s-OPA1 and two cardiolipin models (dark and light magenta) highlighting potential residues (sticks) involved in the Pα2:CL interaction and the cardiolipin headgroup swing (curved arrow).
Extended Data Fig. 7: Examining the electrostatic and hydrophobic distribution of the GDP-AlFx bound s-OPA1 helical assembly.

The apo state is indicated by dashed boxes. a, A top view of the s-OPA1 GDP-AlFx helical assembly colored by Coulombic electrostatic potential: positive, blue; negative, red; neutral, white. A dashed black line marking the membrane interface. The flexible helices, Pα2 and Pα6, in the paddle-tip and -hinge line the membrane interface with positive-charge, but become neutral near where they insert into the lipid tails. b, A clipped view of the helical assembly (top) and a single s-OPA1 dimer colored by electrostatic potential as in (a) (inset), focusing on the paddles on the membrane to highlight the positive-charge distribution on the bilayer interface. Pink and blue boxes highlight the helices in the paddle which insert into the membrane, the membrane-inserting loop (Pα2) and Pα6. The Blue boxed region (bottom) shows Pα6 in the context of interface-4. c, A s-OPA1 GDP-AlFx dimer colored by electrostatic potential oriented as in (a) in the side view of the helical assembly. Charge striation is particularly apparent along the dimer within the interlocked stalk interface-1 and at the site of N-terminal coiled-coil interface-8. Zoomed, the striated stalk:stalk interface-1 is highlighted, charges are labeled in green. d, The striated s-OPA1 apo stalk:stalk interface-1 is shown with charges (green) slightly out of register. e, A zoomed view of the electrostatic potential for the N-terminal interface-8. f, The inter-rung interface-7 colored by electrostatic potential, highlighting charge dependence. g-l, Same as in (a-f) for calculated lipophilicity: hydrophilic, teal; hydrophobic, gold; neutral, white. Hydrophobic regions (gold) within the paddle domain are membrane inserted (h). Coulombic electrostatic potential and molecular lipophilicity were determined using ChimeraX69.
Fig. 8: Potential residues involved in s-OPA1 helical interfaces, highlighting the Atrophy mutants located within each interface.

a, s-OPA1GDP-AlFx with all interfacial residues of the helical assembly shown as sticks. The monomer is colored by domain: N-term, light gray; GTPase domain, light green; BSE, light pink; hinge-1, light gray; stalks, light blue; paddles, light orange. All atrophy mutants are colored in red. b, Atrophy mutants located within the buried interfaces. The model is colored as in (a) and sticks are shown for interfacial residues with atrophy mutants highlighted in red. Chain A is colored a dark hue and chain B a light hue. c-h, s-OPA1 interfaces with sticks shown for the buried residues and atrophy mutants colored in red33. c, s-OPA1 dimer interface between the stalks and paddles (interfaces 1–3). d, Interface-5 between GTPase domains. e, Interface-4 between the paddle-hinges. f, The GTPase domain:stalk interface-6 for the A-chains (left) and B-chains (right). g, Interface-7 between inter-rung paddles. h, Interface-8 involving the N-terminal coiled-coil, colored purple. i, Interface-9, N-term to BSE interface for B- (left) and A-chains (right) (colored as in (h)). In all cases buried interfacial residues were determined using PDBePISA33.
Extended Data Fig. 9: Cell images examining the functional impact of all OPA1 interface and membrane binding mutants.

a-s, Left, mitochondria immunostained against Tom20. Middle, OPA1-GFP localization to the mitochondria. Right, colocalization of OPA1-GFP and mitochondria immunostained against Tom20. Zoomed views of the residues in each set of mutations are shown to the left of the corresponding cell images. Monomers colored as by domain (see Fig. 1). The N-terminal domain is colored purple. Chain A is colored a dark hue and chain B a light hue. H-bonding residues are shown in sticks. Residues mutated in the interface are colored red and labeled. Residues in red associated with DOA mutations are bolded. a, WT OPA1-GFP b, OPA1-GFP Interface-1(a) mutations (R627A:K663A:R683A) c, OPA1-GFP Interface-1(b) mutations (E626A, T630A, K668A, E671A) d, OPA1-GFP Interface-1(c) mutation (Q659A) e, OPA1-GFP Interface-1(d) mutation (E679A) f, OPA1-GFP Interface-1(e) mutation (H631A) g, OPA1-GFP Interface-2 mutations (K614A:H615A:D835A) h, OPA1-GFP Interface-4(a) and membrane binding Pα6 mutations (F860A:Y861A:Y862A:Y863A:Q864A:R865A:H866A: F867A) i, OPA1-GFP Interface-4(b) mutation (I735A) j, OPA1-GFP Interface-5 mutation (E444A) k, OPA1-GFP Interface-6 mutations (D716A) l, OPA1-GFP Interface-7 mutations (K819A:N820A) m, OPA1-GFP Interface-8 mutation (R235A) n, OPA1-GFP Interface-9 mutations (E213A:Q217A:R557A:D565A) o, OPA1-GFP Membrane-inserting loop, Pα2 mutations (W771A:K772A:K773A:R774A:W775A:L776A:Y777A:W778A:K779A:N780A: R781A) p, OPA1-GFP Control-1 non-interfacial mutant (L243A) q, OPA1-GFP Control-2 non-interfacial mutant (L248A) r, OPA1-GFP Control-3 non-interfacial mutant (K369A) s, OPA1-GFP Control-4 non-interfacial mutant (T651A). Scale bar measures 10 μm. All experiments were repeated 3 times, each experiment was repeated independently with similar results.
Extended Data Fig. 10: Cell imaging statistics examining the functional impact of OPA1 mutants in more detail.
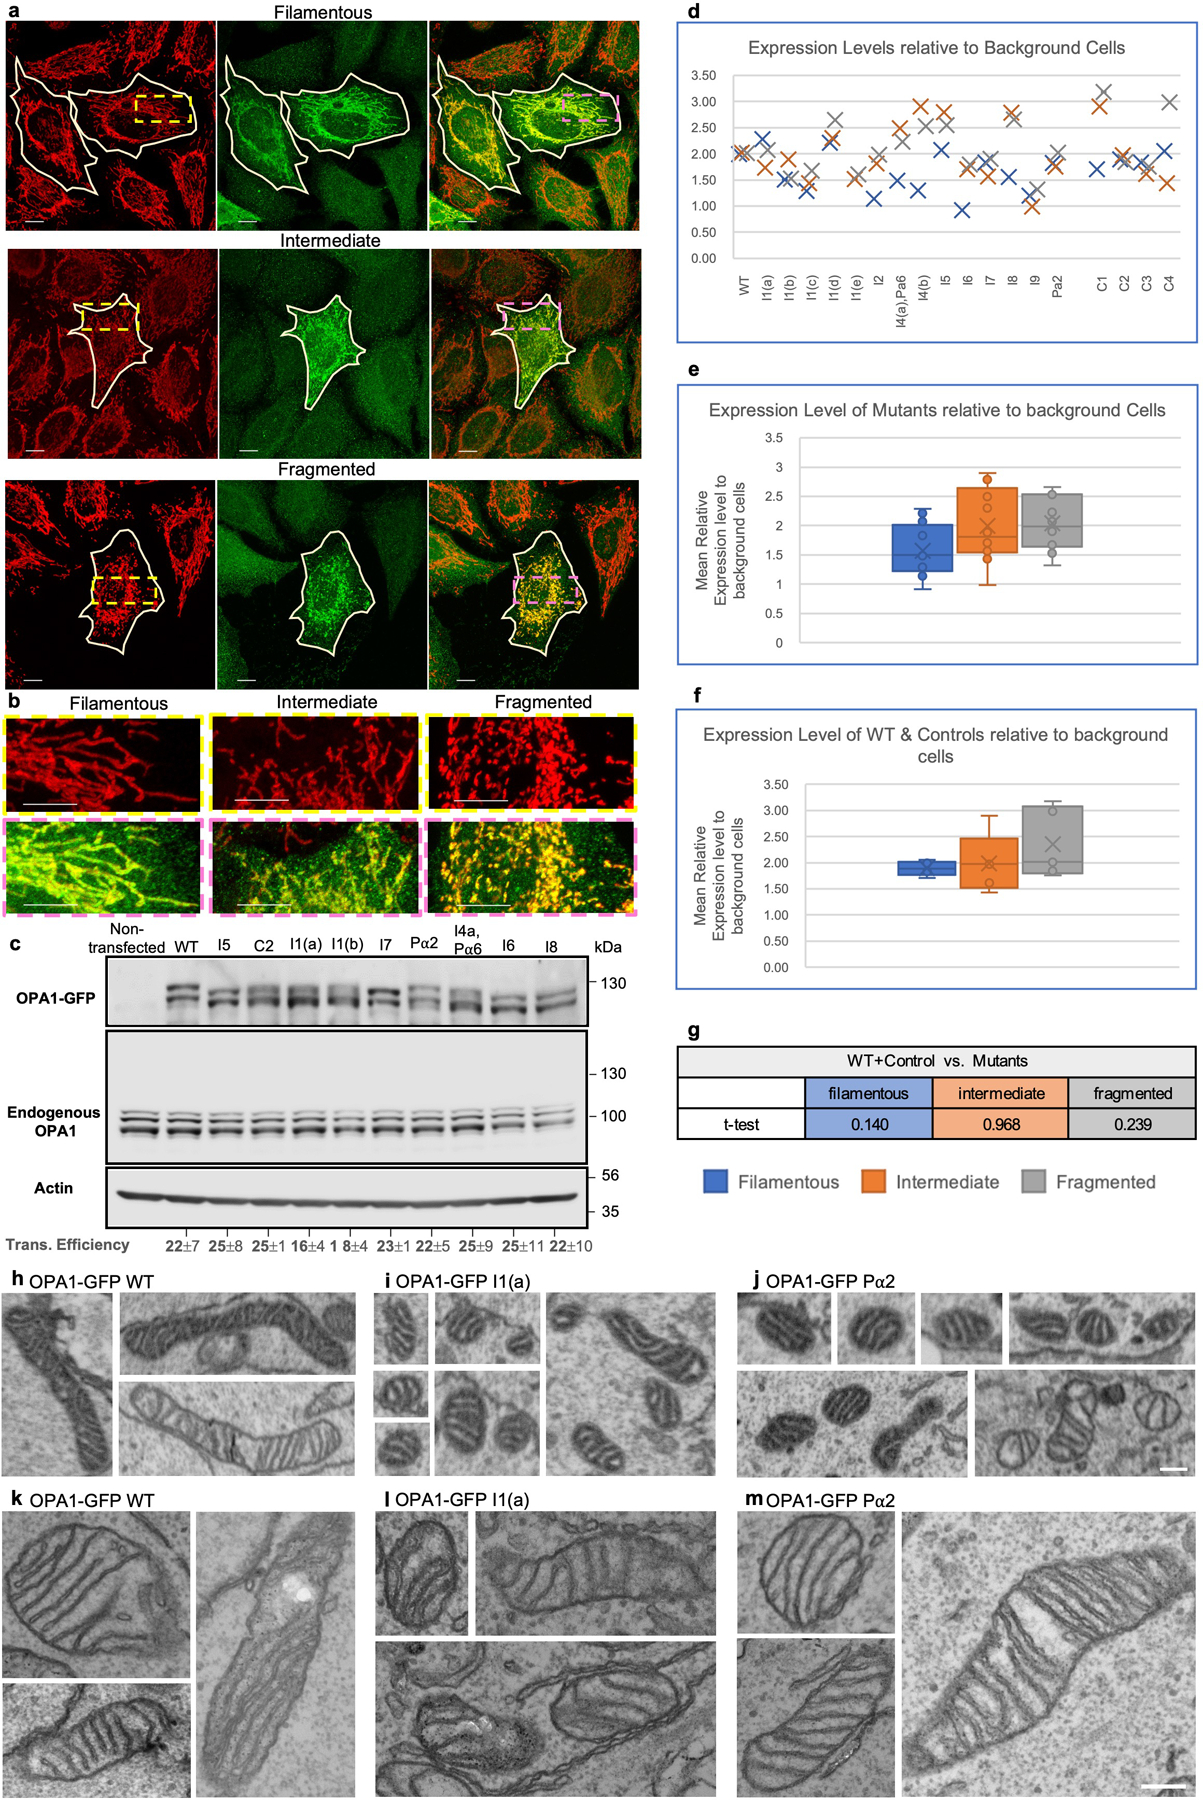
a, Example images of filamentous, intermediate, and fragmented mitochondrial networks used for categorizing single-cell data. Left, mitochondria immunostained against Tom20. Middle, OPA1-GFP mitochondrial localization. Right, colocalization of OPA1-GFP and mitochondria immunostained against Tom20. Scale bar measures 10 μm. b, Zoomed regions of the anti-Tom20 (yellow dash) and merged (pink dash) filamentous, intermediate, and fragmented mitochondria. Scale bar measures 10 μm. c, Western blot of HeLa-M cells showing the ratios of GFP-tagged and endogenous long- and short-OPA1. Top panel, long- and short-OPA1-GFP (117 kDa, 129 kDa) detected with an anti-GFP antibody (long- to short-OPA1 ratio: ~0.78:1). The relative expression between WT vs. mutant OPA1-GFP is 1:0.8–1.1. Middle, long- and short- ratios of endogenous OPA1 isoforms (~89 kDa, ~101 kDa) detected with anti-OPA1 antibody (long- and short-OPA1 ratio:~0.8:1). Bottom panel, actin control detected with anti-actin antibody. Below, transfection efficiencies, measured in parallel samples using fluorescence imaging. d, Plot of cells transfected with OPA1-GFP expression levels estimated from differences in intensity relative to background cells. OPA1-GFP mutations are found in Fig. 4 and Extended Data Fig. 9. e, Box and Whisker plot of transfected OPA-GFP mutants intensity over background cells. The data are presented as mean +/− SEM expression values. The values are 1.59 +/−0.12 for cells scored as filamentous, 1.98 +/− 0.16 for cells scored as intermediate, and 2.04 +/− 0.12 for cells scored as fragmented. The numbers are from three biologically independent experiments for all mutants tested. The numbers are from three biologically independent experiments for all mutants tested. The minima are 0.92, 0.98, and 1.32 for filamentous, intermediate, and fragmented, respectively. The maxima 2.28, 2.90, and 2.66 for filamentous, intermediate, and fragmented, respectively. The medians are 1.51, 1.78, and 2.00 for filamentous, intermediate, and fragmented, respectively. The boundaries of the boxes that correspond to 25% and 75% percentiles are 1.24 and 1.95 for filamentous, 1.56 and 2.57 for intermediate, and 1.65 and 2.53 for fragmented. f, Box and Whisker plot of transfected OPA-GFP WT and controls intensity over background cells. The data are presented as mean +/− SEM expression values. The values are 1.89 +/−0.06 for cells scored as filamentous, 1.99 +/− 0.25 for cells scored as intermediate, and 2.35 +/− 0.30 for cells scored as fragmented. The numbers are from three biologically independent experiments for WT and each control. The minima are 1.71, 1.43, and 1.76 for filamentous, intermediate, and fragmented, respectively. The maxima are 2.05, 2.90, and 3.18 for filamentous, intermediate, and fragmented, respectively. The medians are 1.89, 1.97, and 2.01 for filamentous, intermediate, and fragmented, respectively. The boundaries of boxes that correspond to 25% and 75% percentiles are 1.77 and 2.02 for filamentous, 1.52 and 2.46 for intermediate, and 1.80 and 3.08 for fragmented. g, Table of t-test values display no significant difference in expression intensity between transfected OPA-GFP mutants and transfected OPA1-GFP WT and control cells. The Student T test (two-sided) was performed using the 2-tailed version, and the two-sample equal variance type. P-values of the relative expression levels between WT control vs. mutants are 0.140, 0.968, and 0.239 for filamentous, intermediate, and fragmented, respectively. They are all not statistically different. Coloring for (d-g) represent mitochondrial networks categorized as filamentous (blue), intermediate (orange), or fragmented (gray). h-j, FIB-SEM images of mitochondrial cristae from HeLa-M cells transfected with OPA1-GFP. Scalebar is 250 nm. h, Images of OPA1-GFP WT. i, OPA1-GFP I1(a). j, OPA1-GFP Pα2. k-m, TEM images of mitochondrial cristae from HeLa-M cells transfected with OPA1-GFP. Scalebar is 250 nm. k, Images of OPA1-GFP. l, OPA1-GFP I1(a). m, OPA1-GFP Pα2. For (a-m) experiments were repeated 3 times, each experiment was repeated independently with similar results.
Extended Data Table 1:
| position (res no.) | WT seq (aa) | disease mutant (aa) | position (res no.) | WT seq (aa) | disease mutant (aa) | position (res no.) | WT seq (aa) | disease mutant (aa) | position (res no.) | WT seq (aa) | disease mutant (aa) |
|---|---|---|---|---|---|---|---|---|---|---|---|
| 8 | A | S | 332 d | S | E* | 501 | V | D | 728 | N | K |
| 15 | Q | K | 337 | H | D | 502b,d | V | G | 730 | L | F |
| 24 | I | V | 339 | A | T, D | 503 b | T | K | 735 a | I | M |
| 29 | P | H* | 340 | L | P, Y* | 505 a,b | K | N | 736a | S | L* |
| 61 | Q | R | 342 | K | E | 515 | I | K* | 740 | Q | L* |
| 80 | Y | H, C | 343 | D | A | 517 | E | I* | 745 a,c,d | I | M |
| 82 | Y | C | 346 | R | Q, G* | 518 | Y | N* | 746 a,c | Y | L* |
| 85 | R | H | 357 | A | T, L* | 521 | E | D* | 747 a | F | L* |
| 95 | T | M | 358 | A | F* | 524 | Q | R, L, S* | 755 a | R | C |
| 101 | R | Q* | 366 | R | Q | 534 | L | R | 756 c | L | P |
| 102 | Y | C | 371 | V | G | 541 | T | A | 759 | T | M |
| 115 | A | V | 376 a | T | A | 545 | S | R | 765 a | N | K* |
| 119 | F | S | 377 | V | I | 547 | A | E | 768 | G | S, D |
| 125 | M | T | 380 | E | D | 548 d | V | I, F* | 770 c | D | E |
| 127 | P | L | 381 | T | S | 549 | S | I, F* | 781 c | R | W |
| 132 | Y | I* | 382 | I | M | 550 | D | N | 783 c | Q | R, P* |
| 150 | E | V* | 384 | L | F | 551 | C | Y | 785 c | Q | R |
| 158 | S | N | 385 | N | C, R* | 553 | W | G* | 786 c | C | F* |
| 160 | E | Q | 391 | L | R | 554 | K | N* | 789 c | N | S, M* |
| 167 | P | L | 394 d | M | V | 556 d | V | E, S*, Q* | 819 a | K | R* |
| 187 | S | A* | 395 | V | G | 557 a | R | P, Y* | 823 a,c | S | Y |
| 189 | E | G* | 396 | L | P, R | 565 a | D | I* | 831 a | S | N |
| 191 | T | M | 399 d | L | Y* | 571 | R | H | 832 a | L | F |
| 192 | A | V | 400 | P | A, L, S | 574 | L | P | 833 d | I | L* |
| 196 | T | N* | 401 b,d | G | R, D | 575 | E | K | 841 a | Y | C |
| 205 a | H | L* | 402 a | V | M | 582 | Y | C | 843 c | R | S |
| 211 | D | K* | 404 a | N | K* | 585 | L | R* | 846 | L | F* |
| 212 a | K | R* | 405 a | T | I* | 590 | R | Q, W | 852 c | H | T* |
| 213 a | E | R* | 409 a | G | D | 592 | E | Q* | 856 d | C | N* |
| 214 d | K | N* | 410 a | M | H* | 593 | L | P | 863 a,c | Y | I* |
| 222 | L | P | 418 | I | F | 594 | F | K* | 864 a,c | Q | P* |
| 235 | R | Q | 422 | S | R | 595 | E | G* | 872 a,c | L | W* |
| 252 | D | E* | 426 | M | L | 601 | I | V | 873 a | E | G* |
| 260 | L | F | 428 | N | H, D | 609 | S | A* | 880 | F | A* |
| 265 | I | T* | 430 a | N | D | 612 a | T | Q* | 881 | W | L* |
| 268 | Y | C | 431 | A | S* | 617 | E | L* | 882 | R | L, C, G |
| 269 | S | F | 434 a,b,d | L | P, R | 627 a | R | E*, S* | 885 | R | H |
| 270 | E | K | 435 d | C | R,Y | 631 a | H | R* | 887 | L | P |
| 272 | L | P, F | 443 a | A | T | 646 a | S | L | 894 | L | F* |
| 273 | D | A | 444 a | E | G | 652 | T | A | 901 | T | I, L* |
| 280 | A | V* | 445 a | R | L, H | 653 d | V | G | 903 | V | L, I, G, E* |
| 285 | Q | R | 446 a | S | C | 654 | D | G, V* | 907 | E | G |
| 290 | R | Q, W, L | 449 a | T | R, P | 656 a | K | S* | 909 | N | C* |
| 292 d | V | F | 450 b | D | R* | 659 a | Q | T* | 910 d | V | D |
| 296 a | D | E | 452 d | V | S* | 662 | D | V* | 921 | G | C |
| 298 a,b | S | N, G | 457 | P | T | 663 a | K | N* | 924 | K | R* |
| 299 b | A | P | 459 | G | E | 666 d | P | L* | 928 | L | P |
| 300 b | G | E | 462 d | T | I | 671 a | E | A | 929 | T | S |
| 302 b | T | P | 465 d | V | F | 672 | V | L* | 932 | R | C, L* |
| 303 b | S | N | 468 a,b | K | E | 673 d | A | R* | 933 d | V | F |
| 310 | Q | R | 469 a | V | I | 677 d | L | Y* | 934 | Q | P* |
| 311 | A | V* | 470 a,b | D | G | 683 a | R | H | 939 | L | P |
| 313 d | I | K, E | 471 a,b | L | P | 687 a | E | D*, T* | 942 | V | S*, E* |
| 317 a,b | G | D* | 482 | I | F, G* | 699 | K | N* | 943 | R | E* |
| 322 b | M | R | 487 | E | K | 701 | K | R* | 949 | L | P, R, I, T* |
| 326 | P | Q* | 488 a,b | G | R | 709 a | I | G* | 950 | D | C* |
| 328 | K | R | 493 d | M | K | 716 a | D | E | 952 | F | S* |
| 329 d | V | L | 494 | K | I* | 717 a | F | C* | 953 | I | H* |
| 330 | T | S | 495 | A | V | 718 | A | E | |||
| 331 d | L | P | 499 | F | L* | 725 | I | S* |
Sites are colored by domain: luminal/MTS, dark gray; N-terminal linker before S1 cleavage site, light gray; N-terminal coiled-coil, medium gray; BSE, magenta; GTPase domain, green; hinge-1, lightest gray; stalk, blue; paddle, orange. Asterisks note single-point mutations resulting from a frame shift.
protein:protein interfaces
protein:nucleotide binding
membrane-binding
buried residues
Supplementary Material
Acknowledgments
This work was supported by the NIDDK and NHLBI NIH Intramural Research Program. This work used the NIH Multi-Institute CryoEM Facility (MICEF) and the NIDDK CryoEM core facility, NHLBI light microscopy core facility, and the computational resources of the NIH HPC Biowulf cluster (http://hpc.nih.gov). We would like to thank David A. Nyenhuis, Huaibin Wang, Yanxiang Cui, Haotian Lei, Andrew D. Kehr, and Hank W. Breen for technical support and computing assistance.
Footnotes
Extended Data Table 1: DOA Mutations currently identified in OPA11,18,19. Sites are colored by domain: luminal/MTS, dark gray; N-terminal linker before S1 cleavage site, light gray; N-terminal coiled-coil, medium gray; BSE, magenta; GTPase domain, green; hinge-1, lightest gray; stalk, blue; paddle, orange. Asterisks note single-point mutations resulting from a frame shift. aprotein:protein interfaces bprotein:nucleotide binding cmembrane-binding dburied residues
Competing interests
The authors declare no competing interests.
Data availability
Structural data supporting findings in this study have been deposited in the Protein Data Bank (PDB) and the Electron Microscopy Data Bank (EMDB). The accession codes of the cryo-EM maps and accompanying atomic models have been provided for: (1) s-OPA1 GDP-AlFx:dimer (PDB ID: 8EEW) and s-OPA1 GDP-AlFx helical assembly (EMDB-28063) (2) s-OPA1 apo:dimer (PDB ID: 8EF7) and s-OPA1 apo helical assembly (EMDB-28074) (3) s-OPA1 GDP-AlFx:tetramer (PDB ID: 8EFF) (4) s-OPA1 apo:tetramer (PDB ID: 8EFS) (5) s-OPA1 GDP-AlFx:9-dimers (PDB ID: 8EFR) (6) s-OPA1 apo:9-dimers (PDB ID: 8EFT). Additional submitted maps include: (1) Z-clipped s-OPA1 GDP-AlFx helical assembly (EMDB-40192), (2) Z-clipped s-OPA1 apo helical assembly (EMDB-40193), (3) s-OPA1 GDP-AlFx dimer (interface-1–3) (EMDB-40200), (4) s-OPA1 apo dimer (interface-1–3) (EMDB-40202), (5) s-OPA1 GDP-AlFx interface-4 (EMDB-40210), (6) s-OPA1 apo interface-4 (EMDB-40211), (7) s-OPA1 GDP-AlFx interface-7 (EMDB-40212), (8) s-OPA1 apo interface-7 (EMDB-40213), (9) s-OPA1 GDP-AlFx stalk:paddles (interface-1–3) (EMDB-40203), (10) s-OPA1 apo stalk:paddles (interface-1–3) (EMDB-40204), (11) s-OPA1 GDP-AlFx interface-5–6 (EMDB-40214), (12) s-OPA1 GDP-AlFx interface-8 (EMDB-40198), (13) s-OPA1 GDP-AlFx monomer A (EMDB-40215), (14) s-OPA1 GDP-AlFx monomer B (EMDB-40216), (15) s-OPA1 GDP-AlFx helix, N-terminal mask (EMDB-40197), and (16) s-OPA1 GDP-AlFx membrane-inserting loop (Pα2):cardiolipin monolayer (EMDB-40217). Plasmids from cell experiments (Supplementary Table 3) have been deposited in Addgene. Source Data can be found in the Source Data File. Source data for Figure 4h are available under the Fig. 4h tab. Source data for Extended Data Figure 2a are available under the ED Fig. 2a tab. Source data for Extended Data Figure 2b are available under the ED Fig. 2b(left-nuc), Fig. 2b(left-apo), Fig. 2b(right) tabs. Source data for Extended Data Figure 10d are available under the ED Fig. 10d tab, Source data for Extended Data Figure 10e are available under the ED Fig. 10e tab, Source data for Extended Data Figure 10f are available under the ED Fig. 10f tab. Raw images for Extended Data Figure 2b and 10c are available in Supplementary Figure 1. Additional data compared in this study from the protein databank: PDB ID:6JTG, Alphafold ID:AF-O60313-F,1PDB ID: 6QL4, PDB ID: 6JSJ, PDB ID:6RZV, PDB ID: 6RZW, PDBID:3ZYC, PDB ID:6DLV.
Code availability
Custom codes were not central to the conclusions of the paper.
References
- 1.Le Roux B et al. OPA1: 516 unique variants and 831 patients registered in an updated centralized Variome database. Orphanet J Rare Dis 14, 214, doi: 10.1186/s13023-019-1187-1 (2019). [DOI] [PMC free article] [PubMed] [Google Scholar]
- 2.Del Dotto V & Carelli V Dominant Optic Atrophy (DOA): Modeling the Kaleidoscopic Roles of OPA1 in Mitochondrial Homeostasis. Front Neurol 12, 681326, doi: 10.3389/fneur.2021.681326 (2021). [DOI] [PMC free article] [PubMed] [Google Scholar]
- 3.Gao S & Hu J Mitochondrial Fusion: The Machineries In and Out. Trends Cell Biol 31, 62–74, doi: 10.1016/j.tcb.2020.09.008 (2021). [DOI] [PubMed] [Google Scholar]
- 4.Jimah JR & Hinshaw JE Structural Insights into the Mechanism of Dynamin Superfamily Proteins. Trends in Cell Biology 29, 257–273, doi: 10.1016/j.tcb.2018.11.003 (2019). [DOI] [PMC free article] [PubMed] [Google Scholar]
- 5.Chan DC Mitochondrial fusion and fission in mammals. Annu Rev Cell Dev Biol 22, 79–99, doi: 10.1146/annurev.cellbio.22.010305.104638 (2006). [DOI] [PubMed] [Google Scholar]
- 6.Horvath SE & Daum G Lipids of mitochondria. Prog Lipid Res 52, 590–614, doi: 10.1016/j.plipres.2013.07.002 (2013). [DOI] [PubMed] [Google Scholar]
- 7.Mishra P & Chan DC Mitochondrial dynamics and inheritance during cell division, development and disease. Nat Rev Mol Cell Biol 15, 634–646, doi: 10.1038/nrm3877 (2014). [DOI] [PMC free article] [PubMed] [Google Scholar]
- 8.Francy CA, Clinton RW, Fröhlich C, Murphy C & Mears JA Cryo-EM Studies of Drp1 Reveal Cardiolipin Interactions that Activate the Helical Oligomer. Sci Rep 7, 10744, doi: 10.1038/s41598-017-11008-3 (2017). [DOI] [PMC free article] [PubMed] [Google Scholar]
- 9.Macdonald PJ et al. A dimeric equilibrium intermediate nucleates Drp1 reassembly on mitochondrial membranes for fission. Mol Biol Cell 25, 1905–1915, doi: 10.1091/mbc.E14-02-0728 (2014). [DOI] [PMC free article] [PubMed] [Google Scholar]
- 10.Stepanyants N et al. Cardiolipin’s propensity for phase transition and its reorganization by dynamin-related protein 1 form a basis for mitochondrial membrane fission. Mol Biol Cell 26, 3104–3116, doi: 10.1091/mbc.E15-06-0330 (2015). [DOI] [PMC free article] [PubMed] [Google Scholar]
- 11.Fröhlich C et al. Structural insights into oligomerization and mitochondrial remodelling of dynamin 1-like protein. Embo j 32, 1280–1292, doi: 10.1038/emboj.2013.74 (2013). [DOI] [PMC free article] [PubMed] [Google Scholar]
- 12.Song Z, Ghochani M, McCaffery JM, Frey TG & Chan DC Mitofusins and OPA1 mediate sequential steps in mitochondrial membrane fusion. Mol Biol Cell 20, 3525–3532, doi: 10.1091/mbc.e09-03-0252 (2009). [DOI] [PMC free article] [PubMed] [Google Scholar]
- 13.Zhang Y & Chan DC New insights into mitochondrial fusion. FEBS Lett 581, 2168–2173, doi: 10.1016/j.febslet.2007.01.095 (2007). [DOI] [PMC free article] [PubMed] [Google Scholar]
- 14.Del Dotto V, Fogazza M, Carelli V, Rugolo M & Zanna C Eight human OPA1 isoforms, long and short: What are they for? Biochim Biophys Acta Bioenerg 1859, 263–269, doi: 10.1016/j.bbabio.2018.01.005 (2018). [DOI] [PubMed] [Google Scholar]
- 15.Lee H & Yoon Y Mitochondrial Membrane Dynamics-Functional Positioning of OPA1. Antioxidants (Basel) 7, doi: 10.3390/antiox7120186 (2018). [DOI] [PMC free article] [PubMed] [Google Scholar]
- 16.Anand R et al. The i-AAA protease YME1L and OMA1 cleave OPA1 to balance mitochondrial fusion and fission. J Cell Biol 204, 919–929, doi: 10.1083/jcb.201308006 (2014). [DOI] [PMC free article] [PubMed] [Google Scholar]
- 17.Landes T et al. OPA1 (dys)functions. Semin Cell Dev Biol 21, 593–598, doi: 10.1016/j.semcdb.2009.12.012 (2010). [DOI] [PubMed] [Google Scholar]
- 18.Weisschuh N et al. Mutation spectrum of the OPA1 gene in a large cohort of patients with suspected dominant optic atrophy: Identification and classification of 48 novel variants. PLoS One 16, e0253987, doi: 10.1371/journal.pone.0253987 (2021). [DOI] [PMC free article] [PubMed] [Google Scholar]
- 19.Li D, Wang J, Jin Z & Zhang Z Structural and evolutionary characteristics of dynamin-related GTPase OPA1. PeerJ 7, e7285, doi: 10.7717/peerj.7285 (2019). [DOI] [PMC free article] [PubMed] [Google Scholar]
- 20.Ban T, Heymann JA, Song Z, Hinshaw JE & Chan DC OPA1 disease alleles causing dominant optic atrophy have defects in cardiolipin-stimulated GTP hydrolysis and membrane tubulation. Hum Mol Genet 19, 2113–2122, doi: 10.1093/hmg/ddq088 (2010). [DOI] [PMC free article] [PubMed] [Google Scholar]
- 21.Yapa NMB, Lisnyak V, Reljic B & Ryan MT Mitochondrial dynamics in health and disease. FEBS Lett 595, 1184–1204, doi: 10.1002/1873-3468.14077 (2021). [DOI] [PubMed] [Google Scholar]
- 22.Zhang D et al. Cryo-EM structures of S-OPA1 reveal its interactions with membrane and changes upon nucleotide binding. Elife 9, doi: 10.7554/eLife.50294 (2020). [DOI] [PMC free article] [PubMed] [Google Scholar]
- 23.Yu C et al. Structural insights into G domain dimerization and pathogenic mutation of OPA1. Journal of Cell Biology 219, doi: 10.1083/jcb.201907098 (2020). [DOI] [PMC free article] [PubMed] [Google Scholar]
- 24.Wang R et al. Identification of new OPA1 cleavage site reveals that short isoforms regulate mitochondrial fusion. Mol Biol Cell 32, 157–168, doi: 10.1091/mbc.E20-09-0605 (2021). [DOI] [PMC free article] [PubMed] [Google Scholar]
- 25.Ge Y et al. Two forms of Opa1 cooperate to complete fusion of the mitochondrial inner-membrane. Elife 9, doi: 10.7554/eLife.50973 (2020). [DOI] [PMC free article] [PubMed] [Google Scholar]
- 26.Faelber K et al. Structure and assembly of the mitochondrial membrane remodelling GTPase Mgm1. Nature 571, 429–433, doi: 10.1038/s41586-019-1372-3 (2019). [DOI] [PMC free article] [PubMed] [Google Scholar]
- 27.Yan L et al. Structural analysis of a trimeric assembly of the mitochondrial dynamin-like GTPase Mgm1. Proc Natl Acad Sci U S A 117, 4061–4070, doi: 10.1073/pnas.1919116117 (2020). [DOI] [PMC free article] [PubMed] [Google Scholar]
- 28.Faelber K et al. Crystal structure of nucleotide-free dynamin. Nature 477, 556–560, doi: 10.1038/nature10369 (2011). [DOI] [PubMed] [Google Scholar]
- 29.Yu C et al. Structural insights into G domain dimerization and pathogenic mutation of OPA1. J Cell Biol 219, doi: 10.1083/jcb.201907098 (2020). [DOI] [PMC free article] [PubMed] [Google Scholar]
- 30.Punjani A, Zhang H & Fleet DJ Non-uniform refinement: adaptive regularization improves single-particle cryo-EM reconstruction. Nat Methods 17, 1214–1221, doi: 10.1038/s41592-020-00990-8 (2020). [DOI] [PubMed] [Google Scholar]
- 31.Zhong ED, Bepler T, Berger B & Davis JH CryoDRGN: reconstruction of heterogeneous cryo-EM structures using neural networks. Nat Methods 18, 176–185, doi: 10.1038/s41592-020-01049-4 (2021). [DOI] [PMC free article] [PubMed] [Google Scholar]
- 32.Jimah JR & Hinshaw JE Structural Insights into the Mechanism of Dynamin Superfamily Proteins. Trends Cell Biol 29, 257–273, doi: 10.1016/j.tcb.2018.11.003 (2019). [DOI] [PMC free article] [PubMed] [Google Scholar]
- 33.Krissinel E & Henrick K Inference of macromolecular assemblies from crystalline state. J Mol Biol 372, 774–797, doi: 10.1016/j.jmb.2007.05.022 (2007). [DOI] [PubMed] [Google Scholar]
- 34.Chappie JS et al. A pseudoatomic model of the dynamin polymer identifies a hydrolysis-dependent powerstroke. Cell 147, 209–222, doi: 10.1016/j.cell.2011.09.003 (2011). [DOI] [PMC free article] [PubMed] [Google Scholar]
- 35.Chappie JS, Acharya S, Leonard M, Schmid SL & Dyda F G domain dimerization controls dynamin’s assembly-stimulated GTPase activity. Nature 465, 435–440, doi: 10.1038/nature09032 (2010). [DOI] [PMC free article] [PubMed] [Google Scholar]
- 36.Allen KN, Entova S, Ray LC & Imperiali B Monotopic Membrane Proteins Join the Fold. Trends Biochem Sci 44, 7–20, doi: 10.1016/j.tibs.2018.09.013 (2019). [DOI] [PMC free article] [PubMed] [Google Scholar]
- 37.Prinz WA & Hinshaw JE Membrane-bending proteins. Crit Rev Biochem Mol Biol 44, 278–291, doi: 10.1080/10409230903183472 (2009). [DOI] [PMC free article] [PubMed] [Google Scholar]
- 38.Sharma KD, Heberle FA & Waxham MN Visualizing lipid membrane structure with cryo-EM: past, present, and future. Emerging Topics in Life Sciences, doi: 10.1042/etls20220090 (2023). [DOI] [PMC free article] [PubMed] [Google Scholar]
- 39.Biou V Lipid-membrane protein interaction visualised by cryo-EM: A review. Biochimica et Biophysica Acta (BBA) – Biomembranes 1865, 184068, doi: 10.1016/j.bbamem.2022.184068 (2023). [DOI] [PubMed] [Google Scholar]
- 40.Hedger G et al. Lipid-Loving ANTs: Molecular Simulations of Cardiolipin Interactions and the Organization of the Adenine Nucleotide Translocase in Model Mitochondrial Membranes. Biochemistry 55, 6238–6249, doi: 10.1021/acs.biochem.6b00751 (2016). [DOI] [PMC free article] [PubMed] [Google Scholar]
- 41.Corey RA et al. Identification and assessment of cardiolipin interactions with E. coli inner membrane proteins. Science Advances 7, eabh2217, doi: 10.1126/sciadv.abh2217. [DOI] [PMC free article] [PubMed] [Google Scholar]
- 42.Planas-Iglesias J et al. Cardiolipin Interactions with Proteins. Biophys J 109, 1282–1294, doi: 10.1016/j.bpj.2015.07.034 (2015). [DOI] [PMC free article] [PubMed] [Google Scholar]
- 43.Renner LD & Weibel DB Cardiolipin microdomains localize to negatively curved regions of Escherichia coli membranes. Proceedings of the National Academy of Sciences 108, 6264–6269, doi: 10.1073/pnas.1015757108 (2011). [DOI] [PMC free article] [PubMed] [Google Scholar]
- 44.Glancy B, Kim Y, Katti P & Willingham TB The Functional Impact of Mitochondrial Structure Across Subcellular Scales. Frontiers in Physiology 11, doi: 10.3389/fphys.2020.541040 (2020). [DOI] [PMC free article] [PubMed] [Google Scholar]
- 45.Yang Z et al. Mitochondrial Membrane Remodeling. Frontiers in Bioengineering and Biotechnology 9, doi: 10.3389/fbioe.2021.786806 (2022). [DOI] [PMC free article] [PubMed] [Google Scholar]
- 46.Liu X, Weaver D, Shirihai O & Hajnóczky G Mitochondrial ‘kiss-and-run’: interplay between mitochondrial motility and fusion–fission dynamics. The EMBO Journal 28, 3074–3089, doi: 10.1038/emboj.2009.255 (2009). [DOI] [PMC free article] [PubMed] [Google Scholar]
- 47.Mears JA et al. Conformational changes in Dnm1 support a contractile mechanism for mitochondrial fission. Nat Struct Mol Biol 18, 20–26, doi: 10.1038/nsmb.1949 (2011). [DOI] [PMC free article] [PubMed] [Google Scholar]
- 48.Ge Y, Boopathy S, Nguyen TH, Lugo CM & Chao LH Absence of Cardiolipin From the Outer Leaflet of a Mitochondrial Inner Membrane Mimic Restricts Opa1-Mediated Fusion. Front Mol Biosci 8, 769135, doi: 10.3389/fmolb.2021.769135 (2021). [DOI] [PMC free article] [PubMed] [Google Scholar]
- 49.Ban T et al. Molecular basis of selective mitochondrial fusion by heterotypic action between OPA1 and cardiolipin. Nat Cell Biol 19, 856–863, doi: 10.1038/ncb3560 (2017). [DOI] [PubMed] [Google Scholar]
- 50.Ban T, Kohno H, Ishihara T & Ishihara N Relationship between OPA1 and cardiolipin in mitochondrial inner-membrane fusion. Biochim Biophys Acta Bioenerg 1859, 951–957, doi: 10.1016/j.bbabio.2018.05.016 (2018). [DOI] [PubMed] [Google Scholar]
- 51.Osman C, Voelker DR & Langer T Making heads or tails of phospholipids in mitochondria. J Cell Biol 192, 7–16, doi: 10.1083/jcb.201006159 (2011). [DOI] [PMC free article] [PubMed] [Google Scholar]
- 52.Beltrán-Heredia E et al. Membrane curvature induces cardiolipin sorting. Communications Biology 2, 225, doi: 10.1038/s42003-019-0471-x (2019). [DOI] [PMC free article] [PubMed] [Google Scholar]
- 53.Rujiviphat J et al. Mitochondrial Genome Maintenance 1 (Mgm1) Protein Alters Membrane Topology and Promotes Local Membrane Bending. Journal of Molecular Biology 427, 2599–2609, doi: 10.1016/j.jmb.2015.03.006 (2015). [DOI] [PubMed] [Google Scholar]
- 54.DeVay RM et al. Coassembly of Mgm1 isoforms requires cardiolipin and mediates mitochondrial inner membrane fusion. Journal of Cell Biology 186, 793–803, doi: 10.1083/jcb.200906098 (2009). [DOI] [PMC free article] [PubMed] [Google Scholar]
- 55.Joardar A, Pattnaik GP & Chakraborty H Mechanism of Membrane Fusion: Interplay of Lipid and Peptide. The Journal of Membrane Biology 255, 211–224, doi: 10.1007/s00232-022-00233-1 (2022). [DOI] [PMC free article] [PubMed] [Google Scholar]
- 56.Frohman MA Role of mitochondrial lipids in guiding fission and fusion. J Mol Med (Berl) 93, 263–269, doi: 10.1007/s00109-014-1237-z (2015). [DOI] [PMC free article] [PubMed] [Google Scholar]
- 57.Paradies G, Paradies V, Ruggiero FM & Petrosillo G Role of Cardiolipin in Mitochondrial Function and Dynamics in Health and Disease: Molecular and Pharmacological Aspects. Cells 8, doi: 10.3390/cells8070728 (2019). [DOI] [PMC free article] [PubMed] [Google Scholar]
- 58.Guo Y et al. Visualizing Intracellular Organelle and Cytoskeletal Interactions at Nanoscale Resolution on Millisecond Timescales. Cell 175, 1430–1442.e1417, doi: 10.1016/j.cell.2018.09.057 (2018). [DOI] [PubMed] [Google Scholar]
- 59.Leonard M, Song BD, Ramachandran R & Schmid SL Robust colorimetric assays for dynamin’s basal and stimulated GTPase activities. Methods Enzymol 404, 490–503, doi: 10.1016/s0076-6879(05)04043-7 (2005). [DOI] [PubMed] [Google Scholar]
- 60.Zivanov J et al. New tools for automated high-resolution cryo-EM structure determination in RELION-3. Elife 7, doi: 10.7554/eLife.42166 (2018). [DOI] [PMC free article] [PubMed] [Google Scholar]
- 61.Zheng SQ et al. MotionCor2: anisotropic correction of beam-induced motion for improved cryo-electron microscopy. Nat Methods 14, 331–332, doi: 10.1038/nmeth.4193 (2017). [DOI] [PMC free article] [PubMed] [Google Scholar]
- 62.Rohou A & Grigorieff N CTFFIND4: Fast and accurate defocus estimation from electron micrographs. J Struct Biol 192, 216–221, doi: 10.1016/j.jsb.2015.08.008 (2015). [DOI] [PMC free article] [PubMed] [Google Scholar]
- 63.Zivanov J, Nakane T & Scheres SHW Estimation of high-order aberrations and anisotropic magnification from cryo-EM data sets in RELION-3.1. IUCrJ 7, 253–267, doi: 10.1107/s2052252520000081 (2020). [DOI] [PMC free article] [PubMed] [Google Scholar]
- 64.Diaz R, Rice WJ & Stokes DL Fourier-Bessel reconstruction of helical assemblies. Methods Enzymol 482, 131–165, doi: 10.1016/s0076-6879(10)82005-1 (2010). [DOI] [PMC free article] [PubMed] [Google Scholar]
- 65.Schindelin J et al. Fiji: an open-source platform for biological-image analysis. Nat Methods 9, 676–682, doi: 10.1038/nmeth.2019 (2012). [DOI] [PMC free article] [PubMed] [Google Scholar]
- 66.Punjani A, Rubinstein JL, Fleet DJ & Brubaker MA cryoSPARC: algorithms for rapid unsupervised cryo-EM structure determination. Nat Methods 14, 290–296, doi: 10.1038/nmeth.4169 (2017). [DOI] [PubMed] [Google Scholar]
- 67.He S & Scheres SHW Helical reconstruction in RELION. J Struct Biol 198, 163–176, doi: 10.1016/j.jsb.2017.02.003 (2017). [DOI] [PMC free article] [PubMed] [Google Scholar]
- 68.Sanchez-Garcia R et al. DeepEMhancer: a deep learning solution for cryo-EM volume post-processing. Commun Biol 4, 874, doi: 10.1038/s42003-021-02399-1 (2021). [DOI] [PMC free article] [PubMed] [Google Scholar]
- 69.Pettersen EF et al. UCSF ChimeraX: Structure visualization for researchers, educators, and developers. Protein Sci 30, 70–82, doi: 10.1002/pro.3943 (2021). [DOI] [PMC free article] [PubMed] [Google Scholar]
- 70.Emsley P, Lohkamp B, Scott WG & Cowtan K Features and development of Coot. Acta Crystallogr D Biol Crystallogr 66, 486–501, doi: 10.1107/s0907444910007493 (2010). [DOI] [PMC free article] [PubMed] [Google Scholar]
- 71.Jumper J et al. Highly accurate protein structure prediction with AlphaFold. Nature 596, 583–589, doi: 10.1038/s41586-021-03819-2 (2021). [DOI] [PMC free article] [PubMed] [Google Scholar]
- 72.DiMaio F Advances in Rosetta structure prediction for difficult molecular-replacement problems. Acta Crystallogr D Biol Crystallogr 69, 2202–2208, doi: 10.1107/s0907444913023305 (2013). [DOI] [PMC free article] [PubMed] [Google Scholar]
- 73.Wang RY et al. Automated structure refinement of macromolecular assemblies from cryo-EM maps using Rosetta. Elife 5, doi: 10.7554/eLife.17219 (2016). [DOI] [PMC free article] [PubMed] [Google Scholar]
- 74.Williams CJ et al. MolProbity: More and better reference data for improved all-atom structure validation. Protein Sci 27, 293–315, doi: 10.1002/pro.3330 (2018). [DOI] [PMC free article] [PubMed] [Google Scholar]
- 75.Adams PD et al. PHENIX: a comprehensive Python-based system for macromolecular structure solution. Acta Crystallogr D Biol Crystallogr 66, 213–221, doi: 10.1107/s0907444909052925 (2010). [DOI] [PMC free article] [PubMed] [Google Scholar]
- 76.Madeira F et al. Search and sequence analysis tools services from EMBL-EBI in 2022. Nucleic Acids Res 50, W276–279, doi: 10.1093/nar/gkac240 (2022). [DOI] [PMC free article] [PubMed] [Google Scholar]
- 77.O’Leary NA et al. Reference sequence (RefSeq) database at NCBI: current status, taxonomic expansion, and functional annotation. Nucleic Acids Res 44, D733–745, doi: 10.1093/nar/gkv1189 (2016). [DOI] [PMC free article] [PubMed] [Google Scholar]
Associated Data
This section collects any data citations, data availability statements, or supplementary materials included in this article.
Supplementary Materials
Data Availability Statement
Structural data supporting findings in this study have been deposited in the Protein Data Bank (PDB) and the Electron Microscopy Data Bank (EMDB). The accession codes of the cryo-EM maps and accompanying atomic models have been provided for: (1) s-OPA1 GDP-AlFx:dimer (PDB ID: 8EEW) and s-OPA1 GDP-AlFx helical assembly (EMDB-28063) (2) s-OPA1 apo:dimer (PDB ID: 8EF7) and s-OPA1 apo helical assembly (EMDB-28074) (3) s-OPA1 GDP-AlFx:tetramer (PDB ID: 8EFF) (4) s-OPA1 apo:tetramer (PDB ID: 8EFS) (5) s-OPA1 GDP-AlFx:9-dimers (PDB ID: 8EFR) (6) s-OPA1 apo:9-dimers (PDB ID: 8EFT). Additional submitted maps include: (1) Z-clipped s-OPA1 GDP-AlFx helical assembly (EMDB-40192), (2) Z-clipped s-OPA1 apo helical assembly (EMDB-40193), (3) s-OPA1 GDP-AlFx dimer (interface-1–3) (EMDB-40200), (4) s-OPA1 apo dimer (interface-1–3) (EMDB-40202), (5) s-OPA1 GDP-AlFx interface-4 (EMDB-40210), (6) s-OPA1 apo interface-4 (EMDB-40211), (7) s-OPA1 GDP-AlFx interface-7 (EMDB-40212), (8) s-OPA1 apo interface-7 (EMDB-40213), (9) s-OPA1 GDP-AlFx stalk:paddles (interface-1–3) (EMDB-40203), (10) s-OPA1 apo stalk:paddles (interface-1–3) (EMDB-40204), (11) s-OPA1 GDP-AlFx interface-5–6 (EMDB-40214), (12) s-OPA1 GDP-AlFx interface-8 (EMDB-40198), (13) s-OPA1 GDP-AlFx monomer A (EMDB-40215), (14) s-OPA1 GDP-AlFx monomer B (EMDB-40216), (15) s-OPA1 GDP-AlFx helix, N-terminal mask (EMDB-40197), and (16) s-OPA1 GDP-AlFx membrane-inserting loop (Pα2):cardiolipin monolayer (EMDB-40217). Plasmids from cell experiments (Supplementary Table 3) have been deposited in Addgene. Source Data can be found in the Source Data File. Source data for Figure 4h are available under the Fig. 4h tab. Source data for Extended Data Figure 2a are available under the ED Fig. 2a tab. Source data for Extended Data Figure 2b are available under the ED Fig. 2b(left-nuc), Fig. 2b(left-apo), Fig. 2b(right) tabs. Source data for Extended Data Figure 10d are available under the ED Fig. 10d tab, Source data for Extended Data Figure 10e are available under the ED Fig. 10e tab, Source data for Extended Data Figure 10f are available under the ED Fig. 10f tab. Raw images for Extended Data Figure 2b and 10c are available in Supplementary Figure 1. Additional data compared in this study from the protein databank: PDB ID:6JTG, Alphafold ID:AF-O60313-F,1PDB ID: 6QL4, PDB ID: 6JSJ, PDB ID:6RZV, PDB ID: 6RZW, PDBID:3ZYC, PDB ID:6DLV.
Custom codes were not central to the conclusions of the paper.