

SUMMARY
Changes to cellular lipids accompany shifts in microglial cell state, but the functional significance of these metabolic changes remains poorly understood. In human induced pluripotent stem cell-derived microglia, we observed that both extrinsic activation (by lipopolysaccharide treatment) and intrinsic triggers (the Alzheimer’s disease-associated APOE4 genotype) result in accumulation of triglyceride-rich lipid droplets. We demonstrate that lipid droplet accumulation is not simply concomitant with changes in the cell state. In fact, both triglyceride biosynthesis and catabolism are critical for the activation-induced transcription and secretion of inflammatory cytokines and chemokines, as well as changes in phagocytosis. In microglia harboring the Alzheimer’s disease risk APOE4 genotype, inhibiting triglyceride biosynthesis attenuates disease-associated transcriptional states. Triglyceride biosynthesis inhibition also rescues microglial surveillance defects observed in slices from APOE4 humanized transgenic mice. Together, our findings establish that modulating triglyceride metabolism can tune microglial immune activity in response to extrinsic activation and in APOE4-associated disease.
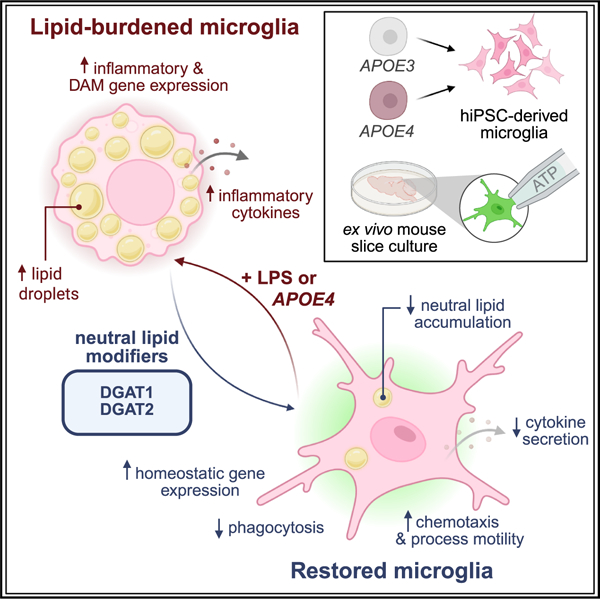
Graphical Abstract
In brief
Neuroinflammation is central to Alzheimer’s disease pathogenesis. Stephenson et al. establish that neutral lipid accumulation is necessary for microglial activation and that microglia expressing an Alzheimer’s risk gene hijack triglyceride biosynthesis to acquire a basal immune activated state. Targeting triglyceride metabolism can modulate immune reactivity and disease phenotypes.
INTRODUCTION
Neuroinflammation is central to the pathogenesis and progression of Alzheimer’s disease (AD). Microglia, the resident immune cells of the CNS, are primary mediators of neuroinflammation; they adopt a variety of inflammatory states in response to activating stimuli including pathogens, injury, protein aggregates, and cellular degeneration.1 Recent studies have characterized many microglial transcriptional states in mouse models, stem cell-derived human microglia, and human postmortem brain tissue.2–8 These states can impact signaling of other cell types and contribute to disease.9–11 Microglia highly express many genes harboring single nucleotide polymorphisms that are enriched in patients with AD relative to controls, further implicating microglia in the pathogenesis and progression of AD.12
Metabolic disruptions are a hallmark of several neurodegenerative diseases including AD. Genome-wide association studies implicate genes in lipid metabolism including the apolipoprotein genes APOE and CLU, the lipid phosphatase, INPP5D, lipid signaling gene, PLCG2, and lipid transporters, ABCA7 and ABCA1, among others.13 Intriguingly, glial lipid accumulation was one of the original pathological hallmarks of AD noted by Dr. Alois Alzheimer.14 In addition, recent work in AD mouse models and in samples from patients with AD display lipid droplet accumulation within various glial cell types including microglia.15,16 The APOE4 variant of the APOE gene is associated with a 3-fold (heterozygous) or a 12-fold (homozygous) increase in AD incidence relative to APOE3.17 The APOE4 variant has been associated with the accumulation of cholesterol and triglycerides in several model systems.18–26 Our previous work identified that APOE4 increases triglyceride storage in lipid droplets in human induced pluripotent stem cell (iPSC)-derived astrocytes and microglia.24 This has now been observed in multiple other systems including neuron-microglial co-cultures,19,26 postmortem brain samples,19,27 and mouse models.22,23,28
A growing body of research has revealed a complex interplay between the metabolic state of innate immune cells and their response to environmental stimuli. In aged mice, lipid droplets accumulate in microglia, which exhibit a proinflammatory state.29 Challenging mouse microglia with aggregates of the AD-associated amyloid-beta peptide also elicits lipid droplet accumulation.16,19,20 In both human and mouse microglia, APOE4-mediated changes to microglial lipid metabolism, including lipid droplet accumulation, are correlated with a proinflammatory state.19,20,25,26 Lipid droplet accumulation in microglia due to exposure to amyloid-beta aggregates or the APOE4 genotype can cause downstream effects on neuronal calcium signaling and neuronal tau phosphorylation.19,26 Taken together, these studies have strongly correlated microglial lipid droplets with inflammation and disease processes. However, we still do not understand whether lipid droplets are a necessary part of the inflammatory response or an epiphenomenon. Moreover, the functional similarities and differences between lipid droplet accumulation initiated by extrinsic versus intrinsic stimuli remain unknown.
In this work, we define the connections between microglial triglyceride metabolism and response to inflammatory stimulation, both extrinsic and intrinsic. We used human iPSC-derived microglia, which can be either activated using compounds like lipopolysaccharide (LPS) or exhibit an immune active state when they harbor disease genotypes like APOE4. When stimulated by external ligands or when harboring disease genotypes, these microglia display accumulation of neutral lipids in lipid droplets. By manipulating triglyceride metabolism, we discovered that both synthesis and catabolism of lipid droplets are important for the microglial response to extrinsic stimulation. Moreover, we show that triglyceride biosynthesis can modulate the immune and disease-associated responses of microglia harboring the AD-associated APOE4 genotype as well as modulate their surveillance ability in ex vivo mouse brain slices. Taken together, our work demonstrates that modulating triglyceride metabolism could be one approach for targeting neuroinflammation.
RESULTS
Microglia accumulate neutral lipids upon extrinsic immune activation
To understand the mechanisms connecting microglial lipid metabolism and inflammation, we used human iPSC-derived microglia, which allow us to contextualize our findings in the setting of human health and disease. We began our investigations using a well-characterized iPSC cell line with an APOE3 homozygous genotype21 and a normal, stable karyotype (Figure S1A). We derived human iPSCs into microglia30 which were CD11b positive by FACS (Figure S1B), and expressed canonical microglial markers IBA1 and CX3CR1 (Figures 1A and S1C). These cells did not express canonical markers of other brain cell types (Figure S1C).
Figure 1. Neutral lipid homeostasis is affected during microglia activation.

(A) Fluorescence images of APOE3/APOE3 microglia stained with antibodies against IBA1 and CX3CR1. Scale bar, 50 μm.
(B) Fluorescence images of APOE3/APOE3 microglia stained with LipidSPOT. Scale bars, 50 μm. Bottom panels show regions of interest (ROIs) in top panels.
(C) Lipid droplet number per cell, with each dot representing a cell. Triangles depict the average number of lipid droplets in n = 3 microglial derivations, data are represented as mean ± SD. *p ≤ 0.05 by two-tailed unpaired t test.
(D) Differentially expressed genes associated with lipid synthesis and catabolism. Each column is an independent treatment, n = 4.
(E) Spectra of Raman shift of non-nuclear lipids within microglia with and without LPS and DGAT inhibitors. Gray bars: cholesterol ester (CE) and total lipid peaks centered at 2,883 and 2,845 cm −1, saturated triglycerides at 1,440 cm−1, monounsaturated triglycerides (TAGs) at 1,655 cm−1, and phospholipids (PLs) at 760 cm−1. Data are representative of n = 2 independent microglial derivations.
We confirmed that our human iPSC-derived microglia responded to extrinsic immune stimuli. After treatment with LPS, the microglia secreted increased levels of inflammatory cytokines and chemokines into the cell culture media (Figure S1D) and increased their expression of several genes known to be involved in immune activation (Figure S1E). The iPSC-derived microglia exhibited a profound morphological change upon LPS-mediated activation (Figure S1F) as well as increased phagocytosis of fluorescent zymosan-functionalized bioparticles (Figure S1G).
When activated with LPS, iPSC-derived microglia accumulate lipid droplets (Figures 1B and 1C). The activated microglia also displayed an upregulation of genes associated with lipid synthesis and downregulation of genes associated with lipid catabolism (Figure 1D; Table S1) mirroring the accumulation of cellular lipids observed using microscopy. Using Raman imaging microscopy, we observed that LPS treatment induced an increase in total lipids and more specifically in triglycerides, cholesterol esters, and phospholipids, all key components of lipid droplets31 (Figure 1E).
To ensure that these changes to lipid accumulation upon LPS activation occurred independently of the cell’s genetic background and derivation protocol, we generated microglia from another iPSC line, WTC-11 (Figure S1H), using an orthogonal microglial differentiation protocol.32 These cells also expressed canonical microglial markers (Figure S1I). In this second line, LPS-induced activation resulted in increased cellular lipids (Figure S1J), demonstrating that LPS-mediated lipid accumulation is robust across different genetic backgrounds and derivation protocols. We also confirmed that amyloid-beta treatment induced lipid droplet accumulation (Figure S2A), revealing that the effects we observe are not specific to LPS and have relevance to an AD-associated stimuli. Other studies have observed increased levels of microglial lipid droplets in the contexts of aging, disease, and inflammation,16,19,23,26,29 suggesting that lipid accumulation in microglia is a central biological phenomenon and operates in multiple contexts.
Targeting rate-limiting triglyceride biosynthesis enzymes inhibits activation-induced lipid droplet formation
To further understand the functional consequences of lipid accumulation we chose to interrogate whether lipid accumulation was necessary for microglial activation or whether it was an epiphenomenon. Our transcriptomic data revealed that LPS-mediated microglial activation induced changes in multiple fatty acid and triglyceride biosynthesis enzymes. Excess fatty acids are stored in triglyceride-rich lipid droplets, which we observed by microscopy. Therefore, we focused on the triglyceride metabolism pathway and established an experimental paradigm where we first inhibited triglyceride biosynthesis and then stimulated the microglia with LPS prior to downstream assays. We took advantage of well-characterized and highly specific inhibitors of the enzymes DGAT1 and DGAT2 (diacylglycerol acid transferases 1 and 2), which control the rate-limiting step of triglyceride biosynthesis from diacylglycerol and acylated fatty acids (Figure 2A). In our transcriptional data, DGAT2, but not DGAT1, expression increased upon LPS-mediated activation (Figure S2B). The increase in DGAT2 transcription did not clearly impact DGAT2 protein levels probed by western blot (Figure S2C). Although DGAT1 expression did not increase with LPS activation, we chose to inhibit both DGAT enzymes simultaneously to ensure that functional redundancy between the enzymes did not confound our data.33 Upon treatment of iPSC-derived microglia with a combination of DGAT1 and DGAT2 inhibitors (“DGAT inhibitor”), we observed an expected reduction in lipid droplet accumulation even when stimulated with LPS (Figures 2B and 2C). We also confirmed that DGAT inhibitor treatment did not impact cell viability (Figure S2D). We then verified that DGAT inhibition was able to impair lipid droplet accumulation in microglia treated with amyloid-beta (Figures S2E and S2F). This establishes that the mechanisms to target lipid droplets can be applied in an AD context.
Figure 2. DGAT inhibition reduces lipid droplet accumulation during LPS activation.

(A) Schematic showing the enzymes, DGAT1 and DGAT2 that control LD biogenesis in microglia.
(B) Fluorescence images of APOE3/APOE3 microglia with and without LPS activation and DGAT inhibitors stained with LipidSPOT. Scale bars, 50 μm. Bottom panels show ROI in top panels.
(C) Lipid droplet number per cell, with each dot representing an average of at least 6 cells across 3 wells. n ≥ 4 frames per condition. Data are represented as mean ± SD. *p ≤ 0.05, ****p ≤ 0.0001 by two-way ANOVA, with post-hoc Šídák test.
(D) Raman imaging microscopy snapshots of microglia with and without LPS activation and DGAT inhibitors. This diagram depicts peak intensity at 2,845 cm−1, representing total lipid content in n = 2 independent microglial derivations.
(E) Spectra of Raman shift of non-nuclear lipids within iPSC-derived microglia with and without LPS and DGAT inhibitors. The triglyceride peaks in the zoom correspond to saturated triglycerides (1,440 cm−1) and monounsaturated triglycerides (1,655 cm−1). Vehicle and LPS data are reproduced from Figure 1E for clarity.
(F) Expression of DGAT1 and DGAT2 relative to microglia transduced with scrambled shRNA control (scramble shRNA, white; DGAT KD, gray; n = 3 transductions). Data are represented as mean ± SD. *p ≤ 0.05, ***p ≤ 0.001 by two-tailed unpaired t tests.
(G) GFP-positive microglia after transduction of scrambled shRNA control or shRNA targeted against DGAT1 and DGAT2 (DGAT KD). Bottom panels show microglia stained with LipidSPOT. Scale bars, 25 μm.
(H) Lipid droplet number in GFP-positive cells, with each dot representing an average of at least 5 cells. Triangles depict the average number of lipid droplets in n = 3 transductions, data are represented as mean ± SD. *p ≤ 0.05 by two-way ANOVA, with post-hoc Tukey test.
Raman imaging microscopy revealed that treatment with DGAT inhibitors prevented the LPS-associated lipid accumulation into lipid droplets, which resulted in lower total lipids and strong reductions in triglycerides (Figures 2D and 2E). Other key lipid droplet components like phospholipids and cholesterol esters were also reduced by DGAT inhibitor treatment (Figure S2G). From these data, we conclude that inhibiting DGAT1 and DGAT2 has a strong and expected effect on the lipids in lipid droplets.
To establish a complementary approach for targeting the DGAT enzymes, we used lentiviral transduction of shRNA constructs to reduce levels of DGAT1 and DGAT2 genetically (Figure 2F). To confirm that the findings were robust to changes in genetic background and differentiation protocol, we performed these experiments in a different human iPSC line34 (KOLF2.1J, Figure S1H) with a transcription-factor-driven differentiation protocol.32 Microglia transduced with the shRNA-containing lentiviral constructs also co-express GFP to allow us to easily identify transduced cells. In this paradigm, we observed a reduction in microglial LPS-induced lipid accumulation with knockdown of DGAT1 and DGAT2 (Figures 2G and 2H) with minimal cytotoxicity (Figure S2H).
Triglyceride biosynthesis is important for LPS-induced activation of microglia
Following DGAT inhibition, we stimulated the microglia with LPS and profiled their transcriptomes. DGAT inhibition in the context of LPS activation, drove a distinct transcriptional program from DGAT inhibitor treatment alone, which had little effect. We subdivided this transcriptional response into four groups of genes, which respond differently to LPS in the presence and absence of DGAT inhibitors (Figure 3A; Table S2). Most differentially regulated genes belonged to group 1, which contained 223 genes that were upregulated upon LPS treatment but downregulated when treated with both DGAT inhibitor and LPS. The gene ontology terms associated with this downregulation encompassed not only the expected lipid metabolism genes (such as ACSL1, DGAT2, FASN, CREB5, MBOAT7, and AGPAT4) but also many involved in the inflammatory response (IL-6, IL-1b, TNF-a, CXCL5, CXCL8, PTGES, and PTGS2) (Figures 3B and S3A; Table S2). We also observed that DGAT inhibitor treatment prevented the transcriptional upregulation of a targeted panel of cytokine and chemokine genes that were increased in expression upon LPS treatment (Figure 3C). Notably, in the absence of LPS stimulation, microglia treated with DGAT inhibitors showed no significant changes in the expression of inflammatory genes (Figure 3C).
Figure 3. Triglyceride accumulation and lipid droplet biogenesis are necessary for LPS-mediated activation.

(A) Differentially expressed genes for APOE3/APOE3 vehicle and LPS-treated microglia in the presence or absence of DGAT inhibitors. Gene groups are sorted based on the Z scores upon DGAT inhibition in activated microglia. Displayed data are average Z scores across n = 3 treatments.
(B) Top 5 Gene Ontology (GO) functional annotation terms of the differentially expressed genes in group 1 (A) determined using ShinyGO Web application.35 Circle size indicates the number of genes in each GO term. Circle color indicates the false discovery rate-corrected p value.
(C) Gene expression of cytokines (from normalized read counts) relative to average vehicle controls (vehicle, white; DGAT inhibition, gray; LPS, blue; DGAT inhibition + LPS, green; n = 3 treatments). Data are represented as mean ± SD. ns p > 0.05, **p ≤ 0.01, ****p ≤ 0.0001 by two-way ANOVA, with post-hoc Tukey test.
(D) Fluorescence images of microglia, with and without LPS and DGAT inhibitors, immunostained for NF-κB (green) and stained with Hoechst 33258 (magenta), top panel. Dashed lines outline nuclei in the bottom panel. Arrowheads highlight the nuclear NF-κB fluorescence (white) in LPS-treated microglia. Scale bars, 25 μm.
(E) Cumulative frequency distribution of nuclear NF-κB fluorescence. Vehicle, black; LPS, blue; DGAT inhibition, gray; DGAT inhibition + LPS, green.
(F) Fold change (relative to vehicle) of cytokines secreted by LPS-treated APOE3/APOE3 microglia with and without DGAT inhibitors. Data represent 6 technical replicates across n = 3 microglial derivations.
Since we observed the differential regulation of many inflammatory genes, we probed which transcription factors may be responsible for this gene regulation. We applied TRRUST analysis36 to the genes differentially regulated by DGAT inhibition in the context of LPS treatment and prioritized NF-κB as the primary transcription factor involved (Table S2). LPS treatment of iPSC-derived microglia resulted in a robust translocation of NF-κB to the nucleus, whereas LPS treatment in the presence of DGAT inhibitors reduced the number of microglia with nuclear-localized NF-κB (Figures 3D and 3E). We also observed that genetic knockdown of DGAT1 and DGAT2, like the DGAT inhibitor treatment, was able to reduce LPS-induced NF-κB nuclear localization (Figures S3B and S3C). Taken together these findings suggest that DGAT inhibition can act upstream of inflammatory phenotypes like NF-κB translocation.
We then investigated whether transcriptional changes to cytokine and chemokine genes were reflected in changes in protein secretion. When we inhibited triglyceride biosynthesis and then activated the microglia using LPS we noticed decreased levels of secreted cytokines and chemokines in the cell culture medium compared with when microglia were treated with LPS alone (Figure 3F; Table S3). In the absence of LPS activation, DGAT inhibition did not impact the cytokine secretion in microglia (Figure 3F; Table S3). We measured the effects of genetic knockdown of DGAT1 and DGAT2 on LPS-induced cytokine secretion and observed reduced secretion of key LPS-induced cytokines such as IL-6, IL-17, and IL-23 (Figure S3D). Not all cytokines that showed altered transcriptional regulation revealed statistically significant changes in secreted protein levels, although most showed trends toward decreased levels (Table S3). This is likely because secreted protein measurements are inherently more variable than intracellular transcript measurements.
LPS-mediated activation resulted in a change in microglial morphology. DGAT inhibition prevented this change in morphology (Figures S3E and S3F). This phenotype was consistent in microglia derived from iPSCs of another healthy genetic background (Figures S3G, S3H, and S3I). Genetic knockdown of DGATs also had a similar effect on microglial morphology (Figure S3J). Taken together, these data reveal that reduced activity of DGAT enzymes directly impacts the ability of microglia to respond to inflammatory stimuli such as LPS, establishing that optimal DGAT activity is necessary for inflammatory activation of microglia. These findings were reproducible across multiple iPSC lines with different genetic backgrounds21,34 and derived into microglia using distinct differentiation protocols.30,32
Triglyceride biosynthesis is important for LPS-induced microglial phagocytosis
We asked whether inhibition of triglyceride biosynthesis would impact the downstream effects of microglial activation on phagocytosis. Upon LPS-mediated activation, microglia exhibit increased phagocytosis. Microglia that underwent DGAT inhibitor treatment followed by LPS stimulation no longer displayed the LPS-associated increase in phagocytosis of zymosan bioparticles (Figures 4A and 4B). We also observed decreased uptake upon DGAT inhibition (in the context of LPS stimulation) for fluorescent dextrans, which enter via clathrin-mediated pathways (Figures 4C and 4D) and amyloid-beta, the aggregating peptide associated with AD (Figures 4E and 4F). These effects on amyloid-beta phagocytosis displayed a similar trend in microglia derived from iPSCs of a different healthy genetic background (Figures S4A and S4B). Genetic knockdown of DGAT1 and DGAT2 had a similar effect on microglial phagocytosis as the DGAT inhibitors (Figures 4G and 4H). The effects of DGAT inhibition on phagocytosis are consistent across genetic backgrounds of hiPSC-derived microglia,21,34 robust to different differentiation methods,30,32 and reproducible with both genetic and chemical modulators of DGAT1 and DGAT2.
Figure 4. Modulating triglyceride accumulation and lipid droplet biogenesis alters uptake in microglia.

(A) Overlay of phase contrast and fluorescence images of pHrodo Red Zymosan uptake (red) in vehicle- and LPS-treated APOE3/APOE3 microglia in the presence or absence of DGAT inhibitors. Scale bars, 50 μm.
(B) Quantification of pHrodo Red Zymosan fluorescence in (A). Each dot represents an average of at least 45 cells per image. Triangles depict the average uptake hours in vehicle-, LPS-, DGAT inhibitor-, DGAT inhibitor + LPS-treated microglia. n = 3 wells; data are represented as mean ± SD. ns p > 0.05, *p ≤ 0.05, **p ≤ 0.01 by two-way ANOVA, with post-hoc Tukey test.
(C) Fluorescence images of dextran (green) uptake and phalloidin (magenta) in vehicle and LPS-treated APOE3/APOE3 microglia in the presence or absence of DGAT inhibitors. Scale bars, 50 μm. High magnification images (bottom panels) show ROI in top panels.
(D) Quantification of dextran uptake assay (C) relative to vehicle-treated controls. Each dot represents an average of at least 20 cells per image. Triangles depict the average uptake in n = 3 microglial derivations. Data are represented as mean ± SD. ns p > 0.05, *p ≤ 0.05 by two-way ANOVA, with post-hoc Tukey test.
(E) Fluorescence images of amyloid-beta (green) uptake and phalloidin (magenta) in APOE3/APOE3 microglia with and without LPS treatment in the presence or absence of DGAT inhibitors. Scale bars, 50 μm. High-magnification images (bottom panels) show ROI in top panels.
(F) Quantification of amyloid-beta uptake (E) relative to vehicle-treated controls. Each dot represents an average of at least 20 cells per image. Triangles depict the average uptake in n = 4 microglial derivations. Data are represented as mean ± SD. ns p > 0.05, *p ≤ 0.05 by two-way ANOVA, with post-hoc Tukey test.
(G) Fluorescence images of dextran uptake assay in GFP-positive microglia after transduction of scrambled shRNA control or shRNA targeted against DGAT1 and DGAT2 (DGAT KD). Bottom panels show dextran uptake. Dashed lines outline a representative GFP-positive cell. Scale bars, 50 μm.
(H) Quantification of dextran uptake assay (G) relative to scrambled shRNA controls. Each dot represents an average of at least 10 cells per image. Triangles depict the average uptake in n = 3 transductions. Data are represented as mean ± SD. *p ≤ 0.05 by two-way ANOVA, with post-hoc Tukey test.
DGAT inhibition in the presence of LPS resulted in lower expression of FPR1 and FPR2, two genes involved in microglial phagocytosis, when compared with LPS alone (Figure S4C). This finding suggests that the effects of DGAT inhibitor treatment on activation-associated phagocytosis may occur at the transcriptional level. Taken together, this investigation of phagocytosis reveals that inhibition of triglyceride biosynthesis cannot only impact the inflammatory response to LPS but also can modulate cellular uptake of disease-relevant substrates.
Targeting enzymes upstream of triglyceride biosynthesis has similar effects to DGAT1 and DGAT2 inhibition
While we chose to target DGAT1 and DGAT2 due to their rate-limiting roles in triglyceride biosynthesis, we also explored whether inhibition of enzymes further upstream in the triglyceride biosynthesis pathway have similar effects. ACSL1 (acyl-coenzyme A synthase long-chain family member 1) catalyzes the conjugation of a coenzyme A group to fatty acid acyl chains (Figure S4D) to enable the synthesis of many lipid types and has recently been identified as upregulated in the context of AD.19 We observed an upregulation of ACSL1 when treating our healthy microglia with LPS (Figure S4E). Inhibition of ACSL1 reduced the number of cellular lipid droplets in a similar manner to DGAT inhibition (Figures S4F and S4G). Additionally, ACSL1 inhibition had a similar effect to DGAT inhibition on zymosan bioparticle phagocytosis in the context of LPS activation (Figure S4H), suggesting that targeting flux through the lipid droplet synthesis pathway further upstream similarly impacts the microglial response to LPS.
Triglyceride catabolism is important for LPS-mediated activation of microglia
Having established that triglyceride synthesis is necessary for a complete microglial response to LPS, we then asked whether the presence of triglyceride-rich lipid droplets alone was sufficient for activation of microglia. To investigate this further, we used chemical inhibitors of ATGL (adipose triglyceride lipase) and DDHD2 (DDHD domain containing 2), two lipases that catalyze the first step of triglyceride catabolism from lipid droplets (Figure 5A). Upon LPS activation, we found that ATGL but not DDHD2 gene expression was increased, suggesting that ATGL may play a role in microglial activation (Figures 5B and S5A). The increase in ATGL transcription did not clearly impact ATGL protein levels probed by western blot (Figure S5B). Inhibition of either ATGL or DDHD2 resulted in increased lipid droplets in our human iPSC-derived microglia (Figures 5C, 5D, S5C, and S5D) but did not negatively impact cell viability (Figures S5E and S5F). In the absence of LPS treatment, neither ATGL nor DDHD2 inhibition altered secreted cytokine protein levels (Figures 5E and S5G; Table S3), revealing that, although lipid droplets are necessary for activation, they are not sufficient to elicit a strong activation response from microglia. However, when ATGL inhibition was followed by LPS stimulation, we noticed reduced secretion of multiple cytokines compared with LPS treatment alone (Figure 5E; Table S3). This was not the case for DDHD2 inhibition, which had no effect on LPS-induced secretion of cytokines and chemokines (Figure S5G; Table S3). We also observed that ATGL inhibition prevented LPS-induced changes to microglial morphology (Figure S5H). Together, these findings show that triglyceride catabolism via ATGL (but not DDHD2) is important for microglia to fully respond to extrinsic activation. Our findings are in line with those recently reported in mouse primary cultured microglia.37
Figure 5. Utilization of lipid droplets through triglyceride catabolism is essential for LPS-mediated microglial activation.

(A) Schematic of inhibition of lipid droplet catabolism using atglistatin.
(B) Transcript abundance of adipose triglyceride lipase (ATGL) in LPS-treated microglia relative to vehicle-treated controls (vehicle, white; LPS, blue; n = 3 independent treatments). Data are represented as mean ± SD. *p ≤ 0.05 by two-tailed unpaired t test.
(C) Fluorescence images of APOE3/APOE3 microglia treated with vehicle or ATGL inhibitor and stained with LipidSPOT. Bottom panels show ROI in top panels. Scale bars, 50 μm.
(D) Lipid droplet number per cell, quantified across 3 wells with at least 40 cells analyzed per well. n ≥ 6 frames per condition. Data are represented as mean ± SD. **p ≤ 0.01 by two-tailed unpaired t test.
(E) Fold change of cytokines secreted by LPS-treated APOE3/APOE3 microglia with and without DGAT inhibitor treatment. Data represent 6 technical replicates across n = 3 microglial derivations.
(F) Fluorescence images of amyloid-beta (green) uptake and phalloidin (magenta) in vehicle and LPS-treated APOE3/APOE3 microglia in the presence or absence of ATGL inhibitor. High magnification images (bottom panels) show ROI in top panels. Scale bars, 50 μm.
(G) Quantification of amyloid-beta uptake (F) relative to vehicle-treated controls. Each dot represents an average of at least 5 cells per image. Triangles depict the average uptake across n = 3 microglial derivations, data are represented as mean ± SD. ns p > 0.05, *p ≤ 0.05 by two-way ANOVA, with post-hoc Tukey test.
When we probed the effect of the ATGL inhibition on uptake of the disease-associated amyloid-beta peptide, we observed that, like DGAT inhibitor treatment, ATGL inhibition also inhibited the activation-associated uptake of amyloid-beta (Figures 5F and 5G). This finding demonstrates a role for triglyceride catabolism in disease-associated processes. In combination with the DGAT inhibitor data presented earlier, these experiments establish that both the biosynthesis and catabolism of triglyceride-rich lipid droplets are necessary for microglia to fully respond to extrinsic stimuli.
Modulating triglyceride biosynthesis controls the immune state of APOE4 microglia
One of the strongest risk factors for late-onset AD is APOE4. Past work has shown that APOE4 microglia accumulate more lipid droplets than APOE3 microglia, even in the absence of any extrinsic stimuli.24,26 To explore these effects in a controlled manner, we generated microglia from iPSC lines that were isogenic at all loci except APOE, where they were either homozygous for APOE3 or APOE421 (Figures S6A and S6B). We confirmed that APOE4 microglia contained more lipid droplets than their APOE3 counterparts (Figures S6C and S6D). Upon LPS activation, the lipid droplet level of microglia of both APOE genotypes were elevated to similar levels (Figures S6C and S6D).
After finding that inhibition of DGAT1 and DGAT2 could alter LPS-mediated activation in APOE3 microglia, we investigated the consequences of these modulators in APOE4 microglia. We found that DGAT inhibition led to the differential expression of ∼50% more genes in APOE4 microglia than in their APOE3 isogenic counterparts (Figure 6A; Table S4). While DGAT inhibition predictably led to downregulation of mostly genes involved in lipid biosynthesis pathways in APOE3 microglia, DGAT inhibition led to a downregulation of immune pathways in APOE4 microglia (Figure 6B; Table S4). Among the genes upregulated in APOE4 microglia by DGAT inhibition, we found negative regulators of NF-κB-mediated inflammation like PDLIM1,38 suggesting that DGAT inhibitor treatment modulates immune signaling in APOE4 microglia. DGAT inhibition downregulated many cytokine and chemokine genes only in APOE4 microglia (Figure 6C; Table S4), not in APOE3 microglia (Figure S6E; Table S2). In fact, the downregulation of inflammatory cytokines by DGAT inhibition in APOE4 microglia was most like the effects of DGAT inhibition on LPS-stimulated APOE3 microglia (Figure S6E). In line with our transcriptional findings, we also discovered that DGAT inhibition downregulated the secretion of a small subset of inflammatory cytokines in APOE4 microglia (Figure 6D; Table S3), but not in APOE3 microglia (Table S3). These results demonstrate that, even in the absence of any extrinsic stimulation, APOE4 microglia share activation pathways with extrinsically activated APOE3 microglia.
Figure 6. Modulating triglyceride flux controls the immune state of APOE4 microglia.

(A) Venn diagram showing the overlap of the differentially expressed genes upon treatment with DGAT inhibitors in APOE3/APOE3 and APOE4/APOE4 microglia.
(B) Overlap of the GO terms defined by DEGs from the APOE3/APOE3 microglia and APOE4/APOE4 microglia treated with DGAT inhibitors relative to vehicle-treated controls. GO terms were determined using Metascape.39 Bandwidth for each GO term represents its p value calculated based on the cumulative hypergeometric distribution. The scale bar represents −log10 (p value) = 5.
(C) Gene expression levels of cytokines (from normalized read counts) from APOE4/APOE4 microglia relative to average vehicle-treated controls (vehicle, white; LPS, blue; DGAT inhibition, gray; DGAT inhibition + LPS, green. n = 3 treatments). Data are represented as mean ± SD. ns p > 0.05, *p ≤ 0.05, **p ≤ 0.01, ***p ≤ 0.001, ****p ≤ 0.0001 by two-way ANOVA and post-hoc Tukey test.
(D) Fold change (relative to vehicle controls) of cytokines secreted by APOE4/APOE4 microglia treated DGAT inhibitors or vehicle. Data represent 6 technical replicates across n = 3 microglial derivations.
(E) Differential gene expression results for homeostatic and disease-associated microglia marker genes identified across multiple studies. Color indicates log2 fold change of gene expression in DGAT inhibitor-treated APOE4/APOE4 microglia compared with vehicle-treated microglia. Dot size indicates the false discovery rate adjusted p value.
(F) Fluorescence images of microglia in the entorhinal cortex of APOE4 KI:CX3CR1-GFP mice. Vehicle-treated brain slices, top; slices treated with DGAT inhibitors, bottom. Magenta circle represents 70 μm2 area circle surrounding the tip of the pipette. Scale bar, 25 μm.
(G) CX3CR1-GFP fluorescence within the circle over time. APOE4 KI:CX3CR1-GFP vehicle, light red; APOE4 KI:CX3CR1-GFP treated with DGAT inhibitors, dark red; APOE3 KI:CX3CR1-GFP vehicle, blue. n = 5 slices each from a different animal; shaded regions show SEM.
(H) CX3CR1-GFP fluorescence within the circle at indicated time points. APOE4 KI:CX3CR1-GFP vehicle, light red; APOE4 KI:CX3CR1-GFP treated with DGAT inhibitors, dark red; APOE3 KI:CX3CR1-GFP vehicle, blue. Error bars represent SEM. n = 5 mice; *p ≤ 0.05, **p ≤ 0.01 by multiple two-tailed unpaired t tests with post-hoc Holm-Šídá test.
DGAT inhibitor treatment had very similar effects on both LPS-activated APOE4 microglia and LPS-activated APOE3 microglia. Upon DGAT inhibition, LPS-treated APOE4 microglia differentially regulated a similar number of genes as APOE3 microglia (Tables S4 and S5). These genes were involved in similar pathways such as downregulation of immune response and cell migration as in LPS-treated APOE3 microglia (Table S5). This aligns with our observation that LPS stimulation of APOE3 and APOE4 microglia resulted in similar numbers of LDs (Figures S6C and S6D). DGAT inhibition decreased the expression of selected inflammatory genes in LPS-treated APOE4 microglia to a slightly lesser extent than in LPS-treated APOE3 microglia (Figure S6E). In both APOE genotypes, we observed that DGAT inhibition did not alter secreted ApoE levels in the absence of LPS, and that LPS activation displayed a trend toward increased ApoE secretion only in APOE3 microglia (Figures S6F and S6G). Given the strong nature of LPS activation, we suspect that gene expression changes induced by LPS and modulated by DGAT supersede any of those modulated by the APOE genotype.
Given the key role of APOE4 as an AD risk factor, we explored whether modulation of triglyceride biosynthesis impacts disease-associated transcriptional responses characterized in several AD-associated microglial studies.1,3–7 We compiled a list of genes that were differentially regulated across various studies in human and mouse studies3,4,40 and probed them for changes in our dataset. It is important to note that there is ongoing debate on whether disease-associated signatures translate between mouse and human disease models.7 We first examined the transcriptome of APOE3 microglia treated with LPS and noticed that LPS-mediated activation upregulated several disease-associated microglia genes and downregulated several homeostatic microglial genes (Figure S6H; Table S6). In APOE3 microglia, DGAT inhibition renormalizes the transcriptome by upregulating homeostatic genes and downregulating disease-associated genes (Figure S6H; Table S6). In the context of APOE4 microglia, we observed that inhibition of triglyceride biosynthesis, even without any extrinsic stimuli, decreased disease-associated gene expression, and upregulated homeostatic gene expression (Figure 6E; Table S6). Although we observed that disease-associated genes generally were downregulated and homeostatic genes were upregulated, the specific genes that were differentially regulated in the APOE3 and APOE4 microglia were not the same. Our findings suggest that modulation of triglyceride levels impacts the disease-associated states of both LPS-activated APOE3 microglia and basal APOE4 microglia, but in genotype-specific ways.
Modulating triglyceride metabolism alters microglial dynamics ex vivo
When we profiled gene ontology terms associated with differentially expressed genes in APOE4 microglia in the presence and absence of DGAT inhibitors, we noticed multiple genes associated with cell motility (Figure 6B; Tables S4 and S5). Some of these genes are known to bind actin and regulate cytoskeletal morphology (e.g., CAP2, PFN2, FLNC). Therefore, we asked whether DGAT inhibitors impact microglial process dynamics. To explore this phenomenon, we used a human APOE4 knock-in mouse model41 where microglia were labeled with GFP expressed from the endogenous CX3CR1 promoter.42 We imaged the microglial process motility in ex vivo slices in response to an ATP stimulus delivered using a patch pipette. Consistent with earlier work,43 we found that APOE4 microglial processes migrated slower than APOE3 microglial processes (Figures 6G and 6H). Since DGAT inhibition upregulated genes involved in microglial process motility in our human iPSC-derived APOE4 microglia (e.g., GO terms like actin filament-based processes, cell projection organization), we asked whether DGAT inhibitors could alleviate this APOE4-associated defect. We treated brain slices from the humanized APOE4 transgenic mice with DGAT inhibitors for 4 h and observed a reduction in neutral lipid burden by approximately 3-fold in the ex vivo slices (Figure S6I), demonstrating efficacy of DGAT inhibition. We then observed that DGAT inhibition increased the process motility of APOE4 microglia toward the ATP stimulus (Figures 6F–6H), such that most processes reached the pipette tip in 17 min as compared with 29 min in the absence of DGAT inhibitors (Figure 6G). In APOE3 transgenic mice, we observed a modest trend toward increased microglial motility upon DGAT inhibition compared with vehicle treatment (Figures S6J and S6K), but this was not statistically significant. This finding demonstrates that DGAT inhibitors more strongly impact microglial motility in APOE4 mice than APOE3 mice. This finding not only aligns the transcriptional changes observed in our human iPSC-derived microglia with a functional assay but also demonstrates effects of DGAT inhibition in another organism and in the complex environment of brain tissue. Therefore, our results from in vitro iPSC-derived microglia impact functional aspects of microglial surveillance that are important in both healthy and disease contexts.
DISCUSSION
Microglia have emerged as central mediators of neurological disease risk and progression. Many studies have characterized microglial states and their functional consequences.1–8,29 In parallel, glial lipid accumulation has been rediscovered as a pathological hallmark in several neurodegenerative and neurological disorders.14,15,19,29,44–46 Lipid droplets have also emerged as key organelles in the context of the immune response to pathogens, aging, and cancer by both modulation of cellular lipids and proteins.29,47–54 Recent studies have established that the APOE4 AD risk polymorphism is associated with increased lipid accumulation in multiple glial cells including astrocytes, microglia, and oligodendrocytes, and that this lipid accumulation has various cell non-autonomous consequences.18–20,24,26,27
Our work establishes that lipid droplet accumulation is necessary for microglial response to activation. We demonstrated that modulating triglyceride metabolism can modify how and whether a microglial cell responds to external or intrinsic stimuli. Triglyceride synthesis and, to a lesser extent, degradation, are necessary for microglial activation in the context of both APOE3 cells as well as those harboring a risk factor for late-onset AD, APOE4. Inhibiting triglyceride synthesis restores the expression of homeostatic genes in APOE4 microglia and suppresses the upregulation of disease-associated genes, indicating that APOE4 cells have a pathological rewiring of lipid metabolism. This has been suggested in correlative data from other studies that show that APOE4 microglia have both a higher lipid burden and a more “activated” phenotype than APOE3 microglia.19,20,25,26 Changes to triglyceride metabolism can also modulate essential microglial functions like phagocytosis and endocytosis of multiple substrates. We also observed that triglyceride biosynthesis inhibition rescued impaired microglial process motility in an APOE4 humanized mouse model, suggesting that DGAT inhibition has far reaching functional consequences that hold true across organisms and in the context of complex tissue. Therefore, we propose that controlling the triglyceride content and storage in microglial lipid droplets is a promising avenue for controlling their inflammatory signaling and disease-associated functions.
In our study, we used stimulation with LPS to study microglial responses. LPS is traditionally used to mimic exposure to bacteria; however, many of the genes and cytokines upregulated in response to LPS are disease-associated genes in AD models (Figure S6H; Table S6). Additionally, Toll-like receptor 4, which signals LPS-mediated activation, has been shown to be involved in a number of other inflammatory paradigms including neurodegeneration and high-fat diet.55,56 Treatment of microglia with the amyloid-beta peptide also induced lipid accumulation, which was modifiable by DGAT inhibitors (Figures S2E and S2F), suggesting that these lipid pathways are triggered in disease-relevant contexts. By using LPS instead of amyloid-beta to trigger the inflammatory response, we were able to dissect the effects of lipid biology on the inflammatory response and on disease-associated amyloid uptake. Interestingly, another recent study identified DGAT inhibition to alleviate amyloid-beta-induced phagocytosis deficits in mice,16 further supporting that the same pathways we examined may be appropriate for modulating microglial response to not only LPS but other disease-associated stimuli as well.
We wondered whether the mechanism(s) by which controlling triglyceride metabolism impacts microglial response to immune stimuli. Perhaps triglyceride-rich lipid droplets in microglia store precursors for inflammatory lipids, a phenomenon that has been observed in multiple organisms.51,57,58 We observe that the inhibition of triglyceride synthesis in the context of LPS activation results in a transcriptional downregulation of enzymes involved in conversion of fatty acids to prostaglandins (PTGES and PTGS2) (Figure S3A). Another possibility is that changes to triglyceride flux alter the lipid droplet proteome, which could include inflammatory factors, some of which have been observed to be docked at lipid droplets in other cell types (such as IGTP, IIGP1, and IFI47).47,48 We observed that inhibiting triglyceride biosynthesis inhibited translocation of NF-κB translocation, which regulates LPS-induced inflammatory gene expression (Figures 3D, 3E, S3B, and S3C). One possible mechanism for this effect is that DGAT inhibitors lead to an excess of unesterified fatty acids. These could serve as activators for peroxisome proliferator-activated receptors (PPARs) like PPAR-gamma,59 which are known to negatively regulate NF-κB.60 However, it remains unclear whether the inhibition of NF-κB translocation is directly downstream of changes to triglyceride biosynthesis or a secondary consequence of changes in cellular lipids. Neutral lipids in lipid droplets can be broken down to release fatty acid precursors for both inflammatory lipids and cytokine production.61 By inhibiting triglyceride biosynthesis and decreasing fatty acid storage in lipid droplets, we could inhibit a feedforward inflammatory loop that maintains NF-κB nuclear localization by inhibiting the synthesis of cytokines. Future studies will delve into the mechanisms of how triglyceride metabolism pathways control NF-κB and, consequently, inflammation.
The inhibition of triglyceride biosynthesis and catabolism present a potential avenue for modulating disease-associated neuro-inflammation for a variety of neurological conditions. Antisense oligonucleotides against DGAT1 are in clinical trials for non-alcoholic fatty liver disease.62 Inhibition of DGAT enzymes has also been suggested as a therapeutic avenue for indications such as diabetes and glioblastomas.63,64 However, there are many hurdles to overcome before DGAT inhibition becomes a viable therapeutic or preventative option. These include achieving delivery across the blood-brain barrier (a challenge that has promising solutions in antibody-mediated delivery65) and correct dosing to avoid toxicity due to inhibition of the key fat storage functions of DGAT enzymes. This latter challenge could perhaps be overcome by exploiting functional overlap of DGAT1 and DGAT2.
Our work has established a direct relationship between lipid storage and immune activity in microglia. We have shown that this process is hijacked by risk genotypes like APOE4. Our study presents new opportunities for tailoring microglial responses based on tuning their lipid state.
Limitations of the study
We observed heterogeneous responses within our iPSC-derived microglial cultures. Since we performed bulk transcriptomic analysis rather than using single-cell assays, this study does not capture microglial substates that exist within a single culture. Microglial lipid metabolism is governed by both cell-autonomous and cell non-autonomous biology. This study focuses on the cell-autonomous effects of modulating intracellular lipid metabolism but does not address the cell non-autonomous effects of altering lipid metabolism in microglia or in mixed cultures with other brain cell types. Cellular lipid pathways are intimately connected. Although our study focused on modulating enzymes involved in biosynthesis and catabolism of triglycerides in lipid droplets, we do not know whether the effects on inflammation we observe are solely attributable to changes in triglycerides or are the consequences of other lipid changes as well.
RESOURCE AVAILABILITY
Lead contact
Further information and requests for resources and reagents should be directed to and will be fulfilled by the lead contact, Priyanka Narayan (priyanka.narayan@nih.gov).
Materials availability
This study did not generate new unique reagents.
Data and code availability
All raw RNA sequencing files are available at GEO accession number GSE286874.
All code used to process transcriptomic data is available at https://doi.org/10.5281/zenodo.15537579.
STAR★METHODS
EXPERIMENTAL MODEL AND STUDY PARTICIPANT DETAILS
iPSC maintenance
Two sets of isogenic APOE3/APOE3 and APOE4/APOE4 iPSCs (from female parental lines Coriell #AG09173 and #AG10788, obtained via MTA from MIT) were thawed in a 6-well plate coated with hESC-qualified Matrigel Matrix (Corning) in Essential 8 Medium (ThermoFisher Scientific) with 10 μM Y-27632 compound (StemCell Technologies). The media was replaced with Essential 8 Medium the following day and cultured until cells reached ∼90% confluence. Cells were passaged using ReLeSR (StemCell Technologies) for dissociation, as per manufacturer protocols.
Karyotyping
iPSCs were cultured on hESC-qualified Matrigel Matrix-coated T25 cell culture flasks in Essential 8 Medium (ThermoFisher Scientific) until 60% confluence. They were then sent to WiCell Research Institute (Madison, WI) for G-banded karyotyping (20 metaphases equivalent) to ensure that each clone used for differentiations had no clonal abnormalities or chromosomal aberrations.
STEMdiff microglia kit differentiations
iPSC-derived microglia were differentiated using the StemCell Technologies recommended microglial differentiation workflow (unless otherwise noted), which is based on the published protocol for the differentiation process,30 hESC-qualified Matrigel-coated cultureware was used. Briefly, hematopoietic progenitor cells were generated using the STEMdiff Hematopoietic kit (StemCell Technologies). In lieu of half media changes, 1 mL media additions were performed throughout the hematopoietic differentiation protocol. Hematopoietic progenitors were harvested and passaged for microglia differentiation using STEMdiff Microglia Differentiation Kit (StemCell Technologies). Cells were maintained in this media for 24 days, according to manufacturer’s guidelines. For the last 4 days, microglia progenitors were cultured in the STEMdiff Microglia Maturation Kit (StemCell Technologies) medium to mature the microglia. Flow cytometry (CD11+ APC, Miltenyi Biotec) and immunocytochemistry were used to assess purity, as described below.
iTF microglia differentiation
iTF-Microglia were generated based on previously published protocols.32 Parental line WTC-11 (male, UCSF, MTA obtained) and KOLF2.1J iPSCs (male, available through iNDI project from JAX labs, https://www.jax.org/jax-mice-and-services/ipsc) expressing six inducible transcription factors (MAFB, CEBPα, IRF, PU.1, CEBPβ, IRF5) were dissociated using StemPro Accutase (Gibco) and plated in Induction Medium (Essential 8 Medium,10 μM Chroman1, MedChemExpress, and 2 μg/mL Doxycycline hydrochloride, Sigma) at 400,000 cells per well on double-coated [hESC-qualified Matrigel Matrix and Poly-L-Ornithine (Sigma)] 10 cm tissue-culture treated plates. On day 2, the media was replaced with a differentiation media composed of Advanced DMEM/F12 (Thermo Fisher Scientific), 1X GlutaMAX (Thermo Fisher Scientific), 2 μg/mL Doxycycline hydrochloride, 100 ng/mL Human IL-34 (PeproTech) and 10 ng/mL Human GM-CSF (PeproTech). After 2 days, cells were washed with PBS and iTF-Microglia media was added (Advanced DMEM/F12, 1X GlutaMAX, 2 μg/mL Doxycycline hydrochloride, 100 ng/mL Human IL-34, 10 ng/mL Human GM-CSF, 50 ng/mL Human M-CSF (PeproTech), 50 μM Mevalonate (Sigma), 50 ng/mL Human TGFB1 (PeproTech), and 1X Antibiotic-Antimycotic (Gibco).
For dissociation, iTF-Microglia were washed with PBS before adding TrypLE Express (Gibco). After a 10 min incubation at 37°C, cells were diluted 1:3 in Advanced DMEM/F12. iTF-Microglia were pelleted at 220 x g for 5 min before resuspending in iTF-Microglia media.
Mice
APOE3 KI:CX3CR1-GFP and APOE4 KI:CX3CR1-GFP were generated from crossing CX3CR1GFP/GFP (JAX stock No. 005582) with APOE3KI (JAX stock No. 029018) or APOE4KI (JAX stock No. 027894) to generate mice heterozygous for CX3CR1GFP/WT. All animals were housed with littermates and kept on a 12-h light/dark cycle with ad libitum access to chow and water. All studies were carried out following the Guidelines for the Care and Use of Laboratory Animals as adopted by the U.S. National Institute of Health and approved by Georgetown University Animal Care Use Committee, approval protocol 2016–1160.
METHOD DETAILS
Immunocytochemistry
Microglia were fixed with 4% paraformaldehyde (Electron Microscopy Sciences) diluted in PBS for 20 min. After washing with 0.2% Triton X-100 in PBS three times for 5 min each, microglia were blocked with 1% normal donkey serum +5% BSA blocking buffer for one hour at room temperature. Cells were incubated in primary antibodies (prepared in blocking buffer) overnight at 4°C (1:1000 anti-Iba1 (Novus Biologicals), 10 μg/mL anti-CX3CR1 (Abcam)). Microglia were washed with PBS three times, followed by a 1-h incubation in secondary antibody (diluted in blocking buffer, 1:1000, Alexa Fluor 488 donkey anti-goat (Invitrogen), 1:1000 Alexa Fluor 488 donkey anti-rabbit (Invitrogen). Following three washes, images were acquired with a Nikon CSU-W1 Spinning Disk Microscope using Nikon NIS-Elements AR software version 6.10.01.
LPS and amyloid-beta treatment
Microglia were treated with either 5 μg/mL LPS, E. Coli O111:B4 (Millipore Sigma) or 1 μg/mL Beta-Amyloid (AnaSpec) in spent medium for 16 h at 37°C.
Production of Vpx VLPs
Vpx VLPs were created using a modified protocol previously used in Vpx-boosted lentivirus transduction in iPSC-derived microglia.3 In brief, Lenti-XTM 293T cells (Clontech Laboratories #632180) were plated in 10 cm dishes and transfected using jetPRIME (polyplus #101000046) at approximately 80% confluency. Transfection mix (ratio of 10 μL jetPRIMER buffer/1 μg total DNA/2 μL jetPRIME reagent) were incubated for 10 min at room temperature before adding drop-wise to cells. For the production of Vpx VLPs, 5 μg of VSV-G envelope expressing plasmid (pMD2.G, Addgene #12259) and 5 μg of Vpx expressing plasmid (pSIV-D3psi/delta env/delta Vif/delta Vpr, Addgene #132928) were transfected. 48 h after transfection media was collected, centrifuged at 1000 x g for 5 min, and unconcentrated supernatant was aliquoted after passing through a 0.2 μm filter. Aliquots were flash frozen and stored at −80°C until ready to be used at a 10 μL per 10,000 cells ratio previously shown to boost lentiviral transduction in iPSC-derived microglia.3
Lentivirus transduction for DGAT inhibition
shRNA Lentivirus (>108 TU/mL) for Scramble control, and DGAT Knockdown (DGAT1 guides: Catalog numbers: LVS(VB240522-1447awh)-K1, LVS(VB240522-1452chc)-K1, LVS(VB240522-1455hjf)-K1 DGAT2 guides: LVS(VB240522-1455hjf)-K1, LVS(VB24 0522-1461tqd)-K1, LVS(VB240522-1463ykr)-K1) were acquired from VectorBuilder. Guides were mixed at equimolar quantities to create DGAT KD pool.
Lentivirus and Vpx VLPs were added on day 14 of iTF microglia differentiation; iTF-microglia were transduced using scrambled shRNA virus (MOI = 1) or DGAT shRNA guides (MOI = 1) and 10 μL per 10,000 cells of Vpx VLPs. After two days, media was replaced with fresh media (described above - iTF microglia differentiation). Media changes were performed every other day. All lentiviral vectors contained a GFP expression construct so that we could easily identify positively transduced cells in downstream assays. GFP fluorescence was consistently observed 48 h following transduction. On day 23, microglia were treated with vehicle or LPS (as described above - LPS treatment). On day 24, microglia were washed with dPBS, and RNA was prepared following the manufacturer’s guidelines of Cells-to-CT kit (Thermo Fisher Scientific).
Quantitative real-time PCR
RNA extraction was performed using the Cells-to-CT kit (Thermo Fisher Scientific) according to the manufacturer’s protocol. The following TaqMan probes (Thermo Fisher Scientific) were used: PPID (Hs00234593_m1), DGAT1 (Hs01045913_m1), and DGAT2 (Hs00201385_m1). Quantification was done using the 2 −ΔΔCT method. Each biological sample was measured in triplicate, and the average for 3 independent transductions is shown in figures.
Modulating lipid droplet burden
To assess the number of lipid droplets (LD) in microglia, cells were plated in an ibiTreated μ-Plate 96 square well plate (Ibidi) in STEMdiff Microglia Maturation Medium or iTF-Microglia Medium. To decrease LD accumulation, cells were treated for 16 h with a combination of inhibitors of 5 μM PF-04620110 (DGAT1 inhibitor, Sigma) and 5 μM PF-06424439 (DGAT2 inhibitor, Sigma) or 1 μM Triacsin C (ACSL1 inhibitor, Tocris Bio-Techne). To inhibit LD lipase activity, cells were treated with either 1.3 nM KLH45 (DDHD2 inhibitor, Cayman Chemical) or 10 μM Atglistatin (ATGL inhibitor, Sigma) for 6 h.
Lipid droplet staining
Cells were carefully washed with PBS and stained with LipidSpot (Biotium) or LipidTOX (Invitrogen) as per manufacturer’s instructions. Images were acquired with a Nikon CSU-W1 Spinning Disk Microscope using Nikon NIS-Elements AR software version 6.10.01.
Fluorescence-activated cell sorting
To assess purity of STEMdiff microglia, cells were collected and resuspended in maturation media. After counting, STEMdiff microglia were stained with CD11+ APC (Miltenyi Biotec) at a 1:50 concentration in STEMdiff maturation media. Cell sorting was performed on BD FACSAria Fusion cytometer.
To assess lipid droplet accumulation in iTF microglia, cells were washed with PBS and stained with LipidTOX (Invitrogen), as per manufacturer’s instructions. Cells were then detached from the surface of the plate with TrypLE(Gibco) following the manufacturer’s guidelines. After complete detachment, the cell suspension was centrifuged at 220 x g for 5 min. Flow cytometry was performed on a BD LSRFortessa Analyzer to measure the fluorescence intensity of LipidTOX.
Unstained controls were used in all FACS analysis. Gating and analysis were performed using FlowJo version 10.9.0 (FlowJo LLC).
Microglia cell area quantification
Microglia were seeded at a density of 3500 cells per well in ibiTreated μ-Plate 96 square well plates (ibidi). Following treatment with lipid modifiers, cells were fixed (as described above) and then washed with PBS. To identify the total number of cells, microglia nuclei were stained with 1:10,000 Hoechst 33258 (Sigma). Microglia were stained with Alexa Fluor 647 Phalloidin (Invitrogen). Using Nikon NIS-Elements AR software version 6.10.01, the total phalloidin positive area was masked and quantified in each image. That area was divided by the number of nuclei per image to calculate an average cell area to quantitatively characterize the microglia morphology.
Viability assay
To assess the viability of microglia, the Live/Dead Viability/Cytotoxicity Kit, for mammalian cells (Invitrogen) was used, as per manufacturer’s instructions.
ApoE ELISA
ApoE content was measured in cell culture media using a Human Human Apolipoprotein E ELISA Kit (Invitrogen). 100 μL of ApoE standard and culture media were added to anti-human ApoE precoated wells of strip plates. Wells were covered and incubated overnight. The assay was completed as per the manufacturer’s instructions. Total protein in each sample was measured using the Pierce BCA Protein Assay Kit (Thermo Scientific). The plate was evaluated immediately using an EnSpire plate reader (PerkinElmer). Secreted ApoE relative to the total protein was calculated. The displayed data is normalized to vehicle-treated controls.
Western blots
APOE3/APOE3 microglia were washed once with cold 1x PBS and lysed in RIPA lysis buffer (Sigma-Aldrich) containing HALT protease/phosphatase inhibitor cocktail (Thermo Fisher Scientific). Total protein levels were quantified using the Pierce BCA Protein Assay Kit (Thermo Fisher Scientific), and 20 μg of protein was loaded from each sample per lane onto precast 4–12% polyacrylamide gels (Invitrogen). Samples were run at 120V for 90 min using MOPS buffer running buffer (Invitrogen). Proteins were transferred from the gel to 0.2 μm nitrocellulose membranes (Invitrogen) using the i-Blot2 Transfer System (Invitrogen). Membranes were stained with Revert 700 Total Protein Stain (LI-COR Biotech) and subsequently blocked with TBS Intercept Blocking Buffer (LI-COR Biotech) for 1 h before incubating with primary antibodies for DGAT2 (Thermo Fisher Scientific, 1:1000) and ATGL (Abcam, 1:1000). Membranes were incubated with Primaries overnight at 4°C, and the Goat anti Rabbit HRP secondary antibody (AbClonal, 1:10,000) was later incubated at room temperature for 1 h. Washes were performed using 1x TBS with 0.1% Tween 20 buffer (Sigma-Aldrich). Secondary antibody signal was detected by SuperSignal West Pico Chemiluminescence Substrate (Thermo Fisher Scientific) and visualized using the G:BOX Chemi XRQ (Syngene) or the Amersham Imager 680 (Agilent) Systems.
Transcriptomic analysis
Cells were seeded at a density of 5 × 10⁵ cells per well in a tissue culture-treated 12-well plate (NEST). Microglia were treated with LPS, DGAT inhibitors, or DMSO vehicle as described above. Cells were harvested after treatments in 300 μL of TRIzol Reagent (Invitrogen) and RNA was purified using Direct-zol RNA isolation kits (Zymo Research). Illumina library preparation was performed using the Illumina RNA Strand PolyA library kit to prepare paired end dual index libraries. Libraries were sequenced on an Illumina NovaSeq6000 sequencer.
Fastq files were quality inspected using the FastQC (https://www.bioinformatics.babraham.ac.uk) and MultiQC (https://multiqc.info) tools. For reference mapping (hg38) and gene count enumeration, the nf-core RNA-Seq pipeline (v3.10.1) was used (https://nf-co.re/rnaseq) in conjunction with select parameters (–clip_r1 10 –clip_r2 10). Counts produced were imported into R (https://cran.r-project.org/) then within-sample normalized using the “cpm” function. These normalized counts were then pedestalled by 2 and Log2 transformed. Genes not observed to not have a value > 1 for any sample were filter removed with counts for surviving genes cross-sample normalized using the “cyclicloess” procedure available as part of the “normalize-BetweenArrays” function. Post cross-sample normalization, outliers were inspected for and confirmed absent by covariance-based Principal Component Analysis (PCA) scatterplot using the “princomp” function (cor = F) and by correlation-based heatmap using the “cor” and “pheatmap” functions.
To remove noise-biased expression, locally weighted scatterplot smoothing was applied to the cross-sample normalized expression for all genes by sample class (Coefficient of Variation ∼ mean expression) using the “lowess” function. Fits produced per sample class were then over-plotted and inspected using the “plot” function to identify the common low-end cross-sample normalized expression value where the relationship between mean expression (i.e., “signal”) and Coefficient of Variation (i.e., “noise”) grossly deviated from linearity. Cross-sample normalized expression values were then floored to equal this value if less, while expression for genes not observed greater than this value for at least one sample was discarded as noise-biased.
For genes not discarded, expression differences across sample classes were tested for using the one-factor Analysis of Variance (ANOVA) test under Benjamini–Hochberg (BH) False Discovery Rate (FDR) Multiple Comparison Correction (MCC) condition. For ANOVA, the “Anova” function was used. For correction, the “mt.rawp2adjp” function was used. Genes having a corrected p < 0.05 by this test were then subset and the Tukey Honest Significance Difference test used to generate mean differences and p-values for each possible pairwise comparison of sample classes. The function used to do so was “TukeyHSD”. Genes having a post-hoc p < 0.05 for a specific comparison and a linear difference of means ≥ 1.5X for the same comparison were deemed to have expression significantly different between the sample classes compared. Post testing, the union set of differential genes identified across sample comparisons were used to investigate sample-to-sample relationships via the same visuals and functions used to confirm the absence of outliers.
In Figure 1D, the gene expression relative to vehicle-treatment is plotted. Lipid biosynthesis (GO:0008610) and lipid catabolism (GO:0016042) gene ontology terms were filtered based on genes previously shown to shift with the metabolic cell state in APOE4 versus APOE3 microglia.26
Figure 3A shows a heatmap of the z-scores for a list of differentially expressed genes between LPS-treated microglia in the presence or absence of DGAT inhibitors (FDR p < 0.05, Linear Fold Change >1.5.). To determine group identity, the list of genes was subdivided into four groups based on two criteria: 1) on differential expression upon LPS treatment relative to vehicle, and 2) based on the response to LPS treatment in the presence and absence of DGAT inhibitors. Group 1 contains DEGs for which the expression was upregulated by LPS treatment relative to vehicle-treatment, but down-regulated by LPS+DGAT inhibition relative to LPS-treatment. The expression of genes in Group 2 was decreased by LPS treatment (relative to vehicle) and increased in LPS+ DGAT inhibition relative to LPS-treatment. Group 3 gene expression was up-regulated by LPS-treatment relative to vehicle and are further increased by DGAT inhibition in the presence of LPS, relative to LPS alone. The expression of genes in Group 4 was reduced by both LPS-treatment relative to vehicle and by LPS+DGAT inhibition relative to LPS-treatment. The data table is provided in Table S2.
GO enrichment analysis was performed using ShinyGO. Fold enrichment, log10FDR, and number of genes for the top 5 pathways related to microglia function were shown in Figure 3B. Venn diagram in Figure 6A was generated by comparing genes differentially regulated by DGAT inhibitors in both APOE3/APOE3 and APOE4/APOE4 microglia. Only genes present in both datasets were compared. Full datasets are available in Tables S2 and S4. In Figure 6B, Metascape was used to performed GO enrichment analysis. The top 5 gene ontology summary terms are displayed with corresponding enrichment score log10 (p value) and is completely described in Table S5. Full results for Figures 3B and 6B are in Tables S2 and S4, respectively.
To profile disease-associated microglia and homeostatic microglia states (Figures 6E and S6H), a master list of genes from mouse models and human datasets were probed. Master list is included in Table S6.
Raman imaging microscopy
Samples used for Raman spectroscopy were transferred into μ-Dish 35 mm, high Glass Bottom (Ibidi) and cultured with and without LPS and DGAT inhibitor treatments (as described above), fixed with 4% paraformaldehyde in dPBS, and sealed with a round glass coverslip. Raman spectra were acquired using a DXR2xi Raman microscope (ThermoFisher Scientific) with 9.9 mW of 532 nm laser directed at the sample through a 100X oil confocal objective (N.A. = 1.3 a working distance of 0.2 mm UPLanFLN Olympus America Inc.) at 2 s exposure time, through a 50 μm pinhole, for a 0.5 μm pixel size, for the 100 to 3400 cm−1 spectral region. Chemical images were produced by the peak height selection of the assigned peaks using Thermo Fisher Scientific OMNICxi software (ThermoFisher Scientific), using a local selected baseline correction and displayed as a heatmap. Spectra from the non-nucleus areas of 10 × 10 pixels were selected and subsequently background-corrected using the Raman silent region and overlayed in OriginPro 2021b (Origin Lab Corporation).
Detection of NF-κB p65 nuclear localization
For fluorescence detection of NF-κB p65 nuclear localization, microglia were fixed, and the standard immunocytochemistry technique described above was carried out using 1:1000 anti-NF-κB (Cell Signaling Technology) and 1:1000 Alexa Fluor 568 donkey anti-rabbit (Invitrogen). Microglia nuclei were stained with Hoechst 33258. Fluorescence signal was captured using Nikon CSU-W1 Spinning Disk Microscope. Using Nikon Elements GA3 image processing suite, nuclei were segmented and the intensity of nuclear NF-κB p65 within each nuclear area was measured for each group.
Quantification of cytokines and chemokines
Cells were seeded at a density of 500,000 cells per well in a 12-well tissue-culture treated plate. Microglia were treated with LPS, DGAT inhibitors, ATGL inhibitor, DDHD2 inhibitor or DMSO control (as described above). The chemokine concentrations in cell culture media were measured using the 13-plex LEGENDplex Human Inflammation Panel 1 (BioLegend), according to the manufacturer’s instructions. Samples were then run on a LSRFortessa Cell Analyzer (BD Biosciences) until at least 5,000 events had been recorded. Data were analyzed using Qognit Software (BioLegend). The bioactive IL-12p70 was abbreviated as IL-12 in figures. Data is represented as the fold change in concentration of cytokines secreted normalized to vehicle-treated controls, unless otherwise stated. Full data are available in Table S3.
Uptake assays
Microglia were seeded at a density of 3500 cells per well onto fibronectin-coated (StemCell Technologies) 96-well plates (PerkinElmer or Ibidi). To measure the phagocytic ability of microglia, three ligands were profiled: 70,000 MW Dextran (Invitrogen), amyloid-beta-42 labeled with HiLyte Fluor-555 peptide (AnaSpec) and pHrodo Zymosan BioParticles (Invitrogen).
To assess amyloid-beta-42 uptake by microglia-like cells, a 1 mg/mL stock solution of the peptide was prepared following the manufacturer’s guidelines. Microglia were then treated with 1 μg/mL amyloid-beta-42-555 for one hour at 37°C. Cells were then fixed using 4% paraformaldehyde and washed with PBS. For imaging, microglia were stained with Hoechst 33258 and Alexa Fluor 647 Phalloidin. 10 μm image (20 × 0.5 μm thick) z-stacks were captured and analyzed using Nikon NIS-Elements AR to measure the fluorescence intensities of amyloid-beta-42-555 within a cell.
A 25 mg/mL stock solution of 70,000 MW Texas Red-Dextran was prepared according to the manufacturer’s guidelines. The uptake assay described above was repeated with 20 μg/mL Texas Red Dextran to assess endocytosis.
Microglia were stained with 1 μM ViaFlour 488 SE (Biotium) in prewarmed PBS for 10 min at 37°C. After staining with the cytoplasmic dye, the solution was replaced with 1X Live Cell Imaging Solution (Invitrogen). pHrodo Zymosan BioParticles were reconstituted according to manufacturer’s protocols. 20 μg/mL pHrodo Zymosan was prepared in 1X Live Cell Imaging Solution. Cells were then treated with the pHrodo Zymosan solution and imaged over a 24-h period using a Sartorius IncuCyte S3 Live-Cell Imaging System. This time series experiment consisted of four frames per well, with a time interval of one hour between each capture. The fluorescence intensities were analyzed using the Sartorius Analysis System. The amount of Zymosan BioParticles taken up by microglia was calculated using the area of red puncta within cells/the area of cytoplasmic dye.
Acute slice preparation
7–9 months old male mice (n = 5 per genotype) were anesthetized with unmetered isoflurane (Patterson Veterinary) and intracardially perfused with NMDG solution containing N-methyl-D-glucamine (NMDG) 92 mM, KCl 2.5mM, NaHCO3 30 mM, HEPES 20 mM, glucose 25 mM, sucrose 10 mM, ascorbic acid 5 mM, thiourea 2 mM, sodium pyruvate 3mM, N-acetyl-L-cysteine 5 mM, MgSO4 heptahydrate 10 mM, and CaCl2 dihydrate 0.5 mM at pH 7.3–7.4 and osmolarity 300–310 mOsm/Kg. Brains were extracted and sectioned in ice-cold NMDG into 300 mm horizontal slices using the Vibratome 3000 plus Sectioning System. Sections were recovered for 5 min in NMDG at 32°C, followed by 4 h incubation at 32°C in 20 μM PF-04620110 (DGAT1, Sigma) and 20 μM PF-06424439 (DGAT2, Sigma) or DMSO solution in artificial cerebrospinal fluid (aCSF) containing NaCl 120 mM, KCl 3.5 mM, NaH2PO4 1.25 mM, NaHCO3 26 mM, CaCl2 dihydrate 1 mM, MgCl2 7 mM, and dextrose 10 mM at pH 7.3–7.4 and osmolarity 300–310 mOsm/Kg. To limit artifactual microglial activation, all slices were used within 5 h of euthanasia. Recordings of microglia motility were carried out in recording aCSF solution containing NaCl 124 mM, KCl 3.5 mM, NaHCO3 1.2 mM, NaHCO3 26 mM, CaCl2 dihydrate 2 mM, MgCl2 1 mM, dextrose 10 mM at pH 7.3–7.4 and osmolarity 300–310 mOsm/Kg. The recording solution was maintained at pH 7.4 by bubbling with carbogen gas (95% O2/5% CO2, Roberts Oxygen).
Microglial processes motility
Confocal ZT-stacks were taken with a laser scanning microscope system (Thor Imaging System Division) equipped with 488/561/642 nm laser and green/red/far-red filters and mounted on an upright Eclipse FN1 microscope (Nikon Instruments). 154 × 154 × 15mm (xyz) volumes were imaged through 60x water immersion objective (CFI Fluor 60XW, NA = 1.0, WD = 2 mm, Nikon). To avoid artifactual activated microglial from sectioning, imaging depth was kept to 30 mm from the surface of the tissue. Differential interface contrast images were used to confirm the region of interest as the entorhinal cortex.
To study responsive microglia motility, a patch pipette (tip resistance 3–5 mW) containing 1 mM ATP was lowered into the center of the z stack, and ATP was allowed to diffuse into the tissue passively. Microglial processes motility was imaged by taking 1024 × 1024-pixel ZT-stack images from 10 planes 1.5 mm apart every 20 s for 40 min. The control experiment with 0 mM ATP (aCSF only in the pipette) did not elicit directed process movement. When necessary, time lapses were stabilized using the StackReg plugin in ImageJ. To quantify the speed of microglial response to ATP, we defined a 70 μm2 area circle surrounding the tip of the pipette, and the fluorescence of the microglial processes present in the circle was measured over time. The microglial response at any time point was normalized to the time point where the maximum intensity was reached, and any fluorescent signal from the beginning of the timelapse was subtracted.
Imaging of ex vivo brain slices
Following the microglia response to ATP assay, 300 μm acute brain slices were fixed in 4% paraformaldehyde and 4% sucrose for 24 h and subsequently stained with the neutral lipid dye SNCy 5.5 (Tocris 7295) at 4°C overnight. After staining two slices were imaged per condition (vehicle or DGAT inhibitor), each from a different mouse.
All imaging was performed using a Leica SP8 Two Photon DIVE upright microscope (Leica Microsystems, Mannheim, Germany) equipped with a pulsed dual beam Insight X3 Ti-Sapphire laser (MKS Spectra-Physics, Milpitas, CA) and a Leica HC FLUOTAR VISIR 25x/0.95 NA objective. GFP and SNCy 5.5 were imaged sequentially using two-photon excitation wavelengths set to 960 nm and 1045 nm (with powers set to below 8mW as measured at the back aperture of the objective), respectively, and fluorescence emission collected within 500–580 nm and 600–750 nm ranges. All images were captured using tunable Leica HyD detectors in the non-descanned emission pathway, set to a gain of 150%. Z-stacks (approximately 90 μm thick with an interslice step of 568 nm) for each brain slice were imaged with a pixel format of 1024 by 1024 (resulting in pixel sizes in the XY dimension of 200 nm) scanned in the bi-directional scanning. All images were collected using the Leica Application Suite X (version 3.5.7.2) software.
Please provide precise details of all the procedures in the paper (behavioral task, generation of reagents, biological assays, modeling, etc.) such that it is clear how, when, where, and why procedures were performed. We encourage authors to provide information related to the experimental design as suggested by NIH and ARRIVE guidelines (e.g., information about replicates, randomization, blinding, sample size estimation, and the criteria for inclusion and exclusion of any data or subjects).
QUANTIFICATION AND STATISTICAL ANALYSIS
Details of experiments can be found in figure legends. Biological replicates represent independent derivations of microglia or independent genetic knockdown treatments for shRNA experiments. To determine statistical significance, GraphPad Prism 9 software was used to perform two-tailed unpaired t-tests, one-way ANOVA, or two-way ANOVA, with post hoc analysis to correct for multiple comparisons, as indicated in each figure legend. Data are represented as mean ± SD unless otherwise stated; ns p > 0.05; *p ≤ 0.05; **p ≤ 0.01; ***p ≤ 0.001; ****p ≤ 0.0001. FlowJo (version 10.9.0) was used to process fluorescence-activated cell sorting data. Imaging processing was performed using Nikon NIS-Elements AR software version 6.10.01 and Sartorius Analysis System.
Final Venn diagram was generated using the Eulerr.co website (https://eulerr.co/). Hypergeometric tests were performed on the Graeber Lab website (https://systems.crump.ucla.edu/hypergeometric/). Graphs were made using GraphPad Prism v10. Alluvial plots and scatterplots were generated with ggplot2 on R studio.
Supplementary Material
Supplemental information can be found online at https://doi.org/10.1016/j.celrep.2025.115961.
KEY RESOURCES TABLE
| REAGENT or RESOURCE | SOURCE | IDENTIFIER |
|---|---|---|
| Antibodies | ||
| Anti-Iba1 | Novus Biologicals | Cat#100-1028; RRID:AB_3148646 |
| Anti-CX3CR1 | Abcam | Cat#ab8020; RRID:AB_306202 |
| Alexa Fluor 488 donkey anti-goat | Thermo Fisher Scientific | Cat#A11055; RRID:AB_2534102 |
| Alexa Fluor 488 donkey anti-rabbit | Thermo Fisher Scientific | Cat#A31556; RRID:AB_221605 |
| Alexa Fluor 568 donkey anti-rabbit | Thermo Fisher Scientific | Cat#A10042; RRID:AB_2534017 |
| Anti-DGAT2 | Thermo Fisher Scientific | Cat#17100-1-AP; RRID:AB_2918049 |
| Anti-ATGL | Abcam | Cat#ab207799; RRID:AB_2888664 |
| HRP Goat anti Rabbit | AbClonal | Cat#AS014; RRID:AB_2769854 |
| Anti-NF-κB p65 | Cell Signaling Technology | Cat#8242; RRID:AB_10859369 |
| CD11b Antibody, anti-human, APC, REAfinity™ | Miltenyi Biotec | Cat#130-110-612; RRID:AB_2654666 |
|
Bacterial and virus strains | ||
| Lentivirius: DGAT1 shRNA Knockdown Vector #1 | VectorBuilder | LVS(VB240522-1447awh)-K1 |
| Lentivirius: DGAT1 shRNA Knockdown Vector #2 | VectorBuilder | LVS(VB240522-1452chc)-K1 |
| Lentivirius: DGAT1 shRNA Knockdown Vector #3 | VectorBuilder | LVS(VB240522-1455hjf)-K1 |
| Lentivirius: DGAT2 shRNA Knockdown Vector #1 | VectorBuilder | LVS(VB240522-1459hgp)-K1 |
| Lentivirius: DGAT2 shRNA Knockdown Vector #2 | VectorBuilder | LVS(VB240522-1461tqd)-K1 |
| Lentivirius: DGAT2 shRNA Knockdown Vector #3 | VectorBuilder | LVS(VB240522-1463ykr)-K1 |
| Lentivirius: Scramble_shRNA control | VectorBuilder | Made from VB010000-0009mxc |
|
Chemicals, peptides, and recombinant proteins | ||
| PF-06424439 | Sigma-Aldrich | Cat#PZ0233-5MG |
| PF-04620110 | Sigma-Aldrich | Cat#PZ0207-5MG |
| Triacsin C | Tocris, Bio-Techne | Cat#2472 |
| Atglistatin | Sigma-Aldrich | Cat # SML1075-5MG |
| KLH45 | Cayman Chemical | Cat#19889 |
| Recombinant Human GM-CSF | PeproTech | Cat#300-03 |
| Recombinant Human M-CSF | PeproTech | Cat#300-25 |
| Recombinant Human IL-34 | PeproTech | Cat#200-34 |
| Recombinant Human TGF-β1 (HEK293 derived) | PeproTech | Cat#100-21 |
| Recombinant Human Fractalkine (CX3CL1) | PeproTech | Cat#300-31 |
| Beta-Amyloid HiLyte™ Fluor 555, Human | AnaSpec | Cat#AS-60480-01 |
| Beta-Amyloid (1–42) | AnaSpec | Cat#AS-20276 |
| LPS, E. Coli O111:B4 | Sigma-Aldrich | Cat#LPS25 |
|
Critical commercial assays | ||
| LEGENDplex™ Human Inflammation Panel 1 (13-plex) with V-bottom Plate | Biolegend | Cat#740809 |
| SYBR™ GREEN FAST ADVANCED CELLS-TO-CT™ KIT | Thermo Fisher Scientific | Cat#A35380 |
| Human Apolipoprotein E ELISA Kit | Thermo Fisher Scientific | Cat#EHAPOE |
| Pierce BCA Protein Assay Kit | Thermo Fisher Scientific | Cat#23227 |
| LIVE/DEAD™ Viability/Cytotoxicity Kit, for mammalian cells | Thermo Fisher Scientific | Cat#L3224 |
| Direct-zol RNA isolation kits | Zymo Research | Cat#R2052 |
|
Deposited data | ||
| All code used to process transcriptomic data is available. | This paper | Zenodo: |
| RNA sequencing files are available. | This paper | GEO: GSE286874 |
|
Experimental models: Cell lines | ||
| Human: isogenic APOE3/APOE3 and APOE4/APOE4 iPSCs from parental line Coriell #AG09173 | Obtained via MTA from MIT21 | Coriell #AG09173; RRID: CVCL_4L66 |
| Human: isogenic APOE3/APOE3 and APOE4/APOE4 iPSCs from parental line Coriell #AG10788 | Obtained via MTA from MIT21 | Coriell #AG10788; RRID: CVCL_4M37 |
| Human: WTC-11 iPSCs | Obtained via MTA from UCSF32 | Derivative of RRID: CVCL_Y803 |
| Human: KOLF2.1J iPSCs | Gift from William Skarnes, The Jackson Laboratory | Derivative of RRID: CVCL_B5P3 |
| Lenti-XTM 293T cells | Clontech Laboratories | Cat#632180; RRID: CVCL_4401 |
|
Experimental models: Organisms/strains | ||
| Mouse: B6.129P2(Cg)-Cx3cr1tm1Litt/J | The Jackson Laboratory | RRID:IMSR_JAX:005582 |
| MOUSE: B6.CG-APOEEM2(APOE*)ADIUJ/J | The Jackson Laboratory | RRID:IMSR_JAX:029018 |
| Mouse: B6(SJL)-Apoetm1.1(APOE*4)Adiuj/J | The Jackson Laboratory | RRID:IMSR_JAX:027894 |
|
Oligonucleotides | ||
| DGAT1 Taqman Assay | Thermo Fisher Scientific | HS00201385_M1 DGAT1 |
| DGAT2 Taqman Assay | Thermo Fisher Scientific | HS01045913_M1 DGAT2 |
| PPID Taqman Assay | Thermo Fisher Scientific | Hs00234593_m1 PPID |
|
Recombinant DNA | ||
| pMD2.G | Addgene | Plasmid #12259 |
| pSIV-D3psi/delta env/delta Vif/delta Vpr | Addgene66 | Plasmid #132928 |
|
Software and algorithms | ||
| Live-Cell Imaging Analysis software | Sartorius | Version2021C https://www.sartorius.com/en/products/live-cell-imaging-analysis/live-cell-analysis-software |
| Fiji | ImageJ | Schindelin et al. 201267 |
| Nikon NIS-Elements AR software | Nikon | version 6.10.01 https://www.microscope.healthcare.nikon.com/products/software/nis-elements/nis-elements-advanced-research |
| Leica Application Suite X software | Leica | version 3.5.7.2 https://www.leica-microsystems.com/products/microscope-software/p/leica-las-x-ls/ |
| R software | R project | https://cran.r-project.org/ |
| GraphPad Prism software | GraphPad Prism | https://www.graphpad.com/ |
| FlowJo™ | BD Life Sciences | version 10.9.0 https://www.flowjo.com/flowjo/overview |
| ShinyGO | Ge 202035 | https://bioinformatics.sdstate.edu/go/ |
| Metascape | Zhou et al.201939 | https://metascape.org/gp/index.html#/main/step1 |
| FastQC | Babraham Institute | https://www.bioinformatics.babraham.ac.uk |
| MultiQC | Seqera | https://multiqc.info |
| Qognit Software | BioLegend | https://legendplex.qognit.com |
| Eulerr.co | Eulerr | https://eulerr.co/ |
| Hypergeometric test software | Graeber Lab website, UCLA | https://systems.crump.ucla.edu/hypergeometric/ |
| OMNICxi software | Thermo Fisher Scientific | https://www.thermofisher.com/order/catalog/product/INQSOF018 |
|
Other | ||
| ViaFluor® 488 | Biotium | Cat#30086 |
| Alexa Fluor™ Plus 647 Phalloidin | Thermo Fisher Scientific | Cat#A30107 |
| Dextran, Texas Red™, 70,000 MW, Lysine Fixable | Thermo Fisher Scientific | Cat#D1864 |
| pHrodo™ Red Zymosan BioParticles™ Conjugate for Phagocytosis | Thermo Fisher Scientific | Cat#P35364 |
| Biotium LipidSpot™ 488 Lipid Droplet Stain | Biotium | Cat#70065 |
| STEMDIFF™ HEMATOPOIETIC KIT | Stem Cell Technologies | Cat#05310 |
| STEMDIFF™ MICROGLIA DIFFERENTIATION KIT | Stem Cell Technologies | Cat#100-0019 |
| STEMDIFF™ MICROGLIA MATURATION KIT | Stem Cell Technologies | Cat#100-0020 |
| SNCY 5.5 | Tocris, Bio-Techne | Cat#7295 |
| HCS LIPIDTOX™ DEEP RED NEUTRAL LIPID STAIN | Thermo Fisher Scientific | Cat# H34477 |
| REVERT™700 TOTAL PROTEIN STAIN | LI-COR Biotech | Cat#926-11016 |
| Hoechst 33258 | Sigma-Aldrich | Cat#94403 |
Highlights.
Triglyceride biosynthesis is necessary for microglial activation
APOE4 microglia hijack triglyceride biosynthesis yielding chronic activation
Modulating triglycerides decreases inflammation and disease phenotypes
ACKNOWLEDGMENTS
We thank Artur Gevorgyan, Dr. Carla Cuní-López, Dr. Elise Marsan, Dr. Richard Youle, and Dr. Richard Proia for helpful discussions and critical reading of this manuscript; Dr. Erika Lara and Dr. Victor Bass for their help in experimental setups; and Dr. Stefano Vicini for help with the ex vivo data collection. Figures 2A, 5A, and S4D and the graphical abstract were created by BioRender (https://www.biorender.com). This work was funded by the Intramural Research Programs of the National Institute of Diabetes and Digestive and Kidney Diseases 1ZIADK075158 (to R.A.S., L.C., L.G.Y., J.T.R., and P. S.N.), the National Institute of Neurological Disorders and Stroke (to R.A.S., K.J., L.C., L.G.Y., J.T.R., M.E.W., J.G., H.Y.S., and P.S.N.), National Institute on Aging (to D.J.A., A.B., and M.R.C.), National Cancer Institute (to A.L. and M.L.), and the National Eye Institute (to J.G. and H.Y.S.). This work was also supported by the Center for Alzheimer’s Disease and Related Dementias (CARD) at the National Institute of Aging (to P.S.N.), the Chan Zuckerberg Initiative (to P.S.N.), NIH R01 NS100704 (to G.W.R.), and NIH F99/K00 NS134164 (to J.S.). We sincerely thank the NHLBI Flow Cytometry Core (Dr. Pradeep Dagur, Dr. Maria Lopez-Ocasio, Dr. Steve Hockman, and Dr. Wan-Chi Lin) and the NIH Intramural Sequencing Core for their help with flow cytometry and sequencing. The WTC-11 iPSCs were obtained through Dr. Martin Kampmann under MTA from UCSF. The AG09173 and AG10788 iPSC lines and derivatives were obtained from Dr. Li-Huei Tsai under MTA from MIT.
Footnotes
DECLARATION OF INTERESTS
The authors declare no competing interests.
REFERENCES
- 1.Paolicelli RC, Sierra A, Stevens B, Tremblay M-E, Aguzzi A, Ajami B, Amit I, Audinat E, Bechmann I, Bennett M, et al. (2022). Microglia states and nomenclature: A field at its crossroads. Neuron 110, 3458–3483. 10.1016/j.neuron.2022.10.020. [DOI] [PMC free article] [PubMed] [Google Scholar]
- 2.Del-Aguila JL, Li Z, Dube U, Mihindukulasuriya KA, Budde JP, Fernandez MV, Ibanez L, Bradley J, Wang F, Bergmann K, et al. (2019). A single-nuclei RNA sequencing study of Mendelian and sporadic AD in the human brain. Alzheimers Res. Ther 11, 71. 10.1186/s13195-019-0524-x. [DOI] [PMC free article] [PubMed] [Google Scholar]
- 3.Dolan M-J, Therrien M, Jereb S, Kamath T, Gazestani V, Atkeson T, Marsh SE, Goeva A, Lojek NM, Murphy S, et al. (2023). Exposure of iPSC-derived human microglia to brain substrates enables the generation and manipulation of diverse transcriptional states in vitro. Nat. Immunol 24, 1382–1390. 10.1038/s41590-023-01558-2. [DOI] [PMC free article] [PubMed] [Google Scholar]
- 4.Keren-Shaul H, Spinrad A, Weiner A, Matcovitch-Natan O, Dvir-Szternfeld R, Ulland TK, David E, Baruch K, Lara-Astaiso D, Toth B, et al. (2017). A Unique Microglia Type Associated with Restricting Development of Alzheimer’s Disease. Cell 169, 1276–1290.e17, Elsevier. 10.1016/j.cell.2017.05.018. [DOI] [PubMed] [Google Scholar]
- 5.Krasemann S, Madore C, Cialic R, Baufeld C, Calcagno N, El Fatimy R, Beckers L, O’Loughlin E, Xu Y, Fanek Z, et al. (2017). The TREM2-APOE Pathway Drives the Transcriptional Phenotype of Dysfunctional Microglia in Neurodegenerative Diseases. Immunity 47, 566–581.e9. 10.1016/j.immuni.2017.08.008. [DOI] [PMC free article] [PubMed] [Google Scholar]
- 6.Rexach JE, Polioudakis D, Yin A, Swarup V, Chang TS, Nguyen T, Sarkar A, Chen L, Huang J, Lin L-C, et al. (2020). Tau Pathology Drives Dementia Risk-Associated Gene Networks toward Chronic Inflammatory States and Immunosuppression. Cell Rep 33, 10839. 10.1016/j.celrep.2020.108398. [DOI] [PMC free article] [PubMed] [Google Scholar]
- 7.Srinivasan K, Friedman BA, Etxeberria A, Huntley MA, van der Brug MP, Foreman O, Paw JS, Modrusan Z, Beach TG, Serrano GE, and Hansen DV (2020). Alzheimer’s Patient Microglia Exhibit Enhanced Aging and Unique Transcriptional Activation. Cell Rep 31, 107843, ElsevierCompany. 10.1016/j.celrep.2020.107843. [DOI] [PMC free article] [PubMed] [Google Scholar]
- 8.Sun N, Victor MB, Park YP, Xiong X, Scannail AN, Leary N, Prosper S, Viswanathan S, Luna X, Boix CA, et al. (2023). Human microglial state dynamics in Alzheimer’s disease progression. Cell 186, 4386–4403.e29. 10.1016/j.cell.2023.08.037. [DOI] [PMC free article] [PubMed] [Google Scholar]
- 9.Badimon A, Strasburger HJ, Ayata P, Chen X, Nair A, Ikegami A, Hwang P, Chan AT, Graves SM, Uweru JO, et al. (2020). Negative feedback control of neuronal activity by microglia. Nature 586, 417–423. 10.1038/s41586-020-2777-8. [DOI] [PMC free article] [PubMed] [Google Scholar]
- 10.Chen X, Firulyova M, Manis M, Herz J, Smirnov I, Aladyeva E, Wang C, Bao X, Finn MB, Hu H, et al. (2023). Microglia-mediated T cell infiltration drives neurodegeneration in tauopathy. Nature 615, 668–677. 10.1038/s41586-023-05788-0. [DOI] [PMC free article] [PubMed] [Google Scholar]
- 11.Liddelow SA, Guttenplan KA, Clarke LE, Bennett FC, Bohlen CJ, Schirmer L, Bennett ML, Munch AE, Chung WS, Peterson TC, et al. (2017). Neurotoxic reactive astrocytes are induced by activated microglia. Nature 541, 481–487. 10.1038/nature21029. [DOI] [PMC free article] [PubMed] [Google Scholar]
- 12.Penney J, Ralvenius WT, and Tsai LH (2020). Modeling Alzheimer’s disease with iPSC-derived brain cells. Molecular Psychiatry (Springer US). [DOI] [PMC free article] [PubMed] [Google Scholar]
- 13.Bellenguez C, Küçükali F, Jansen IE, Kleineidam L, Moreno-Grau S, Amin N, Naj AC, Campos-Martin R, Grenier-Boley B, Andrade V, et al. (2022). New insights into the genetic etiology of Alzheimer’s disease and related dementias. Nat. Genet 54, 412–436. 10.1038/s41588-022-01024-z. [DOI] [PMC free article] [PubMed] [Google Scholar]
- 14.Alzheimer A (1907). Über eine eigenartige Erkrankung der Hirnrinde (In German, original case report for Alzheimer’s Disease). Allg Z Psych Psych-gerich Med 64, 146–148. [Google Scholar]
- 15.Hamilton LK, Dufresne M, Joppé SE, Petryszyn S, Aumont A, Calon F, Barnabé-Heider F, Furtos A, Parent M, Chaurand P, and Fernandes KJL (2015). Aberrant Lipid Metabolism in the Forebrain Niche Suppresses Adult Neural Stem Cell Proliferation in an Animal Model of Alzheimer’s Disease. Cell Stem Cell 17, 397–411. 10.1016/j.stem.2015.08.001. [DOI] [PubMed] [Google Scholar]
- 16.Prakash P, Manchanda P, Paouri E, Bisht K, Sharma K, Rajpoot J, Wendt V, Hossain A, Wijewardhane PR, Randolph CE, et al. (2025). Amyloid-β induces lipid droplet-mediated microglial dysfunction via the enzyme DGAT2 in Alzheimer’s disease. Immunity 58, 1536–1552.e8. 10.1016/j.immuni.2025.04.029. [DOI] [PMC free article] [PubMed] [Google Scholar]
- 17.Yang LG, March ZM, Stephenson RA, and Narayan PS (2023). Apolipoprotein E in lipid metabolism and neurodegenerative disease. TEM (Trends Endocrinol. Metab.) 34, 430–445. 10.1016/j.tem.2023.05.002. [DOI] [PMC free article] [PubMed] [Google Scholar]
- 18.Farmer BC, Kluemper J, and Johnson LA (2019). Apolipoprotein E4 Alters Astrocyte Fatty Acid Metabolism and Lipid Droplet Formation. Cells 8, 182. 10.3390/cells8020182. [DOI] [PMC free article] [PubMed] [Google Scholar]
- 19.Haney MS, Pálovics R, Munson CN, Long C, Johansson PK, Yip O, Dong W, Rawat E, West E, Schlachetzki JCM, et al. (2024). APOE4/4 is linked to damaging lipid droplets in Alzheimer’s disease microglia. Nature 628, 154–161. 10.1038/s41586-024-07185-7. [DOI] [PMC free article] [PubMed] [Google Scholar]
- 20.Lee S, Devanney NA, Golden LR, Smith CT, Schwarz JL, Walsh AE, Clarke HA, Goulding DS, Allenger EJ, Morillo-Segovia G, et al. (2023). APOE modulates microglial immunometabolism in response to age, amyloid pathology, and inflammatory challenge. Cell Rep 42, 112196. 10.1016/j.celrep.2023.112196. [DOI] [PMC free article] [PubMed] [Google Scholar]
- 21.Lin YT, Seo J, Gao F, Feldman HM, Wen HL, Penney J, Cam HP, Gjoneska E, Raja WK, Cheng J, et al. (2018). APOE4 Causes Widespread Molecular and Cellular Alterations Associated with Alzheimer’s Disease Phenotypes in Human iPSC-Derived Brain Cell Types. Neuron 98, 1141–1154.e7, Elsevier Inc. 10.1016/j.neuron.2018.05.008. [DOI] [PMC free article] [PubMed] [Google Scholar]
- 22.Litvinchuk A, Suh JH, Guo JL, Lin K, Davis SS, Bien-Ly N, Tycksen E, Tabor GT, Remolina Serrano J, Manis M, et al. (2024). Amelioration of Tau and ApoE4-linked glial lipid accumulation and neurodegeneration with an LXR agonist. Neuron 112, 384–403.e8. 10.1016/j.neuron.2023.10.023. [DOI] [PMC free article] [PubMed] [Google Scholar]
- 23.Liu C-C, Wang N, Chen Y, Inoue Y, Shue F, Ren Y, Wang M, Qiao W, Ikezu TC, Li Z, et al. (2023). Cell-autonomous effects of APOE4 in restricting microglial response in brain homeostasis and Alzheimer’s disease. Nat. Immunol 24, 1854–1866. 10.1038/s41590-023-01640-9. [DOI] [PMC free article] [PubMed] [Google Scholar]
- 24.Sienski G, Narayan P, Bonner JM, Kory N, Boland S, Arczewska AA, Ralvenius WT, Akay L, Lockshin E, He L, et al. (2021). APOE4 disrupts intracellular lipid homeostasis in human iPSC-derived glia. Sci. Transl. Med 13, eaaz4564. 10.1126/scitranslmed.aaz4564. [DOI] [PMC free article] [PubMed] [Google Scholar]
- 25.Tcw J, Qian L, Pipalia NH, Chao MJ, Liang SA, Shi Y, Jain BR, Bertelsen SE, Kapoor M, Marcora E, et al. (2022). Cholesterol and matrisome pathways dysregulated in astrocytes and microglia. Cell 185, 2213–2233.e25. 10.1016/j.cell.2022.05.017. [DOI] [PMC free article] [PubMed] [Google Scholar]
- 26.Victor MB, Leary N, Luna X, Meharena HS, Scannail AN, Bozzelli PL, Samaan G, Murdock MH, von Maydell D, Effenberger AH, et al. (2022). Lipid accumulation induced by APOE4 impairs microglial surveillance of neuronal-network activity. Cell Stem Cell 29, 1197–1212.e8. 10.1016/j.stem.2022.07.005. [DOI] [PMC free article] [PubMed] [Google Scholar]
- 27.Blanchard JW, Akay LA, Davila-Velderrain J, von Maydell D, Mathys H, Davidson SM, Effenberger A, Chen CY, Maner-Smith K, Hajjar I, et al. (2022). APOE4 impairs myelination via cholesterol dysregulation in oligodendrocytes. Nature 611, 769–779, Springer US. 10.1038/s41586-022-05439-w. [DOI] [PMC free article] [PubMed] [Google Scholar]
- 28.Yin Z, Rosenzweig N, Kleemann KL, Zhang X, Brandão W, Margeta MA, Schroeder C, Sivanathan KN, Silveira S, Gauthier C, et al. (2023). APOE4 impairs the microglial response in Alzheimer’s disease by inducing TGFβ-mediated checkpoints. Nat. Immunol 24, 1839–1853. 10.1038/s41590-023-01627-6. [DOI] [PMC free article] [PubMed] [Google Scholar]
- 29.Marschallinger J, Iram T, Zardeneta M, Lee SE, Lehallier B, Haney MS, Pluvinage JV, Mathur V, Hahn O, Morgens DW, et al. (2020). Lipid-droplet-accumulating microglia represent a dysfunctional and proinflammatory state in the aging brain. Nat. Neurosci 23, 194–208, Springer US. 10.1038/s41593-019-0566-1. [DOI] [PMC free article] [PubMed] [Google Scholar]
- 30.McQuade A, Coburn M, Tu CH, Hasselmann J, Davtyan H, and Blurton-Jones M (2018). Development and validation of a simplified method to generate human microglia from pluripotent stem cells. Molecular Neurodegeneration. Mol. Neurodegener 13, 67. 10.1186/s13024-018-0297-x. [DOI] [PMC free article] [PubMed] [Google Scholar]
- 31.Olzmann JA, and Carvalho P (2019). Dynamics and functions of lipid droplets. Nat. Rev. Mol. Cell Biol 20, 137–155. 10.1038/s41580-018-0085-z. [DOI] [PMC free article] [PubMed] [Google Scholar]
- 32.Dräger NM, Sattler SM, Huang CT-L, Teter OM, Leng K, Hashemi SH, Hong J, Aviles G, Clelland CD, Zhan L, et al. (2022). A CRISPRi/a platform in human iPSC-derived microglia uncovers regulators of disease states. Nat. Neurosci 25, 1149–1162. 10.1038/s41593-022-01131-4. [DOI] [PMC free article] [PubMed] [Google Scholar]
- 33.Chitraju C, Walther TC, and Farese RVJ (2019). The triglyceride synthesis enzymes DGAT1 and DGAT2 have distinct and overlapping functions in adipocytes. J Lipid Res 60, 1112–1120. 10.1194/jlr.M093112. [DOI] [PMC free article] [PubMed] [Google Scholar]
- 34.Pantazis CB, Yang A, Lara E, McDonough JA, Blauwendraat C, Peng L, Oguro H, Kanaujiya J, Zou J, Sebesta D, et al. (2022). A reference human induced pluripotent stem cell line for large-scale collaborative studies. Cell Stem Cell 29, 1685–1702.e22. 10.1016/j.stem.2022.11.004. [DOI] [PMC free article] [PubMed] [Google Scholar]
- 35.Ge SX, Jung D, and Yao R (2020). ShinyGO: a graphical gene-set enrichment tool for animals and plants. Bioinformatics 36, 2628–2629. 10.1093/bioinformatics/btz931. [DOI] [PMC free article] [PubMed] [Google Scholar]
- 36.Han H, Cho JW, Lee S, Yun A, Kim H, Bae D, Yang S, Kim CY, Lee M, Kim E, et al. (2018). TRRUST v2: an expanded reference data-base of human and mouse transcriptional regulatory interactions. Nucleic Acids Res 46, D380–D386. 10.1093/nar/gkx1013. [DOI] [PMC free article] [PubMed] [Google Scholar]
- 37.Robb JL, Boisjoly F, Machuca-Parra AI, Coursan A, Manceau R, Majeur D, Rodaros D, Bouyakdan K, Greffard K, Bilodeau J-F, et al. (2025). Blockage of ATGL-mediated breakdown of lipid droplets in microglia alleviates neuroinflammatory and behavioural responses to lipopolysaccharides. Brain Behav. Immun 123, 315–333. 10.1016/j.bbi.2024.09.027. [DOI] [PubMed] [Google Scholar]
- 38.Ono R, Kaisho T, and Tanaka T (2015). PDLIM1 inhibits NF-κB-mediated inflammatory signaling by sequestering the p65 subunit of NF-κB in the cytoplasm. Sci. Rep 5, 18327. 10.1038/srep18327. [DOI] [PMC free article] [PubMed] [Google Scholar]
- 39.Zhou Y, Zhou B, Pache L, Chang M, Khodabakhshi AH, Tanaseichuk O, Benner C, and Chanda SK (2019). Metascape provides a biologist-oriented resource for the analysis of systems-level datasets. Nat. Commun 10, 1523. 10.1038/s41467-019-09234-6. [DOI] [PMC free article] [PubMed] [Google Scholar]
- 40.Butovsky O, and Weiner HL (2018). Microglial signatures and their role in health and disease. Nat. Rev. Neurosci 19, 622–635. 10.1038/s41583-018-0057-5. [DOI] [PMC free article] [PubMed] [Google Scholar]
- 41.Foley KE, Hewes AA, Garceau DT, Kotredes KP, Carter GW, Sasner M, and Howell GR (2022). The APOE (ε3/ε4) Genotype Drives Distinct Gene Signatures in the Cortex of Young Mice. Front. Aging Neurosci 14, 838436. 10.3389/fnagi.2022.838436. [DOI] [PMC free article] [PubMed] [Google Scholar]
- 42.Sepulveda-Rodriguez A, Li P, Khan T, Ma JD, Carlone CA, Bozzelli PL, Conant KE, Forcelli PA, and Vicini S (2019). Electroconvulsive Shock Enhances Responsive Motility and Purinergic Currents in Microglia in the Mouse Hippocampus. eneuro 6, ENEURO.0056-19.2019. 10.1523/ENEURO.0056-19.2019. [DOI] [PMC free article] [PubMed] [Google Scholar]
- 43.Sepulveda J, Kim JY, Binder J, Vicini S, and Rebeck GW (2024). APOE4 genotype and aging impair injury-induced microglial behavior in brain slices, including toward Aβ, through P2RY12. Mol. Neurodegener 19, 24. 10.1186/s13024-024-00714-y. [DOI] [PMC free article] [PubMed] [Google Scholar]
- 44.Fanning S, Haque A, Imberdis T, Baru V, Barrasa MI, Nuber S, Termine D, Ramalingam N, Ho GPH, Noble T, et al. (2019). Lipidomic Analysis of α-Synuclein Neurotoxicity Identifies Stearoyl CoA Desaturase as a Target for Parkinson Treatment. Mol Cell 73, 1001–1014.e8. 10.1016/j.molcel.2018.11.028. [DOI] [PMC free article] [PubMed] [Google Scholar]
- 45.Pennetta G, and Welte MA (2018). Emerging links between lipid droplets and motor neuron diseases. Dev. Cell 45, 427–432, Elsevier. 10.1016/j.devcel.2018.05.002. [DOI] [PMC free article] [PubMed] [Google Scholar]
- 46.Ralhan I, Chang C-L, Lippincott-Schwartz J, and Ioannou MS (2021). Lipid droplets in the nervous system. J Cell Biol 220, e202102136. 10.1083/jcb.202102136. [DOI] [PMC free article] [PubMed] [Google Scholar]
- 47.Bersuker K, Peterson CWH, To M, Sahl SJ, Savikhin V, Grossman EA, Nomura DK, and Olzmann JA (2018). A Proximity Labeling Strategy Provides Insights into the Composition and Dynamics of Lipid Droplet Proteomes. Dev. Cell 44, 97–112.e7. 10.1016/j.devcel.2017.11.020. [DOI] [PMC free article] [PubMed] [Google Scholar]
- 48.Bosch M, Sánchez-Álvarez M, Fajardo A, Kapetanovic R, Steiner B, Dutra F, Moreira L, López JA, Campo R, Marí M, et al. (2020). Mammalian lipid droplets are innate immune hubs integrating cell metabolism and host defense. Science 370, eaay8085, American Association for the Advancement of Science. 10.1126/science.aay8085. [DOI] [PubMed] [Google Scholar]
- 49.Monson EA, Crosse KM, Duan M, Chen W, O’Shea RD, Wakim LM, Carr JM, Whelan DR, and Helbig KJ (2021). Intracellular lipid droplet accumulation occurs early following viral infection and is required for an efficient interferon response. Nat. Commun 12, 4303. 10.1038/s41467-021-24632-5. [DOI] [PMC free article] [PubMed] [Google Scholar]
- 50.Taïb B, Aboussalah AM, Moniruzzaman M, Chen S, Haughey NJ, Kim SF, and Ahima RS (2019). Lipid accumulation and oxidation in glioblastoma multiforme. Sci. Rep 9, 19593, Nature Publishing Group UK London. 10.1038/s41598-019-55985-z. [DOI] [PMC free article] [PubMed] [Google Scholar]
- 51.van Dierendonck XAMH, Vrieling F, Smeehuijzen L, Deng L, Boogaard JP, Croes C-A, Temmerman L, Wetzels S, Biessen E, Kersten S, and Stienstra R (2022). Triglyceride breakdown from lipid droplets regulates the inflammatory response in macrophages. Proc. Natl. Acad. Sci 119, e2114739119. 10.1073/pnas.2114739119. [DOI] [PMC free article] [PubMed] [Google Scholar]
- 52.Welte MA (2007). Proteins under new management: lipid droplets deliver. Trends Cell Biol 17, 363–369, Elsevier. 10.1016/j.tcb.2007.06.004. [DOI] [PubMed] [Google Scholar]
- 53.Welte MA (2015). Expanding roles for lipid droplets. Curr. Biol 22, 195–196, Elsevier. 10.1016/j.tem.2011.04.002. [DOI] [PMC free article] [PubMed] [Google Scholar]
- 54.Zadoorian A, Du X, and Yang H (2023). Lipid droplet biogenesis and functions in health and disease. Nat. Rev. Endocrinol 19, 443–459. 10.1038/s41574-023-00845-0. [DOI] [PMC free article] [PubMed] [Google Scholar]
- 55.Calvo-Rodriguez M, García-Rodríguez C, Villalobos C, and Núñez L (2020). Role of Toll Like Receptor 4 in Alzheimer’s Disease. Front. Immunol 11, 1588. 10.3389/fimmu.2020.01588. [DOI] [PMC free article] [PubMed] [Google Scholar]
- 56.Kim K-A, Gu W, Lee I-A, Joh E-H, and Kim D-H (2012). High fat diet-induced gut microbiota exacerbates inflammation and obesity in mice via the TLR4 signaling pathway. PLoS One 7, e47713. 10.1371/journal.pone.0047713. [DOI] [PMC free article] [PubMed] [Google Scholar]
- 57.Giedt MS, Thomalla JM, White RP, Johnson MR, Lai ZW, Tootle TL, and Welte MA (2023). Adipose triglyceride lipase promotes prostaglandin-dependent actin remodeling by regulating substrate release from lipid droplets. Development 150, dev201516. 10.1242/dev.201516. [DOI] [PMC free article] [PubMed] [Google Scholar]
- 58.Schreiber R, and Zechner R (2014). Lipolysis meets inflammation: arachidonic acid mobilization from fat. JLR (J. Lipid Res.) 55, 2447–2449, Elsevier. 10.1194/jlr.C055673. [DOI] [PMC free article] [PubMed] [Google Scholar]
- 59.Kliewer SA, Sundseth SS, Jones SA, Brown PJ, Wisely GB, Koble CS, Devchand P, Wahli W, Willson TM, Lenhard JM, and Lehmann JM (1997). Fatty acids and eicosanoids regulate gene expression through direct interactions with peroxisome proliferator-activated receptors alpha and gamma. Proc. Natl. Acad. Sci. USA 94, 4318–4323. 10.1073/pnas.94.9.4318. [DOI] [PMC free article] [PubMed] [Google Scholar]
- 60.Hou Y, Moreau F, and Chadee K (2012). PPARgamma is an E3 ligase that induces the degradation of NFkappaB/p65. Nat. Commun 3, 1300. 10.1038/ncomms2270. [DOI] [PubMed] [Google Scholar]
- 61.den Brok MH, Raaijmakers TK, Collado-Camps E, and Adema GJ (2018). Lipid Droplets as Immune Modulators in Myeloid Cells. Trends Immunol 39, 380–392. 10.1016/j.it.2018.01.012. [DOI] [PubMed] [Google Scholar]
- 62.Loomba R, Morgan E, Watts L, Xia S, Hannan LA, Geary RS, Baker BF, and Bhanot S (2020). Novel antisense inhibition of diacylglycerol O-acyltransferase 2 for treatment of non-alcoholic fatty liver disease: a multicentre, double-blind, randomised, placebo-controlled phase 2 trial. Lancet Gastroenterol. Hepatol 5, 829–838, Elsevier. 10.1016/S2468-1253(20)30186-2. [DOI] [PubMed] [Google Scholar]
- 63.Cheng X, Geng F, Pan M, Wu X, Zhong Y, Wang C, Tian Z, Cheng C, Zhang R, Puduvalli V, et al. (2020). Targeting DGAT1 Ameliorates Glioblastoma by Increasing Fat Catabolism and Oxidative Stress. Cell Metab 32, 229–242.e8. 10.1016/j.cmet.2020.06.002. [DOI] [PMC free article] [PubMed] [Google Scholar]
- 64.Ferguson D, and Finck BN (2021). Emerging therapeutic approaches for the treatment of NAFLD and type 2 diabetes mellitus. Nat. Rev. Endocrinol 17, 484–495. 10.1038/s41574-021-00507-z. [DOI] [PMC free article] [PubMed] [Google Scholar]
- 65.Barker SJ, Thayer MB, Kim C, Tatarakis D, Simon M, Dial RL, Nilewski L, Wells RC, Zhou Y, Afetian M, et al. (2024;16:eadi2245). Targeting the Transferrin Receptor to Transport Antisense Oligonucleotides Across the Blood-Brain Barrier. Sci. Transl. Med 10.1126/scitranslmed.adi2245. [DOI] [PubMed] [Google Scholar]
- 66.Kim K, Dauphin A, Komurlu S, McCauley SM, Yurkovetskiy L, Carbone C, Diehl WE, Strambio-De-Castillia C, Campbell EM, and Luban J (2019). Cyclophilin A protects HIV-1 from restriction by human TRIM5alpha. Nat. Microbiol 4, 2044–2051. 10.1038/s41564-019-0592-5. [DOI] [PMC free article] [PubMed] [Google Scholar]
- 67.Schindelin J, Arganda-Carreras I, Frise E, Kaynig V, Longair M, Pietzsch T, Preibisch S, Rueden C, Saalfeld S, Schmid B, et al. (2012). Fiji: an open-source platform for biological-image analysis. Nat. Methods 9, 676–682. 10.1038/nmeth.2019. [DOI] [PMC free article] [PubMed] [Google Scholar]
Associated Data
This section collects any data citations, data availability statements, or supplementary materials included in this article.
Supplementary Materials
Data Availability Statement
All raw RNA sequencing files are available at GEO accession number GSE286874.
All code used to process transcriptomic data is available at https://doi.org/10.5281/zenodo.15537579.