

Abstract
Objectives:
Bone scintigraphy is a sensitive imaging method to evaluate patients with suspected osteonecrosis. We assessed the diagnostic performance of combined bone single-photon emission computed tomography/computed tomography (SPECT/CT) (CBS) in patients with known rheumatic disease or other connective tissue disorders and clinical suspicion of osteonecrosis compared to magnetic resonance imaging (MRI).
Methods:
This prospective diagnostic accuracy study included 70 patients with clinical suspicion of osteonecrosis in any bone who underwent a planar triple-phase bone scan along with a regional SPECT/CT (CBS) and regional MRI. MRI was considered the standard for diagnosing the sensitivity, specificity, predictive values, and accuracy of CBS. Cohen’s kappa statistic of the agreement was also calculated.
Results:
The distribution of the patients based on the joint regions suspected to have osteonecrosis is as follows: 21 hip, 43 knee, and six ankle. MRI detected osteonecrosis in 30/70 patients. CBS had a sensitivity of 100% (30/70 were detected) and a specificity of 97% (2/40 were false positive). Overall, there was good agreement between the two scans regarding the diagnosis of osteonecrosis (Cohen’s kappa statistic = 0.94). In addition to the suspected sites, CBS detected osteonecrosis in 19 additional asymptomatic sites in 13 patients.
Conclusion:
The study has demonstrated that CBS, which includes whole-body imaging and SPECT/CT, is highly sensitive in detecting osteonecrosis with accuracy comparable to regional MRI. Its inherent whole-body imaging technique enabled the detection of multifocal osteonecrosis. It can be used as an early investigating modality after routine plain radiography to establish the diagnosis.
Keywords: Magnetic resonance imaging, nontraumatic osteonecrosis, rheumatic and autoimmune diseases, single-photon emission computed tomography/computed tomography, triple-phase bone scan
Introduction
Osteonecrosis is a pathological process in which regional death of the cellular elements of bone, typically in a subchondral location, leads to the trabecular and subchondral collapse of bone with consequent pain, impairment, and long-term joint damage. Symptoms are variable, ranging from no symptoms to severe pain.[1] Osteonecrosis generally tends to occur in middle-aged people. Most cases of osteonecrosis (nearly 90%) are attributed to steroid administration or alcoholism[2] and other causes, including trauma. Patients with autoimmune/inflammatory rheumatic disorders receive long-term and high-dose corticosteroid treatment, an important risk factor leading to osteonecrosis in these patients.[3] The disease process in systemic lupus erythematosus (SLE) and other rheumatologic diseases, such as rheumatoid arthritis (RA), antiphospholipid antibody syndrome, and scleroderma, pose a risk of osteonecrosis.[4,5] In addition, corticosteroids are commonly included in the treatment, further increasing the risk of osteonecrosis development.
Typical sites of osteonecrosis are the femoral head (the most common), the femoral condyles, the proximal tibia, the humeral head, wrist, ankle, the small bones of the hands and feet, the vertebrae, and less commonly, the facial bones. Multifocal involvement is common and more often noted in SLE.[6] Early detection of osteonecrosis provides the opportunity for treatment that could save the bones from collapse and avoid joint replacement surgeries. The initial investigation in patients with suspected osteonecrosis is a plain radiograph of the affected bone. Further imaging investigations include magnetic resonance imaging (MRI), bone scintigraphy, and computed tomography (CT). Three-phase planar bone scintigraphy was commonly used to diagnose osteonecrosis before the advent of MRI. Bone scintigraphy has the capability to scan the whole skeleton; therefore, lesions in multiple sites can be diagnosed.[7,8] MRI is considered the standard of care imaging for suspected osteonecrosis[9,10,11,12,13] and is frequently used because of its high sensitivity over bone scintigraphy.[14,15,16,17,18]
In the last two decades, technological improvements in single-photon emission CT (SPECT) and SPECT/CT have improved the diagnostic accuracy of gamma imaging, including bone scintigraphy.[19,20] CBS is still the investigation of choice in patients with claustrophobia, MRI-incompatible metallic implants, and other causes where MRI cannot be performed due to availability, expense, and patient choice.[21] Although several previous studies have compared the performance of bone SPECT/CT with MRI,[22,23,24,25,26,27] predominantly in posttraumatic etiology, there are few limited prospective studies on nontraumatic etiologies.[28] This prospective study assessed the diagnostic accuracy of combined bone SPECT/CT (CBS) in nontraumatic causes of osteonecrosis with MRI as the reference standard.
Materials and Methods
Study design and study participants
This study was a single-center prospective diagnostic accuracy study. Consecutive autoimmune/inflammatory rheumatic patients with suspicion of osteonecrosis referred to the department of nuclear medicine from May 2016 to March 2018 were enrolled in the study. CBS was the index test, and MRI was the reference standard for detecting osteonecrosis.
The study was approved by the institutional research monitoring committee (PGRMC-15.04.16/13) and the institute ethics committee. (JIP/IEC/2016/27/904).
The inclusion criteria for participation were subjects with rheumatic/connective tissue disorders aged >18 years, with or without a history of steroid, cytotoxic, and immunomodulator drug therapy with clinical suspicion of osteonecrosis such as pain or limp and with absence of prior trauma to the suspected region and a normal radiograph. Subjects with radiologically evident osteonecrosis, subjects with metallic implants incompatible with MRI such as brain clips, cardiac devices, and prostheses, and claustrophobic subjects were excluded from the study. Written informed consent to participate in the study was obtained from the subjects.
The sample size calculated with an expected sensitivity of 70% of CBS and 90% of MRI[14] was found to be 48 osteonecrosis-positive sites (5% precision, 95% confidence level, and 80% power). Osteonecrosis was detected in about 70% of suspected cases that were imaged in our department in the previous 15 months. Hence, 68 patients with suspected osteonecrosis were required to be enrolled in the study, including 48 patients with osteonecrosis. The sample size was calculated using nMaster software. The study design followed STARD2015 guidelines for reporting diagnostic accuracy studies.[29]
Image acquisition
Combined three-phase bone scintigraphy and regional SPECT/CT were performed on Symbia T6 dual-head SPECT/CT (Siemens Healthineers, Germany). After noting the details and history of the participants, a three-phase bone scintigraphy was initially performed with an intravenous injection of 25 mCi (925 MBq) of Tc-99 m methylene diphosphonate (Tc-99 m MDP). The scans were performed on a dual-head gamma camera with a low-energy, high-resolution parallel hole collimator and a 15% energy window around 140 keV. Dynamic images of the affected region were acquired at 2 s per frame for 1 min on a 64 × 64 image matrix. Tissue phase images of the same region were acquired for 2 min on a 128 × 128 matrix, followed by tissue phase images of the whole body to screen for other possible sites of osteonecrosis. Three hours after injection, whole-body and spot images of the affected region were acquired on 256 × 1024 matrix and 256 × 256 matrix, respectively. SPECT/CT of the affected region was acquired over 360 degrees with 60 projections of 20 s each. CT acquisition parameters were 130 kV, 100 mA, pitch of 1, and 512 × 512 matrix using standard filters. SPECT images were reconstructed using Flash 3D (three-dimensional ordered subset expectation maximization [3D OSEM], Siemens Healthineers, Germany). The CT images were reconstructed with reconstruction kernel B60s and 1 mm slice thickness in all three planes. Multiplanar reformatting was performed, and the images were displayed for analysis. Similarly, additional spot images with SPECT/CT were acquired if abnormal uptake was noted on other joint regions on whole-body imaging.
MRI of the same region was performed in the department of radiodiagnosis using a 1.5 T MRI scanner (Siemens Healthcare) on a separate day (within 1 month). The acquired sequences included were Proton Density (PD) Axial and Coronal, Fast Spin Echo (FSE) T2-weighted Sagittal, Spin Echo (SE) T1-weighted Coronal and Axial, VIBE 3D, Short Tau Inversion Recovery (STIR), and Gradient Echo. Coronal, axial, and sagittal sections were acquired as required. Gadolinium contrast was not used.
Image interpretation
CBS images were analyzed by a qualified nuclear medicine physician with 8 years of experience in nuclear medicine reporting and blinded to the MRI findings. The presence of features of osteonecrosis in each of the three phases was noted separately. Image features favoring osteonecrosis were altered tracer flow and/or distribution in the first two phases and altered tracer uptake in the delayed phase. The pattern of photopenia surrounded by increased tracer uptake, especially in the hip joint, was considered positive for osteonecrosis. SPECT/CT images were analyzed separately, and the diagnosis of osteonecrosis was made based on altered bone uptake along with CT features of micro fractures, subchondral cysts, sclerosis, and osteoporosis. The final diagnosis was made qualitatively based on the features of three phases of planar scintigraphy and SPECT/CT images.
A radiologist with 10 years of experience in radiology reporting interpreted MRI images and was blinded to the CBS findings. A single-density band-like lesion with a low-signal-intensity rim surrounding the necrotic area on T1-weighted images, along with a “double-line” sign characterized by a low-signal-intensity outer rim and a high-signal-intensity inner rim on T2-weighted images, is considered diagnostic of the disease.[17,30] MRI was considered positive for osteonecrosis if the abovedescribed features were present.
Statistical analysis
Continuous data were expressed as mean with standard deviation or median with interquartile range. Categorical variables were expressed as proportions. Sensitivity, specificity, predictive values, and accuracy were calculated. The Cohen’s kappa coefficient[31] was calculated to assess the strength of agreement between the index test and the gold standard. Analysis was done using SPSS software edition 19.
Results
Seventy participants with 100 symptomatic joint regions were enrolled in the study. The mean age of the participants was 35.5 years standard deviation (SD-11), and 90% were females. SLE constituted around 54.2% of patients. 80% of the participants were on corticosteroid treatment.
The STARD flow diagram is depicted in Figure 1. The baseline characteristics are depicted in Table 1. Various symptomatic joint region distributions are shown in Table 2.
Figure 1.
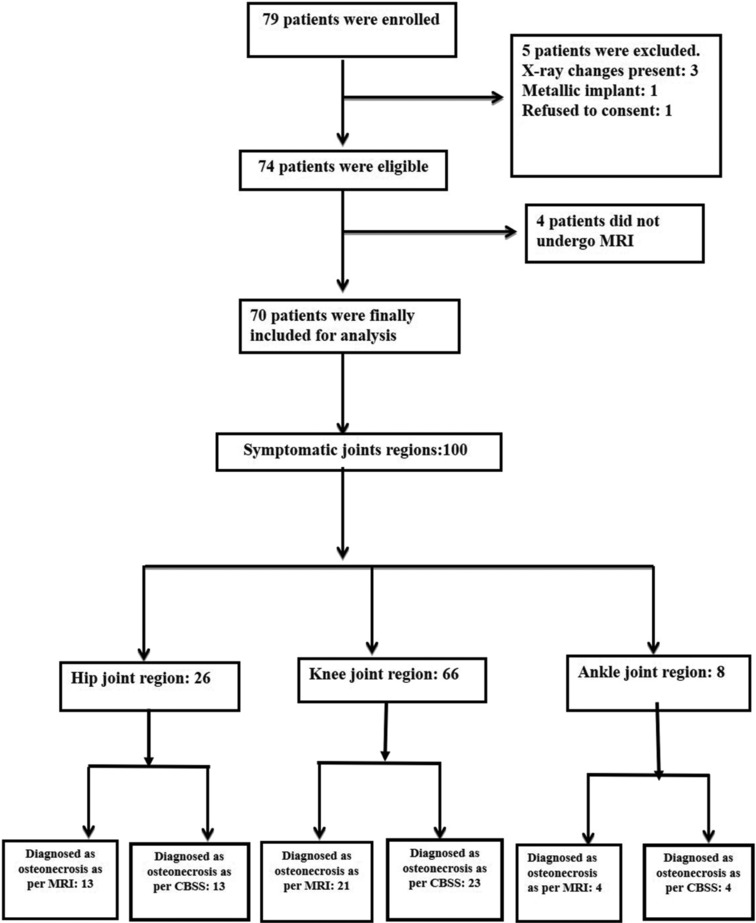
STARD flow diagram
Table 1.
Baseline characteristics
| Characteristics | Value | |
|---|---|---|
| Age (years), mean (SD) | 35.5 (11) | |
| Sex, n (%) | ||
| Male | 7 (10) | |
| Female | 63 (90) | |
| Primary diagnosis | ||
| SLE | 38 | |
| Rheumatoid arthritis | 6 | |
| Primary/secondary antiphospholipid syndrome | 4/1 | |
| Scleroderma | 3 | |
| Antisynthetase syndrome | 2 | |
| Dermatomyositis | 2 | |
| Polymyositis | 2 | |
| JIA/ERA | 2 | |
| UCTD | 2 | |
| Sjogren’s syndrome | 1 | |
| Autoimmune hemolytic anemia | 1 | |
| Epidermolysis bullosa acquisita | 1 | |
| Undifferentiated arthritis | 1 | |
| Neurosarcoidosis | 1 | |
| GPA | 1 | |
| Takayasu arteritis | 1 | |
| Spondyloarthritis | 1 | |
| The median duration of pain in months (IQR) | 2 (1–3) | |
| Number of patients on treatment with steroids (%) | 56 (80) | |
| Median duration in years (IQR) | 2 (2–4) | |
| Number of patients on treatment with cytotoxic drugs (%) | 22 (31.4) | |
| Median duration in years (IQR) | 0.58 (0.25–1) | |
| Number of patients on treatment with immunomodulatory drugs (%) | 35 (50) | |
| Median duration in years (IQR) | 1.3 (0.9–3.2) | |
| Smoking (%) | 3 (4.3) | |
| Alcohol (%) | 3 (4.3) | |
| The median time gap between CBS and MRI in days (IQR) | 19 (13–25) |
SD: Standard deviation, IQR: Interquartile range, SLE: Systemic lupus erythematosus, JIA: Juveline idiopathic arthritis, ERA: Enthesitis-related arthritis, UCTD: Undifferentiated connective tissue disease, GPA: Granulomatosis with polyangiitis, CBS: Combine bone single-photon emission computed tomography/computed tomography, MRI: Magnetic resonance imaging
Table 2.
Proportion of various symptomatic joint regions among 70 patients
| Joint regions | Number | |
|---|---|---|
| Hip (%) | 21 (30) | |
| Bilateral hip | 5 | |
| Right hip | 9 | |
| Left hip | 7 | |
| Knee (%) | 43 (61.4) | |
| Bilateral knee | 23 | |
| Right knee | 9 | |
| Left knee | 11 | |
| Ankle (%) | 6 (8.6) | |
| Bilateral ankle | 2 | |
| Right ankle | 1 | |
| Left ankle | 3 |
Figure 2.

A 30-year-old female with systemic lupus erythematosus on corticosteroids presented with bilateral hip pain. Flow (a) and pool phase (b) images were normal. Bone scan delayed images (c) show increased uptake in bilateral hips with central photopenia, suggesting osteonecrosis. Single-photon emission computed tomography/computed tomography (d) reveals subchondral cysts and sclerosis, consistent with osteonecrosis. Magnetic resonance imaging T2 turbo rapid acquisition (TRA) turbo spin echo (TSE) sequences images (e) confirm geographic T2 hyperintensities, establishing the diagnosis
Figure 3.

An 18-year-old female with systemic lupus erythematosus presented with bilateral knee pain. Perfusion (a) and tissue phase (b) images show mildly increased tracer perfusion and pooling in bilateral knees. Delayed phase (c) images reveal diffuse tracer uptake in the distal femur and proximal tibia, indicating osteonecrosis. Single-photon emission computed tomography/computed tomography (d and e) confirms increased uptake with sclerotic marrow changes. Magnetic resonance imaging T2 repetition time- independent multislice imaging (TRIM) coronal sequences (f) show serpiginous marrow lesions with peripheral hyperintensities, consistent with bone infarcts
MRI diagnosed osteonecrosis in 30 patients in a total of 61 sites. Among them, the proximal femur was involved in 13 (24.5%) participants, distal femur in 18 (28.3%), proximal tibia in 14 (19.8%), patella in 7 (9.4%), distal tibia in 4 (12.2%), talus in 2, calcaneum, navicular bone, and proximal fibula in 1 patient each. The proportion of patients with osteonecrosis in our study population was 42.8%. Various patterns of involvement are summarized in Table 3.
Table 3.
Patterns of involvement by joint regions confirmed by magnetic resonance imaging
| Joint region | Bones involved (n) | Pattern on planar scintigraphy | Pattern on SPECT-CT | Pattern on MRI | ||||
|---|---|---|---|---|---|---|---|---|
| Hip | Proximal femur (13) | Photopenic area with surrounding increased uptake (cold-in-hot) in 10 bones [Figure 2] Only increased uptake (hot-only) in 3 bones |
Photopenia with surrounding increased uptake Diffusely increased uptake Subchondral cysts, fractures, and sclerosis in the head and neck of the femur in the corresponding regions |
On T1 images, a pattern of low signal intensity areas (edema) bordered by a hyperintense line. On T2 images, the inner hyperintense and outer hypointense rim (double line sign) | ||||
| Knee | Distal femur (18) Proximal tibia (14) Proximal fibula (1) Patella (7) |
Increased uptake in condyles of distal femur and tibial plateau in 15 bones Diffuse but less intense uptake in epiphysis extending into metaphysis compared to subchondral bone in 18 bones [Figure 3] Focal uptake |
Increased uptake localization to condyles of distal femur and tibial plateau with subchondral cysts and sclerosis Diffuse uptake in epiphysis and metaphysis; irregular sclerotic marrow in distal femur, proximal tibia, and proximal fibula Accurate localization of tracer uptake to patella; subchondral cystic and sclerotic changes |
On T1 images, a pattern of low signal intensity areas (edema) bordered by a hyperintense line. On T2 images, inner hyperintense and outer hypointense rim (double line sign) Extensive infarcts in epiphysis and adjoining metaphysis Low-intensity lesion surrounded by a serpiginous band of high intensity |
||||
| Ankle | Distal tibia (4) Tarsal bones Talus (2) Calcaneum (1) Navicular (1) |
Diffuse but less intense uptake in metaphysis Focal uptake |
Diffuse uptake in epiphysis and metaphysis; irregular sclerotic marrow Accurate localization of tracer uptake to tarsal bones; subchondral cystic and sclerotic changes |
Extensive infarcts in epiphysis and adjoining metaphysis Low-intensity lesion surrounded by a serpiginous band of high intensity |
SPECT/CT: Single-photon emission computed tomography/computed tomography, MRI: Magnetic resonance imaging
The sensitivity and specificity of CBS in the detection of osteonecrosis were 100 (confidence interval [CI]: 94.3–100) and 97% (CI: 93.4–98.6), respectively. The positive and negative predictive values were 91.30 (CI: 82.7–95.8) and 100%, respectively, whereas accuracy was 96.7% (95.0–99.1). The Cohen’s kappa statistic of agreement between CBS and MRI was 0.94 (95% CI: 0.89–0.98). Features of osteonecrosis were detected in 13 (18.5%) patients in 19 new sites other than the symptomatic ones, which included three proximal femur, six each of distal femur and proximal tibia, and four in distal tibia.
In two participants with symptomatic knee joint pain, features of osteonecrosis were found on CBS, but the MRI was normal (false positive), resulting in a specificity of 97% for CBS.
Discussion
Osteonecrosis is a debilitating condition, and early diagnosis with timely intervention is necessary to prevent disability. Early stages of osteonecrosis are usually not quite evident on radiography. Planar bone scintigraphy can detect osteonecrosis in its early stages. With the introduction of SPECT,[32] the accuracy of diagnosing osteonecrosis improved, but specificity remained low. SPECT/CT is a hybrid imaging technique that has significantly improved the sensitivity and specificity[33] of the bone scan for solitary lesions, and the technical advancement is likely to have a similar impact on the detection of osteonecrosis.
This study included participants with autoimmune inflammatory disorders with or without a history of corticosteroid treatment, immunosuppressive, and immunomodulatory therapy. Such patients are at high risk of osteonecrosis, which increases with a history of corticosteroid treatment. In our study population, 90% of patients diagnosed with osteonecrosis had a corticosteroid treatment history.
The time gap between CBS and MRI was variable (median gap of 19 days). However, all MRI studies were completed within a month of CBS, similar to the protocol followed in a previous study.[28]
In studies performed when SPECT and SPECT/CT were not popular or widely available, the sensitivity of MRI for diagnosing osteonecrosis was found to be 10%–20% higher than bone scintigraphy.[8,15,34] It is because of the poor contrast and limited spatial resolution of two-dimensional three-phase bone scintigraphy. After the advent of SPECT/CT, the diagnostic performance of bone scintigraphy has significantly improved. The sensitivity of CBS in our study is comparable, but the specificity is significantly more than in many previous studies.[22,28,35] The Cohen’s kappa statistic representing the strength of agreement between two diagnostic tests was 0.94 (CI: 0.89–0.98), implying a close agreement between CBS and MRI. It shows that CBS can diagnose osteonecrosis with equal diagnostic accuracy and is considered a viable alternative to MRI.
Osteonecrosis tends to be a multifocal disease. Often, multiple bones are involved, and it is likely helpful if a diagnostic test can identify the involvement of multiple bones in a single sitting. Bone scintigraphy involves routine whole-body imaging and can screen other unsuspected areas for osteonecrosis [Figure 4]. In our study, 19 new sites of osteonecrosis were identified in 13 (18.5%) patients in addition to the clinically involved bones, which is more than previously reported (10.2%).[36] Most of the new sites included the distal femur and proximal tibia (six each), followed by four in the distal tibia and three in the head of the femur.
Figure 4.

A 30-year-old female with systemic lupus erythematosus presented with left ankle pain. Perfusion (a) and tissue phase (b) images show increased flow in the left ankle. Delayed phase (c) images reveal increased uptake in bilateral knees and the left ankle. Single-photon emission computed tomography/computed tomography (d) confirms osteonecrosis in the left distal tibia and knees. Magnetic resonance imaging images, T2W short tau inversion recovery (STIR) (e) and proton density (PD) turbo spin echo (TSE) fat saturation (FS) (f) of the left distal tibia and knee show irregular geographic lesions, consistent with osteonecrosis
In our study, CBS diagnosed all cases of osteonecrosis of the hip, knee, and ankle joint regions, whereas, in two cases of suspected osteonecrosis of the knee, the findings on CBS suggested osteonecrosis, but the MRI was normal. In the first patient, CBS revealed increased tracer uptake in the lateral condyle of the distal femur, and corresponding MRI demonstrated bone marrow edema [Figure 5]. Bone marrow edema is a feature in the early phases of osteonecrosis.[37] It is believed that the early symptoms associated with osteonecrosis are often due to bone marrow edema.[38,39,40,41] It is not known whether the patient developed full-fledged osteonecrosis later. In the second patient, there was an increased uptake in the epiphysis of the tibial plateau, but there was no abnormality on the MRI, which was done 25 days after the bone scintigraphy [Figure 6]. It is possible that the participant had transient osteonecrosis, which has been reported to occur in tibial epiphysis.[42] The present study is the first prospective study that compared combined bone scintigraphy and MRI in nontraumatic osteonecrosis, especially in patients with rheumatic/autoimmune diseases. This study gives a head-to-head comparison between the two best diagnostic modalities available for the evaluation of osteonecrosis. The limitation was that the time gap between MRI and bone scan was variable. Furthermore, three of the 19 additional osteonecrosis sites detected on CBS were not confirmed by MRI. Moreover, clinical follow-up was not performed for patients with additional sites of disease.
Figure 5.

A 33-year-old female with systemic lupus erythematosus on corticosteroids presented with bilateral knee pain. Perfusion (a) and tissue phase (b) images were normal. Delayed phase (c and d) images reveal increased uptake in lateral condyles of both femurs. Single-photon emission computed tomography/computed tomography (e) shows focal tracer uptake in the right lateral femoral condyle (red arrow), indicating osteonecrosis. Magnetic resonance imaging T2 TSE axial images (f) demonstrate subarticular irregularity and bone marrow edema in the right lateral femoral condyle (yellow arrow)
Figure 6.

A 42-year-old female with systemic lupus erythematosus presented with left knee pain. Perfusion (a) and tissue phase (b) images were normal. Delayed phase (c) showed increased tracer uptake in bilateral knees. Single-photon emission computed tomography/computed tomography (d) indicated abnormal uptake in the left tibial condyle (red arrow), suggesting osteonecrosis. Magnetic resonance imaging (MRI) T2 Repetition time- independent multislice imaging (TIRM) coronal sequences (e) performed 25 days later showed normal signal intensity with joint effusion. The discrepancy may reflect transient osteonecrosis, resolving before the MRI
Conclusion
The study demonstrates an excellent diagnostic accuracy of combined bone SPECT/CT (96.7%) and an excellent agreement (Cohen’s kappa 0.94) with MRI in diagnosing nontraumatic osteonecrosis in patients with autoimmune/rheumatic diseases. Whole-body imaging detected additional sites of osteonecrosis and thus can identify asymptomatic sites of involvement. In patients with autoimmune/rheumatic disease having clinical suspicion of osteonecrosis, CBS is an effective alternative to MRI, especially for patients who could not undergo MRI, with good diagnostic performance for regional evaluation and, in addition, offers valuable whole-skeleton screening to detect other asymptomatic sites.
Declaration of patient consent
The authors certify that they have obtained all appropriate patient consent forms. In the form, the patient(s) has/have given his/her/their consent for his/her/their images and other clinical information to be reported in the journal. The patients understand that their names and initials will not be published and due efforts will be made to conceal their identity, but anonymity cannot be guaranteed.
Conflicts of interest
There are no conflicts of interest.
Funding Statement
Nil.
References
- 1.Mankin HJ. Nontraumatic necrosis of bone (osteonecrosis) N Engl J Med. 1992;326:1473–9. doi: 10.1056/NEJM199205283262206. [DOI] [PubMed] [Google Scholar]
- 2.Assouline-Dayan Y, Chang C, Greenspan A, Shoenfeld Y, Gershwin ME. Pathogenesis and natural history of osteonecrosis. Semin Arthritis Rheum. 2002;32:94–124. [PubMed] [Google Scholar]
- 3.Weiner ES, Abeles M. Aseptic necrosis and glucocorticosteroids in systemic lupus erythematosus: A reevaluation. J Rheumatol. 1989;16:604–8. [PubMed] [Google Scholar]
- 4.Gurion R, Tangpricha V, Yow E, Schanberg LE, McComsey GA, Robinson AB, et al. Avascular necrosis in pediatric systemic lupus erythematosus: A brief report and review of the literature. Pediatr Rheumatol Online J. 2015;13:13. doi: 10.1186/s12969-015-0008-x. [DOI] [PMC free article] [PubMed] [Google Scholar]
- 5.Yang Y, Kumar S, Lim LS, Silverman ED, Levy DM. Risk factors for symptomatic avascular necrosis in childhood-onset systemic lupus erythematosus. J Rheumatol. 2015;42:2304–9. doi: 10.3899/jrheum.150464. [DOI] [PubMed] [Google Scholar]
- 6.Gladman DD, Dhillon N, Su J, Urowitz MB. Osteonecrosis in SLE: Prevalence, patterns, outcomes and predictors. Lupus. 2018;27:76–81. doi: 10.1177/0961203317711012. [DOI] [PubMed] [Google Scholar]
- 7.Conklin JJ, Alderson PO, Zizic TM, Hungerford DS, Densereaux JY, Gober A, et al. Comparison of bone scan and radiograph sensitivity in the detection of steroid-induced ischemic necrosis of bone. Radiology. 1983;147:221–6. doi: 10.1148/radiology.147.1.6219425. [DOI] [PubMed] [Google Scholar]
- 8.Sakai T, Sugano N, Nishii T, Haraguchi K, Yoshikawa H, Ohzono K. Bone scintigraphy for osteonecrosis of the knee in patients with non-traumatic osteonecrosis of the femoral head: Comparison with magnetic resonance imaging. Ann Rheum Dis. 2001;60:14–20. doi: 10.1136/ard.60.1.14. [DOI] [PMC free article] [PubMed] [Google Scholar]
- 9.Etienne G, Mont MA, Ragland PS. The diagnosis and treatment of nontraumatic osteonecrosis of the femoral head. Instr Course Lect. 2004;53:67–85. [PubMed] [Google Scholar]
- 10.Amanatullah DF, Strauss EJ, Di Cesare PE. Current management options for osteonecrosis of the femoral head: Part 1, diagnosis and nonoperative management. Am J Orthop (Belle Mead NJ) 2011;40:E186–92. [PubMed] [Google Scholar]
- 11.Chang CC, Greenspan A, Gershwin ME. Osteonecrosis: Current perspectives on pathogenesis and treatment. Semin Arthritis Rheum. 1993;23:47–69. doi: 10.1016/s0049-0172(05)80026-5. [DOI] [PubMed] [Google Scholar]
- 12.Zibis AH, Varitimidis SE, Dailiana ZH, Karantanas AH, Arvanitis DL, Malizos KN. Fast sequences MR imaging at the investigation of painful skeletal sites in patients with hip osteonecrosis. Springerplus. 2015;4:3. doi: 10.1186/2193-1801-4-3. [DOI] [PMC free article] [PubMed] [Google Scholar]
- 13.Hauzeur JP, Pasteels JL, Schoutens A, Hinsenkamp M, Appelboom T, Chochrad I, et al. The diagnostic value of magnetic resonance imaging in non-traumatic osteonecrosis of the femoral head. J Bone Joint Surg Am. 1989;71:641–9. [PubMed] [Google Scholar]
- 14.Mont MA, Ulrich SD, Seyler TM, Smith JM, Marker DR, McGrath MS, et al. Bone scanning of limited value for diagnosis of symptomatic oligofocal and multifocal osteonecrosis. J Rheumatol. 2008;35:1629–34. [PubMed] [Google Scholar]
- 15.Markisz JA, Knowles RJ, Altchek DW, Schneider R, Whalen JP, Cahill PT. Segmental patterns of avascular necrosis of the femoral heads: Early detection with MR imaging. Radiology. 1987;162:717–20. doi: 10.1148/radiology.162.3.3809485. [DOI] [PubMed] [Google Scholar]
- 16.Steinberg ME. Early diagnosis of avascular necrosis of the femoral head. Instr Course Lect. 1988;37:51–7. [PubMed] [Google Scholar]
- 17.Mitchell DG, Rao VM, Dalinka MK, Spritzer CE, Alavi A, Steinberg ME, et al. Femoral head avascular necrosis: Correlation of MR imaging, radiographic staging, radionuclide imaging, and clinical findings. Radiology. 1987;162:709–15. doi: 10.1148/radiology.162.3.3809484. [DOI] [PubMed] [Google Scholar]
- 18.Steinberg DR, Steinberg ME. The university of Pennsylvania classification of osteonecrosis. In: Koo KH, Mont MA, Jones LC, editors. Osteonecrosis. Heidelberg: Springer; 2014. pp. 201–6. [Google Scholar]
- 19.Utsunomiya D, Shiraishi S, Imuta M, Tomiguchi S, Kawanaka K, Morishita S, et al. Added value of SPECT/CT fusion in assessing suspected bone metastasis: Comparison with scintigraphy alone and nonfused scintigraphy and CT. Radiology. 2006;238:264–71. doi: 10.1148/radiol.2373041358. [DOI] [PubMed] [Google Scholar]
- 20.Manaster BJ. From the RSNA refresher courses. Radiological Society of North America. Adult chronic hip pain: Radiographic evaluation. Radiographics. 2000;20:S3–25. doi: 10.1148/radiographics.20.suppl_1.g00oc06s3. Spec No. [DOI] [PubMed] [Google Scholar]
- 21.Iqbal B, Currie G. Value of SPECT/CT in the diagnosis of avascular necrosis of the head of femur: A meta-analysis. Radiography (Lond) 2022;28:560–4. doi: 10.1016/j.radi.2021.11.012. [DOI] [PubMed] [Google Scholar]
- 22.Agarwal KK, Mukherjee A, Sharma P, Bal C, Kumar R. Incremental value of 99mTc-MDP hybrid SPECT/CT over planar scintigraphy and SPECT in avascular necrosis of the femoral head. Nucl Med Commun. 2015;36:1055–62. doi: 10.1097/MNM.0000000000000357. [DOI] [PubMed] [Google Scholar]
- 23.Diederichs G, Hoppe P, Collettini F, Wassilew G, Hamm B, Brenner W, et al. Evaluation of bone viability in patients after girdlestone arthroplasty: Comparison of bone SPECT/CT and MRI. Skeletal Radiol. 2017;46:1249–58. doi: 10.1007/s00256-017-2692-8. [DOI] [PubMed] [Google Scholar]
- 24.Park SJ, Ko BS, Moon KH, Lee M. Prediction Value of SPECT/CT in Avascular Necrosis of Femoral Head After Femur Neck Fracture. Geriatric Orthopaedic Surgery & Rehabilitation. 2019:10. doi: 10.1177/2151459319872943. [DOI] [PMC free article] [PubMed] [Google Scholar]
- 25.Ryoo HG, Lee WW, Kim JY, Kong E, Choi WH, Yoon JK, et al. Minimum standardized uptake value from quantitative bone single-photon emission computed tomography/computed tomography for evaluation of femoral head viability in patients with femoral neck fracture. Nucl Med Mol Imaging. 2019;53:287–95. doi: 10.1007/s13139-019-00600-2. [DOI] [PMC free article] [PubMed] [Google Scholar]
- 26.Yoon JY, Lee SJ, Yoon KS, Yoon PW. The diagnostic value of SPECT/CT in predicting the occurrence of osteonecrosis following femoral neck fracture: A prospective cohort study. BMC Musculoskelet Disord. 2020;21:517. doi: 10.1186/s12891-020-03538-1. [DOI] [PMC free article] [PubMed] [Google Scholar]
- 27.Ng FH, Lai TK, Lam SY, Pan NY, Luk WH. Hybrid magnetic resonance imaging with single photon emission computed tomography/computed tomography bone scan for diagnosis of avascular necrosis of femoral head. J Clin Imaging Sci. 2021;11:2. doi: 10.25259/JCIS_205_2020. [DOI] [PMC free article] [PubMed] [Google Scholar]
- 28.Ryu JS, Kim JS, Moon DH, Kim SM, Shin MJ, Chang JS, et al. Bone SPECT is more sensitive than MRI in the detection of early osteonecrosis of the femoral head after renal transplantation. J Nucl Med. 2002;43:1006–11. [PubMed] [Google Scholar]
- 29.Cohen JF, Korevaar DA, Altman DG, Bruns DE, Gatsonis CA, Hooft L, et al. STARD 2015 guidelines for reporting diagnostic accuracy studies: Explanation and elaboration. BMJ Open. 2016;6:e012799. doi: 10.1136/bmjopen-2016-012799. [DOI] [PMC free article] [PubMed] [Google Scholar]
- 30.Malizos KN, Karantanas AH, Varitimidis SE, Dailiana ZH, Bargiotas K, Maris T. Osteonecrosis of the femoral head: Etiology, imaging and treatment. Eur J Radiol. 2007;63:16–28. doi: 10.1016/j.ejrad.2007.03.019. [DOI] [PubMed] [Google Scholar]
- 31.Chmura Kraemer H, Periyakoil VS, Noda A. Kappa coefficients in medical research. Stat Med. 2002;21:2109–29. doi: 10.1002/sim.1180. [DOI] [PubMed] [Google Scholar]
- 32.Collier BD, Carrera GF, Johnson RP, Isitman AT, Hellman RS, Knobel J, et al. Detection of femoral head avascular necrosis in adults by SPECT. J Nucl Med. 1985;26:979–87. [PubMed] [Google Scholar]
- 33.Iqbal B, Currie GM, Wheat JM, Raza H, Kiat H. The incremental value of SPECT/CT in characterizing solitary spine lesions. J Nucl Med Technol. 2011;39:201–7. doi: 10.2967/jnmt.111.088351. [DOI] [PubMed] [Google Scholar]
- 34.Kokubo T, Takatori Y, Ninomiya S, Nakamura T, Kamogawa M. Magnetic resonance imaging and scintigraphy of avascular necrosis of the femoral head. Prediction of subsequent segmental collapse. Clin Orthop Relat Res. 1992;(277):54–60. [PubMed] [Google Scholar]
- 35.Luk WH, Au-Yeung AW, Yang MK. Diagnostic value of SPECT versus SPECT/CT in femoral avascular necrosis: Preliminary results. Nucl Med Commun. 2010;31:958–61. doi: 10.1097/MNM.0b013e32833e7732. [DOI] [PubMed] [Google Scholar]
- 36.An YS, Park S, Jung JY, Suh CH, Kim HA. Clinical characteristics and role of whole-body bone scan in multifocal osteonecrosis. BMC Musculoskelet Disord. 2019;20:23. doi: 10.1186/s12891-019-2401-y. [DOI] [PMC free article] [PubMed] [Google Scholar]
- 37.Alavi A, McCloskey JR, Steinberg ME. Early detction of avascular necrosis of the femoral head by 99m technetium diphosphonate bone scan: a preliminary report. Clin Orthop Relat Res. 1977;(127):137–41. [PubMed] [Google Scholar]
- 38.Starr AM, Wessely MA, Albastaki U, Pierre-Jerome C, Kettner NW. Bone marrow edema: Pathophysiology, differential diagnosis, and imaging. Acta Radiol. 2008;49:771–86. doi: 10.1080/02841850802161023. [DOI] [PubMed] [Google Scholar]
- 39.Hofmann S. The painful bone marrow edema syndrome of the hip joint. Wien Klin Wochenschr. 2005;117:111–20. doi: 10.1007/s00508-005-0322-2. [DOI] [PubMed] [Google Scholar]
- 40.Sokoloff RM, Farooki S, Resnick D. Spontaneous osteonecrosis of the knee associated with ipsilateral tibial plateau stress fracture: Report of two patients and review of the literature. Skeletal Radiol. 2001;30:53–6. doi: 10.1007/s002560000290. [DOI] [PubMed] [Google Scholar]
- 41.Watson RM, Roach NA, Dalinka MK. Avascular necrosis and bone marrow edema syndrome. Radiol Clin North Am. 2004;42:207–19. doi: 10.1016/S0033-8389(03)00166-0. [DOI] [PubMed] [Google Scholar]
- 42.Gil HC, Levine SM, Zoga AC. MRI findings in the subchondral bone marrow: A discussion of conditions including transient osteoporosis, transient bone marrow edema syndrome, SONK, and shifting bone marrow edema of the knee. Semin Musculoskelet Radiol. 2006;10:177–86. doi: 10.1055/s-2006-957171. [DOI] [PubMed] [Google Scholar]