

Abstract
Green fluorescent protein (GFP) has gained widespread use as a tool to visualize spatial and temporal patterns of gene expression in vivo. However, it is not generally accepted that GFP can also be used as a quantitative reporter of gene expression. We report that GFP is a reliable reporter of gene expression in individual eukaryotic cells when fluorescence is measured by flow cytometry. Two pieces of evidence that support this conclusion are that 1. GFP fluorescence increases in direct proportion to the GFP gene copy number delivered to cells by a replication-defective adenovirus vector, Ad.CMV-GFP, and that 2. the intensity of GFP fluorescence is directly proportional to GFP mRNA abundance in cells. This conclusion is further supported by the fact that the induction of GFP gene expression from two inducible promoters (i.e., the TRE and ICP0 promoters) is readily detected by flow cytometric measurement of GFP fluorescent intensity. Collectively, the results presented herein indicate that GFP fluorescence is a reliable and quantitative reporter of underlying differences in gene expression.
INTRODUCTION
The genes that encode chloramphenicol acetyltransferase (CAT; 17), β-galactosidase (β-gal; 26, 39), firefly luciferase (36, 38), and Renilla luciferase (33, 45) have been used extensively as quantitative reporters of viral and cellular promoter activity. Relative to Northern or Western blot analysis of mRNA and protein synthesis from native genes, promoter-reporter genes provide a more efficient means to study the regulation of gene expression from a specific promoter. However, these conventional reporter genes share two disadvantages. First, most reporter assays provide a measure of average promoter activity over the entire cell population sampled, but provide no measure of the variation in promoter activity that exists between individual cells in the population. In the case of β-gal, it is technically possible to overcome this limitation using a fluorescent substrate and flow cytometry (37), but this approach is not widely used. The second limitation of conventional reporter genes is that kinetic analysis of promoter activity quickly becomes unmanageable because there is no way to monitor gene expression over time without harvesting the full complement of replicate samples at each time point. For example, if the effect of eight treatments on luciferase expression from a viral promoter were to be monitored at 6, 12, 18, 24, 30, and 36 h after introducing a reporter gene into cells, this experiment would require 144 test cultures (assuming n=3 replicates per group), as well as an additional 10 to 20 controls.
Since the cloning and enhancement of the green fluorescent protein (GFP) derived from the jellyfish Aequorea victoria (4, 7, 9, 27–29, 41, 46), GFP has been widely used as a reporter gene. In particular, GFP has been used extensively to visualize spatial and temporal patterns of gene expression in vivo (8, 24, 30) and to study intracellular patterns of protein localization and trafficking (1, 5, 13, 34, 35, 42). Despite the power of this fluorescent reporter protein, it is not generally accepted that GFP can be used as a quantitative reporter of promoter activity. If GFP were in fact a quantitative reporter of promoter activity, GFP fluorescence could be measured in individual eukaryotic cells by flow cytometry. Thus, GFP expression could be simultaneously analyzed in a mixed population of cells (e.g., neurons and glial cells), or analysis of reporter gene expression could be restricted to a distinct subpopulation of cells (e.g., only transfected cells). Moreover, the capacity to monitor GFP accumulation in living cells prior to flow cytometry has the potential to greatly simplify kinetic analyses of reporter gene expression.
Numerous studies suggest that GFP may be useful as a quantitative reporter of gene expression. Lissemore et. al. (32) describe methods for measuring GFP expression in E. coli cells grown on soft agar. Scholz et. al. (43) demonstrate that GFP and β-gal expression are equally reliable indicators of tetA promoter activity in E. coli. Likewise, Albano et al. (2) found that GFP and CAT provide equivalent measures of araBAD promoter activity in E. coli following arabinose-induced expression of a GFP-CAT fusion construct. Several studies suggest that it is possible that GFP may also be used as a quantitative reporter of gene expression in eukaryotic cells (3, 10, 12, 14, 16, 21, 22, 31, 44, 47). However, the available evidence is diffuse and does not directly address the salient, quantitative questions about GFP’s capacity to function as a reporter protein. The current study was initiated to determine if differences in GFP fluorescent intensity provide a reliable measure of underlying differences in gene expression.
MATERIALS AND METHODS
Cells, adenoviruses, and plasmids
Vero cells (American Type Culture Collection, Manassas, VA) were propagated in Dulbecco’s modified Eagle medium (DMEM) containing 0.15% bicarbonate supplemented with 5% fetal bovine serum, penicillin G (100U/ml), streptomycin (100mg/ml), and 2mM l-glutamine, hereafter referred to as complete DMEM. The adenovirus vectors Ad.CMV-GFP, Ad.CMV-rtTA, Ad.TRE-VP16, and Ad.TRE-VP16 (Δ417–490) were propagated in 293 cells, as previously described (25). Adenovirus titers were determined by plaque assay on 293 cells, and were secondarily confirmed by limiting dilution analysis in 293 cell cultures. The multiplicity of infection (MOI) in all experiments is expressed in terms of plaque-forming units (pfu) per cell.
The adenovirus Ad.TRE-GFP was constructed by 1. subcloning the eGFP coding sequence from the plasmid eGFP-N1 (Clontech Laboratories, Palo Alto, CA) into the plasmid pBHad.TRE (25), 2. co-transfecting pBHad.TRE-GFP and purified Ad.CMV-GFP DNA into 293 cells, and 3. selecting weak GFP-expressing adenovirus plaques, as previously described (11, 25). The identity of Ad.TRE-GFP was confirmed by Southern blot analysis and PCR.
The ICP0 promoter-GFP reporter plasmid p0-GFP was constructed using pCRII: HSV-1 118.0 - 125.3, a plasmid which contains the LAT-ICP0 locus of HSV-1 strain KOS (nucleotides 118,001 – 125,300; Dra I to AscI fragment). Within this plasmid, a Xho I site occurs at the 5’ end of exon 2 of the ICP0 gene (nucleotide 123,028). The eGFP coding sequence of eGFP-N1 was inserted into the Xho I site of pCRII: HSV-1 118.0-125.3, and the resulting intermediate plasmid was then linearized by digestion with Age I, filled in with T4 DNA polymerase + dNTPs, and re-ligated in order to place the GFP coding sequence in frame with the ICP0 coding sequence. The accuracy of these manipulations was verified by DNA sequencing. The resulting plasmid, p0-GFP, encodes a fusion of the N-terminal 118 amino acids of ICP0 followed by the 239 amino acids of GFP. This chimeric protein is under the regulation of the primary ICP0 promoter (~800 bp), as well as the ~750 bp of potential regulatory elements in the 1st intron of the ICP0 gene (20).
Fluorescent microscopy and flow cytometry of Vero cells
Vero cells were seeded in 12-well plates at a density of 2 x 10⁵ cells per well, and were inoculated 18 hours later with a 2.15-fold (i.e., 1/3 of a logarithm) dilution series of Ad.CMV-GFP or Ad.TRE-GFP (e.g., MOI=1.0, 2.2, 4.6, 10, etc.). After allowing one hour for viral adsorption and entry, the inoculum was replaced with complete DMEM. In experiments with Ad.TRE-GFP, cells were co-inoculated with Ad.CMV-rtTA (MOI=10) and the inoculum was replaced with complete DMEM containing either nothing or 10 μM doxycycline, which serves as an inducer of the TRE promoter. Vero cell cultures were analyzed under a fluorescent microscope or dissociated for flow cytometry 24 hours after inoculation, as described below. GFP fluorescence in Vero cell monolayers was observed under illumination with the 360–400 nm spectrum of light that excites GFP fluorescence. Fluorescent images of cells were obtained under 10x or 20x magnification on a Nikon TE 300 microscope (Nikon Instruments, Lewisville, TX) using a DXC-970MD CCD camera (Sony Corporation, New York, NY) and Metavue software (Universal Imaging Corporation, Downingtown, PA).
For flow cytometry, cell monolayers were washed in phosphate-buffered saline (PBS), dissociated with 200μl of 0.25% trypsin, resuspended in a total volume of 1 ml following the addition of 800 μl PBS containing 10% FBS, and then stored on ice until cells were analyzed in a flow cytometer. The time between dissociation of cells and flow cytometry was minimized in the current study, and no more than three hours elapsed between cell harvest and the completion of flow cytometry. However, we have performed flow cytometry on dissociated cells stored overnight at 4°C, as well. Although the GFP signal is still robust, the cell population appears to deteriorate in quality after overnight storage based on increased heterogeneity in forward scatter and side scatter. A Becton Dickinson FACSCalibur and CellQuest Pro software (BD Biosciences, San Jose, CA) were used to measure the fluorescent intensity of cells. Of the 25,000 events evaluated per sample, only cells with the forward-scatter and side-scatter properties of single Vero cells were used in measurements of GFP fluorescence. The threshold between fluorescence-positive and fluorescence-negative was set such that >99.5% of uninoculated Vero cells were considered fluorescence-negative.
Northern blot and dot blot analysis of GFP mRNA yield
For experiments that included Northern blot or dot blot analysis of GFP mRNA, 1.8 x 10⁶ Vero cells were seeded per 60 mm dish, and were inoculated 18 hours later with a 2.15-fold (i.e., 1/3 of a logarithm) dilution series of Ad.CMV-GFP or Ad.TRE-GFP (e.g., MOI=1.0, 2.2, 4,6, 10, etc.). After allowing one hour for viral adsorption and entry, the inoculum was replaced with complete DMEM. In experiments with Ad.TRE-GFP, cells were co-inoculated with Ad.CMV-rtTA (MOI=10) and the inoculum was replaced with complete DMEM containing either nothing or 10 μM doxycycline, which serves as an inducer of the TRE promoter. Total RNA was isolated from Vero cells at 24 hours p.i. using Ultraspec RNA isolation reagent (Biotecx Inc., Houston, TX).
Northern blot measurement of GFP mRNA yield was performed, as follows. Equal amounts of total RNA (10 μg) were electrophoretically separated on 1.2% formaldehyde agarose gels. Following electrophoresis, RNA was vaccum blotted onto Zeta Probe GT nylon membranes (Biorad Laboratories, Hercules, CA) using 10x standard saline citrate (SSC) as transfer buffer, and blots were irradiated with 0.2 J/cm2 in a Spectroline UV crosslinker (Spectronics Corporation, Westbury, NY). An oligonucleotide probe specific for GFP (5′-atagacgttgtggctgttgtagttgtactccagcttgtgc-3′) was 3’ end-labeled with terminal deoxynucleotidyl transferase (Promega Corporation, Madison, WI) and [α-32P] dATP. Hybridization of radiolabeled probe was carried out at 42° C overnight in a solution containing 2 ng labeled probe per ml, 7% sodium dodecyl sulfate (SDS), 120 mM NaH2P04, and 250 mM NaCl. Excess probe was removed by washing the membrane in 0.1x SSC containing 0.1% SDS. Visualization and quantitation of hybridized probe was achieved by exposing the radiolabeled membrane to a phosphorimager screen, which was analyzed after an 18-hour exposure in a Cyclone phoshorimager using OptiQuant software (PerkinElmer Biosciences, Boston, MA).
Dotblot measurement of GFP mRNA yield was achieved by diluting 10 μg total RNA into 0.5 ml ice-cold 10mM NaOH, holding diluted RNA samples on ice until all samples were prepared, and then blotting the RNA samples onto Zeta Probe GT nylon membrane (Biorad Laboratories) using a Convertible filtration manifold with a 96-well dotblot template (Whatman Biometra, Goettingen, Germany). Once the RNA samples were immobilized on the nylon membrane, all subsequent manipulations were the same as described above for Northern blots.
Transient transfection of Vero cells with p0-GFP
Vero cells were seeded in 12-well plates at a density of 2 x 10⁵ cells per well, and 18 hours later Vero cells were co-inoculated with Ad.CMV-rtTA (MOI=10) and an MOI of 0.1, 0.3, 1.0, 3.2, 10, 32, or 100 pfu per cell of Ad.TRE-VP16 or Ad.TRE-VP16 (Δ417-490). One hour later, the inoculum was replaced with complete DMEM containing 10 μM doxycycline. At 24 hours p.i., Vero cells were transfected with 3 μg of the plasmid p0-GFP using Lipofectamine 2000 according to the manufacturer’s instructions (Invitrogen Corporation, Carlsbad, CA). Five hours after initiating the transfection, the medium was replaced with complete DMEM containing 10 μM doxycycline. Cell monolayers were dissociated with trypsin 42 hours after initiating the transfection, and GFP fluorescence was measured in single cell suspensions by flow cytometry, as described above.
Numerical and statistical analysis
Analysis of numerical data and statistical analyses were performed with the software package Microsoft Excel. Unless otherwise indicated, all data are presented as the mean ± standard error of the mean (SEM). Regression analysis was performed by the method of least squares, and was used to determine the goodness of fit (r2) of increases in GFP fluorescence in relation to increases in MOI or increases in GFP mRNA yield. The term “average GFP fluorescence” refers to the average fluorescent intensity observed across the entire sample population of cells. The term “fluorescent volume” represents a summation of GFP fluorescence within the sub-population of cells that were GFP-positive (GFP+), and this was calculated to be equal to the ‘fraction of GFP+ cells in the sample population’ times the ‘mean fluorescent intensity of these GFP+ cells.’ The coefficient of variation within groups of replicates was calculated to be 100% times the standard deviation of measurements divided by the mean of the measurements.
RESULTS
GFP fluorescence and GFP mRNA increase in proportion to GFP gene copy number
Vero cells were inoculated with 0 to 1000 pfu per cell of Ad.CMV-GFP, a replication-defective adenovirus that expresses GFP under the control of the cytomegalovirus (CMV) major immediate-early promoter. At 24 hours post inoculation (p.i.), GFP expression in Vero cells was photographed under a fluorescent microscope, and the results suggested that GFP fluorescence increased in intensity as the multiplicity of infection (MOI) of Ad.CMV-GFP was increased (Fig. 1A). This conclusion was subsequently corroborated by flow cytometry, which indicated that between 0.5 and 46 pfu per cell, the average GFP fluorescence increased in direct proportion to the MOI of Ad.CMV-GFP (Fig. 1B; r2 = 0.99, as determined by regression analysis). Above an MOI of 100, however, increases in fluorescence deviated from linearity and did not increase in direct proportion to MOI (Fig. 1B). The average GFP fluorescence was statistically different between each group of cells inoculated with 0.5, 1.0, 2.2, 4.6, 10, 22, or 46 pfu per cell of Ad.CMV-GFP, as determined by comparing GFP fluorescence at one MOI to the next lower MOI (p = 0.001 to 0.02 by one-way t-tests). Thus, a single 2.15-fold dilution of Ad.CMV-GFP produced a significant change in GFP fluorescence. The results of two other independent experiments produced equivalent results, and demonstrated that log (GFP fluorescence) increased in direct proportion to log (MOI) between 0.5 and 46 pfu per cell (r2 = 0.98 ± 0.01; mean ± sem of the goodness of fit of three experiments).
Figure 1. GFP fluorescence increases in proportion to the MOI of Ad.CMV-GFP.
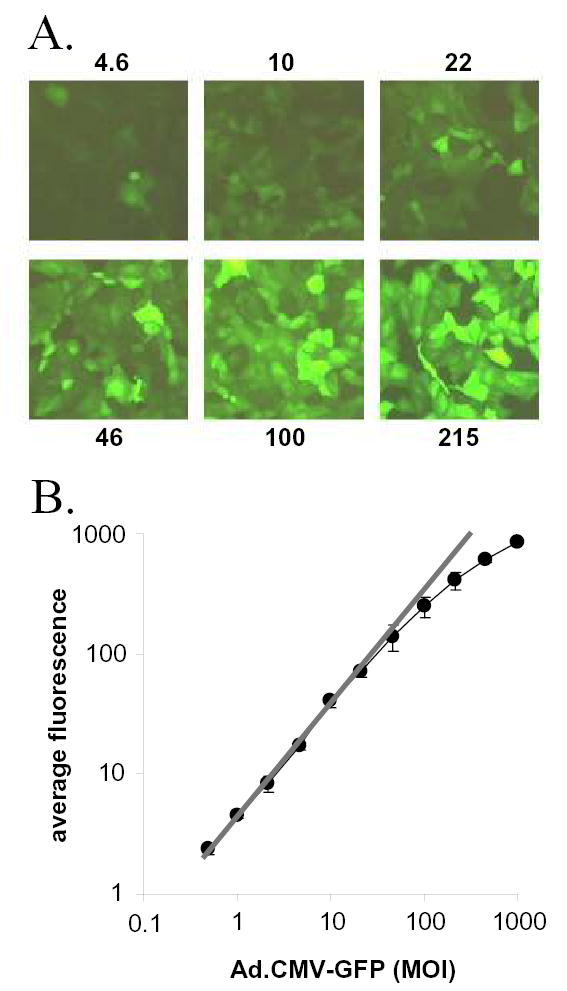
A. Vero cell monolayers as seen 24 hours after inoculation with 4.6, 10, 22, 46, 100, or 216 pfu per cell of Ad.CMV-GFP under illumination with 360–400 nm light that excites GFP fluorescence (20x magnification). B. Average GFP fluorescent intensity of Vero cells 24 hours after inoculation with Ad.CMV-GFP is plotted as a function of MOI (n=3 per group; each datum point represents the mean ± SEM). Values of GFP fluorescence are scaled relative to the lower limit of detection of the assay, which was estimated to be three times the average background fluorescence of uninoculated Vero cells. The gray line represents the regression line between average GFP fluorescence and the MOI of Ad.CMV-GFP in the linear range of fluorescence increase between 0.5 and 46 pfu per cell (r2=0.99, as determined by regression analysis).
A similar dose-response design was used to determine the extent to which GFP mRNA yield changes in Vero cells as a function of the MOI of Ad.CMV-GFP. At 24 hours p.i., Northern blot analysis was performed on Vero cell monolayers inoculated with 0 to 215 pfu per cell of Ad.CMV-GFP. At MOIs of 0.5, 1.0, or 2.2 pfu per cell, GFP mRNA yields were not clearly above the background of the Northern blot assay (Fig. 2A). Between MOIs of 4.6 and 100, GFP mRNA yields increased in direct proportion to the MOI of Ad.CMV-GFP added to Vero cells (Fig. 2A, 2B). Beyond an MOI of 100, GFP mRNA yield did not increase in direct proportion to MOI (Fig. 2B). While measurements of GFP mRNA yield and GFP fluorescence both increased in proportion to the MOI of Ad.CMV-GFP, measurements of GFP fluorescence were more sensitive, had a lower coefficient of variability, and had a wider range of linear increase relative to MOI.
Figure 2. GFP mRNA yield increases in proportion to the MOI of Ad.CMV-GFP.
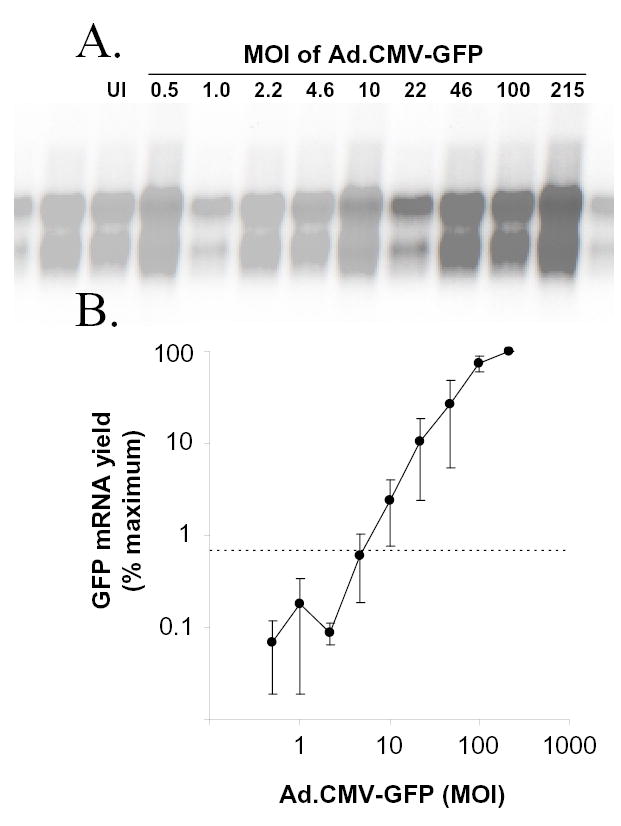
A. Northern blot of GFP mRNA from uninoculated (UI) Vero cells or Vero cells inoculated with MOIs of 0.5, 1.0, 2.2, 4.6, 10, 22, 46, 100, or 215 pfu per cell of Ad.CMV-GFP. Total RNA samples (10 μg per lane) were harvested 24 hours p.i., electrophoretically separated, blotted, and probed with a 32P-labeled GFP-specific probe. B. GFP mRNA yield observed in three independent Northern blots, including the blot shown in panel A, is plotted as a function of the MOI of Ad.CMV-GFP (each datum point represents the mean ± SEM). For each of the three blots, GFP mRNA yield was normalized to the maximum GFP mRNA yield (i.e., MOI=215), such that the highest yield on each blot was assigned a value of 100% and the other yields were scaled proportionally.
GFP fluorescence is directly proportional to GFP mRNA abundance
To determine if changes in GFP fluorescence accurately reflect underlying changes in GFP mRNA abundance, Vero cells were inoculated with an MOI of 2.2, 4.6, 10, 22, 46, 100, 215, or 464 pfu per cell of Ad.CMV-GFP. At 24 hours p.i., cell monolayers were dissociated with trypsin, and 10% of the cells were analyzed for GFP fluorescence via flow cytometry while total RNA was extracted from the remaining cells for Northern blot analysis. The resulting measurements of GFP fluorescence and GFP mRNA yield were normalized to the maximum signal obtained in each group, and were plotted relative to one another (Fig. 3). Regression analysis indicated that the relative level of GFP fluorescence observed in each Ad.CMV-GFP infected culture was strongly correlated with the relative abundance of GFP mRNA observed in the same culture (Fig. 3). Therefore, measurements of GFP fluorescent intensity and GFP mRNA abundance provided equivalent measures of GFP gene expression.
Figure 3. GFP fluorescence is proportional to GFP mRNA yield.
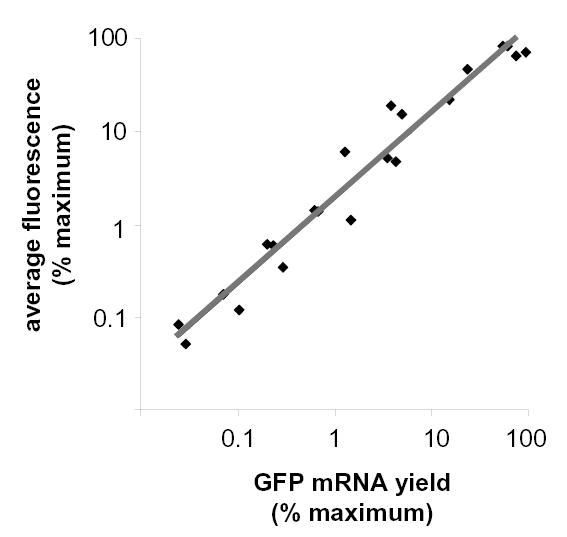
The relative level of GFP fluorescence in Ad.CMV-GFP-infected Vero cell cultures is graphed as a function of the relative GFP mRNA yields obtained from the same cultures. Vero cells were inoculated with 2.2, 4.6, 10, 22, 46, 100, 215, or 464 pfu per cell of Ad.CMV-GFP (n=3 replicates per MOI). At 24 hours p.i., 10% of the cells in each culture were used to measure GFP fluorescence via flow cytometry. The remaining 90% of the cells were used to measure GFP mRNA yield via Northern blot analysis. GFP fluorescence and GFP mRNA yields are scaled relative to their respective observed maximums (i.e., MOI = 464), which were assigned a value of 100%. The relative amounts of GFP fluorescence derived from cultures inoculated with MOIs of 2.2 to 215 pfu per cell of Ad.CMV-GFP are plotted as a function of the relative GFP mRNA yield of the same culture. The gray line represents the regression line between normalized measurements of GFP fluorescence and GFP mRNA yield (r2=0.96, as determined by regression analysis).
Doxycycline-induced expression of a TRE promoter-GFP reporter gene
In cells expressing the rtTA transactivator, treatment with doxycycline induces a conformational change in rtTA that stimulates DNA binding and the consequent transactivation of the TRE promoter (18). Therefore, cells were co-inoculated with the adenoviruses Ad.CMV-rtTA (25) and Ad.TRE-GFP in order to determine if doxycycline-imduced transactivation of a TRE promoter-GFP reporter could be measured by flow cytometry.
Ad.TRE-GFP-infected Vero cells were co-inoculated with 10 pfu per cell of Ad.CMV-rtTA and variable MOIs of Ad.TRE-GFP (MOI= 1.0, 2.2, 4.6, 10, 22, 46, 100, or 215). At 24 hours p.i., GFP fluorescence was measured in 10% of cells and total RNA was harvested for dotblot analysis from the remaining cells. In the absence of doxycycline, GFP mRNA yield in Ad.TRE-GFP-infected Vero cells was not significantly greater than the background of the dot blot assay (Fig. 4A and 4B; no DOX). Likewise, in the absence of doxycycline, GFP fluorescence was barely detectable in Vero cells inoculated with as much as 215 pfu per cell of Ad.TRE-GFP (Fig. 4C). However, in the presence of 10 μM doxycycline, GFP mRNA yield (Fig. 4A, 4B) and GFP fluorescence (Fig. 4C) both increased in a dose-dependent manner as the MOI of Ad.TRE-GFP was increased from 4.6 to 215 pfu per cell. Measurements of GFP mRNA yield were too close to background to reliably measure the degree to which doxycycline treatment induced GFP gene expression from the TRE promoter (Fig. 4A, 4B). However, between MOIs of 10 and 215 pfu per cell of Ad.TRE-GFP, measurements of GFP fluorescence indicated that doxycycline treatment induced a 15- to 25-fold increase in GFP expression from the TRE promoter (Fig. 4C). As a positive control, Vero cells were inoculated with the same MOIs of Ad.CMV-GFP. At all MOIs tested, GFP gene expression from the CMV promoter was approximately 5- to 10-fold greater than the level of GFP gene expression achieved when the TRE promoter was induced by treatment with 10 μM doxycycline (Fig. 4).
Figure 4. Doxycycline-induced expression of a TRE promoter-GFP reporter gene.
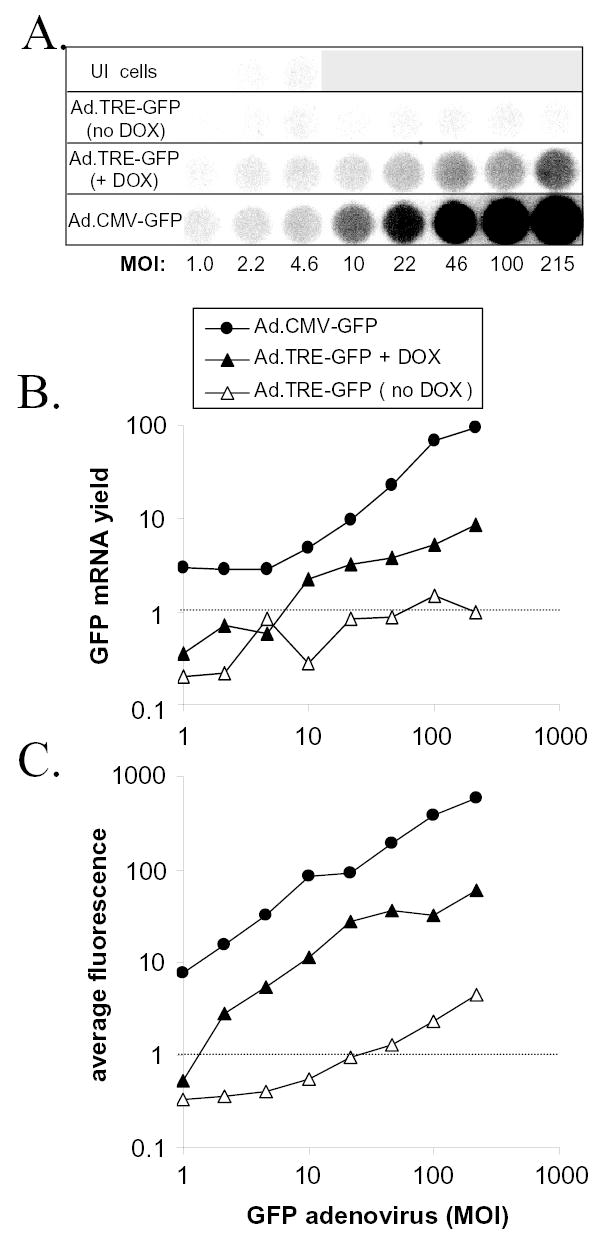
Vero cells were co-inoculated with Ad.CMV-rtTA (MOI=10) and Ad.TRE-GFP (MOI= 1.0, 2.2, 4.6, 10, 22, 46, 100, or 215), and were treated 1 hour later with either nothing (no DOX) or 10 μM doxycycline (+ DOX). As a positive control for GFP expression, Vero cells were inoculated with the same MOIs of Ad.CMV-GFP. At 24 hours p.i., flow cytometric measurement of GFP fluorescence was performed on 10% of the cells in each culture, and the remainder were used to measure GFP mRNA yield via dot blot analysis. A. Hybridization of GFP mRNA-specific probe to dotblots of total RNA (10 μg per well) isolated from Vero cells that were uninoculated (UI), inoculated with Ad.TRE-GFP under non-inducing conditions (no DOX) or inducing conditons (+ DOX), or inoculated with Ad.CMV-GFP. B. GFP mRNA yield and C. GFP fluorescence are plotted as a function of the MOI of Ad.CMV-GFP or Ad.TRE-GFP added to Vero cells. The values of GFP mRNA yield and average GFP fluorescence are scaled in proportion to the lower limit of detection of each assay, which is denoted by a dashed line.
Inherent to most methods of measuring gene expression is the averaging of measurements (i.e., GFP mRNA yield) across an entire cell population. Measurement of the MOI-dependent increase in average GFP mRNA yield and average fluorescent intensity in Vero cells inoculated with Ad.TRE-GFP or Ad.CMV-GFP suggested that GFP expression increased uniformly throughout the cell population as a function of gene copy number (Fig. 4). However, fluorescent microscopy and flow cytometry revealed that induction of GFP expression from the TRE promoter was not uniformly distributed through the cell population (Fig. 5). In the absence of doxycycline, GFP expression was not detectable in Vero cell inoculated with Ad.TRE-GFP and Ad.CMV-rtTA (Fig. 5A, 5D). Conversely, high levels of GFP expression were uniformly observed in Vero cells inoculated with Ad.CMV-GFP (Fig. 5C, 5F). However, 10 μM doxycycline failed to induce uniform expression of GFP from the TRE promoter, and thus GFP expression was only detectable in 20% of Ad.TRE-GFP-infected Vero cells (Fig. 5B, 5E). The efficiency of GFP expression from Ad.TRE-GFP could be increased through the use of higher MOIs or a longer incubation period between infection and flow cytometry, such that 80% of cells were GFP+. However, regardless of the specific conditions chosen, GFP expression from Ad.TRE-GFP was highly heterogenous and the fluorescent intensities of GFP+ cells varied by more than a factor of 100. Therefore, although GFP expression is normally distributed amongst cells inoculated with Ad.CMV-GFP, doxycycline-treatment does not induce a uniform pattern of GFP expression within populations of Ad.TRE-GFP infected Vero cells.
Figure 5. GFP is not uniformly expressed to detectable levels in Vero cells infected with Ad.TRE-GFP.
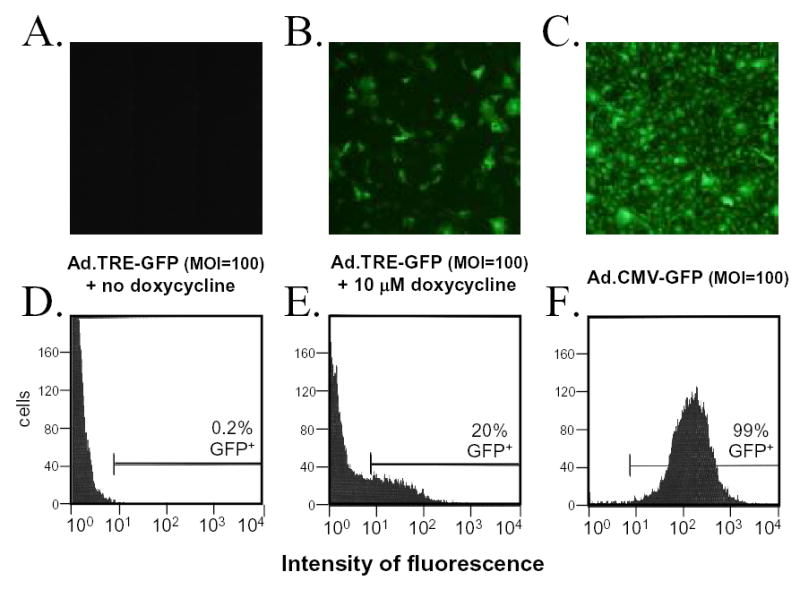
(A – C) Monolayers of adenovirus-infected Vero cells as seen 24 hours p.i. under illumination with 360–400 nm light which excites GFP fluorescence (10x magnification). Vero cells were inoculated with Ad.TRE-GFP (MOI=100) and Ad.CMV-rtTA (MOI=10) and treated with A. no doxycycline or B. 10 μM doxycycline, or C. were inoculated with Ad.CMV-GFP (MOI=100). (D – F) Flow cytometric analysis of Vero cells 24 hours after inoculation with Ad.TRE-GFP and Ad.CMV-rtTA in the D. absence or E. presence of 10 μM doxycycline, or 24 hours after inoculation with F. Ad.CMV-GFP. For each histogram, the threshold between GFP-negative and GFP-positive is indicated, as is the percent of GFP-positive cells in the sample population.
VP16- induced expression of an ICP0 promoter-GFP reporter gene
At the onset of herpes simplex virus type 1 (HSV-1) infection, transcription of the HSV-1 ICP0 gene is upregulated by a virion-associated protein, VP16, via four consensus VP16-binding sequences in the ICP0 promoter (6, 15). Therefore, the following experiment was performed to determine if VP16-mediated transactivation of an ICP0 promoter-GFP reporter gene could be measured by flow cytometry.
Vero cell monolayers were treated with 1. Ad.CMV-rtTA (MOI=10), 2. 10 μM doxycycline, and 3. 0.1 to 100 pfu per cell of Ad.TRE-VP16 (wt) or Ad.TRE-VP16 (Δ417-490). While the wild-type VP16-expressing adenovirus encodes all 490 amino acids of VP16, the mutant control encodes a truncated form of VP16 that lacks the C-terminal transactivation domain (19, 40, 48). After allowing 24 hours for expression of wild-type VP16 or VP16 (Δ417–490), plasmid p0-GFP was transfected into Vero cell monolayers. Forty two hours later, flow cytometry revealed that wild-type VP16 induced an ~20-fold increase in the volume of GFP fluorescence in cells transfected with p0-GFP, and that the degree of induction was proportional to the MOI of Ad.TRE-VP16 (Fig. 6). More specifically, the addition of 10 or more pfu per cell of Ad.TRE-VP16 in p0-GFP-transfected cells resulted in a 1. three-fold increase in the frequency of GFP+ cells (i.e., 2% to 7%) and a 2. nearly ten-fold increase in the average fluorescent intensity of GFP+ cells (i.e., from 1.5 to 14 times the lower limit of detection). The reported volume of fluorescence in each culture is the product of these two measurements.
Figure 6. VP16-induced expression of a viral IE promoter-GFP reporter gene.
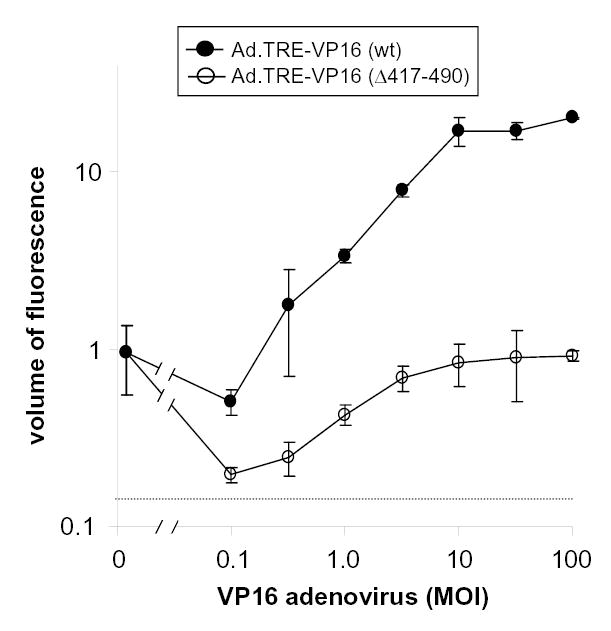
Vero cell monolayers were treated with 10 μM doxycycline following co-inoculation with Ad.CMV-rtTA (MOI=10) and 0.1, 0.3, 1.0, 3.2, 10, 32, or 100 pfu per cell of Ad.TRE-VP16 (wild-type) or Ad.TRE-VP16 (Δ417–490). Vero cells were transfected 24 hours later with 3 μg of p0-GFP, which contains an HSV-1 ICP0 promoter-GFP reporter gene, and Vero cells were harvested 42 hours later for flow cytometric analysis. The GFP fluorescent volume of p0-GFP-transfected cells is plotted as a function of adenovirus MOI (n=3 cultures per MOI; each datum point represents the mean ± SEM). The fluorescent volume of each culture was calculated to be the ‘fraction of GFP+ cells’ times the ‘mean fluorescence of GFP+ cells.’ Fluorescent volumes are normalized to the basal level of GFP expression (i.e., assigned a volume of 1), which was observed in cells transfected with p0-GFP only. The basal level of GFP expression in these cultures that received no adenovirus is shown on the left-hand side of the graph (i.e., MOI=0). The lower limit of detection of the assay, denoted by the dashed line, was estimated to be three times the background fluorescent volume associated with uninoculated Vero cells.
In contrast to the wild-type transactivator, Ad.TRE-VP16 (Δ417–490) failed to induce GFP expression from the ICP0 promoter (Fig. 6). Infection with Ad.TRE-VP16 (Δ417–490) actually caused GFP fluorescent intensity to decrease below the basal level of GFP expression observed in cells that received p0-GFP only (Fig. 6). Thus, wild-type VP16 induces the ICP0 promoter in a dose-dependent manner, and this induction is dependent on the presence of the C-terminal transactivation domain of VP16.
DISCUSSION
In the current study, the GFP gene was evaluated for its capacity to function as a quantitative reporter of gene expression. For this purpose, the GFP gene was placed under the control of three different eukaryotic promoters, a 1. constitutive and highly active CMV immediate-early promoter, a 2. doxycycline-inducible TRE promoter, and a 3. VP16-inducible HSV-1 immediate-early promoter. In the case of Ad.CMV-GFP-infected cells, levels of GFP fluorescence increased in direct proportion to the copy number of GFP genes introduced into Vero cells (Fig. 1). In the case of Ad.TRE-GFP-infected Vero cells (co-inoculated with Ad.CMV-rtTA), addition of doxycycline to cultures caused an ~20-fold increase in GFP fluorescence relative to Ad.TRE-GFP-infected Vero cells that received no doxycycline (Fig. 4). Finally, in the case of Vero cells transfected with a plasmid that carries an HSV-1 immediate-early promoter-GFP reporter gene, increasing MOIs of Ad.TRE-VP16 caused a dose-dependent increase in GFP fluorescence (Fig. 6). Therefore, the outcomes of this study strongly suggest that GFP fluorescence can be used as a reliable and quantitative reporter of underlying changes in gene expression. The considerations that substantiate this conclusion are further discussed.
Quantitative reliability of GFP as a reporter protein
A quantitative and reliable reporter assay provides i. an accurate measure of changes in gene expression over a wide range, and is also ii. sensitive and iii. reproducible. The proposed use of GFP fluorescence as a quantitative reporter of gene expression is discussed in light of these parameters.
i. Accuracy and range
Our results indicate that GFP fluorescence varies in direct proportion to GFP mRNA abundance in Vero cells infected with Ad.CMV-GFP or Ad.TRE-GFP (Figs. 3 and 4). It has already been established that GFP fluorescence increases in direct proportion to GFP protein concentration (14, 23). Given that GFP fluorescence increases in direct proportion to GFP mRNA and protein levels, we conclude that GFP fluorescence provides an accurate measure of underlying changes in GFP gene expression.
Our results indicate that between MOIs of 0.5 and 46 pfu per cell of Ad.CMV-GFP, there is a strict linear relationship between average GFP fluorescence and the copy number of GFP genes introduced into Vero cells (Fig. 1). Thus, differences in GFP fluorescent intensity can provide a valid measure of differences in reporter gene expression over an ~100-fold range. However, a flow cytometer not only measures differences in fluorescent intensity per GFP+ cell, but also measures the frequency of GFP+ cells (i.e, 1 to 100%). Because these two multiplicative terms are simultaneously measured, we suspect that changes in GFP fluorescence can provide a reliable measure of changes in GFP gene expression over as much as a 1000-fold range.
ii. Sensitivity
Regarding the sensitivity of GFP as a reporter protein, the lower limit of detection of GFP fluorescence was not directly compared to conventional enzymatic reporters such as CAT, β-gal, or luciferase. However, unlike most reporter assays, even if only 1% of the cells in a population express a GFP reporter gene, the quantity of GFP fluorescence in this subset of cells is not diluted into the 99% of cells that are GFP-negative. Thus, we suspect that flow cytometric measurement of GFP fluorescence should be an especially sensitive means to measure reporter gene expression in experiments in which only a small fraction of cells are expected to express the reporter gene (e.g., transient transfection of primary cells). However, direct side-by-side comparisons of the sensitivity of GFP versus other reporter proteins remain to be performed.
iii. Reproducibility
The coefficient of variation of GFP fluorescence within replicate samples typically ranged from 5 to 20%. A single 2.15-fold increase in the amount of Ad.CMV-GFP added to Vero cells consistently produced significant increases in GFP fluorescence. Unlike most reporter assays, each datum point of “average GFP fluorescence” was not based on a single measurement, but was in fact an average of ~24,000 measurements taken from individual cells in the sample population. Moreover, the simplicity of the manipulations required to measure GFP fluorescence (i.e., dissociation of live cells into a suspension) greatly reduces the opportunity to introduce user-error into the measurements. Thus, we believe that flow cytometric measurement of GFP fluorescence provides an exceptionally robust and reproducible method to measure changes in reporter gene expression in a population of cells.
Practical advantages of GFP as a reporter protein
Two advantages of GFP as a reporter of gene expression are that i. protein accumulation can be directly observed in living cells prior to quantitative analysis, and ii. GFP gene expression can be measured on a cell-by-cell basis. These advantages are discussed, as follows.
i. Real-time observation of reporter gene expression
A major advantage of GFP is that intracellular accumulation of the protein can be directly observed in living cells over time. Digital photographs of GFP-expressing cells provide a reasonable approximation of the quantitative results that will be obtained upon flow cytometric analysis of the cells, provided that all microscope and camera settings such as objective, aperture, and exposure time are held constant (e.g., Figs. 1 and 5). Moreover, the capacity to directly observe GFP accumulation in cells allows one to empirically verify that adequate GFP expression has occurred in test cultures prior to dissociating cells for flow cytometric analysis. Finally, we note that although fluorescent microscopy provides a useful tool for monitoring GFP expression, detection of GFP fluorescence by the flow cytometer was approximately ten times more sensitive than what we were able to perceive under a fluorescent microscope.
ii. Measurement of reporter gene expression in individual cells
Most methods of quantifying gene expression measure only the average level of gene expression in a population of cells. When reporter gene expression is normally distributed in a bell curve around the average (e.g., Ad.CMV-GFP-infected Vero cells), average reporter activity provides a concise and accurate measure of gene expression in the cell population (Fig. 5C, 5F). However, in the current study, 1. Ad.TRE-GFP infection and 2. transient transfection with p0-GFP both illustrate circumstances in which reporter gene expression was not uniformly detected throughout the population (i.e., one subset of cells was GFP+ and the remainder were GFP-negative). In such circumstances, analysis of gene expression on a cell-by-cell basis provides a more accurate picture of promoter activity in the cell population than measurements which simply average promoter activity across the entire cell population (e.g., Fig. 4 vs. Fig. 5). In this regard, GFP is unique as a reporter protein because at a flow rate of 1000 cells per second, the mean and standard deviation of GFP reporter gene expression can be quickly and accurately determined in a flow cytometer. Given that hypothesis testing is not only dependent on the measurement of group averages, but is also dependent on the accurate measurement of variation within groups, we conclude that flow cytometric measurement of GFP fluorescence provides an especially powerful tool to compare reporter gene expression between different populations of cells.
The capacity of a flow cytometer to measure GFP reporter gene expression in individual cells may have other applications as well. First, differences in GFP reporter gene expression in a mixed population of cells (e.g., neurons and glial cells) can be accurately measured provided that cell-specific antibodies or differences in light scatter properties (e.g, forward scatter) can be used to distinguish one cell type from the other. Second, GFP fluorescence could be compared in propidium iodide-stained cells if one wished to compare GFP reporter gene expression as a function of different phases of the cell cycle. Finally, we predict that many useful applications can be devised that couple a flow cytometer's capacity to quantitatively measure GFP reporter gene expression to its capacity to efficiently sort cells into distinct subpopulations.
Conclusion
In the past decade, the qualitative use of fluorescent reporter proteins has fundamentally changed our understanding of many biological processes. However, the quantitative capacity of these proteins has generally gone unnoticed. Based on the results presented herein, we conclude that GFP has all of the essential properties of a quantitative reporter protein. Whether GFP genes are delivered to cells through transfection, viral infection, or the generation of stable cell lines or transgenic mice, we envision that flow cytometry can be used as a simple, rapid, and robust means of quantitatively measuring GFP reporter gene expression in individual cells derived from these systems. Moreover, given that functional chimeric proteins can be made that bear GFP at the amino or carboxy terminus, GFP-tagged proteins may also prove to be useful as a means to quantitatively measure the expression of a specific protein in single cells. In summary, we conclude that GFP’s capacity to function as a quantitative reporter provides a powerful, new tool to address questions about gene regulation that are best addressed at the single cell level (e.g., reactivation of HSV-1 in latently infected neurons).
Acknowledgments
This work was supported by grants from the Louisiana Board of Regents Support Foundation (LEQSF-2001-2004-RD-A-33), the W. M. Keck Foundation of Los Angeles, and the National Institute of Allergy and Infectious Diseases (R01 AI51414).
References
- 1.Aints A, Dilber MS, Smith CI. Intercellular spread of GFP-VP22. J Gene Med. 1999;1:275–9. doi: 10.1002/(SICI)1521-2254(199907/08)1:4<275::AID-JGM44>3.0.CO;2-M. [DOI] [PubMed] [Google Scholar]
- 2.Albano CR, Randers-Eichhorn L, Bentley WE, Rao G. Green fluorescent protein as a real time quantitative reporter of heterologous protein production. Biotechnol Prog. 1998;14:351–4. doi: 10.1021/bp970121b. [DOI] [PubMed] [Google Scholar]
- 3.Anderson MT, I, Tjioe M, Lorincz MC, Parks DR, Herzenberg LA, Nolan GP. Simultaneous fluorescence-activated cell sorter analysis of two distinct transcriptional elements within a single cell using engineered green fluorescent proteins. Proc Natl Acad Sci U S A. 1996;93:8508–11. doi: 10.1073/pnas.93.16.8508. [DOI] [PMC free article] [PubMed] [Google Scholar]
- 4.Baulcombe DC, Chapman S, Santa Cruz S. Jellyfish green fluorescent protein as a reporter for virus infections. Plant J. 1995;7:1045–53. doi: 10.1046/j.1365-313x.1995.07061045.x. [DOI] [PubMed] [Google Scholar]
- 5.Boes M, Cerny J, Massol R, Op den Brouw M, Kirchhausen T, Chen J, Ploegh HL. T-cell engagement of dendritic cells rapidly rearranges MHC class II transport. Nature. 2002;418:983–8. doi: 10.1038/nature01004. [DOI] [PubMed] [Google Scholar]
- 6.Campbell MEM, Palfreyman LM, Preston CM. Identification of herpes simplex virus DNA sequences which encode a transacting polypeptide responsible for stimulation of immediate early transcription. J Mol Biol. 1984;180:1–19. doi: 10.1016/0022-2836(84)90427-3. [DOI] [PubMed] [Google Scholar]
- 7.Chalfie M, Tu Y, Euskirchen G, Ward WW, Prasher DC. Green fluorescent protein as a marker for gene expression. Science. 1994;263:802–5. doi: 10.1126/science.8303295. [DOI] [PubMed] [Google Scholar]
- 8.Cirillo DM, Valdivia RH, Monack DM, Falkow S. Macrophage-dependent induction of the Salmonella pathogenicity island 2 type III secretion system and its role in intracellular survival. Mol Microbiol. 1998;30:175–88. doi: 10.1046/j.1365-2958.1998.01048.x. [DOI] [PubMed] [Google Scholar]
- 9.Cody CW, Prasher DC, Westler WM, Prendergast FG, Ward WW. Chemical structure of the hexapeptide chromophore of the Aequorea green-fluorescent protein. Biochemistry. 1993;32:1212–8. doi: 10.1021/bi00056a003. [DOI] [PubMed] [Google Scholar]
- 10.Daelemans D, De Clercq E, Vandamme AM. A quantitative GFP-based bioassay for the detection of HIV-1 Tat transactivation inhibitors. J Virol Methods. 2001;96:183–8. doi: 10.1016/s0166-0934(01)00330-5. [DOI] [PubMed] [Google Scholar]
- 11.Davis AR, Wivel NA, Palladino JL, Tao L, Wilson JM. High throughput method for creating and screening recombinant adenoviruses. Gene Ther. 1998;5:1148–1152. doi: 10.1038/sj.gt.3300705. [DOI] [PubMed] [Google Scholar]
- 12.Dundr M, McNally JG, Cohen J, Misteli T. Quantitation of GFP-fusion proteins in single living cells. J Struct Biol. 2002;140:92–9. doi: 10.1016/s1047-8477(02)00521-x. [DOI] [PubMed] [Google Scholar]
- 13.Elliott G, O’Hare P. Live-cell analysis of a green fluorescent protein-tagged herpes simplex virus infection. J Virol. 1999;73:4110–9. doi: 10.1128/jvi.73.5.4110-4119.1999. [DOI] [PMC free article] [PubMed] [Google Scholar]
- 14.Furtado A, Henry R. Measurement of green fluorescent protein concentration in single cells by image analysis. Anal Biochem. 2002;310:84–92. doi: 10.1016/s0003-2697(02)00281-6. [DOI] [PubMed] [Google Scholar]
- 15.Gaffney DF, McLauchlan J, Whitton JL, Clements JB. A modular system for the assay of transcription regulatory signals: the sequence TAATGARAT is required for herpes simplex virus immediate early gene activation. Nucleic Acids Res. 1985;13:7847–63. doi: 10.1093/nar/13.21.7847. [DOI] [PMC free article] [PubMed] [Google Scholar]
- 16.Galbraith DW, Lambert GM, Grebenok RJ, Sheen J. Flow cytometric analysis of transgene expression in higher plants: green-fluorescent protein. Methods Cell Biol. 1995;50:3–14. doi: 10.1016/s0091-679x(08)61018-3. [DOI] [PubMed] [Google Scholar]
- 17.Gorman CM, Moffat LF, Howard BH. Recombinant genomes which express chloramphenicol acetyltransferase in mammalian cells. Mol Cell Biol. 1982;2:1044–51. doi: 10.1128/mcb.2.9.1044. [DOI] [PMC free article] [PubMed] [Google Scholar]
- 18.Gossen M, Bujard H. Tight control of gene expression in mammalian cells by tetracycline-responsive promoters. Proc Natl Acad Sci U S A. 1992;89:5547–51. doi: 10.1073/pnas.89.12.5547. [DOI] [PMC free article] [PubMed] [Google Scholar]
- 19.Greaves RF, O’Hare P. Structural requirements in the herpes simplex type 1 transactivator Vmw65 for interaction with the cellular octamer-binding protein and target TAATGARAT sequences. J Virol. 1990;64:2716–2724. doi: 10.1128/jvi.64.6.2716-2724.1990. [DOI] [PMC free article] [PubMed] [Google Scholar]
- 20.Gu W, Huang Q, Hayward GS. Multiple Tandemly Repeated Binding Sites for the YY1 Repressor and Transcription Factors AP-1 and SP-1 Are Clustered within Intron-1 of the Gene Encoding the IE110 Transactivator of Herpes simplex Virus Type 1. J Biomed Sci. 1995;2:203–226. doi: 10.1007/BF02253381. [DOI] [PubMed] [Google Scholar]
- 21.Hack NJ, Billups B, Guthrie PB, Rogers JH, Muir EM, Parks TN, Kater SB. Green fluorescent protein as a quantitative tool. J Neurosci Methods. 2000;95:177–84. doi: 10.1016/s0165-0270(99)00178-8. [DOI] [PubMed] [Google Scholar]
- 22.Hagenbeek D, Rock CD. Quantitative analysis by flow cytometry of abscisic acid-inducible gene expression in transiently transformed rice protoplasts. Cytometry. 2001;45:170–9. doi: 10.1002/1097-0320(20011101)45:3<170::aid-cyto1160>3.0.co;2-z. [DOI] [PubMed] [Google Scholar]
- 23.Halfhill MD, Millwood RJ, Stewart CN. Green fluorescent protein quantification in whole plants. Methods Mol Biol. 2004;286:215–26. doi: 10.1385/1-59259-827-7:215. [DOI] [PubMed] [Google Scholar]
- 24.Halford WP, Balliet JD, Gebhardt BM. Re-evaluating natural resistance to herpes simplex virus type 1. J Virol. 2004;78:10086–10095. doi: 10.1128/JVI.78.18.10086-10095.2004. [DOI] [PMC free article] [PubMed] [Google Scholar]
- 25.Halford WP, Kemp CD, Isler JA, Davido DJ, Schaffer PA. ICP0, ICP4, or VP16 expressed from adenovirus vectors induces reactivation of latent herpes simplex virus type 1 in primary cultures of latently infected trigeminal ganglion cells. J Virol. 2001;75:6143–53. doi: 10.1128/JVI.75.13.6143-6153.2001. [DOI] [PMC free article] [PubMed] [Google Scholar]
- 26.Hall CV, Jacob PE, Ringold GM, Lee F. Expression and regulation of Escherichia coli lacZ gene fusions in mammalian cells. J Mol Appl Genet. 1983;2:101–9. [PubMed] [Google Scholar]
- 27.Heim R, Cubitt AB, Tsien RY. Improved green fluorescence. Nature. 1995;373:663–4. doi: 10.1038/373663b0. [DOI] [PubMed] [Google Scholar]
- 28.Heim R, Prasher DC, Tsien RY. Wavelength mutations and posttranslational autoxidation of green fluorescent protein. Proc Natl Acad Sci U S A. 1994;91:12501–4. doi: 10.1073/pnas.91.26.12501. [DOI] [PMC free article] [PubMed] [Google Scholar]
- 29.Inouye S, Tsuji FI. Aequorea green fluorescent protein. Expression of the gene and fluorescence characteristics of the recombinant protein. FEBS Lett. 1994;341:277–80. doi: 10.1016/0014-5793(94)80472-9. [DOI] [PubMed] [Google Scholar]
- 30.Jang MH, Kweon MN, Iwatani K, Yamamoto M, Terahara K, Sasakawa C, Suzuki T, Nochi T, Yokota Y, Rennert PD, Hiroi T, Tamagawa H, Iijima H, Kunisawa J, Yuki Y, Kiyono H. Intestinal villous M cells: an antigen entry site in the mucosal epithelium. Proc Natl Acad Sci U S A. 2004;101:6110–5. doi: 10.1073/pnas.0400969101. [DOI] [PMC free article] [PubMed] [Google Scholar]
- 31.Kar-Roy A, Dong W, Michael N, Li Y. Green fluorescence protein as a transcriptional reporter for the long terminal repeats of the human immunodeficiency virus type 1. J Virol Methods. 2000;84:127–38. doi: 10.1016/s0166-0934(99)00122-6. [DOI] [PubMed] [Google Scholar]
- 32.Lissemore JL, Jankowski JT, Thomas CB, Mascotti DP, deHaseth PL. Green fluorescent protein as a quantitative reporter of relative promoter activity in E. coli. Biotechniques. 2000;28:82–4. doi: 10.2144/00281st02. 86, 88–9. [DOI] [PubMed] [Google Scholar]
- 33.Lorenz WW, Cormier MJ, O’Kane DJ, Hua D, Escher AA, Szalay AA. Expression of the Renilla reniformis luciferase gene in mammalian cells. J Biolumin Chemilumin. 1996;11:31–7. doi: 10.1002/(SICI)1099-1271(199601)11:1<31::AID-BIO398>3.0.CO;2-M. [DOI] [PubMed] [Google Scholar]
- 34.Ma L, V, Bindokas P, Kuznetsov A, Rhodes C, Hays L, Edwardson JM, Ueda K, Steiner DF, Philipson LH. Direct imaging shows that insulin granule exocytosis occurs by complete vesicle fusion. Proc Natl Acad Sci U S A. 2004;101:9266–71. doi: 10.1073/pnas.0403201101. [DOI] [PMC free article] [PubMed] [Google Scholar]
- 35.Marshall J, Molloy R, Moss GW, Howe JR, Hughes TE. The jellyfish green fluorescent protein: a new tool for studying ion channel expression and function. Neuron. 1995;14:211–5. doi: 10.1016/0896-6273(95)90279-1. [DOI] [PubMed] [Google Scholar]
- 36.Nguyen VT, Morange M, Bensaude O. Firefly luciferase luminescence assays using scintillation counters for quantitation in transfected mammalian cells. Anal Biochem. 1988;171:404–8. doi: 10.1016/0003-2697(88)90505-2. [DOI] [PubMed] [Google Scholar]
- 37.Nolan GP, Fiering S, Nicolas JF, Herzenberg LA. Fluorescence-activated cell analysis and sorting of viable mammalian cells based on beta-D-galactosidase activity after transduction of Escherichia coli lacZ. Proc Natl Acad Sci U S A. 1988;85:2603–7. doi: 10.1073/pnas.85.8.2603. [DOI] [PMC free article] [PubMed] [Google Scholar]
- 38.Nordeen SK. Luciferase reporter gene vectors for analysis of promoters and enhancers. Biotechniques. 1988;6:454–8. [PubMed] [Google Scholar]
- 39.Norton PA, Coffin JM. Bacterial beta-galactosidase as a marker of Rous sarcoma virus gene expression and replication. Mol Cell Biol. 1985;5:281–90. doi: 10.1128/mcb.5.2.281. [DOI] [PMC free article] [PubMed] [Google Scholar]
- 40.O’Hare P. The virion transactivator of herpes simplex virus. Seminars in Virology. 1993;4:145–56. [Google Scholar]
- 41.Prasher DC, V, Eckenrode K, Ward WW, Prendergast FG, Cormier MJ. Primary structure of the Aequorea victoria green-fluorescent protein. Gene. 1992;111:229–33. doi: 10.1016/0378-1119(92)90691-h. [DOI] [PubMed] [Google Scholar]
- 42.Rizzuto R, Brini M, Pizzo P, Murgia M, Pozzan T. Chimeric green fluorescent protein as a tool for visualizing subcellular organelles in living cells. Curr Biol. 1995;5:635–42. doi: 10.1016/s0960-9822(95)00128-x. [DOI] [PubMed] [Google Scholar]
- 43.Scholz O, Thiel A, Hillen W, Niederweis M. Quantitative analysis of gene expression with an improved green fluorescent protein. p6. Eur J Biochem. 2000;267:1565–70. doi: 10.1046/j.1432-1327.2000.01170.x. [DOI] [PubMed] [Google Scholar]
- 44.Shin HS, Lim HJ, Cha HJ. Quantitative monitoring for secreted production of human interleukin-2 in stable insect Drosophila S2 cells using a green fluorescent protein fusion partner. Biotechnol Prog. 2003;19:152–7. doi: 10.1021/bp0255614. [DOI] [PubMed] [Google Scholar]
- 45.Srikantha T, Klapach A, Lorenz WW, Tsai LK, Laughlin LA, Gorman JA, Soll DR. The sea pansy Renilla reniformis luciferase serves as a sensitive bioluminescent reporter for differential gene expression in Candida albicans. J Bacteriol. 1996;178:121–9. doi: 10.1128/jb.178.1.121-129.1996. [DOI] [PMC free article] [PubMed] [Google Scholar]
- 46.Stearns T. Green fluorescent protein. The green revolution. Curr Biol. 1995;5:262–4. doi: 10.1016/s0960-9822(95)00056-x. [DOI] [PubMed] [Google Scholar]
- 47.Subramanian S, Srienc F. Quantitative analysis of transient gene expression in mammalian cells using the green fluorescent protein. J Biotechnol. 1996;49:137–51. doi: 10.1016/0168-1656(96)01536-2. [DOI] [PubMed] [Google Scholar]
- 48.Triezenberg SJ, Kingsbury RC, McKnight SL. Functional dissection of VP16, the trans-activator of herpes simplex virus immediate early gene expression. Genes & Dev. 1988;2:718–729. doi: 10.1101/gad.2.6.718. [DOI] [PubMed] [Google Scholar]