

Abstract
Identification and quantification of critical quality attributes (CQAs) such as sequence variants and post-translational modifications (PTMs) at the residue level are essential for ensuring the safety and efficacy of monoclonal antibody (mAb) therapeutics. Peptide mapping using liquid chromatography coupled to mass spectrometry (LC-MS) allows for the simultaneous monitoring of multiple CQAs, but conventional methods often suffer from low throughput, limiting their utility in applications requiring fast analysis. Here, we present a multidimensional high-throughput peptide mapping workflow that combines fast LC with cyclic ion mobility-mass spectrometry (LC-cIM-MS) for the high-resolution analysis of mAb tryptic digests. A 15-s LC gradient coupled to single-pass cIM-MS achieved a peak capacity of 490 and allowed for a 96-well plate to be analyzed in 37 min, including time for column re-equilibration and autosampler needle washing between each injection. The method yielded a 97% sequence coverage. Repeatability assessments demonstrated robust retention time, arrival time, and peak intensity reproducibility, and a linear dynamic range was observed across nearly 2 orders of magnitude. Mobility-aligned collision-induced dissociation was used to unambiguously localize PTM sites. The fast LC-cIM-MS platform provided site-specific tracking of the oxidation, deamidation, and isomerization kinetics during forced degradation studies. The method offers an approach to assessing CQAs in high-throughput analysis applications such as stability studies, formulation screening, and process monitoring and has the potential to accelerate mAb development and manufacturing. These results also demonstrate the potential of fast multidimensional separations for complex sample analysis.
Graphical Abstract

INTRODUCTION
Monoclonal antibody (mAb)-based therapeutics have revolutionized modern medicine by offering highly specific treatments for a range of diseases, including cancer, autoimmune disorders, and infectious diseases.1–3 Variations in the primary sequence and post-translational modifications (PTMs) such as glycosylation, glycation, oxidation, deamidation, and aspartic acid (Asp) isomerization to isoasparate (isoAsp) can impact mAb structural integrity, stability, and bioactivity.4,5 These modified forms can negatively affect therapeutic efficacy by disrupting binding affinity, triggering immunogenic responses, or reducing potency, making them critical quality attributes (CQAs) that must be closely monitored during development and manufacturing.6–10 For example, early identification and quantification of CQAs help assess process changes and guide improvements of upstream and downstream processes to minimize undesirable modifications.11,12 CQAs are monitored during stability studies to track product degradation over time and under stress to establish formulation, shelf life, and storage conditions.13 Continuous CQA monitoring is also used as quality control during manufacturing to ensure product integrity and consistency.14
Peptide mapping-based liquid chromatography coupled with mass spectrometry (LC-MS) has become an indispensable tool used to identify and quantify mAb sequence variants and PTMs relative to the unmodified forms in a site-specific manner. In a typical workflow, the mAb is enzymatically digested into peptides, which are then separated by reversed-phase LC and analyzed by MS to identify and quantify the modifications. While rapid protein digestion workflows can now prepare samples in parallel using a multiwell plate format within just a few hours,15,16 typical peptide mapping LC-MS methods require gradient times ranging from 30 min to several hours.17–19 This time was reduced to 5–10 min using high-efficiency capillary electrophoresis as the separation technique prior to MS.20,21 However, further increases in throughput would be beneficial when large datasets are needed to fully understand variability or optimize processes, or when fast analysis times are needed to monitor manufacturing processes in real time. Ultimately, higher achievable throughput could prevent bottlenecks in decision-making and, in turn, decrease the time-to-market and cost of new therapeutics.
Ultrafast chromatographic separations on s to min timescales are now possible by using short columns, high flow rates, and commercially available low-dispersion hardware. The fastest LC separations (<10 s) have been isocratic and have relatively low peak capacity.22–24 Data analysis techniques can be used to deconvolute coeluting analytes to improve effective peak capacity to over 100 in under 1 min.25 Gradient peptide separations on the order of seconds have been achieved in the second dimension of online comprehensive two-dimensional LC (2D-LC).26–30 However, such gradients have also been relatively low peak capacity (e.g., 44 with a 21 s injection cycle time), nor are they coupled to traditional autosamplers for rapid analysis of a series of individual samples. Therefore, they are not suitable for high-throughput peptide mapping.
A potential route to improve the resolution of these fast separations is to couple with an appropriate second dimension separation. High-resolution ion mobility (IM) separations are well suited for this because they are orthogonal to reversed-phase LC and operate on ms to s time scales, sufficient to sample rapidly generated peaks in the first dimension.31,32 The idea of coupling fast LC separations with IM was originally demonstrated with a novel chip LC interfaced to IM for two-dimensional separations of isobaric antidepressants in under 20 s.33
Coupling LC-IM separations with MS allows for more complex biological samples to be analyzed.34,35 LC with a high-resolution structures for lossless ion manipulations (SLIM)-MS platform yielded 96% coverage of a monoclonal antibody sequence using a 20 min LC gradient.36 A more recent study demonstrated that some isobaric peptides can be separated with LC but not high-resolution SLIM, and vice versa, suggesting that the multidimensional LC-IM-MS approach provides selectivity benefits.37 In both of these cases, the 13-m path length and resulting ~1 s IM cycle time of the SLIM platform limited compatibility with fast, subminute LC separations and prevented further increases in throughput.
In this work, we utilize 15-s gradient LC separations with cIM-MS for high-throughput analysis of mAb tryptic digests.38 The 1-m cIM path length increased peak capacity while maintaining IM cycle times fast enough to scan across LC peaks as narrow as ~1 s and yielded an LC-cIM peak capacity of 490. Multipass IM separations provided sufficient resolution to separate isomeric peptides while preserving compatibility with the time scale of ultrafast LC.39 Using this method, we achieved 97% sequence coverage of a mAb with a 15-s separation. Oxidation and deamidation sites were localized on mobility-separated peptides using collision-induced dissociation (CID) in the post-cIM transfer cell. We applied this method to track oxidation and deamidation in forced degradation studies. These results show that relatively complex mixtures can be analyzed at high rates by using fast multidimensional separations. Among other applications, we envision that these approaches can advance biotherapeutic analysis applications that demand rapid processing of many samples in short periods of time, such as cell line development, stability studies, formulation screening, process monitoring, and batch consistency testing.
EXPERIMENTAL SECTION
Materials and Reagents.
NIST IgG1 mAb reference material (RM 8671) was purchased from NIST (Gaithersburg, MD) at 10 mg/mL in 25 mM histidine (pH 6). Optima LC-MS grade water (H2O), acetonitrile (ACN), and formic acid (FA) were purchased from Fisher Scientific (Fair Lawn, NJ). A PeptideWorks tryptic digestion kit containing guanidine hydrochloride (GuHCl), dithiothreitol (DTT), iodoacetamide (IAM), 1 M calcium chloride (CaCl2), and RapiZyme trypsin was provided by Waters (Milford, MA). Micro Bio-Spin P6 columns were purchased from Bio-Rad (Hercules, CA). All other reagents were purchased from Sigma-Aldrich (St. Louis, MO).
Forced Degradation Studies.
For oxidative stress studies, hydrogen peroxide (H2O2) and l-methionine were prepared in water at 10× the intended final concentration (e.g., 45 mM was prepared for an intended 4.5 mM final concentration). Two μL of H2O2 and 2 μL of methionine were added to 16 μL of NIST mAb (10 mg/mL) at the desired concentrations and incubated at ambient temperature. For deamidation and isomerization studies, NIST mAb (10 mg/mL) was buffer exchanged into 25 mM l-histidine (pH 6) or 25 mM tris (pH 9.5) using a P6 spin column and incubated at 37 °C. All reactions were quenched by removing a 10 μL aliquot from the bulk reaction mixture at specified time points and storing it at −80 °C until digestion.
Trypsin Digestion.
Samples were removed from −80 °C and immediately reduced and denatured by diluting 10 μL of mAb solution with 90 μL of 6 M GuHCl in 100 mM tris (pH 7.5), adding 2 μL of 250 mM DTT, and incubating at ambient temperature for 30 min. Alkylation was performed by adding 3 μL of 350 mM IAM and incubating it in the dark at ambient temperature for 30 min. The resulting solution was exchanged into 100 mM tris, 10 mM CaCl2 (pH 7.5) using a P6 spin column. RapiZyme trypsin was then added at a 1:5 trypsin:mAb ratio (w:w), and the mixture was incubated at 37 °C for 30 min. The digestion was quenched by adding FA and ACN to final concentrations of 1% and 5%, respectively. The resulting digestion products were stored at −80 °C until analysis. All digestions for each forced degradation study were performed in parallel.
Instrumentation.
LC separations were performed by using a 1290 Infinity II system from Agilent (Santa Clara, CA). The system was composed of a high-speed binary pump (G7120A), an autosampler (G7167B), and a thermostated column compartment (G7116B). LC separations were performed at a flow rate of 2 mL/min using a Kinetex XB-C18 column (2.1 mm inner diameter × 30 mm length, 2.6 μm) purchased from Phenomenex (Torrance, CA). The column compartment was heated to 50 °C. The JetWeaver mixer in the pump was bypassed to reduce the gradient delay volume. 100 ng of peptides were injected onto the column unless noted otherwise. Agilent ChemStation was used for LC control.
cIM-MS experiments were performed using a Select Series Cyclic Ion Mobility-Mass Spectrometer from Waters. The electrospray ionization source was operated in positive mode under the following conditions: Capillary voltage, 4.0 kV; Cone voltage, 40 V; Source offset, 10 V; Cone gas flow rate, 0 L/h; Desolvation gas flow rate, 1200 L/h; Desolvation gas temperature, 650 °C; Source temperature, 150 °C. The cyclic ion guide was pressurized to 1.76 mbar with nitrogen. The height and velocity of the traveling wave used for single-pass cIM separations were 30 V and 700 m/s, respectively, unless noted otherwise. The height and velocity of the traveling wave used for multipass cIM separations were 22 V and 375 m/s, respectively. The TOF mass analyzer was operated in V mode over 50–2000 m/z and externally calibrated with sodium formate immediately prior to analysis. HDMSE mode was used for mobility-aligned fragmentation, with the transfer collision energy switched between low (5 V) and high (ramping from 20–50 V) collision energy during alternating scans. cIM-MS instrument control and data acquisition were performed using MassLynx v4.2.
Data Analysis.
DriftScope version 3.0 (Waters) was used to generate multidimensional LC-cIM contour plots. Sequence coverage was determined using UNIFI v3.6 (Waters), following previously established identification parameters for the NIST mAb.19 Briefly, sequence coverage was determined at the intact peptide level without fragmentation with a 10 ppm mass accuracy requirement. Peptides cleaved C-terminally at Arg and Lys residues were considered, and two missed cleavages were allowed. Cys carbamidomethylation, Asn succinimide formation and deamidation, N-terminal Gln pyroglutamate formation, Asn glycosylation, Met oxidation, and C-terminal Lys loss were considered as post-translational modifications. For mobility-aligned fragmentation experiments, fragmentation spectra were assigned using Interactive Peptide Spectral Annotator.40 All assignments were verified manually. Raw data files used for sequence coverage determination are available on MassIVE under accession number: MSV000098206.
For quantitative analysis and peak capacity calculations, LC chromatograms and IM spectra were extracted using TWIMExtract v1.6.141,42 and integrated using MatLab. Peak capacity (nc) was calculated as
| (1) |
where tL and tE were the elution times of the latest and earliest eluting analytes, respectively, and w4σ,avg was the average peak width of 15 randomly selected peaks across the elution window.
RESULTS AND DISCUSSION
Developing and Characterizing Fast LC-cIM-MS Separations.
Considerations for developing fast peptide LC separations have been previously described in detail, as fast and efficient separations are crucial for the second dimension of online comprehensive 2D-LC.27,29 Short columns, high flow rates, high column temperatures, and minimized extra-column tubing generally yield the highest separation performance.24 Considering these factors, we deployed a 3 cm column packed with a superficially porous C18 material. The column was heated to 50 °C to improve the analyte diffusion. A relatively high flow rate (2 mL/min) minimized the time required for the gradient and analytes to reach the column while remaining compatible with standard electrospray ionization without flow splitting. Gradient profiles from 15 s to 5 min were adjusted so that analytes eluted across the available separation space. Using eq 1, we calculated LC peak capacities from 27 in 15 s up to 168 in 5 min during separations of a NIST mAb tryptic digest (Figure S1).
For single-pass cIM separations, we tuned the height and velocity of the traveling wave used for separation to balance high cIM resolution and signal intensity with a short cIM cycle time. This approach allowed for good cIM separation while still achieving adequate IM sampling across LC peaks narrower than 1 s. We determined that a wave height of 30 V and a velocity of 700 m/s satisfied these criteria after assessing a broad range of wave height and velocity combinations during single-pass separations (Figure S2). Under these conditions, we calculated a total IM peak capacity of 29 within the full elution window (18–42 ms) using eq 1. Most analytes eluted within a narrower 18–30 ms window, so we also calculated an effective peak capacity of 18 using the 18–30 ms elution window. More sophisticated cIM separation conditions, such as a ramped traveling wave height or velocity, could be utilized in the future to maximize coverage of the IM separation space during single-pass separations.41
After establishing conditions that synchronized the time scales of the LC and cIM separations while maximizing the performance of each separation, the two methods were hyphenated. Figure 1A,B shows examples of LC-cIM separations in 15 s and 1 min, which achieved 97 and 98% sequence coverage, respectively. These results are comparable to those achieved using the commonly used trapped ion mobility-MS approach, which achieved 94% sequence coverage for a tryptic digest of nivolumab with a 45 min LC gradient.43 Sequence coverage maps demonstrate that missing portions of the sequence are small, hydrophilic peptides (Figures 1C, S3). Only one portion of the sequence was detected using the 1-min method that was missed with the 15-s method (Tables S1, S2). The LC-cIM peak capacities obtained in analysis times ranging from 15 s to 5 min are shown in Figure 1D. We calculate a peak capacity of 490 in 15 s with multidimensional LC-cIM, which is comparable to the peak capacity of ~500, which can be achieved in a ~40-min one-dimensional LC separation of peptides.44,45 For further comparison to multidimensional separations, state-of-the-art online comprehensive 2D-LC provides an impressive peak capacity of 10,000 in 4 h during mAb peptide separations.29 This translates to a peak production rate (i.e., peak capacity per unit of time) of 0.7 peaks/s. Our results in Figure 1C provide a peak production rate of 32 peaks/s during the 15-s method. The 2D-LC method offers clear advantages when depth of analysis is the most important factor, such as higher overall peak capacity and limited ionization suppression as the separation occurs preionization. However, the higher peak production rate of the multidimensional LC-cIM method is well suited when high throughput is the most critical factor during analysis of complex samples. Taken together, the high sequence coverage and peak capacity achieved with rapid LC-cIM separations establish the method’s ability to provide comprehensive characterization in shortened analysis times and highlight its utility for high-throughput analysis of complex mixtures.
Figure 1.

Fast LC-cIM-MS separations of a NIST mAb tryptic digest. (A) 15-s and (B) 1 min LC-cIM total ion contour plots. (C) Sequence coverage map obtained using the 15-s method in panel (A), where blue and red indicate covered and missed portions of the sequence, respectively. (D) Effective and total LC-cIM peak capacity as a function of gradient time. Total peak capacity was calculated from the full IM elution window (18–42 ms), while effective peak capacity reflects the elution window where most peptides were detected (18–30 ms). Each gradient profile was tuned so the last analyte eluted at the end of the gradient time. cIM separation was achieved using a wave with a height of 30 V traveling at 700 m/s and a single pass around the cyclic ion guide.
Repeatability and Quantitative Performance.
The repeatability of the 15-s LC-cIM-MS method was evaluated by performing 96 consecutive injections of a NIST mAb tryptic digest. Qualitatively, the total ion current remained consistent across all 96 injections (Figure 2A). Although a 15-s gradient was used for these separations, the total injection cycle time was ~23 s (including a 1-s needle wash) when the next sample was drawn during the preceding gradient (i.e., overlapped injections). This cycle time allowed for the analysis of 96 samples in 37 min. Repeatable retention time and arrival time allow for confident analyte identification and were assessed by monitoring three peptides eluting at early, mid, and late points in the LC and cIM separation windows. The retention times showed minimal variability, with relative standard deviations (RSDs) of 0.5, 0.8, and 1.6% (Figure 2B). Arrival times also displayed excellent repeatability with RSDs below 0.1% for the three peptides (Figure 2C).
Figure 2.
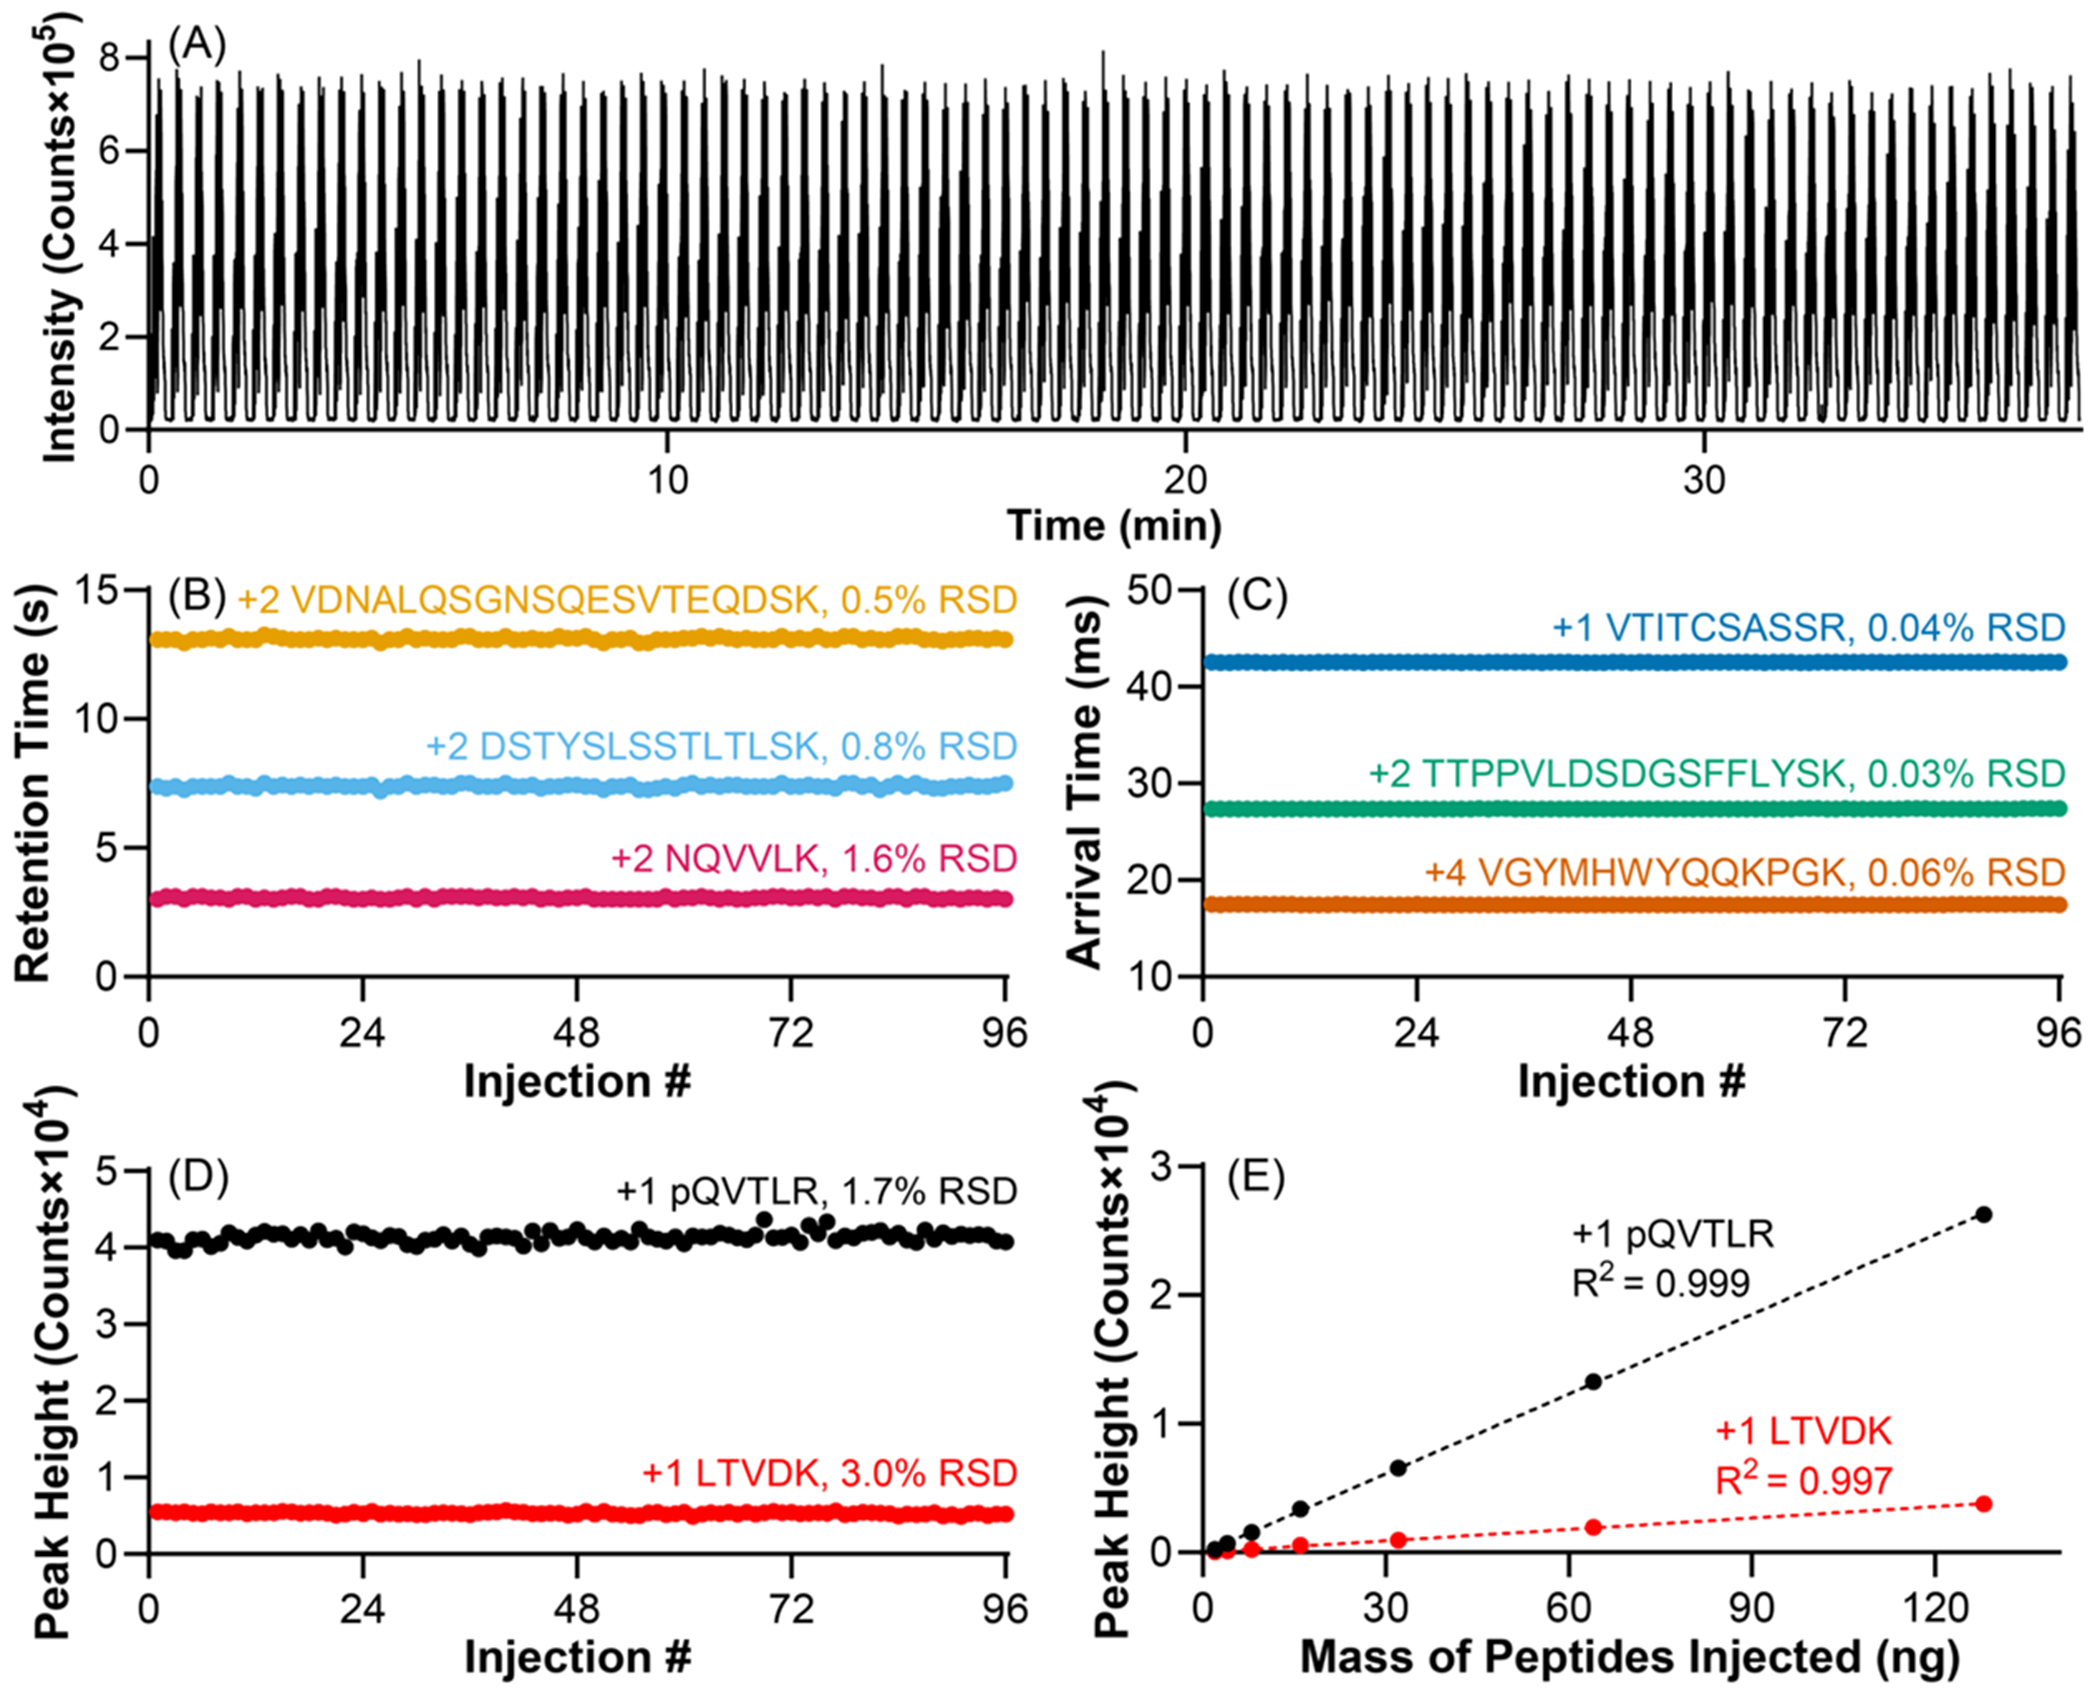
Repeatability and quantitative performance of a 15-s LC-cIM-MS method with single-pass cIM separation. (A) Total ion current from 96 consecutive mAb tryptic digest separations in a single cIM-MS acquisition. (B) LC retention time repeatability for three peptides eluting at different points in the gradient. (C) IM arrival time repeatability for three peptides eluting across the IM separation window. (D) Peak height repeatability for a high-intensity peptide and another at ~10% of the maximum signal intensity. (E) Linear correlation between peptide mass injected and peak height for the peptides assessed in panel (D). Data points in panel (E) represent the average of n = 5 replicates (error bars were too small to be seen).
Peak height repeatability is important for reliable quantitative analysis and was assessed for both a high-intensity peptide and a lower-abundance peptide at approximately 10% of the maximum signal intensity. The high-intensity peptide exhibited an RSD of 1.7%, while the lower-intensity peptide displayed an RSD of 3.0% (Figure 2D), suggesting reliable quantitation can be achieved even for low-abundance peptides. The linearity and dynamic range of the method was investigated by plotting peak height as a function of peptide mass injected on the column (Figure 2E). A strong linear correlation was observed for both peptides (R2 > 0.997) over nearly 2 orders of magnitude. The limits of detection (LOD) for these correlations indicate the high- and low-intensity peptides are detectable with greater than 3.3 and 7.3 ng of total peptide injected, respectively, where LOD was calculated as . When injecting larger amounts of peptides, we observed a nonlinear increase in response (Figure S4), possibly as a result of ionization suppression due to coelution using the 15-s gradient. These undesirable effects were mitigated when injecting <100 ng of peptides. Overall, the good repeatability of signal intensity and linear increase in signal intensity with mass of peptides injected confirms the suitability of the method for relative quantification.
It may be possible to further reduce the 23 s cycle time. While the 8 s following the gradient allowed for column re-equilibration, previous work has shown that only 1–2 column volumes of initial mobile phase are needed for repeatable column re-equilibration (2–4 s at 2 mL/min).26,46 Also, we recently developed a high-throughput LC injector system that uses droplet microfluidics for sample introduction, which could be used to reduce the 23-s cycle time further.47,48
High-Throughput Assessment of Forced Degradation.
Forced degradation studies are essential for identifying potential degradation pathways and ensuring the development of robust formulations that maintain efficacy and safety over time.49 During these studies, a large number of samples are generated across diverse stress conditions to provide an understanding of degradation kinetics, identify subtle formulation differences that may influence long-term stability, and reduce the risk of unexpected stability issues during manufacturing, storage, or patient use. However, the number of conditions that can be assessed is limited by the speed of the analysis method. We therefore performed two forced degradation studies to highlight the utility of the rapid LC-cIM-MS peptide mapping method using samples relevant to high-throughput analysis; the first was an oxidation study. Oxidation is the one of the most prevalent PTMs in therapeutic mAbs, and even low levels of oxidation at critical sites can significantly affect pharmacokinetics, reduce therapeutic efficacy, or evoke immunogenic responses.50 Understanding site-specific oxidation and its progression under stress conditions is crucial for predicting long-term stability and guiding formulation strategies.51 Chemical oxidation can be induced during forced degradation studies by exposing a mAb to oxidizing agents such as H2O2 or tertiary butyl hydroperoxide for methionine-specific oxidation or 2,2′-azobis(2-amidinopropane) dihydrochloride for tryptophan oxidation.49
Our forced oxidation study aimed at probing the effects of H2O2 and methionine excipient concentrations on site-specific oxidation over time. Methionine is sometimes added to mAb formulations as an antioxidant.52,53 Two peptides containing methionine residues susceptible to oxidation under these conditions were tracked. The first, DTLMISR, contains Met255 and is located in the conserved region of the IgG sequence involved in binding with the neonatal Fc receptor (FcRn),54 which protects IgGs from degradation in the lysosome.55 Oxidation at Met255 can impair pharmacokinetics by disrupting FcRn interactions.56,57 The second, DMIFN-FYFDVWGQGTTVTVSSASTK, contains Met101 located in the complementary determining region and may impact antigen binding.54 For example, oxidation of similarly located Met105 reduced functionality of pembrolizumab, an IgG programmed death 1 inhibitor.58
Results from the analysis of the oxidized samples are listed in Figure 3. Unmodified and oxidized DTLMISR and DMIFN-FYFDVWGQGTTVTVSSASTK were separated using a 15-s gradient (Figure 3A,B). Figure 3A,B shows that approximately six cIM scans are acquired across each peak as they elute from the LC column. DTLMISR only contains one site that is typically susceptible to oxidation. While the conditions employed in the forced degradation study are expected to induce methionine oxidation,49 DMIFN-FYFDVWGQGTTVTVSSASTK contains other residues, e.g., tryptophan, that are also commonly oxidized.50 We confirmed that the oxidation event occurred on Met101 using mobility-aligned CID in the transfer collision cell following the cyclic ion guide (Figure 3C). The fragmentation spectrum revealed extensive backbone fragmentation and sufficient fragment ion intensity despite the short, 15-s gradient time and narrow peak width.
Figure 3.
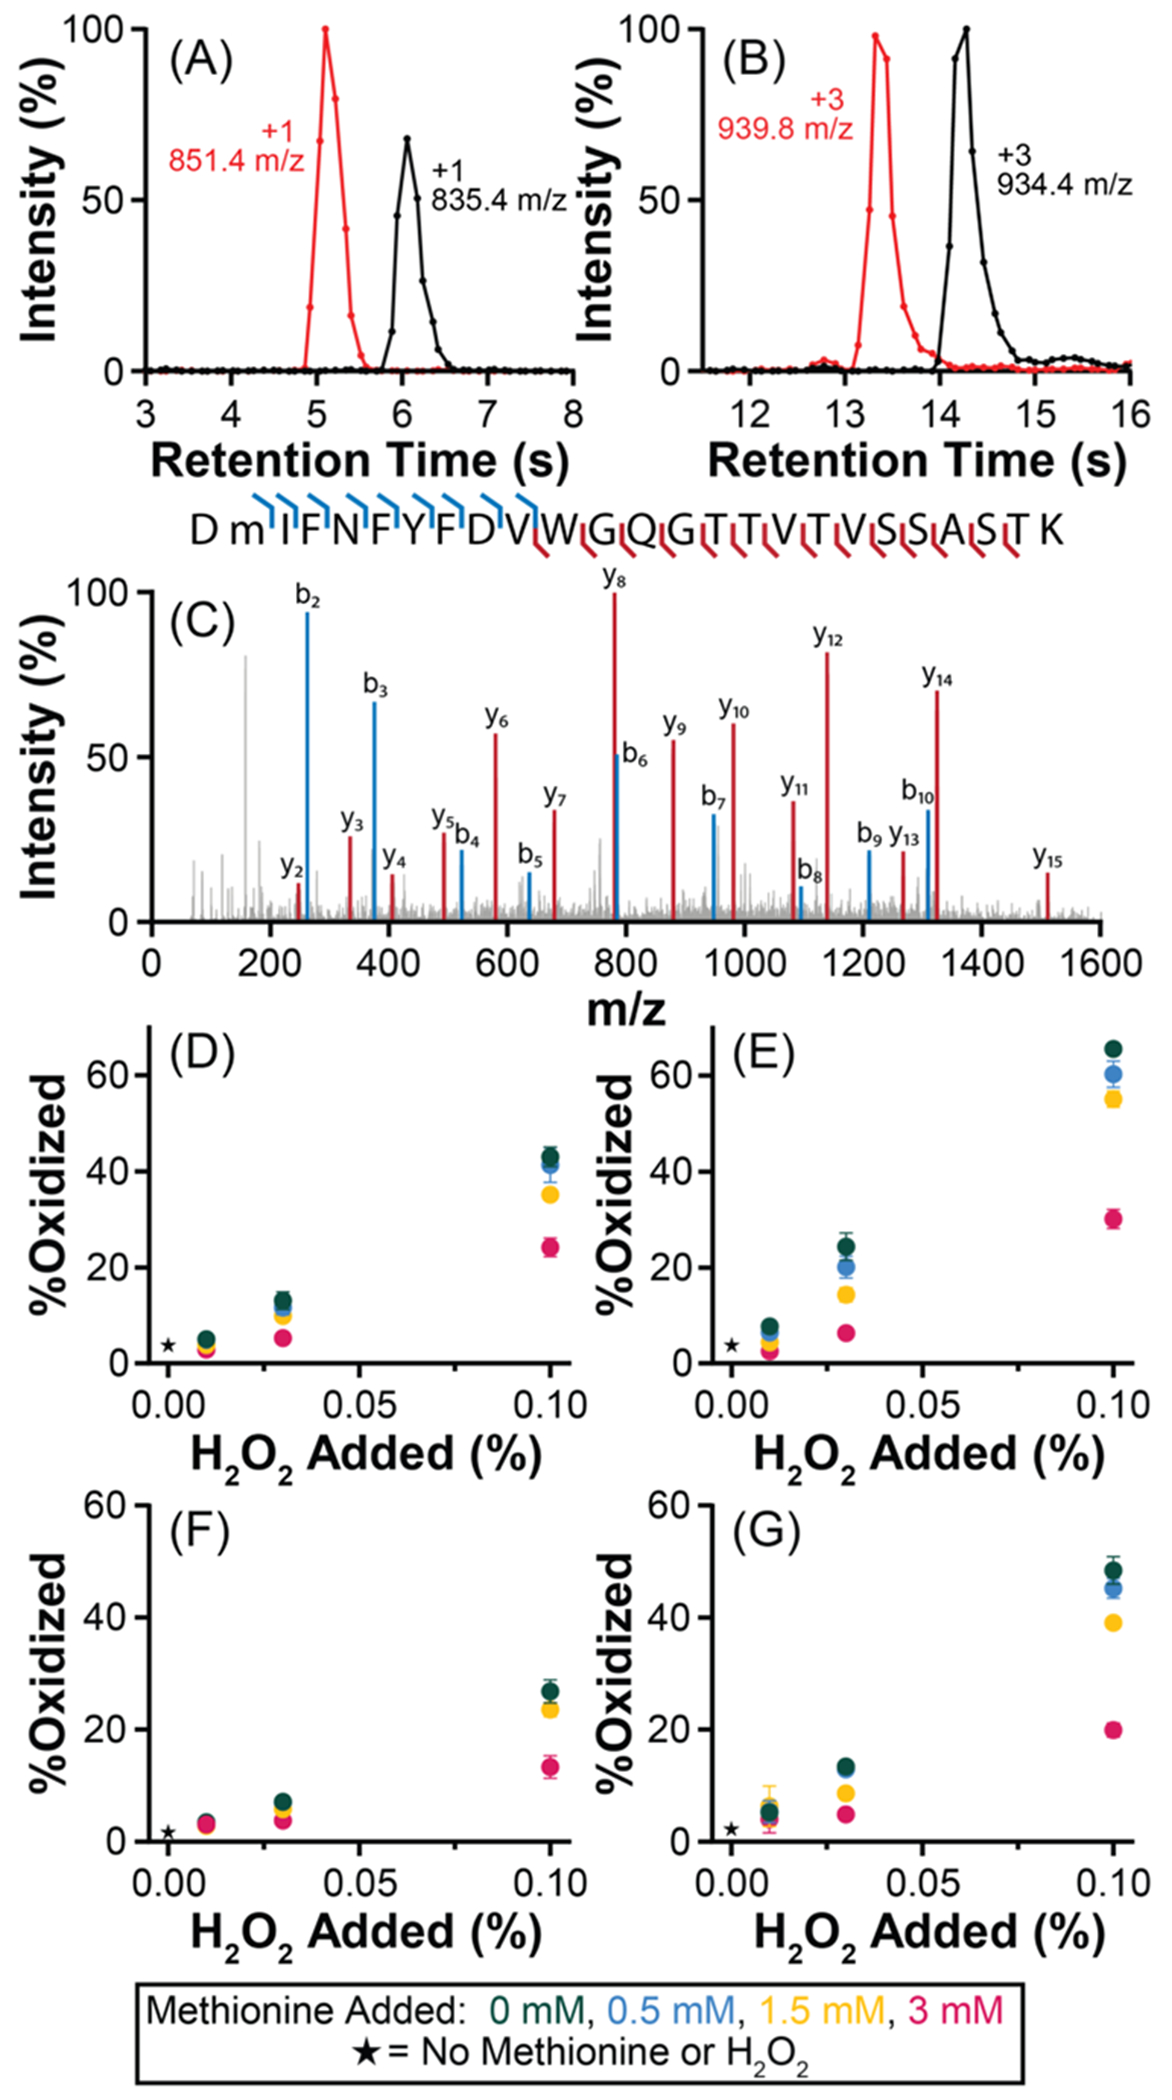
Tracking NIST mAb oxidation using a 15-s LC-cIM-MS method with single-pass cIM separation. Extracted ion chromatograms displaying separation of unmodified and oxidized (A) DTLMISR and (B) DMIFNFYFDVWGQGTTVTVSSASTK peptides after stress with 0.1% H2O2 for 12 h. (C) Mobility-aligned fragmentation spectrum of oxidized DMIFNFYFDVWGQGTTVTVSSASTK. Change in abundance of the oxidized form of DTLMISR following incubation with H2O2 and methionine excipient for (D) 6 h and (E) 12 h. Change in abundance of the oxidized form of DMIFNFYFDVWGQGTTVTVSSASTK following incubation with H2O2 and methionine excipient for (F) 6 h and (G) 12 h. Error bars represent the standard deviation of n = 5 replicates.
After demonstration that the 15-s LC-cIM-MS method can detect oxidized peptides, it was used to analyze samples from the full forced oxidation study. Changes in abundance of the oxidized form of DTLMISR and DMIFN-FYFDVWGQGTTVTVSSASTK following incubation with H2O2 and methionine excipient for 6 or 12 h are shown in Figure 3D–G. Higher levels of H2O2 and longer incubation times led to increased oxidation of both sites, and higher levels of methionine excipient suppressed oxidation, as expected. Additionally, we observed that DTLMISR was more susceptible to oxidation than DMIFN-FYFDVWGQGTTVTVSSASTK. This trend aligns with a previous interlaboratory study on NIST mAb oxidation in the presence of H2O2,59 indicating that reliable results are achieved using the 15-s LC-cIM-MS method.
Next, we performed a forced degradation study intended to induce Asn deamidation and isomerization of Asp to isoAsp. Asn deamidation and Asp/isoAsp isomerization are CQAs that can impact activity, immunogenicity, antigen binding, and half-life of mAb therapeutics.60–62 Asn deamidation at basic pH involves formation of a succinimide intermediate, which undergoes hydrolysis to Asp and isoAsp.61 Asn deamidation and Asp/isoAsp isomerization are particularly challenging PTMs to characterize at a site-specific level using MS, as Asp and isoAsp are isomeric, and deamidation leads to a 0.984 Da increase in mass, causing the 12C isotope peak of the deamidated form to be unresolved from the 13C isotope peak of the unmodified form. Alternative fragmentation techniques, such as electron-based approaches,63,64 radical directed dissociation,65,66 and ultraviolet photodissociation,67 have been used to differentiate deamidation and isomerization products; however, these techniques do not always yield diagnostic fragment ions for each product. Therefore, quantitative MS methods must rely on separating deamidated and isomerized peptides from their corresponding unmodified peptides before they reach the MS. High-resolution IM has emerged as a powerful technique for separating deamidated and isomerized peptides on the ms to s timescale,36,37,39,68–70 suggesting the rapid LC-cIM-MS approach could be to characterize deamidation and isomerization products with high throughput.
Our forced deamidation and isomerization study targeted the influence of the pH on site-specific deamidation and isomerization over time. The rapid LC-cIM-MS method was used to track the deamidation and isomerization of the FNWYVDGVEVHNAK peptide, which has two Asn residues susceptible to deamidation. Extracted ion chromatograms for mAb samples incubated at pH 6 and pH 9.5 for 9 days revealed no separation of degradation products in the chromatographic dimension (Figure S5). However, multipass LC-cIM separation resolved new signals corresponding to deamidation (+0.98 Da) and isomerization (no m/z shift) at pH 9.5 that were not observed in the sample incubated at pH 6 (Figure 4A, B). Mass spectra for each of these signals are shown in Figure S6. Mobility-aligned fragmentation of the 560.3 m/z signal in Figure 4B localized the deamidation event to Asn289 (Figure 4C). The 559.9 m/z signal in Figure 4B was isomeric to the main signal corresponding to the unmodified peptide present and therefore could not be identified using mobility-aligned CID. One possible assignment for this signal is that it could have been a result of the isomerization of Asp283. The site of this isomerization could be more confidently identified in future studies using CID prior to the mobility separator.39,70,71
Figure 4.

Tracking deamidation and isomerization of the FNWYVDGVEVHNAK peptide using a 15-s LC-cIM-MS method with multipass cIM separation. Extracted 1–4 pass IM spectra for samples incubated at (A) pH 6 and (B) pH 9.5 for 9 days. 1–4 pass data were obtained by setting the cIM separation time to 2, 8, 14, or 20 ms. (C) Mobility-aligned fragmentation of the 560.3 m/z signal shown in panel (B). Changes in abundance of the (D) deamidation and (E) isomerization products over time, quantified using 4-pass cIM separation. Error bars represent the standard deviation of n = 5 replicates.
Finally, we used the 15-s LC-cIM-MS method with 4 passes of separation to track deamidation and isomerization of FNWYVDGVEVHNAK over 11 days in the recommended formulation buffer at pH 6 and at pH 9.5. No notable change in deamidation or isomerization was observed in the sample incubated at pH 6 (Figure 4D). At pH 9.5, increases in abundance of both the deamidation and isomerization products were observed over the course of the experiment (Figure 4E), which is consistent with previous studies establishing that Asn deamidation and Asp/isoAsp isomerization are accelerated at basic pH.49,72 These results demonstrate the power of multipass LC-cIM-MS for monitoring mAb degradation products that are difficult to distinguish using MS alone.
CONCLUSIONS
In this work, fast LC-cIM-MS was used as a high-throughput peptide mapping platform for mAb characterization. The two-dimensional separation achieved peak capacity for peptides comparable to that of 40-min gradient separations. The good resolution of the 15-s method generated a 97% sequence coverage while maintaining good reproducibility and quantitation. The achievable throughput allowed for a 96-well plate to be analyzed by peptide mapping in 37 min. We applied the method to the analysis of samples from two forced degradation studies where oxidized, deamidated, and isomerized degradation products were tracked over time in the presence of different chemical stress conditions. These results indicate that complex mAb digests can be separated using a multidimensional LC-cIM-MS approach in greatly shortened analysis times while maintaining information content and robustness compared to conventional methods. These capabilities have the potential to greatly accelerate biopharmaceutical development.
While these initial results demonstrate that high-throughput peptide mapping is possible, we foresee building on this workflow in several ways. This method can be expanded to other protein therapeutics such as vaccines, bispecific antibodies, and antibody-drug conjugates. Additionally, other studies have investigated the ability of high-resolution IM to separate deamidation and isomerization products.37,39 While many can be separated with high-resolution IM, it is evident that current platforms cannot separate peptides with these modifications. Strategies such as fragmentation prior to IM separation or alternative enzymes to trypsin could be integrated into a method development workflow to yield different sequences that might be easier to resolve using this workflow.39,70,71 Lastly, we expect that continued advancements in MS acquisition speeds will enable even higher throughput and facilitate the analysis of more complex proteomics samples within shorter timeframes.73–75 Alternative methods with IM separation may also become more important, such as using top-down and subunit-level methods to characterize mAb-based therapeutics as has been done using trapped ion mobility-MS.76–78
Supplementary Material
The Supporting Information is available free of charge at https://pubs.acs.org/doi/10.1021/acs.analchem.5c00741.
LC peak capacity; single-pass cIM resolving power; additional quantitative data; additional chromatograms and mass spectra (PDF)
ACKNOWLEDGMENTS
This work was supported by the National Institutes of Health under grant number R01GM150948 (R.T.K.) and the National Science Foundation Graduate Research Fellowship Program under grant number DGE-1841052 (D.M.M.). The University of Michigan Biosciences Initiative Core Facilities Funding Program provided access to the cIM-MS instrument. Roy Martin (Waters) is thanked for providing access to the UNIFI software, and Nicole Lawrence (Waters) is thanked for providing the PeptideWorks digestion kit.
Footnotes
The authors declare no competing financial interest.
Complete contact information is available at: https://pubs.acs.org/10.1021/acs.analchem.5c00741
Contributor Information
Devin M. Makey, Department of Chemistry, University of Michigan, Ann Arbor, Michigan 48109, United States
Brandon T. Ruotolo, Department of Chemistry, University of Michigan, Ann Arbor, Michigan 48109, United States
Robert T. Kennedy, Department of Chemistry, University of Michigan, Ann Arbor, Michigan 48109, United States; Department of Pharmacology, University of Michigan, Ann Arbor, Michigan 48109, United States
REFERENCES
- (1).Qian L; Lin X; Gao X; Khan RU; Liao J-Y; Du S; Ge J; Zeng S; Yao SQ Chem. Rev 2023, 123 (12), 7782–7853. [DOI] [PubMed] [Google Scholar]
- (2).Martin KP; Grimaldi C; Grempler R; Hansel S; Kumar S mAbs 2023, 15 (1), No. 2191301. [DOI] [PMC free article] [PubMed] [Google Scholar]
- (3).Lu R-M; Hwang Y-C; Liu I-J; Lee C-C; Tsai H-Z; Li H-J; Wu H-C J. Biomed. Sci 2020, 27 (1), No. 1. [DOI] [PMC free article] [PubMed] [Google Scholar]
- (4).Raju TS Co- and Post-Translational Modifications of Therapeutic Antibodies and Proteins; John Wiley & Sons, 2019. [Google Scholar]
- (5).Borisov OV; Alvarez M; Carroll JA; Brown PW Sequence Variants and Sequence Variant Analysis in Biotherapeutic Proteins. In State-of-the-Art and Emerging Technologies for Therapeutic Monoclonal Antibody Characterization Vol. 2. Biopharmaceutical Characterization: The NISTmAb Case Study, ACS Symposium Series; American Chemical Society, 2015; Vol. 1201, pp 63–117 DOI: 10.1021/bk-2015-1201.ch002. [DOI] [Google Scholar]
- (6).Goetze AM; Schenauer MR; Flynn GC mAbs 2010, 2 (5), 500–507. [DOI] [PMC free article] [PubMed] [Google Scholar]
- (7).Eon-Duval A; Broly H; Gleixner R Biotechnol. Prog 2012, 28 (3), 608–622. [DOI] [PubMed] [Google Scholar]
- (8).Yu LX; Amidon G; Khan MA; Hoag SW; Polli J; Raju GK; Woodcock J AAPS J. 2014, 16 (4), 771–783. [DOI] [PMC free article] [PubMed] [Google Scholar]
- (9).Jefferis R J. Immunol. Res 2016, 2016 (1), No. 5358272. [DOI] [PMC free article] [PubMed] [Google Scholar]
- (10).Wen Y; Jawa VJ Pharm. Sci 2021, 110 (3), 1025–1041. [DOI] [PubMed] [Google Scholar]
- (11).Holm P; Allesø M; Bryder MC; Holm R ICHQ8(R2): Pharmaceutical Development. In ICH Quality Guidelines; John Wiley & Sons, Ltd, 2017; pp 535–577 DOI: 10.1002/9781118971147.ch20. [DOI] [Google Scholar]
- (12).Elder D; Teasdale A ICHQ9: Quality Risk Management. In ICH Quality Guidelines; John Wiley & Sons, Ltd, 2017; pp 579–610 DOI: 10.1002/9781118971147.ch21. [DOI] [Google Scholar]
- (13).Rignall A ICHQ1A(R2) Stability Testing of New Drug Substance and Product and Q1C Stability Testing of New Dosage Forms. In ICH Quality Guidelines; John Wiley & Sons, Ltd, 2017; pp 3–44 DOI: 10.1002/9781118971147.ch1. [DOI] [Google Scholar]
- (14).Ogilvie R ICHQ11: Development and Manufacture of Drug Substance. In ICH Quality Guidelines; John Wiley & Sons, Ltd, 2017; pp 639–665 DOI: 10.1002/9781118971147.ch23. [DOI] [Google Scholar]
- (15).Muriithi B; Ippoliti S; Finny A; Addepalli B; Lauber MJ Proteome Res. 2024, 23 (11), 5221–5228. [DOI] [PMC free article] [PubMed] [Google Scholar]
- (16).Napoletano L LCGC Int. 2024, 20, 16–20. [Google Scholar]
- (17).Wang W; Meeler AR; Bergerud LT; Hesselberg M; Byrne M; Wu Z Int. J. Mass Spectrom 2012, 312, 107–113. [Google Scholar]
- (18).Kori Y; Patel R; Neill A; Liu HJ Chromatogr. B 2016, 1009–1010, 107–113. [DOI] [PubMed] [Google Scholar]
- (19).Mouchahoir T; Schiel JE Anal. Bioanal. Chem 2018, 410 (8), 2111–2126. [DOI] [PMC free article] [PubMed] [Google Scholar]
- (20).Dykstra AB; Flick TG; Lee B; Blue LE; Angell NJ Am. Soc. Mass Spectrom 2021, 32 (8), 1952–1963. [DOI] [PubMed] [Google Scholar]
- (21).Cao L; Fabry D; Lan KJ Pharm. Biomed. Anal 2021, 204, No. 114251. [DOI] [PubMed] [Google Scholar]
- (22).Wahab MF; Wimalasinghe RM; Wang Y; Barhate CL; Patel DC; Armstrong DW Anal. Chem 2016, 88 (17), 8821–8826. [DOI] [PubMed] [Google Scholar]
- (23).Wahab MF; Roy D; Armstrong DW Anal. Chim. Acta 2021, 1151, No. 238170. [DOI] [PubMed] [Google Scholar]
- (24).Kaplitz AS; Kresge GA; Selover B; Horvat L; Franklin EG; Godinho JM; Grinias KM; Foster SW; Davis JJ; Grinias JP Anal. Chem 2020, 92 (1), 67–84. [DOI] [PubMed] [Google Scholar]
- (25).Hellinghausen G; Wahab MF; Armstrong DW Anal. Bioanal. Chem 2020, 412 (8), 1925–1932. [DOI] [PubMed] [Google Scholar]
- (26).Schellinger AP; Stoll DR; Carr PW J. Chromatogr. A 2005, 1064 (2), 143–156. [DOI] [PubMed] [Google Scholar]
- (27).Stoll DR; Carr PW J. Am. Chem. Soc 2005, 127 (14), 5034–5035. [DOI] [PubMed] [Google Scholar]
- (28).Carr PW; Stoll DR; Wang X Anal. Chem 2011, 83 (6), 1890–1900. [DOI] [PMC free article] [PubMed] [Google Scholar]
- (29).Stoll DR; Lhotka HR; Harmes DC; Madigan B; Hsiao JJ; Staples GOJ Chromatogr. B 2019, 1134–1135, No. 121832. [DOI] [PubMed] [Google Scholar]
- (30).Stoll DR; Cohen JD; Carr PW J. Chromatogr. A 2006, 1122 (1–2), 123–137. [DOI] [PubMed] [Google Scholar]
- (31).Dodds JN; Baker ES J. Am. Soc. Mass Spectrom 2019, 30 (11), 2185–2195. [DOI] [PMC free article] [PubMed] [Google Scholar]
- (32).Lee D-S; Wu C; Hill HH J. Chromatogr. A 1998, 822 (1), 1–9. [Google Scholar]
- (33).Piendl SK; Raddatz C-R; Hartner NT; Thoben C; Warias R; Zimmermann S; Belder D Anal. Chem 2019, 91 (12), 7613–7620. [DOI] [PubMed] [Google Scholar]
- (34).Valentine SJ; Kulchania M; Barnes CAS; Clemmer DE Int. J. Mass Spectrom 2001, 212 (1), 97–109. [Google Scholar]
- (35).King AM; Trengove RD; Mullin LG; Rainville PD; Isaac G; Plumb RS; Gethings LA; Wilson IDJ Chromatogr. A 2020, 1611, No. 460597. [DOI] [PubMed] [Google Scholar]
- (36).Arndt JR; Wormwood Moser KL; Van Aken G; Doyle RM; Talamantes T; DeBord D; Maxon L; Stafford G; Fjeldsted J; Miller B; Sherman MJ Am. Soc. Mass Spectrom 2021, 32 (8), 2019–2032. [DOI] [PubMed] [Google Scholar]
- (37).Dykstra AB; Lubinsky TG; Vitrac H; Campuzano IDG; Bondarenko PV; Simone AR Anal. Chem 2025, 97, 749. [DOI] [PubMed] [Google Scholar]
- (38).Giles K; Ujma J; Wildgoose J; Pringle S; Richardson K; Langridge D; Green M Anal. Chem 2019, 91 (13), 8564–8573. [DOI] [PubMed] [Google Scholar]
- (39).Tomczyk N; Giles K; Richardson K; Ujma J; Palmer M; Nielsen PK; Haselmann KF Anal. Chem 2021, 93 (49), 16379–16384. [DOI] [PubMed] [Google Scholar]
- (40).Brademan DR; Riley NM; Kwiecien NW; Coon JJ Mol. Cell. Proteom 2019, 18 (8, Supplement 1), S193–S201. [DOI] [PMC free article] [PubMed] [Google Scholar]
- (41).Haynes SE; Polasky DA; Dixit SM; Majmudar JD; Neeson K; Ruotolo BT; Martin BR Anal. Chem 2017, 89 (11), 5669–5672. [DOI] [PMC free article] [PubMed] [Google Scholar]
- (42).Jeon CK; Rojas Ramirez C; Makey DM; Kurulugama RT; Ruotolo BT J. Am. Soc. Mass Spectrom 2024, 35 (8), 1865–1874. [DOI] [PubMed] [Google Scholar]
- (43).Suckau D; Evers W; Belau E; Pengelley S; Resemann A; Tang W; Sen KI; Wagner E; Colas O; Beck A Use of PASEF for Accelerated Protein Sequence Confirmation and De Novo Sequencing with High Data Quality. In Therapeutic Antibodies; Humana: New York, NY, 2022; pp 207–217 DOI: 10.1007/978-1-0716-1450-1_12. [DOI] [PubMed] [Google Scholar]
- (44).Ruta J; Guillarme D; Rudaz S; Veuthey J-LJ Sep. Sci 2010, 33 (16), 2465–2477. [DOI] [PubMed] [Google Scholar]
- (45).De Vos J; Stassen C; Vaast A; Desmet G; Eeltink SJ Chromatogr. A 2012, 1264, 57–62. [DOI] [PubMed] [Google Scholar]
- (46).Schellinger AP; Stoll DR; Carr PW J. Chromatogr. A 2008, 1192 (1), 41–53. [DOI] [PMC free article] [PubMed] [Google Scholar]
- (47).Makey DM; Diehl RC; Xin Y; Murray BE; Stoll DR; Ruotolo BT; Grinias JP; Narayan ARH; Lopez-Carillo V; Stark M; et al. Anal. Chem 2023, 95 (46), 17028–17036. [DOI] [PMC free article] [PubMed] [Google Scholar]
- (48).Xin Y; Foster SW; Makey DM; Parker D; Bradow J; Wang X; Berritt S; Mongillo R; Grinias JP; Kennedy RT Anal. Chem 2024, 96, 4693. [DOI] [PMC free article] [PubMed] [Google Scholar]
- (49).Nowak C; K Cheung J; M Dellatore S; Katiyar A; Bhat R; Sun J; Ponniah G; Neill A; Mason B; Beck A; Liu H mAbs 2017, 9 (8), 1217–1230. [DOI] [PMC free article] [PubMed] [Google Scholar]
- (50).Gupta S; Jiskoot W; Schöneich C; Rathore AS J. Pharm. Sci 2022, 111 (4), 903–918. [DOI] [PubMed] [Google Scholar]
- (51).Li X; Xu W; Wang Y; Zhao J; Liu Y-H; Richardson D; Li H; Shameem M; Yang XJ Chromatogr. A 2016, 1460, 51–60. [DOI] [PubMed] [Google Scholar]
- (52).Dion MZ; Leiske D; Sharma VK; Zuch De Zafra CL; Salisbury CM Pharm. Res 2018, 35 (11), No. 222. [DOI] [PubMed] [Google Scholar]
- (53).Strickley RG; Lambert WJ J. Pharm. Sci 2021, 110 (7), 2590–2608. e56 [DOI] [PubMed] [Google Scholar]
- (54).Formolo T; Ly M; Levy M; Kilpatrick L; Lute S; Phinney K; Marzilli L; Brorson K; Boyne M; Davis D et al. Determination of the NISTmAb Primary Structure. In State-of-the-Art and Emerging Technologies for Therapeutic Monoclonal Antibody Characterization Vol. 2. Biopharmaceutical Characterization: The NISTmAb Case Study, ACS Symposium Series; American Chemical Society, 2015; Vol. 1201, pp 1–62 DOI: 10.1021/bk-2015-1201.ch001. [DOI] [Google Scholar]
- (55).Junghans RP; Anderson CL Proc. Natl. Acad. Sci. U.S.A 1996, 93 (11), 5512–5516. [DOI] [PMC free article] [PubMed] [Google Scholar]
- (56).Pan H; Chen K; Chu L; Kinderman F; Apostol I; Huang G Protein Sci. 2009, 18 (2), 424–433. [DOI] [PMC free article] [PubMed] [Google Scholar]
- (57).Gao X; Ji JA; Veeravalli K; John Wang Y; Zhang T; Mcgreevy W; Zheng K; Kelley RF; Laird MW; Liu J; Cromwell MJ Pharm. Sci 2015, 104 (2), 368–377. [DOI] [PubMed] [Google Scholar]
- (58).Tang L; Geng H; Zhang L; Wang X; Fei M; Yang B; Sun H; Zhang Z ACS Pharmacol. Transl. Sci 2024, 7 (8), 2476–2483. [DOI] [PMC free article] [PubMed] [Google Scholar]
- (59).Li W; Kerwin JL; Schiel J; Formolo T; Davis D; Mahan A; Benchaar SA Structural Elucidation of Post-Translational Modifications in Monoclonal Antibodies. In State-of-the-Art and Emerging Technologies for Therapeutic Monoclonal Antibody Characterization Vol. 2. Biopharmaceutical Characterization: The NISTmAb Case Study, ACS Symposium Series; American Chemical Society, 2015; Vol. 1201, pp 119–183 DOI: 10.1021/bk-2015-1201.ch003. [DOI] [Google Scholar]
- (60).Cacia J; Keck R; Presta LG; Frenz J Biochem. 1996, 35 (6), 1897–1903. [DOI] [PubMed] [Google Scholar]
- (61).Gervais D. J. Chem. Technol. Biotechnol 2016, 91 (3), 569–575. [Google Scholar]
- (62).Zeunik R; Ryuzoji AF; Peariso A; Wang X; Lannan M; Spindler LJ; Knierman M; Copeland V; Patel C; Wen YJ Pharm. Sci 2022, 111 (8), 2217–2229. [DOI] [PubMed] [Google Scholar]
- (63).O’Connor PB; Cournoyer JJ; Pitteri SJ; Chrisman PA; McLuckey SA J. Am. Soc. Mass Spectrom 2006, 17 (1), 15–19. [DOI] [PubMed] [Google Scholar]
- (64).Li X; Lin C; O’Connor PB Anal. Chem 2010, 82 (9), 3606–3615. [DOI] [PMC free article] [PubMed] [Google Scholar]
- (65).Riggs DL; Gomez SV; Julian RR ACS Chem. Biol 2017, 12 (11), 2875–2882. [DOI] [PMC free article] [PubMed] [Google Scholar]
- (66).Riggs DL; Silzel JW; Lyon YA; Kang AS; Julian RR Anal. Chem 2019, 91 (20), 13032–13038. [DOI] [PMC free article] [PubMed] [Google Scholar]
- (67).Bashyal A; Hui JO; Flick T; Dykstra AB; Zhang Q; Campuzano IDG; Brodbelt JS Anal. Chem 2023, 95 (30), 11510–11517. [DOI] [PMC free article] [PubMed] [Google Scholar]
- (68).Zheng X; Deng L; S Baker E; M Ibrahim Y; A Petyuk V; D Smith R Chem. Commun 2017, 53 (56), 7913–7916. [DOI] [PMC free article] [PubMed] [Google Scholar]
- (69).Butler KE; Dodds JN; Flick T; Campuzano IDG; Baker ES Anal. Chem 2022, 94 (16), 6191–6199. [DOI] [PMC free article] [PubMed] [Google Scholar]
- (70).Gibson K; Cooper-Shepherd DA; Pallister E; Inman SE; Jackson SE; Lindo VJ Am. Soc. Mass Spectrom 2022, 33 (7), 1204–1212. [DOI] [PMC free article] [PubMed] [Google Scholar]
- (71).Jia C; Lietz CB; Yu Q; Li L Anal. Chem 2014, 86 (6), 2972–2981. [DOI] [PMC free article] [PubMed] [Google Scholar]
- (72).Lu X; Nobrega RP; Lynaugh H; Jain T; Barlow K; Boland T; Sivasubramanian A; Vásquez M; Xu Y mAbs 2019, 11 (1), 45–57. [DOI] [PMC free article] [PubMed] [Google Scholar]
- (73).Szyrwiel L; Gille C; Mülleder M; Demichev V; Ralser M Proteomics. 2024, 24 (1–2), No. 2300100. [DOI] [PubMed] [Google Scholar]
- (74).Peters-Clarke TM; Coon JJ; Riley NM Anal. Chem 2024, 96 (20), 7976–8010. [DOI] [PMC free article] [PubMed] [Google Scholar]
- (75).Stewart HI; Grinfeld D; Giannakopulos A; Petzoldt J; Shanley T; Garland M; Denisov E; Peterson AC; Damoc E; Zeller M; et al. Anal. Chem 2023, 95 (42), 15656–15664. [DOI] [PMC free article] [PubMed] [Google Scholar]
- (76).Schairer J; Römer J; Lang D; Neusüß C Anal. Bioanal. Chem 2024, 416 (7), 1599–1612. [DOI] [PMC free article] [PubMed] [Google Scholar]
- (77).Fiala J; Schuster D; Ollivier S; Pengelley S; Lubeck M; Busch F; Jankevics A; Raether O; Greisch J-F; Heck AJ R. J. Am. Soc. Mass Spectrom 2024, 35 (6), 1292–1300. [DOI] [PMC free article] [PubMed] [Google Scholar]
- (78).Larson EJ; Roberts DS; Melby JA; Buck KM; Zhu Y; Zhou S; Han L; Zhang Q; Ge Y Anal. Chem 2021, 93 (29), 10013–10021. [DOI] [PMC free article] [PubMed] [Google Scholar]
Associated Data
This section collects any data citations, data availability statements, or supplementary materials included in this article.