

Abstract
Purpose
To identify a 15-KDa novel hypoxia-induced secreted protein in head and neck squamous cell carcinomas (HNSCC) and to determine its role in malignant progression.
Methods
We used surface-enhanced laser desorption ionization time-of-flight mass spectrometry (SELDI-TOF-MS) and tandem MS to identify a novel hypoxia-induced secreted protein in FaDu cells. We used immunoblots, real-time polymerase chain reaction (PCR), and enzyme-linked immunoabsorbent assay to confirm the hypoxic induction of this secreted protein as galectin-1 in cell lines and xenografts. We stained tumor tissues from 101 HNSCC patients for galectin-1, CA IX (carbonic anhydrase IX, a hypoxia marker) and CD3 (a T-cell marker). Expression of these markers was correlated to each other and to treatment outcomes.
Results
SELDI-TOF studies yielded a hypoxia-induced peak at 15 kDa that proved to be galectin-1 by MS analysis. Immunoblots and PCR studies confirmed increased galectin-1 expression by hypoxia in several cancer cell lines. Plasma levels of galectin-1 were higher in tumor-bearing severe combined immunodeficiency (SCID) mice breathing 10% O2 compared with mice breathing room air. In HNSCC patients, there was a significant correlation between galectin-1 and CA IX staining (P = .01) and a strong inverse correlation between galectin-1 and CD3 staining (P = .01). Expression of galectin-1 and CD3 were significant predictors for overall survival on multivariate analysis.
Conclusion
Galectin-1 is a novel hypoxia-regulated protein and a prognostic marker in HNSCC. This study presents a new mechanism on how hypoxia can affect the malignant progression and therapeutic response of solid tumors by regulating the secretion of proteins that modulate immune privilege.
INTRODUCTION
The microenvironment of solid tumors, especially head and neck squamous cell carcinomas (HNSCC), possesses hypoxic regions that are not found in normal tissues. Hypoxia confers cellular resistance to conventional chemoradiotherapy and accelerates malignant progression.1 Clinical studies have demonstrated a strong correlation between low pretreatment tumor pO2 and decreased tumor control and overall inHNSCCpatients.2,3 Oneway ofgaining insight into the molecular regulation of hypoxia is to analyze the changes in mRNA and protein expression in cultured tumor cells. Expression cDNA microarrays have been used extensively to characterize global transcriptional changes under hypoxia, and have identified several hypoxia-regulated genes that can contribute to tumor progression and treatment resistance.4–6 However, transcriptional changes alone are not sufficient to characterize the complexity of the tumor-cell response to hypoxia.7 Therefore, we employed the surface-enhanced laser desorption ionization time-of-flight mass spectrometry (SELDI-TOF-MS) approach to identify molecular markers for tumor hypoxia.
We have previously used a similar proteomic approach to identify a peptide pattern that had moderate sensitivity and specificity in discriminating HNSCC patients from noncancerous controls.8 Here, we report the identification of galectin-1 as a novel hypoxia-regulated protein whose tissue expression can be used to assess treatment outcomes in 101 HNSCC patients. In addition, we show that tumors that stained strongly for galectin-1 had significantly lower levels of T-cells (as assessed by CD3 staining) than those with negative or weak staining for galectin-1, suggesting that galectin-1 is a negative regulator of T-cell activation and survival. Both galectin-1 and CD3 expression were independent predictors for survival in these patients. These results suggest a possible link between immune privilege and tumor hypoxia in which galectin-1 acts as an important intermediary.
METHODS
Cell Culture and Hypoxia Treatment
Human FaDu, SCC4, SCC25, SQB20 cells (HNSCC) and RKO cells (colorectal carcinomas) were obtained from American Type Culture Collection (ATCC; Rockville, MD). The cells were grown as specified by ATCC. At 70% to 80% confluence, cells were washed with phosphate-buffered saline (PBS) and incubated in serum-free media immediately before treating for varying amounts of time in a hypoxia chamber (either 2% or 0.02% O2; Sheldon Manufacturing Inc, Cornelius, OR). After hypoxia treatment, cells were collected, washed, and lysed in buffer A (8 M urea, 2% zwitterionic detergent [C32H58N2SO7]). The media were also collected, concentrated (Centriprep YM-3; Millipore, Billerica, MA) and stored at −80°C for further analysis.
Protein Chip Array Analysis
Concentrated FaDu cultured media was diluted in PBS to a final concentration of 0.2 mg/mL. Five microliters of diluted media was applied to each spot on the strong anion exchanger (SAX2) protein chip arrays (Ciphergen Biosystems, Fremont, CA) and allowed to bind at room temperature for 1 hour. The arrays were processed and analyzed as previously described.8 Each sample was analyzed in triplicate; spectra were compiled and the protein peak intensities were normalized to the total ion current of mass/charge (m/z) values from 1.5 kDa to 150 kDa using Ciphergen ProteinChip Software 3.1.1 (Fremont, CA). M/z values < 1.5k Da, corresponding to the signal from the sinapinic acid matrix, were omitted. The same Ciphergen ProteinChip Software was used to identify peaks that were elevated in the media under hypoxia.
SDS PAGE and Protein Identification by Mass Spectrometer
Concentrated media (100 μg of total protein) was loaded on a 4% to 20% gradient sodium dodecyl sulfate–polyacrylamide gel electrophoresis (SDS-PAGE; Bio-Rad Laboratories, Hercules, CA). Gels were stained with SYPRO Ruby (Bio-Rad Laboratories) and scanned with the Bio-Rad FX image system. Protein spots were excised from the gel and identified as previously described.7
Western Blot Analysis
Samples (5 μg) were electrophoresed and transferred to nitrocellulose as previously described.7 Goat anti-galectin-1 antibody was used at a concentration of 0.2 μg/mL (Af1152; R&D Systems, Minneapolis, MN). The same blot was also stained for actin (Sigma, St Louis, MO) to ensure even loading between samples.
Real-Time Quantitative Polymerase Chain Reaction
Total RNA was obtained by lysing 5 to 10 × 106 cells in TRIzol (Invitrogen, Carlsbad, CA). Real-time quantitative polymerase chain reaction (PCR) was performed using an ABI PRIZM7900 machine (Applied Biosystems, Foster City, CA) and universal cycle conditions as previously described.7 β-actin was used to normalize mRNA concentration.
Galectin-1 ELISA
Ninety-six–well microplates were coated with capture antibody (100 μL/well, 2,000 ng/mL; AF1152; R&D Systems); incubated overnight at room temperature (RT), and washed three times with wash buffer (0.05% Tween-20 [Sigma-Aldrich, St Louis, MO] in PBS). Samples (100 μL) were added to each well; incubated at RT for 2 hours, aspirated, and washed with wash buffer. Detection antibody (100 ng/mL, 100 μL; BAF1152, R&D Systems) diluted in Reagent Diluent (R&D Systems, Minneapolis, MN; PBS, 5% Tween-20, 2% goat serum) was added to each well and incubated at RT for 2 hours. The wells were then washed three times and 100 μL of streptavidin-horseradish peroxidase (1:200) was added. After 20 minnutes of incubation at RT, the plate was developed and the optical density of each well was determined at 450 nm. A standard curve using 6 to 500 pg of galectin-1 (R&D Systems) was generated for each enzyme-linked immunoabsorbent assay (ELISA) analysis.
Mouse Experiments
All animal protocols were approved by the Institutional Animal Care and Use Committee (IACUC) at Stanford University (Stanford, CA). FaDu cells were stably transfected with a plasmid construct containing the β-hCG gene ligated downstream of a hypoxia-inducible promoter containing five tandem repeats of the hypoxia-response element (5HRE).9 These cells have been shown to secrete β-hCG in response to hypoxia or hypoxia-inducible factor 1α (HIF-1α) stabilizing agents. In addition, urinary β-hCG levels from xenografts containing these cells were directly responsive to changes in tumor oxygenation, including exposure of the animals to 10% O2.9 Therefore, they were used for xenograft studies. 106 cells were implanted intradermally in 50 μL PBS into severe combined immunodeficiency (SCID) BALB/c mice (The Jackson Laboratory, Bar Harbor, ME). The mice were maintained under pathogen-free conditions at the Stanford University Research Animal Facility. Tumor volume was calculated according to the equation
At the time of mouse death, the tumor was removed and weighed. Measured plasma galectin-1 and urinary β-hCG levels were normalized to the tumor volumes at the time of measurement.
Ten-Percent Oxygen Chamber (hypoxia treatment)
Mice with FaDu tumors were placed in a sealed chamber that was infused with 10% oxygen and 90% nitrogen (Praxair, San Carlos, CA) for up to 72 hours. Control mice with matched tumor volumes were maintained at 21% oxygen. At the time of sacrifice, heparinized plasma was collected and analyzed for galectin-1 via ELISA.
β-hCG and Creatinine Assays
β-hCG was detected by the Elecsys 2010 clinical diagnostic machine (Roche Diagnostics, Basel, Switzerland), which relies on an electrochemiluminescence immunoassay for quantitation, using the HCG+β reagents as per the manufacturer’s recommendations. Urinary β-hCG was corrected for creatinine, which was analyzed on the Vitros 950 clinical chemistry machine (Ortho-Clinical Diagnostics, Raritan, NJ).
Tissue-Array Generation and Galectin-1, CA IX, and CD3 Immunohistochemical Staining
The tissue microarray was constructed as previously described.10 In addition to HNSCC, the microarrays also included control cores of skin, placenta, and benign lymph nodes. Each sample was present in the microarray as duplicate cores.
CA IX staining was performed as previously described.11 Immunoperoxidase stain for CD3 (1:500 dilution, rabbit polyclonal, Cell Marque, Hot Spring, AR) was performed on 4-μM thick whole-tumor sections. The entire procedure, from pretreatment to counterstaining, was performed with a Ventana Benchmark automated stainer. Immunoperoxidase stain for galectin-1 (1:250 dilution; Mouse Monoclonal; Novocastra, Newcastle upon Tyne, United Kingdom) was performed on both the tissue microarray and whole tumors. The slides were deparaffinized in xylene and rehydrated by microwaving in sodium citrate buffer (pH 6.0). The slides were then incubated with a peroxidase block followed by the primary antibody. After a PBS wash, the slides were incubated with the secondary antibody and diaminobenzidine (DAKO Envision Kit, DAKO Corp, Carpinteria, CA). After a hematoxylin counter stain, the slides were cover slipped.
All slides were reviewed by a pathologist who was blinded to treatment outcomes and scored as follows: negative, 0; equivocal or uninterpretable, 1; weakly positive, 2; and strongly positive, 3. For galectin-1, only stromal staining was considered positive. For CA IX, either strong cytoplasmic and/or membrane staining was interpreted as positive. For CD3, the scoring was based on the number of positive cells rather than staining intensity. Whole tumor sections rather than tissue microarrays were evaluated for the correlation between galectin-1 and CD3 staining.
Patients
Criteria for patients participating in the study include (1) newly diagnosed HNSCC, (2) presence of involved lymph node or tumor that were accessible for microelectrode measurement, and (3) willingness to sign an informed consent approved by the Stanford institutional review board. The patient study group consisted of 101 adults. The staging evaluation for all patients included history and physical examination, panendoscopy, chest radiographs, and laboratory tests. All patients had head and neck computed tomography or magnetic resonant imaging studies. All were staged according to the 1988 American Joint Committee on Cancer (AJCC) staging system.12 All patients were treated with either chemoradiotherapy or surgery plus radiotherapy. Patients were initially followed monthly after primary treatment and then at longer intervals. All first relapses were documented by tissue biopsy.
Tumor pO2 Measurement
All measurements were performed using a computerized histograph (Sigma Eppendorf PO2 Histograph, Hamburg, Germany) as previously described.13 The measurements were presented in the form of histograms along with the calculation of a median pO2 for each measured site. In all patients, the median tumor pO2 was consistently lower than that of normal subcutaneous tissues.
Statistical Analysis
Statistical analyses were performed using the Statview statistical software (SAS Institute Inc, Cary, NC). The analysis of variance (ANOVA) and the Student’s t test were used for comparison of plasma galectin-1 levels between the different xenograft groups and patient groups, respectively. It was also used to compare the average median pO2 values between the different galectin-1 groups. Fisher’s exact test was used to compare galectin-1, CA IX and CD3 staining. Freedom from relapse (FFR), cancer-specific survival (CSS) and overall survival (OS) were computed with the Kaplan-Meier product-limit method.14 Log-rank statistics were used to compare survival curves.15 A stepwise Cox proportional hazard model was used for multivariate analysis.15 Variables that achieved a P value < .05 were included in the multivariate model.
RESULTS
Identification of Galectin-1 As a Hypoxia-Induced Protein: In Vitro Studies
We initially screened FaDu cells for proteins that were secreted into the media during hypoxia. We utilized a SELDI-TOF-MS approach to analyze the spectrum of secreted proteins after varying durations of hypoxic exposure. Proteins were trapped onto a SAX-2 surface and the resulting proteomic spectra were analyzed. These studies revealed that a 15-kDa protein was consistently detectable in the media of hypoxia-treated cells (Fig 1A) and that its level increased as a function of time under hypoxia.
Fig 1.

(A) Representative surface-enhanced laser desorption ionization time-of-flight mass spectra of concentrated FaDu culture media after 6, 12, and 24 hours (hrs) of either normoxia (N) or hypoxia (H). The mass/charge values are along the x-axis, and relative intensity is along the y-axis. The arrow indicates a 15-kDa protein peak that is increased under hypoxia compared with normoxia. (B) Immunoblots of FaDu concentrated culture media and cell lysates showing increased galectin-1 expression after of hypoxia treatment (6, 12, and 24 hrs for the media and 24 hrs for the lysates) relative to normoxia. (C) Quantitative real-time polymerase chain reaction results showing a two-fold induction of galectin-1 mRNA after 24 hrs of hypoxia treatment (< 0.01% O2). Experiments were performed in triplicates. (D) Enzyme-linked immunoabsorbent assay results showing increased galectin-1 protein in the culture media of several different cell lines by hypoxia treatment (24 hrs of < 0.01% O2).
To identify this protein, we concentrated the media from hypoxic cells and separated these proteins by one-dimensional gel electrophoresis. We excised the dominant 15-kDa protein band, digested it with trypsin, and identified it as galectin-1 by tandem MS. Hypoxic induction of galectin-1 under both 2% and < 0.2% of hypoxia was confirmed by immunoblotting the concentrated cultured media and whole-cell lysates with an antibody specific to galectin-1. Figure 1B shows galectin-1 induction under < 0.2% and 2% O2.
Next, we investigated the mechanism of galectin-1 regulation during hypoxia by examining mRNA expression. We compared mRNA levels of galectin-1 between hypoxic and aerobic cells by quantitative real-time PCR analysis. We noted a two-fold induction of galectin-1 mRNA following hypoxic exposure, suggesting that this gene is partially regulated at the transcriptional level (Fig 1C), but the increase in the level of secreted galectin-1 protein by 12 hours indicates that hypoxia induced a robust post-transcriptional induction and secretion of this protein.
To demonstrate the applicability of using galectin-1 as a potential marker for tumor hypoxia, we developed an ELISA system with galectin-1–specific antibody and screened a variety of cell lines for the secretion of this marker during hypoxia. We tested a total of five different cell lines and found that all showed increased galectin-1 secretion during hypoxia (Fig 1D).
Relationship Between Galectin-1 and Hypoxia: Animal and Patient Studies
To study hypoxic regulation of galectin-1 in vivo, we implanted SCID mice with FaDu tumor cells that were stably transfected with a β-hCG gene under the control of a hypoxia-inducible promoter containing 5HRE.9 These cells have been shown to secrete β-hCG in response to hypoxia or HIF-1α–stabilizing agents. In addition, urinary β-hCG levels from xenografts containing these tumor cells were directly responsive to changes in tumor oxygenation, including exposure of the animals to 10% O2.9 These tumor-bearing mice were allowed to breathe either room air (normoxia) or 10% oxygen (hypoxia) for a period of either 2 or 3 days. At the end of each treatment period, the mice were sacrificed; their plasma samples were assayed for galectin-1 expression by ELISA and their urine samples were assayed for β-hCG levels. Figure 2 shows a time-dependent increase in both plasma galectin-1 and β-hCG in response to hypoxia treatment. The pattern was similar for the two markers. ANOVA analysis showed a near statistically significant increase in plasma galectin-1 in xenografts treated with hypoxia compared with normoxic controls (P = 0.15 for all three groups and P = .06 for pair-wise comparison between normoxic controls and 72 hours of hypoxia). The lack of statistical significance for both markers is probably a reflection the small number of mice used per group.
Fig 2.
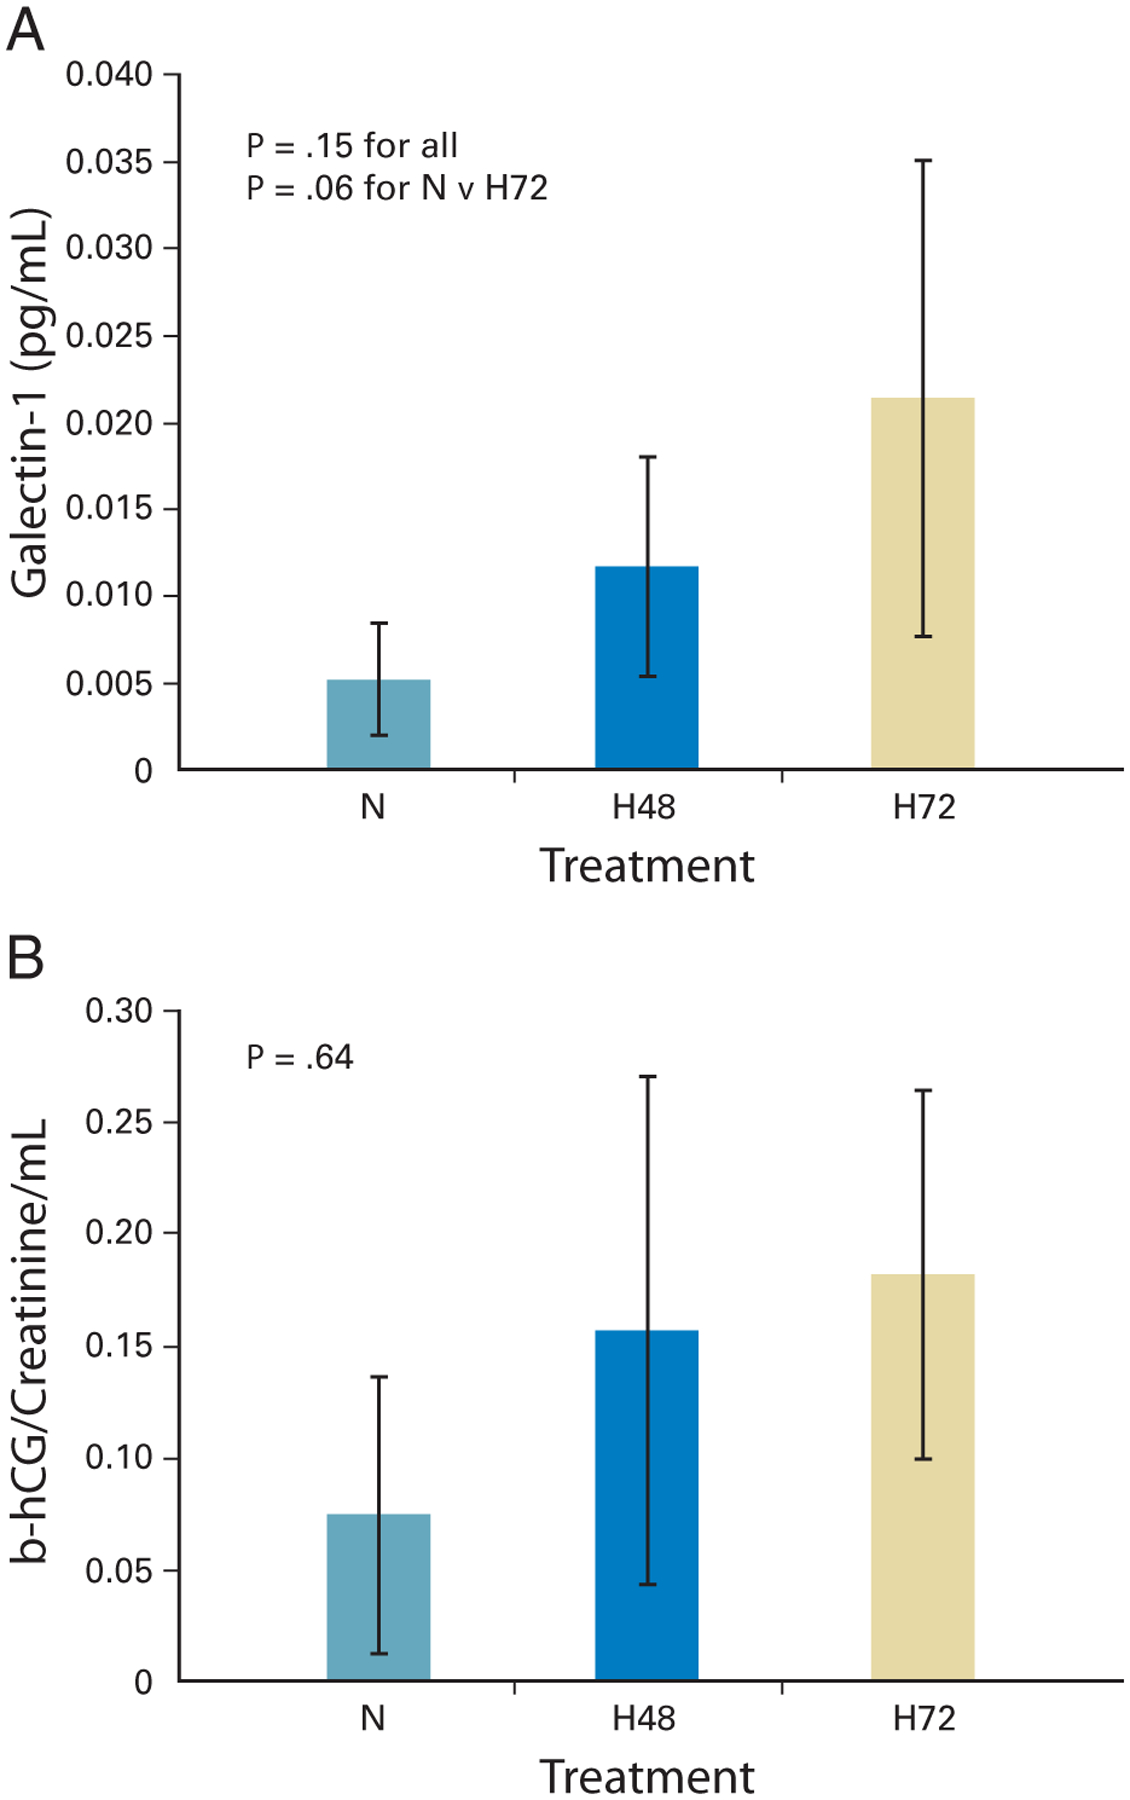
(A) Increased plasma levels of galectin-1 in severe combined immunodeficiency–mouse xenografts after 48 to 72 hours of hypoxia (H; 10% O2) compared with normoxia (N; 21% O2). Each group is represented by pooled data from three to four mice. Plasma galectin-1 levels (expressed in mg/mL) were corrected for tumor volume (expressed in mL). Data are expressed as the mean galectin-1 level ± standard deviation (P =.15 for entire group; P = .06 for N versus H72; analysis of variance analysis [ANOVA]). (B) Increased urinary β-hCG levels in the same mice after 48 to 72 hours of hypoxia compared with normoxia. Urinary β-hCG was corrected for urinary creatinine and tumor volume (ANOVA P = .64).
To further substantiate these results, we measured plasma galectin-1 level in a subset of HNSCC patients in the tissue array with available plasma samples (n = 65) and 48 noncancer matched controls. However, there was no significant difference in the plasma galectin-1 level between the two groups (data not shown).
We hypothesized that in patients, secreted galectin-1 protein is localized in the extracellular matrix binding to target proteins instead of being secreted directly into the circulation. Thus, galectin expression in tumor sections rather than plasma would be a better reflection of tumor hypoxia. Therefore, we stained a tissue array containing duplicate tumor cores from HNSCC patients with known tumor pO2 measurements and CA IX expression for galectin-1. CA IX has been shown previously to be a hypoxia-induced gene and its expression has been correlated with poor treatment outcomes in patients treated with definitive radiotherapy.16–18 Pretreatment and treatment characteristics for these patients are shown in Table 1. In support of our hypothesis, tumors that stained positive for galectin-1 showed predominantly stromal staining, suggesting that the protein is bound to the extracellular matrix. We found a significant correlation between galectin-1 and CA IX staining. Of tumors that have assessable galectin-1 and CA IX staining, 61% tumors with negative or weak reactivity for galectin-1 had negative CA IX staining and 67% tumors with strong reactivity for galectin-1 also had strong CA IX staining (Table 2; P = .01). In addition, there was a trend for lower tumor pO2 in tumors that stained strongly positive for galectin-1 when compared with those with negative or weak staining. The average median pO2 for tumors that stained strongly was 12.6 (standard error [SE], 1.5) mmHg whereas it was 16.4 (SE, 2.0) mm Hg for those that had negative or weak staining for galectin-1 (P = .10).
Table 1.
Patient and Treatment Characteristics
| Parameter | No. of Patients | |
|---|---|---|
| Age, years | ||
| < 60 | 55 | |
| > 60 | 46 | |
| Median | 58 | |
| Sex | ||
| Male | 84 | |
| Female | 17 | |
| Site | ||
| Oropharynx | 62 | |
| Larynx | 8 | |
| Oral cavity | 13 | |
| Hypopharynx | 12 | |
| Others | 6 | |
| T-stage | ||
| 0–2 | 48 | |
| 3–4 | 53 | |
| N-stage | ||
| 0–1 | 15 | |
| 2 | 66 | |
| 3 | 20 | |
| Stage | ||
| III | 10 | |
| IV | 91 | |
| Hemoglobin | ||
| ≤ 12 | 17 | |
| > 12 | 79 | |
| Unknown | 5 | |
| Median tumor pO2 | ||
| ≤ 10 mm Hg | 43 | |
| > 10 mm Hg | 52 | |
| Median, mm Hg | 11 | |
| Not assessable | 6 | |
| CA IX staining | ||
| Negative | 41 | |
| Positive | 51 | |
| Not assessable | 9 | |
| Galectin-1 staining | ||
| None | 15 | |
| Weak | 29 | |
| Strong | 56 | |
| Not assessable | 1 | |
| CD3 staining | ||
| None | 5 | |
| Weak | 41 | |
| Strong | 51 | |
| Not assessable | 4 | |
| Treatment | ||
| Chemoradiation | 80 | |
| Surgery ± radiation | 21 |
Table 2.
Relationship Between CA IX and Galectin-1 Staining
| Galectin-1 | ||
|---|---|---|
| Marker | Weak-Negative | Positive |
| CA IX | ||
| Negative | 23 | 18 |
| Positive | 15 | 36 |
NOTE: Fisher’s exact test P = .01.
Relationship Between Galectin-1 and T-Cell Expression
Since galectin-1 has been shown to play an essential role in T-cell activation and apoptosis19 and has recently been implicated to play a pivotal role in promoting escape of melanoma tumor cells from T-cell dependent immunity,20 we evaluated the expression of galectin-1 and a pan–T-cell marker (CD3) in tumor tissue sections from the same group of patients. Adjacent whole tumor sections were used to allow for more accurate evaluation of the extent of CD3 positive lymphocytes associated with the tumor. Tumors that had high galectin-1 expression had low T-cell expression and vice versa (Fig 3). Table 3 shows the relationship of galectin-1 and CD3 staining in the tissue sections. Seventy-one percent of tumors that had negative or weak galectin-1 staining showed strong reactivity for CD3, whereas only 43% of those that had strong galectin-1 staining showed strong reactivity for CD3 (P = 0.01). In addition, there was a weaker but significant inverse relationship between CA IX and CD3 staining (Table 3; P = .05). These data suggest that the increased expression of the galectin-1 protein by hypoxia can lead to enhanced T-cell apoptosis and a decrease in the overall level of tumor infiltrating T cells in HNSCC.
Fig 3.

Comparison between galectin-1 and CD3 staining in consecutive sections of the same tumor. Note the inverse relationship between the two markers. Tumors that stained strongly for galectin-1 (A, solid arrow) had minimal CD3 staining (B), and tumors that stained minimally for galectin-1 (C) had strong CD3 staining (D, clear arrow).
Table 3.
Relationships Among Galectin-1 and CD3 Staining and CA IX and CD3 Staining
| CD3 | |||
|---|---|---|---|
| Marker | Weak-Negative | Positive | Fisher’s Exact Test P |
| Galectin-1 | .01 | ||
| Weak-Negative | 10 | 24 | |
| Positive | 36 | 27 | |
| CA IX | .05 | ||
| Negative | 14 | 26 | |
| Positive | 28 | 21 | |
Relationships Among Galectin-1, CD3, and CA IX Staining and Treatment Outcomes
We performed univariate analysis to determine the relationship among galectin-1, CD3 and CA IX staining and treatment outcomes in these 101 patients. The expression of all three markers significantly correlated with FFR (Fig 4A), CSS (Fig 4B), and OS (Fig 4C) in this patient group. The results of multivariate analyses for FFR, CSS and OS are shown in Table 4. Only clinical and pathologic variables that achieved a P -value < .05 were included in multivariate models. Parameters that significantly predicted for FFR were primary tumor site (favoring oropharynx and larynx sites; P = .0009) and hemoglobin levels (favoring higher levels; P = .03). For CSS, significant parameters were primary tumor site (P = .01), treatment (P = .04) and hemoglobin level (favoring high hemoglobin; P = .008). Interestingly, although galectin-1 and CD3 staining were not independent predictors for FFR and CSS, they were significant parameters for overall survival on multivariate analysis when adjusted for variables that achieved statistical significance for OS (P < .05). These included galectin-1, CD3, CA IX, age, hemoglobin and treatment. Of the 48 patients who died at the latest follow up, 36 died as a result of recurrent cancer and 12 as a result of unrelated causes. Of these 12, three patients (25%) died as a result of another cancer (one head and neck, one lung, and one brain), suggesting that immune surveillance may be decreased in these patients.
Fig 4.

Kaplan-Meier estimates of (A-C) freedom from relapse by galectin-1, CD3 and CA IX tumor staining (D-F) Cancer-specific survival by galectin-1, CD3 and CA IX tumor staining and (G-I) Overall survival by galectin-1, CD3 and CA IX tumor staining in 101 head and neck squamous cell carcinoma patients included in the tissue microarray.
Table 4.
Results of Multivariate Analyses for FFR, CSS, and OS
| FFR | CSS | OS | |||||
|---|---|---|---|---|---|---|---|
| Parameter | Favor Group | Hazard Ratio | P | Hazard Ratio | P | Hazard Ratio | P |
| Galectin-1 | Neg-weak staining | 0.76 | .30 | 0.69 | .42 | 0.46 | .03 |
| CD3 | Strong staining | 0.94 | .62 | 0.87 | .58 | 0.50 | .04 |
| CA IX | Neg staining | 0.71 | .21 | 0.98 | .48 | 0.88 | .70 |
| Age (years) | Young age | — | — | 0.98 | .16 | 0.97 | .02 |
| Treatment | Chemoradiotherapy | 0.54 | .06 | 0.44 | .04 | 0.64 | .32 |
| Hemoglobin (g/dL) | High | 0.80 | .03 | 0.75 | .008 | 0.88 | .30 |
| Primary site | OPX/LX | 0.32 | .001 | 0.39 | .01 | — | — |
NOTE. Boldfacing indicates parameters that achieved statistical significance on multivariate analysis.
Abbreviations: CSS, cancer-specific survival; FFR, freedom from relapse; Neg, negative; OPX/LX, oropharynx/larynx; OS, overall survival.
When we combined galectin-1 and CD3 staining to form three groups—favorable (negative to weak galectin-1 staining and strong CD3 staining), intermediate (strong staining for both markers or negative to weak staining of both markers) and unfavorable (strong galectin-1 and negative to weak CD3 staining)—we found that the classification was able to distinguish these patients into three different prognostic groups for FFR (Fig 5A), CSS (Fig 5B), and, most strongly, OS (Fig 5C).
Fig 5.

Kaplan-Meier estimates of (A) freedom from relapse by galectin-1 and CD3 grouping; (B) cancer-specific survival by galectin-1 and CD3 grouping; (C) overall survival by galectin-1 and CD3 grouping. The favorable group has negative to weak (neg-weak) galectin-1 and strong CD3 staining; intermediate group has either strong both galectin-1 and CD3 staining or neg-weak both galectin-1 and CD3 staining; unfavorable group has strong galectin-1 and neg-weak CD3 staining.
DISCUSSION
Galectins are a family of animal lectins that are characterized by conserved carbohydrate recognition domains and binding affinity for β-galactosidases. Galectins bind to a wide array of glycoproteins and glycolipids on the cell surface and in the extracellular matrix, including laminins, fibronectin and integrins.21,22 By binding to these conjugates, galectins can deliver signals intracellularly as well as mediate cell-cell and cell-matrix adhesion.22 Galectins are secreted via a nonclassical secretory pathway as they lack the signal sequence required for protein secretion via the traditional endoplasmic reticulum–golgi route.23 Although discovered several years ago, galectins have recently attracted the attention of immunologists and cancer biologists as novel regulators of immune-cell homeostatis and cancer-cell progression.22,24 Galectin-1, a prototype of the galectin family, has been shown to play important functions in several aspects of cancer biology, including modulation of apoptosis, cell migration and adhesion, and immune response. It is expressed by many different tumor types and its expression has been correlated with aggressive tumor behaviors.25–28 In HNSCC, it has been identified as a tumor-associated protein via proteomic approaches29 and is expressed within the invasive components in some tumors.30 It has been shown to play a role in several pathologic processes including tumor cell proliferation,31 cell aggregation,32 adhesion,33 migration,25 apoptosis,19,21 and immunoregulation.19 More recently, it has emerged as a potent immunomodulatory protein,19 and it has been suggested that galectin-1 may confer immune privilege to melanomas by modulation survival and polarization of effector T cells.20
A long-standing dilemma in tumor immunology is the ability of solid tumor cells to escape immune surveillance despite demonstrable antitumor T-cell response. Recently studies have highlighted the importance of the host stroma in modulating antitumor cytotoxicity of T-lymphocytes. For example, Spiotto et al demonstrated that the ability of neighboring stromal cells to cross present antigens produced and released from antigen-positive cancer cells is pivotal for the bystander elimination of antigen-loss tumor-cell variants by cytotoxic T cells.34 Galectins have also attracted the attention of tumor immunologists as novel regulators of the antitumor immune response. Galectin-1 has been shown to inhibit T-cell effector function by promoting T-cell apoptosis,20 blocking T-cell activation,35 and inhibiting secretion of proinflammatory cytokines.36 Recently, the level of galectin-1 secretion in cultured supernatant has been shown to correlate with the extent of tumor-induced T-cell death in both murine and human melanoma cell lines in vitro. In addition, targeted inhibition of galectin-1 expression in vivo rendered mice resistant to tumor challenge, a process that required intact CD4+ and CD8+ T-cell response.20 Interestingly, mice that had been previously challenged with galectin-1 knock-down tumors were able to resist tumor formation in subsequent challenges with wild-type galectin-1–expressing tumors, suggesting a memory effect. Taken together, these data suggest that galectin-1 contributes to tumor immune privilege by modulating survival of a subset of T cells.
We observed a statistically significant correlation between CA IX and galectin-1 staining, indicative that hypoxia is a major regulatory factor for galectin-1 in tumors. However, galectin-1 expression can also be regulated by other factors including an autocrine effect by the protein itself37; Lck and Fyn kinases in activated T cells38; and by endothelial-cell activation with interleukin-1, transforming growth factor-β, and interferon-γ.39,40 Although our data suggest that galectin-1 is regulated by hypoxia at both the transcriptional and post-translational level, galectin-1 protein accumulation and secretion precede the accumulation of its mRNA. Thus, the critical regulation of galectin-1 by hypoxia occurs at the protein level. We propose the following mechanism for hypoxia-mediated tumor aggressiveness in HNSCC: When tumors are exposed to hypoxia, they increase production and secretion of galectin-1, which in turn promotes T-cell apoptosis and blocks T-cell activation. This allows tumor cells to escape from cellular immune surveillance and continue to survive and proliferate. Therefore, galectin-1 represents a novel target for anticancer by impacting both immunotherapy and hypoxia-targeting therapy.
Although we have shown a relationship between galectin-1 and T-cell expression in HNSCC, it is also possible that galectin-1 can affect the expression and activation of other inflammatory cells, such as neutrophils, in the tumor microenvironment. Signal transducer and activators of transcription (STAT) −3 expression is elevated in HNSCC by oncogenic activation and growth factor receptor dysregulation such as the epidermal growth factor receptor (EGFR).40 Thus, increased galectin-1 expression and STAT3 signaling could be working in concert to suppress the immune response. While other galectins have also been reported to regulate the immune response, we have found no evidence to date that they are regulated by hypoxia.
As shown in Table 2, most tumors that stained negative-weak for either galectin-1 or CA IX had strong CD3 staining. However, nearly half of the tumors that stained strongly for either galectin-1 or CA IX also had strong CD3 staining. These data suggest that the absence of hypoxia and galectin-1 expression is enough to allow for active immune surveillance of the tumor; however, the expression of galectin-1 or hypoxia alone is not sufficient to eliminate all T lymphocytes. Additional signaling pathways appear to be necessary for complete elimination of T lymphocytes in the tumor microenvironment. Some potential candidates include other galectin family members that are not hypoxia regulated and cytotoxic T-lymphocyte antigen.22
We observed a significant difference in the circulating levels of galecin-1 in mouse xenografts and in human. There are several possible explanations for this difference. First, the average tumor weight at the time of sacrifice was 750 g, which constitutes approximately 4% of the mouse weight. Therefore, the ratio of tumor to circulating blood volume (approximately 1.5 mL in a 20-g mouse v 5 L for a 60-Kg human) is significantly higher in a mouse xenograft than in an head and neck cancer patient. This can result in a higher circulating galectin-1 level in mice. Second, mouse xenografts are generally more hypoxic than human tumors and hence can produce more galectin-1 proteins.41 Third, human galectin-1 proteins that are produced by FaDu tumors in mice may not be able to bind efficiently to mouse β-galactosidases and therefore are more likely to enter the circulation than in humans. Finally, we cannot exclude the potential contribution of galectin-1 from normal tissues. However, this contribution, if any, is likely to be low. In this study, the same tumors that produce galectin-1 have also been engineered to stably produce β-hCG only under hypoxia. We have previously shown that urinary β-hCG from these xenografts was directly responsive to changes in tumor oxygenation, including exposure of the animals to 10% O2 and that it strongly correlated with pimonidazole (an extrinsic hypoxia marker) tumor staining as assayed by flow cytometry.9 Therefore, we also measured urinary β-hCG levels in these mice at the time of death as a surrogate secreted marker for hypoxia. As shown in Figure 2, the pattern of increase was similar between galectin-1 and β-hCG and in fact, the change in galectin-1 had a smaller P value on ANOVA analysis than β-hCG. In addition, the antibodies used in the ELISA system for galectin-1 did not have significant cross reactivity with the corresponding mouse protein. Finally, galectin-1 protein expression in tissue sections was positive only in the areas of tumor cells and the stroma surrounding the tumor cells, but not in adjacent normal tissues included in the same section.
In conclusion, this study provides new insight into how hypoxia can affect both the malignant progression and therapeutic response of solid tumors by modulating the secretion of proteins that modulate immune privilege. It also provides rationales for combining hypoxia-targeted drugs and immunotherapy as a novel treatment strategy for HNSCC.
Acknowledgments
Supported by US Public Health Service Grant No. CA-67166 (Q.-T.L. and A.J.G.), the Damon Runyon-Lilly Clinical Investigator Award (A.C.K.), the Stanford Cancer Council Grant (C.K.), and the Stanford Office of Technology and Development Award (G.S.).
Footnotes
Presented in part at the 2004 Annual Meeting of the American Society of Therapeutic Radiology and Oncology, Atlanta, GA, October 3–7, 2004.
Authors’ Disclosures of Potential Conflicts of Interest
The authors indicated no potential conflicts of interest.
REFERENCES
- 1.Yun Z, Giaccia AJ: Tumor deprivation of oxygen and tumor suppressor gene function. Methods Mol Biol 223:485–504, 2003 [DOI] [PubMed] [Google Scholar]
- 2.Brizel DM, Dodge RK, Clough RW, et al. : Oxygenation of head and neck cancer: Changes during radiotherapy and impact on treatment outcome. Radiother Oncol 53:113–117, 1999 [DOI] [PubMed] [Google Scholar]
- 3.Nordsmark M, Overgaard J: A confirmatory prognostic study on oxygenation status and loco-regional control in advanced head and neck squamous cell carcinoma treated by radiation therapy. Radiother Oncol 57:39–43, 2000 [DOI] [PubMed] [Google Scholar]
- 4.Koong AC, Denko NC, Hudson KM, et al. : Candidate genes for the hypoxic tumor phenotype. Cancer Res 60:883–887, 2000 [PubMed] [Google Scholar]
- 5.Lal A, Peters H, St Croix B, et al. : Transcriptional response to hypoxia in human tumors. J Natl Cancer Inst 93:1337–1343, 2001 [DOI] [PubMed] [Google Scholar]
- 6.Romero-Ramirez L, Cao H, Nelson D, et al. : XBP1 is essential for survival under hypoxic conditions and is required for tumor growth. Cancer Res 64:5943–5947, 2004 [DOI] [PubMed] [Google Scholar]
- 7.Chen Y, Shi G, Xia W, et al. : Identification of hypoxia-regulated proteins in head and neck cancer by proteomic and tissue array profiling. Cancer Res 64:7302–7310, 2004 [DOI] [PubMed] [Google Scholar]
- 8.Soltys SG, Le QT, Shi G, et al. : The use of plasma surface-enhanced laser desorption/ionization time-of-flight mass spectrometry proteomic patterns for detection of head and neck squamous cell cancers. Clin Cancer Res 10: 4806–4812, 2004 [DOI] [PubMed] [Google Scholar]
- 9.Nelson DW, Cao H, Zhu Y, et al. : A non-invasive approach for assessing tumor hypoxia in xenografts: Developing a urinary marker for hypoxia. Cancer Res 65:6151–6158, 2005 [DOI] [PubMed] [Google Scholar]
- 10.Liu CL, Prapong W, Natkunam Y, et al. : Software tools for high-throughput analysis and archiving of immunohistochemistry staining data obtained with tissue microarrays. Am J Pathol 161:1557–1565, 2002 [DOI] [PMC free article] [PubMed] [Google Scholar]
- 11.Swinson DE, Jones JL, Richardson D, et al. : Carbonic anhydrase IX expression, a novel surrogate marker of tumor hypoxia, is associated with a poor prognosis in non-small-cell lung cancer. J Clin Oncol 21:473–482, 2003 [DOI] [PubMed] [Google Scholar]
- 12.Sobin LH, Hermanek P, Hutter RV: TNM classification of malignant tumors: A comparison between the new (1987) and the old editions. Cancer 61:2310–2314, 1988 [DOI] [PubMed] [Google Scholar]
- 13.Terris DJ, Dunphy EP: Oxygen tension measurements of head and neck cancers. Arch Otolaryngol Head Neck Surg 120:283–287, 1994 [DOI] [PubMed] [Google Scholar]
- 14.Glanz SA, Slinker BK: Primer of Applied Regression Analysis of Variance. New York, NY, McGraw-Hill Inc, 1990 [Google Scholar]
- 15.Cox DR: Regression models and life tables. J R Stat Soc 34:187–220, 1972 [Google Scholar]
- 16.Wykoff CC, Beasley NJ, Watson PH, et al. : Hypoxia-inducible expression of tumor-associated carbonic anhydrases. Cancer Res 60:7075–7083, 2000 [PubMed] [Google Scholar]
- 17.Beasley NJ, Wykoff CC, Watson PH, et al. : Carbonic anhydrase IX, an endogenous hypoxia marker, expression in head and neck squamous cell carcinoma and its relationship to hypoxia, necrosis, and microvessel density. Cancer Res 61:5262–5267, 2001 [PubMed] [Google Scholar]
- 18.Koukourakis MI, Giatromanolaki A, Sivridis E, et al. : Hypoxia-regulated carbonic anhydrase-9 (CA9) relates to poor vascularization and resistance of squamous cell head and neck cancer to chemoradiotherapy. Clin Cancer Res 7:3399–3403, 2001 [PubMed] [Google Scholar]
- 19.Perillo NL, Pace KE, Seilhamer JJ, et al. : Apoptosis of T cells mediated by galectin-1. Nature 378:736–739, 1995 [DOI] [PubMed] [Google Scholar]
- 20.Rubinstein N, Alvarez M, Zwirner NW, et al. : Targeted inhibition of galectin-1 gene expression in tumor cells results in heightened T cell-mediated rejection: A potential mechanism of tumor-immune privilege. Cancer Cell 5:241–251, 2004 [DOI] [PubMed] [Google Scholar]
- 21.Yang RY, Liu FT: Galectins in cell growth and apoptosis. Cell Mol Life Sci 60:267–276, 2003 [DOI] [PMC free article] [PubMed] [Google Scholar]
- 22.Liu FT, Rabinovich GA: Galectins as modulators of tumour progression. Nat Rev Cancer 5:29–41, 2005 [DOI] [PubMed] [Google Scholar]
- 23.Hughes RC: Secretion of the galectin family of mammalian carbohydrate-binding proteins. Biochim Biophys Acta 1473:172–185, 1999 [DOI] [PubMed] [Google Scholar]
- 24.Liu FT: Galectins: a new family of regulators of inflammation. Clin Immunol 97:79–88, 2000 [DOI] [PubMed] [Google Scholar]
- 25.Camby I, Belot N, Rorive S, et al. : Galectins are differentially expressed in supratentorial pilocytic astrocytomas, astrocytomas, anaplastic astrocytomas and glioblastomas, and significantly modulate tumor astrocyte migration. Brain Pathol 11:12–26, 2001 [DOI] [PMC free article] [PubMed] [Google Scholar]
- 26.van den Brule FA, Waltregny D, Castronovo V: Increased expression of galectin-1 in carcinoma-associated stroma predicts poor outcome in prostate carcinoma patients. J Pathol 193:80–87, 2001 [DOI] [PubMed] [Google Scholar]
- 27.Cindolo L, Benvenuto G, Salvatore P, et al. : Galectin-1 and galectin-3 expression in human bladder transitional-cell carcinomas. Int J Cancer 84:39–43, 1999 [DOI] [PubMed] [Google Scholar]
- 28.Sanjuan X, Fernandez PL, Castells A, et al. : Differential expression of galectin 3 and galectin 1 in colorectal cancer progression. Gastroenterology 113:1906–1915, 1997 [DOI] [PubMed] [Google Scholar]
- 29.He QY, Chen J, Kung HF, et al. : Identification of tumor-associated proteins in oral tongue squamous cell carcinoma by proteomics. Proteomics 4:271–278, 2004 [DOI] [PubMed] [Google Scholar]
- 30.Gillenwater A, Xu XC, el-Naggar AK, et al. : Expression of galectins in head and neck squamous cell carcinoma. Head Neck 18:422–432, 1996 [DOI] [PubMed] [Google Scholar]
- 31.Kopitz J, von Reitzenstein C, Andre S, et al. : Negative regulation of neuroblastoma cell growth by carbohydrate-dependent surface binding of galectin-1 and functional divergence from galectin-3. J Biol Chem 276:35917–35923, 2001 [DOI] [PubMed] [Google Scholar]
- 32.Tinari N, Kuwabara I, Huflejt ME, et al. : Glycoprotein 90K/MAC-2BP interacts with galectin-1 and mediates galectin-1-induced cell aggregation. Int J Cancer 91:167–172, 2001 [DOI] [PubMed] [Google Scholar]
- 33.van den Brule FA, Buicu C, Baldet M, et al. : Galectin-1 modulates human melanoma cell adhesion to laminin. Biochem Biophys Res Commun 209:760–767, 1995 [DOI] [PubMed] [Google Scholar]
- 34.Spiotto MT, Rowley DA, Schreiber H: Bystander elimination of antigen loss variants in established tumors. Nat Med 10:294–298, 2004 [DOI] [PubMed] [Google Scholar]
- 35.Chung CD, Patel VP, Moran M, et al. : Galectin-1 induces partial TCR zeta-chain phosphorylation and antagonizes processive TCR signal transduction. J Immunol 165:3722–3729, 2000 [DOI] [PubMed] [Google Scholar]
- 36.Rabinovich GA, Ariel A, Hershkoviz R, et al. : Specific inhibition of T-cell adhesion to extracellular matrix and proinflammatory cytokine secretion by human recombinant galectin-1. Immunology 97:100–106, 1999 [DOI] [PMC free article] [PubMed] [Google Scholar]
- 37.Clausse N, van den Brule F, Waltregny D, et al. : Galectin-1 expression in prostate tumor-associated capillary endothelial cells is increased by prostate carcinoma cells and modulates heterotypic cell-cell adhesion. Angiogenesis 3: 317–325, 1999 [DOI] [PubMed] [Google Scholar]
- 38.Fuertes MB, Molinero LL, Toscano MA, et al. : Regulated expression of galectin-1 during T-cell activation involves Lck and Fyn kinases and signaling through MEK1/ERK, p38 MAP kinase and p70S6 kinase. Mol Cell Biochem 267:177–185, 2004 [DOI] [PubMed] [Google Scholar]
- 39.Baum LG, Seilhamer JJ, Pang M, et al. : Synthesis of an endogeneous lectin, galectin-1, by human endothelial cells is up-regulated by endothelial cell activation. Glycoconj J 12:63–68, 1995 [DOI] [PubMed] [Google Scholar]
- 40.Pomerantz RG, Grandis JR: The epidermal growth factor receptor signaling network in head and neck carcinogenesis and implications for targeted therapy. Semin Oncol 31:734–743, 2004 [DOI] [PubMed] [Google Scholar]
- 41.Adam MF, Dorie MJ, Brown JM: Oxygen tension measurements of tumors growing in mice. Int J Radiat Oncol Biol Phys 45:171–180, 1999 [DOI] [PubMed] [Google Scholar]