

Abstract
Purpose
To confirm the relationship between plasma osteopontin (OPN) levels and treatment outcomes in head and neck squamous cell carcinoma (HNSCC) patients in an expanded study.
Patients and Methods
One hundred forty patients with newly diagnosed HNSCC were enrolled onto this study, 54 previously reported and 86 new patients. Pretreatment plasma OPN levels were assessed in all patients by an enzyme-linked immunosorbent assay method. OPN levels were correlated to treatment outcomes in the new group of patients. Detailed analyses were also performed on the relationship between OPN and tumor control rate, event-free survival (EFS), and postrelapse survival for the entire group.
Results
Using a previously defined cut off point of 450 ng/mL, there was a significant correlation between OPN and freedom-from-relapse (P = .047), overall survival (P = .019), and EFS (P = .023) in the new, independent patient cohort (n = 86). Sequence of event analyses using the entire group (N = 140) revealed that OPN was an independent prognostic factor for initial tumor control, EFS in those who have achieved tumor control, and postrelapse survival.
Conclusion
In this expanded study, we were able to replicate the prognostic significance of OPN using a predefined cut off point in an independent patient group and demonstrated that plasma OPN is an independent prognostic marker for HNSCC.
INTRODUCTION
Head and neck squamous cell carcinomas (HNSCC) are the fifth most common cancer worldwide.1 Despite modern technologies, the 5-year survival rate has improved only marginally.1 There is a need to identify prognostic factors that can select patients who would benefit from treatment intensification. Although clinical parameters such as nodal and tumor stage are often employed to guide treatments,2 their usefulness is limited by the fact that most patients present with stage III or IV tumors.1
Osteopontin (OPN) is a secreted phospho-glycoprotein that plays an important role in several physiological functions, including bone remodeling, immune response, and inflammation. In cancers, it mediates tumor transformation and malignant progression.3–5 In a pilot study of 54 stage III-IV HNSCC patients, we found OPN to be a hypoxia-regulated protein whose plasma levels correlated with tumor pO2.6 We have also found OPN levels to be an independent prognostic factor for freedom-from-relapse (FFR) and overall survival (OS) in these patients.6 We further elucidated the mechanism by which hypoxia regulates OPN expression.7 These results were confirmed by the Danish Head and Neck Cancer study group in patients treated with radiotherapy with or without nimorazole, a hypoxic radiosensitizer. They found that elevated plasma OPN levels correlated with poorer disease-specific survival and that only patients with high OPN levels benefited from nimorazole.8 However, these patients were treated almost two decades ago and radiation alone is no longer the standard of care for locally advanced HNSCC. Therefore, in this study, we replicated the prognostic significance of OPN in an independent cohort of HNSCC patients treated in the modern era and further investigated the relationship between OPN and treatment outcomes in these patients.
PATIENTS AND METHODS
Patients
From November 1998 to March 2004, 140 patients were entered onto the study. These included 54 previously reported and 86 new patients. Criteria for participation included histologically confirmed untreated HNSCC and willingness to sign an informed consent approved by the institutional review board. The stages of cancer for all patients was determined by the 1988 American Joint Committee on Cancer staging system.2 Patients with stage I-II tumors were treated with either surgery or radiotherapy alone. Patients with stage III-IV tumors received either chemoradiotherapy or surgery plus radiotherapy. In patients with pathologically high-risk features (involved surgical margins, multiple involved neck nodes, or extracapsular extension), chemotherapy was also given with radiotherapy postoperatively.9,10 Initially, patients were observed monthly and then at longer intervals. All first relapses were documented by biopsy.
Plasma OPN Measurements
OPN protein levels were measured using an enzyme-linked immunosorbent assay (ELISA) method (Human Osteopontin TiterZyme Eia System; Assay Designs Inc, Ann Arbor, MI) as previously described.6 Between OPN ELISA analysis of the initial and the new group, OPN ELISA system was slightly modified by changing the incubation time and temperature to enhance the system efficacy and detection sensitivity.
Statistical Analyses
Statistical analysis was performed using R, version 2.2.0 (R Development Core Team, Vienna, Austria), and the Hmisc and design packages (Frank E. Harrell Jr, Design Package, R package version 2.0–12). Analyzed outcomes included initial tumor control, FFR (with death before relapse as a censoring variable), overall survival (OS), and event-free survival (EFS, with death or relapse counting as an event). They were computed using the Kaplan-Meier product-limit method and the significance of individual predictive variables were tested with Fisher’s exact test or logistic regression (initial control) and the log-rank test (failure times). To replicate the original finding, we used the same cut off point of 450, which was originally chosen as the median split, and tested the difference in the survival curves using the log-rank test. The original multivariate analysis was highly exploratory (9 df for 24 relapses and 19 deaths); therefore, we did not expect to replicate the same model in the new data. Instead, having confirmed the univariate association of OPN with survivals, we used the entire updated data set (61 relapses, 66 deaths, and 74 events) to build a multivariate Cox proportional hazards model that would have more stably estimated coefficients. We also took the opportunity to model the effect of OPN on the sequential events of tumor control, relapse, and death after relapse. In the multivariate Cox analyses we used continuous OPN values rather than the dichotomized version, and we tested for nonlinear effects of OPN on the log hazard with a flexible regression (restricted cubic splines). We also checked for differences in the effect of OPN between the two data sets using linear and nonlinear OPN by data set interaction terms.
RESULTS
Patient Characteristics
Table 1 presents patient characteristics for the original, the new, and the combined patient groups. The first group was primarily accrued to evaluate the relationship between tumor pO2 and OPN levels; therefore, they all had accessible tumors or involved neck nodes for pO2 measurements. They generally had larger and more advanced tumors by American Joint Committee on Cancer staging and all had pO2 measurements. The second group was accrued primarily to evaluate the relationship between OPN and prognosis; therefore, they represented the nonselected, newly diagnosed HNSCC patients who were treated at our institution. As a result, the new group had smaller tumors, less advanced T- and N-stage and were less likely to require radiation therapy treatment either definitively or adjuvantly. The follow-up of the new group was shorter than the first group as they were accrued later. There was a trend for higher OPN level in the second group due to the adjustments in the ELISA system to improve detection sensitivity.
Table 1.
Patient, Tumor, and Treatment Characteristics of the Initial Patient Group, New Patient Group, and All Patients
| Initial Group (n = 54) |
New Group (n = 86) |
All Patients (N = 140) |
|||||
|---|---|---|---|---|---|---|---|
| Characteristic | No. | % | No. | % | No. | % | P * |
| Age, years | |||||||
| Mean | 57.8 | 60.4 | 59.4 | .24† | |||
| Sex | |||||||
| Male | 74 | 84.9 | 80.7 | .12‡ | |||
| Tumor site | .34‡ | ||||||
| Oral cavity | 11 | 20 | 16 | 19 | 27 | 19 | |
| Oropharynx | 31 | 57 | 39 | 45 | 70 | 50 | |
| Hypopharynx | 8 | 15 | 22 | 26 | 30 | 22 | |
| Other | 4 | 7 | 9 | 11 | 13 | 9 | |
| Tumor volume, cm2 | |||||||
| Mean | 27.5 | 20.9 | 23.7 | .03† | |||
| Not available | 5 | 18 | |||||
| T stage | .54‡ | ||||||
| 0–2 | 27 | 50 | 47 | 55 | 74 | 53 | |
| 3–4 | 27 | 50 | 39 | 45 | 66 | 47 | |
| N stage | .07‡ | ||||||
| 0 | 7 | 13 | 21 | 25 | 28 | 20 | |
| 1 | 1 | 2 | 6 | 7 | 7 | 5 | |
| 2 | 35 | 65 | 51 | 59 | 86 | 61 | |
| 3 | 11 | 20 | 8 | 9 | 19 | 14 | |
| Stage | .02‡ | ||||||
| I-II | 2 | 4 | 14 | 16 | 16 | 12.5 | |
| III-IV | 52 | 96 | 72 | 84 | 124 | 88.5 | |
| Hemoglobin, g/dL | |||||||
| Mean | 13.7 | 13.6 | 13.6 | .8† | |||
| OPN level, ng/mL | |||||||
| Mean | 490.6 | 559.3 | 532.8 | .11† | |||
| Median | 440.3 | 532.0 | 496.0 | ||||
| Surgery for primary | 35 | 42 | 39 | .48‡ | |||
| Neck dissection | 41 | 40 | 40 | .93‡ | |||
| Radiotherapy | 93 | 78 | 83 | .01‡ | |||
| Chemotherapy | 74 | 64 | 68 | .20‡ | |||
| Mean follow-up, months | .003† | ||||||
| All patients | 39 | 27 | 32 | < .0001† | |||
| Living patients | 63 | 38 | 47 | ||||
| Patients with uncontrolled tumor | 3 | 6 | 8 | 9 | 11 | 8 | .42‡ |
| Patients with relapse | 23 | 43 | 27 | 31 | 50 | 36 | .23‡ |
| Patients who died | 29 | 54 | 37 | 43 | 66 | 47 | .22‡ |
Abbreviation: OPN, osteopontin.
P = between initial and new groups.
t test P.
χ2P.
Replication of Previous Findings on OPN and Outcome
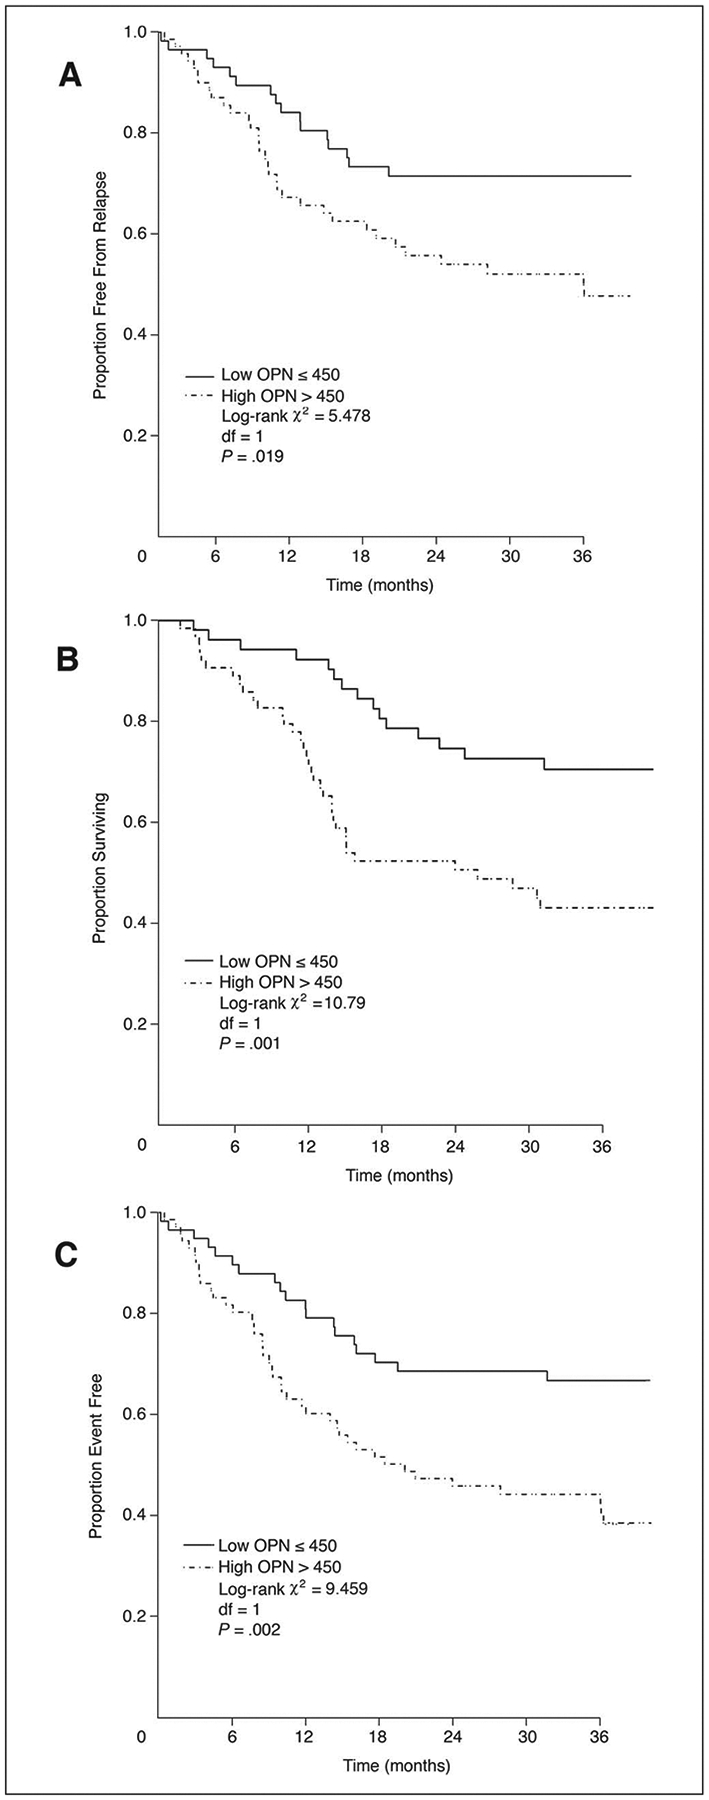
Repeating the same analysis of the univariate association between OPN and outcome in the second set (using the same cut off point of 450) showed significant differences between the two groups on FFR (log-rank, 3.94; 1 df, P = .0472; Fig 1A), OS (log-rank, 5.48; 1 df, P = .019; Fig 1B) and EFS (log-rank, 5.15; 1 df, P = .023; Fig 1C). Similarly, updated follow-up for the initial 54 patients continued to show a correlation between OPN and FFR (log-rank, 7.14; 1 df, P = .008), OS (log-rank, 13.402; 1 df, P = .0003), and EFS (log-rank, 10.510; 1 df, P = .001). The degree of curve separation for the new set was slightly smaller than in the first set; however, none of the tests of interaction between OPN and the two data sets on any outcome parameters were significant, indicating no statistical objection to pooling the data.
Fig 1.

Replication of outcome data using the previously defined osteopontin (OPN) value of 450 ng/mL in the new patient group. (A) Freedom from relapse by OPN for the new patient group. (B) Overall survival by OPN for the new patient group. (C) Event-free survival by OPN for the new patient group.
Having confirmed the original findings on the relationship between OPN and outcomes on both data sets, we combined the two data sets to explore the sequence of events, beginning with tumor control. This analysis was not previously conducted for the original data set, which counted patients without tumor control as having relapsed.
OPN and Initial Tumor Control
Eleven patients never achieved initial tumor control, 10 (12.3%) of 81 in the high OPN (> 450 ng/mL) and one (1.7%) of 59 in the low OPN (≤ 450 ng/mL) group (odds ratio, 8.1; P = .025, Fisher’s exact test). When OPN was assessed as a continuous variable, it was also a strong prognostic factor for tumor control (P=.005). A change of 306 ng/mL in OPN levels from the lowest (336) to the highest quartile (642) translated to a 3.0-fold increase risk of uncontrolled tumors (95% CI, 1.4 to 6.4). Figure 2 shows the relationship between OPN and tumor control. The mean OPN level was 514 (standard deviation, 226) for the controlled and 752 (standard deviation, 303) for the uncontrolled group.
Fig 2.

Histogram showing the frequency of patients with and without tumor control by osteopontin (OPN) levels.
OPN and FFR, OS, and EFS After Tumor Control
One hundred twenty nine patients achieved tumor control after the initial treatment. At a mean follow-up of 46.6 months for living patients (range, 5 to 89), 50 have recurred (33 in the high and 17 in the low OPN group). The 3-year FFR was 72% for patients with OPN ≤ 450 ng/mL and 48% for OPN more than 450 (P = .019; log-rank 5.5; 1 df; Fig 3A).
Fig 3.
(A) Freedom from relapse by osteopontin (OPN) for all patients. (B) Overall survival by OPN for all patients. (C) Event-free survival by OPN for all patients.
Fifty five of 129 patients whose tumors were controlled died, 42 after tumor recurrence and 13 without relapse (from intercurrent causes). Thirty-eight deaths occurred in the high OPN and 17 in the low OPN group. The 3-year OS was 73% for patients with OPN ≤ 450 ng/mL and 49% for OPN more than 450 (Fig 3B; P = .001; log-rank 10.8; 1 df).
A total of 63 events were observed: 43 in the high OPN and 20 in the low OPN group. The 2-year EFS was 63% for patients with OPN ≤ 450 ng/mL and 43% for OPN more than 450 (Fig 3C; P = .002; log-rank 9.5; 1 df).
Using the combined data set, restricted to patients with initial controlled tumors (N = 129) we constructed a clinical predictors model for EFS by starting with age, sex, T stage, N stage, chemotherapy, and location (oropharynx v other). All these factors except sex were significant predictors in the multivariate Cox model for EFS. We then added OPN as a continuous variable to the five-factor model, and found it was significant (Wald statistic, 6.21; 1 df, P = .012). There was no evidence of nonlinear effect of OPN on the log-hazard, nor was there an effect of data set (initial or new), nor an interaction of data set and OPN (linear or nonlinear). After adjusting for age, T and N stage, chemotherapy, and location, the effect of a 300-point rise in OPN (the difference between the upper and lower quartiles) is to increase the hazard of an event by a factor of 1.5. The other effects with CI are presented in Table 2. The three possible confounders, which were tumor pO2, hemoglobin, and tumor volume, were not included in this model because they were often missing. However, when they were included in the final model, they did not substantially change the size or significance of the OPN effect, despite the loss of sample size.
Table 2.
Multivariate Cox Regression Models for Event-Free Survival for Patients Who Achieved Initial Tumor Control
| Parameter | Comparison* | Favored Group | χ 2 | Hazard Ratio | 95% CI | P |
|---|---|---|---|---|---|---|
| Age | 51 v 67 (difference of 16 years) | Younger | 4.38 | 1.48 | 1.03 to 2.14 | .036 |
| T stage | 2 v 4 | T2 | 12.84 | 2.15 | 1.42 to 3.28 | .0003 |
| N stage | 1 v 2 | N1 | 7.53 | 1.61 | 1.14 to 2.25 | .006 |
| Chemotherapy | No v yes | Yes | 8.68 | 2.53 | 1.36 to 4.69 | .003 |
| Tumor location | Other v OP | OP | 9.27 | 2.40 | 1.37 to 4.22 | .002 |
| OPN | 336 v 642 (difference of 306 ng/mL) | Lower | 6.21 | 1.49 | 1.09 to 2.04 | .012 |
Abbreviations: OP, oropharynx; OPN, osteopontin.
For variables with more than two categories, we present the hazard ratio corresponding to the distance between the upper and lower quartiles of the variable (age, OPN, T stage, N stage) to facilitate comparison; for dichotomies (chemotherapy and tumor location) the odds ratio compares the two categories.
OPN and Pattern of First Events
Table 3 presents the distribution of first events by OPN group. There were more uncontrolled tumors, locoregional recurrences, and intercurrent deaths in the high than the low OPN group. The intercurrent deaths included second cancers in five patients, pneumonia or gastrostomy tube complications in five patients, car accident in one patient, and unknown in two patients. Of note, all patients who died from a second cancer (four lung cancers and one multiple myeloma) were in the high OPN group and had their second cancer diagnosed within 6 months to 2 years of the initial OPN measurement.
Table 3.
Distribution of First Event by OPN Group
| OPN ≤ 450 (n = 59) |
OPN > 450 (n = 81) |
|||
|---|---|---|---|---|
| Event Type | No. | % | No. | % |
| Persistent locoregional disease | 1 | 2 | 10 | 12.5 |
| Locoregional recurrence | 13 | 22 | 26 | 33 |
| Distant metastasis | 4 | 7 | 6 | 7 |
| Died of intercurrent illnesses | 3 | 5 | 10 | 12.5 |
| Alive without disease | 38 | 64 | 29 | 36 |
Abbreviation: OPN, osteopontin.
OPN and Postrelapse Survival
Figure 4 shows survival after relapse by relapse location (locoregional versus distant) and OPN. The four groups differ statistically (P = .03; log-rank, 8.98; 3 df). Patients with distant relapses faired significantly worse than those with locoregional relapses. One-year survival was 0% for patients with distant metastases compared with 23% for those with locoregional relapses (P = .019). OPN did not appear to have significant effect on postrelapse survival in the distant metastasis group, but the small sample size precludes a reliable statistical comparison. There was a significant difference in postrelapse survival by pretreatment OPN in patients with locoregional relapse. The 1-year OS was 39% for the low compared with 14% for the high OPN group (log-rank, 4.2; 1 df; P = .04). This difference could not be explained by salvage therapy. There was no significant difference in salvage treatments between the two OPN groups in patients with locoregional relapse (Table 4). More high OPN patients (80%) received salvage therapy than low OPN patients (61%).
Fig 4.
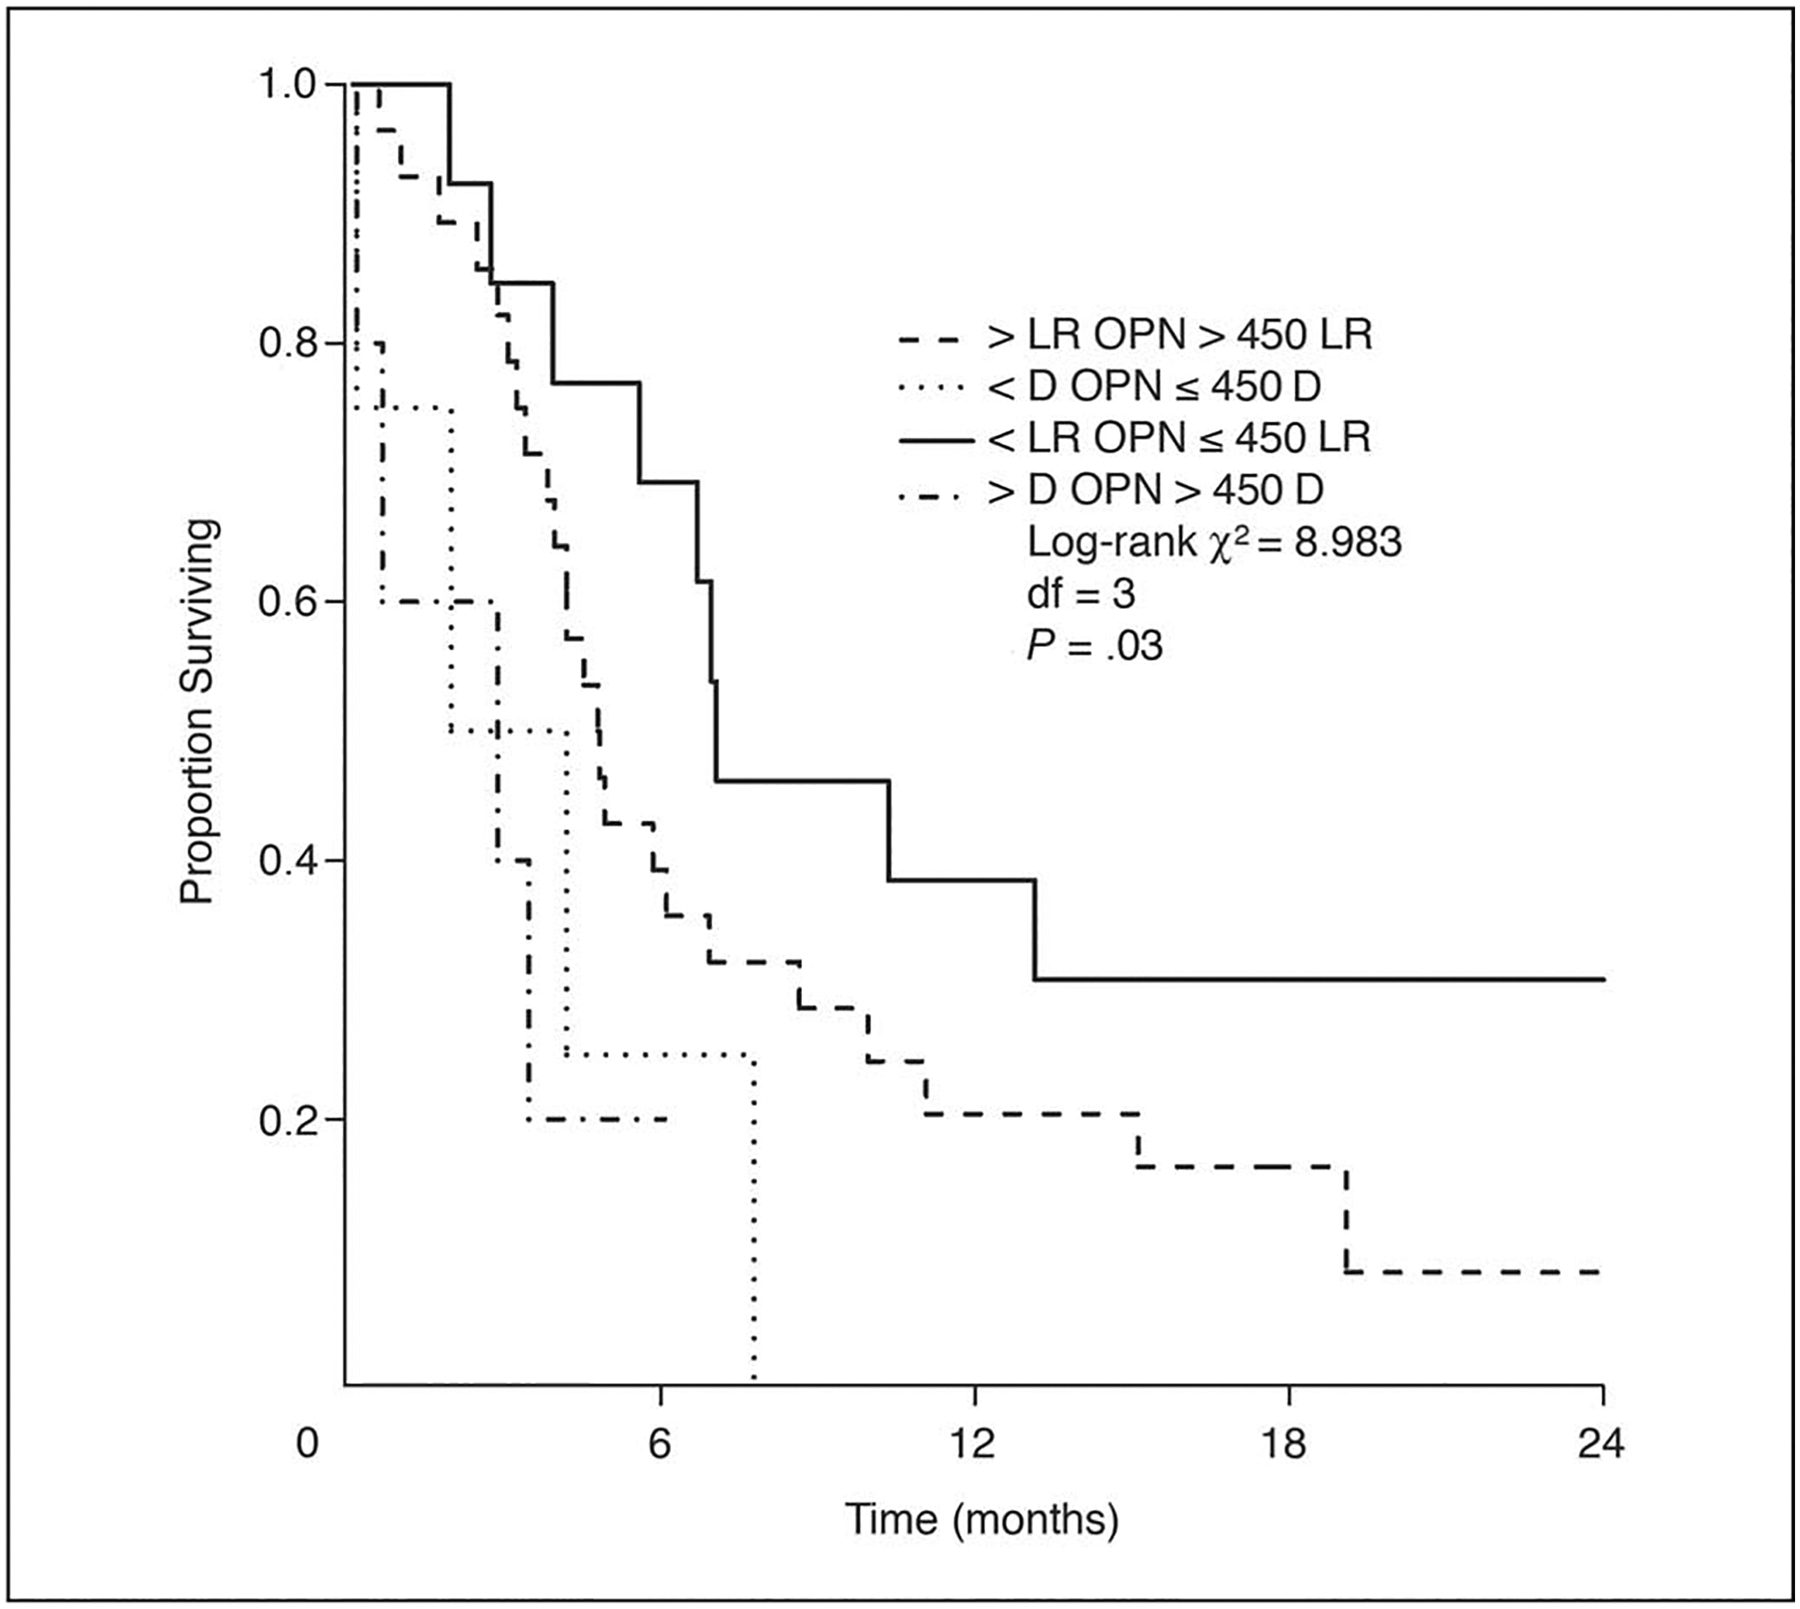
Survival after relapse by relapse type (locoregional v distant) and by osteopontin (OPN) group. LR, locoregional relapse; D, distant relapse.
Table 4.
Salvage Treatment by OPN Group in Patients Who Had Locoregional Relapse
| OPN ≤ 450 (n = 13) |
OPN > 450 (n = 27) |
|||
|---|---|---|---|---|
| Treatment | No. | % | No. | % |
| None | 4 | 31 | 3 | 11 |
| Surgery ± RT ± chemotherapy | 5 | 38 | 11 | 41 |
| RT ± chemotherapy | 3 | 23 | 5 | 19 |
| Chemotherapy | 0 | 0 | 6 | 22 |
| Unknown | 1 | 8 | 2 | 7 |
Abbreviations: OPN, osteopontin; RT, radiation therapy.
Multivariate analyses beginning with the five-factor model described herein resulted in a model for postrelapse survival involving tumor location and relapse type (distant v locoregional). The addition of OPN to this model was a statistically significant improvement in prediction. In the final model tumor location (favoring oropharynx, P = .013; hazard ratio [HR], 0.42; 95% CI, 0.21 to 0.84), relapse type (favoring locoregional, P = .0012; HR, 4.20; 95% CI, 1.77 to 9.98) and OPN (favoring low OPN, P = .045; HR, 1.58 from low to high quartile; 95% CI, 1.01 to 2.47) were independent prognostic factors for survival after relapse. Although Figure 4 shows the effect of OPN was most evident in patients with locoregional relapse, we did not find a significant interaction between OPN and the relapse location (this test has low power due to the few cases with distant metastases).
DISCUSSION
This is an expanded study, in which we have enrolled an additional 86 patients to generate a total group of 140 patients, and updated the follow-up. The new data set replicates the original finding that OPN is a statistically significant predictor of survival, relapse, and combined events, using the same (median) cut off point of 450 that was used previously.6 The larger combined data set now provides enough events to investigate the role of OPN in predicting the sequence of outcomes: initial tumor control, subsequent relapse or death, and death after relapse. In particular, there are enough events to support a stable clinical model of EFS after initial control, against which the added, independent value of OPN can be assessed. Finally, the number of deaths after relapse is large enough to verify that OPN adds value to a clinical model of mortality. In summary, we find that high OPN predicts lack of tumor control, higher rates of relapse in patients with initial tumor control, and higher rates of death in patients who relapse, over and above the best clinical predictor model. The effect of OPN is graded, approximately linear on the log-hazard scale, and although the two data sets disagree somewhat on the estimated size of the OPN effect, such differences are well within the margin of statistical error (nonsignificant interaction). The multivariate model shows that a 300 ng/mL increment in plasma OPN was associated with a 1.5-fold increase in hazard, an effect similar to a 16-year increase in age or a change of one nodal stage.
Since the major objective of this expanded study was to confirm the role of OPN as a prognostic marker in HNSCC, the patient population was unselected and reflected the population that was treated at our institution. Unlike the initial population who mainly had locally advanced tumors that were accessible for pO2 measurement, the new population also included patients with early-stage tumors, smaller tumor volumes, and were, therefore, less likely to require multimodality therapy. In addition, there was a trend for higher OPN levels in the second group, presumably due to the refinements in the OPN ELISA system to enhance sensitivity. Regardless of these differences, we were able to replicate the prognostic significance of OPN in an independent patient cohort.
Pattern of first event analysis showed that elevated OPN levels were associated with an increased risk of persistent or relapsing locoregional disease but not with distant metastasis. This could be explained partially by the low rate of distant metastasis and the relatively short follow-up. Preliminary data from our laboratory suggested that overexpression of OPN mRNA resulted in increased radioresistance as measured by clonogenic survival in a head and neck cancer cell line at clinically relevant radiation doses (data not shown). We are presently investigating the role of OPN on tumor cell radiosensitivity.
While half (five of 10) non–HNSCC related deaths in the high OPN group were related to a second cancer that was diagnosed within 6 months to 2 years of OPN measurements, none of the patients in the low OPN group died of a second cancer. This raises the possibility that some of the measured plasma OPN may have come from the secondary cancers; though it is hard to determine the exact source of OPN. Secreted plasma or urinary OPN, either alone or in combination with other markers, has been found to be useful for detection of several tumors, including mesothelioma, ovarian, and pancreatic cancers.11–14
Surprisingly, our data show that elevated pretreatment plasma OPN was an independent predictor of mortality after relapse. This effect was independent of salvage therapy. These data suggest that tumors with elevated OPN levels were biologically aggressive and less likely to respond to conventional therapy either as an initial treatment or for salvage. It is difficult to determine whether OPN represents a marker of poor outcome or whether it is directly mediating tumor aggressiveness. However, there is ample evidence to suggest that OPN is involved in tumor invasion and metastasis. High tumoral OPN protein levels have been correlated to increased invasion in solid tumors.15–18 Patients with metastatic neoplasms generally had higher plasma OPN levels than those without.6,19,20 Increased OPN expression has been associated with tumor invasion, progression, and metastasis in cancers of the breast, stomach, lung, prostate, liver, and colon.20–27 In HNSCC, OPN overexpression is found only in dysplastic lesions and invasive tumors, but not in normal mucosa.28,29 In patients with laryngeal carcinomas, its protein levels significantly correlated with tumor stage, grade, and nodal or distant metastases.29 Gene expression profiling of HNSCC, from dysplastic lesions to invasive to metastatic cancers, revealed OPN to be the top induced gene at the transition from noninvasive to invasive tumors.30 Suppression of OPN expression with antisense resulted in decreased cell growth and invasion in an HNSCC cancer cell line.31 Treatment of several squamous carcinoma cells with recombinant OPN sharply increased cell proliferation and matrigel invasion in comparison to untreated cells. OPN knockdown by RNA interference significantly attenuated these effects.29 These data strongly suggest that OPN is directly involved in tumor progression in HNSCC and is a good target for anticancer therapy.
Drawbacks from this study include the small sample size and patient and treatment heterogeneity. The results of this study will need to be validated in a larger cohort of homogeneously treated patients, which we hope to accomplish using plasma samples from patients who have completed treatment on the Concomitant Radiation and Cisplatin With or Without Tirapazamine in Treatment of Advanced Head and Neck Cancer (HeadSTART) trial.32 In this phase III randomized study, 850 patients with locally advanced HNSCC were randomly assigned to either cisplatin and radiation alone or the same treatment plus tirapazamine, a hypoxic cell cytotoxin. Plasma OPN levels from the HeadSTART study will provide the validation to the prognostic significance of plasma OPN and to determine its usefulness in identifying patients who would benefit from hypoxia targeting agents, such as tirapazamine.
In summary, we have demonstrated that OPN is an independent prognostic marker for HNSCC. Studies are ongoing to confirm that OPN is a good target for anticancer therapy and to define an optimal approach for inhibiting its activity in HNSCC.
Acknowledgment
We thank Cindy Struloeff for her administrative assistance in preparing and submitting the manuscript.
Supported by United States Public Health Service Grant No. CA-67166 (Q-T.L., P.W., H.C., and A.J.G.), the Damon Runyon-Lilly Clinical Investigator Award (A.C.K.), and the Henry Kaplan Research Fellowship (D.P.).
Footnotes
Authors’ Disclosures of Potential Conflicts of Interest
The authors indicated no potential conflicts of interest.
Presented at the 41st Annual Meeting of the American Society of Clinical Oncology, Orlando, FL May 13–17, 2005.
REFERENCES
- 1.Forastiere A, Koch W, Trotti A, et al. : Head and neck cancer. N Engl J Med 345:1890–1900, 2001 [DOI] [PubMed] [Google Scholar]
- 2.Sobin LH, Hermanek P, Hutter RV: TNM classification of malignant tumors. A comparison between the new: (1987) and the old editions. Cancer 61:2310–2314, 1988 [DOI] [PubMed] [Google Scholar]
- 3.Senger DR, Asch BB, Smith BD, et al. : A secreted phosphoprotein marker for neoplastic transformation of both epithelial and fibroblastic cells. Nature 302:714–715, 1983 [DOI] [PubMed] [Google Scholar]
- 4.Rittling SR, Chambers AF: Role of osteopontin in tumour progression. Br J Cancer 90:1877–1881, 2004 [DOI] [PMC free article] [PubMed] [Google Scholar]
- 5.Wai PY, Kuo PC: The role of osteopontin in tumor metastasis. J Surg Res 121:228–241, 2004 [DOI] [PubMed] [Google Scholar]
- 6.Le QT, Sutphin PD, Raychaudhuri S, et al. : Identification of osteopontin as a prognostic plasma marker for head and neck squamous cell carcinomas. Clin Cancer Res 9:59–67, 2003 [PMC free article] [PubMed] [Google Scholar]
- 7.Zhu Y, Denhardt DT, Cao H, et al. : Hypoxia upregulates osteopontin expression in NIH-3T3 cells via a Ras-activated enhancer. Oncogene 24:6555–6563, 2005 [DOI] [PubMed] [Google Scholar]
- 8.Overgaard J, Eriksen JG, Nordsmark M, et al. : Plasma osteopontin, hypoxia, and response to the hypoxia sensitiser nimorazole in radiotherapy of head and neck cancer: Results from the DAHANCA 5 randomised double-blind placebo-controlled trial. Lancet Oncol 6:757–764, 2005 [DOI] [PubMed] [Google Scholar]
- 9.Cooper JS, Pajak TF, Forastiere AA, et al. : Postoperative concurrent radiotherapy and chemotherapy for high-risk squamous-cell carcinoma of the head and neck. N Engl J Med 350:1937–1944, 2004 [DOI] [PubMed] [Google Scholar]
- 10.Bernier J, Domenge C, Ozsahin M, et al. : Postoperative irradiation with or without concomitant chemotherapy for locally advanced head and neck cancer. N Engl J Med 350:1945–1952, 2004 [DOI] [PubMed] [Google Scholar]
- 11.Kim JH, Skates SJ, Uede T, et al. : Osteopontin as a potential diagnostic biomarker for ovarian cancer. JAMA 287:1671–1679, 2002 [DOI] [PubMed] [Google Scholar]
- 12.Mor G, Visintin I, Lai Y, et al. : Serum protein markers for early detection of ovarian cancer. Proc Natl Acad Sci U S A 102:7677–7682, 2005 [DOI] [PMC free article] [PubMed] [Google Scholar]
- 13.Koopmann J, Fedarko NS, Jain A, et al. : Evaluation of osteopontin as biomarker for pancreatic adenocarcinoma. Cancer Epidemiol Biomarkers Prev 13:487–491, 2004 [PubMed] [Google Scholar]
- 14.Ye B, Skates S, Mok SC, et al. : Proteomic-based discovery and characterization of glycosylated eosinophil-derived neurotoxin and COOH-terminal osteopontin fragments for ovarian cancer in urine. Clin Cancer Res 12:432–441, 2006 [DOI] [PubMed] [Google Scholar]
- 15.Zhou Y, Dai DL, Martinka M, et al. : Osteopontin expression correlates with melanoma invasion. J Invest Dermatol 124:1044–1052, 2005 [DOI] [PubMed] [Google Scholar]
- 16.Wai PY, Mi Z, Guo H, et al. : Osteopontin silencing by small interfering RNA suppresses in vitro and in vivo CT26 murine colon adenocarcinoma metastasis. Carcinogenesis 26:741–751, 2005 [DOI] [PubMed] [Google Scholar]
- 17.Tuck AB, Arsenault DM, O’Malley FP, et al. : Osteopontin induces increased invasiveness and plasminogen activator expression of human mammary epithelial cells. Oncogene 18:4237–4246, 1999 [DOI] [PubMed] [Google Scholar]
- 18.Das R, Mahabeleshwar GH, Kundu GC: Osteopontin stimulates cell motility and nuclear factor kappaB-mediated secretion of urokinase type plasminogen activator through phosphatidylinositol 3-kinase/Akt signaling pathways in breast cancer cells. J Biol Chem 278:28593–28606, 2003 [DOI] [PubMed] [Google Scholar]
- 19.Singhal H, Bautista DS, Tonkin KS, et al. : Elevated plasma osteopontin in metastatic breast cancer associated with increased tumor burden and decreased survival. Clin Cancer Res 3:605–611, 1997 [PubMed] [Google Scholar]
- 20.Tuck AB, O’Malley FP, Singhal H, et al. : Osteopontin expression in a group of lymph node negative breast cancer patients. Int J Cancer 79:502–508, 1998 [DOI] [PubMed] [Google Scholar]
- 21.Ye QH, Qin LX, Forgues M, et al. : Predicting hepatitis B virus-positive metastatic hepatocellular carcinomas using gene expression profiling and supervised machine learning. Nat Med 9:416–423, 2003 [DOI] [PubMed] [Google Scholar]
- 22.Fedarko NS, Jain A, Karadag A, et al. : Elevated serum bone sialoprotein and osteopontin in colon, breast, prostate, and lung cancer. Clin Cancer Res 7:4060–4066, 2001 [PubMed] [Google Scholar]
- 23.Chambers AF, Wilson SM, Kerkvliet N, et al. : Osteopontin expression in lung cancer. Lung Cancer 15:311–323, 1996 [DOI] [PubMed] [Google Scholar]
- 24.Thalmann GN, Sikes RA, Devoll RE, et al. : Osteopontin: Possible role in prostate cancer progression. Clin Cancer Res 5:2271–2277, 1999 [PubMed] [Google Scholar]
- 25.Agrawal D, Chen T, Irby R, et al. : Osteopontin identified as lead marker of colon cancer progression, using pooled sample expression profiling. J Natl Cancer Inst 94:513–521, 2002 [DOI] [PubMed] [Google Scholar]
- 26.Pan HW, Ou YH, Peng SY, et al. : Overexpression of osteopontin is associated with intrahepatic metastasis, early recurrence, and poorer prognosis of surgically resected hepatocellular carcinoma. Cancer 98:119–127, 2003 [DOI] [PubMed] [Google Scholar]
- 27.Ue T, Yokozaki H, Kitadai Y, et al. : Co-expression of osteopontin and CD44v9 in gastric cancer. Int J Cancer 79:127–132, 1998 [DOI] [PubMed] [Google Scholar]
- 28.Devoll RE, Li W, Woods KV, et al. : Osteopontin (OPN) distribution in premalignant and malignant lesions of oral epithelium and expression in cell lines derived from squamous cell carcinoma of the oral cavity. J Oral Pathol Med 28:97–101, 1999 [DOI] [PubMed] [Google Scholar]
- 29.Celetti A, Testa D, Staibano S, et al. : Overexpression of the cytokine osteopontin identifies aggressive laryngeal squamous cell carcinomas and enhances carcinoma cell proliferation and invasiveness. Clin Cancer Res 11:8019–8027, 2005 [DOI] [PubMed] [Google Scholar]
- 30.Ha PK, Benoit NE, Yochem R, et al. : A transcriptional progression model for head and neck cancer. Clin Cancer Res 9:3058–3064, 2003 [PubMed] [Google Scholar]
- 31.Muramatsu T, Shima K, Ohta K, et al. : Inhibition of osteopontin expression and function in oral cancer cell lines by antisense oligonucleotides. Cancer Lett 217:87–95, 2005 [DOI] [PubMed] [Google Scholar]
- 32.Rischin D, Hicks RJ, Fisher R, et al. : Prognostic significance of [18F]-misonidazole positron emission tomography-detected tumor hypoxia in patients with advanced head and neck cancer randomly assigned to chemoradiation with or without tirapazamine: A substudy of Trans-Tasman Radiation Oncology group study 98.02. J Clin Oncol 24:2098–2104, 2006 [DOI] [PubMed] [Google Scholar]