

Abstract
Purpose:
Tumor hypoxia modifies treatment efficacy and promotes tumor progression. Here, we investigated the relationship between osteopontin (OPN), tumor pO2, and prognosis in patients with head and neck squamous cell carcinomas (HNSCC).
Experimental Design:
We performed linear discriminant analysis, a machine learning algorithm, on the NCI-60 cancer cell line microarray expression database to identify a gene profile that best distinguish cell lines with high Von-Hippel Lindau (VHL) gene expression, an important regulator of hypoxia-related genes, from those with low expression. Plasma OPN levels in 15 volunteers, 31 VHL patients, and 54 HNSCC patients were quantitatively measured by ELISA. The relationships between plasma OPN levels, tumor pO2 as measured by the Eppendorf microelectrode, freedom from relapse (FFR), and survival in HNSCC patients were evaluated.
Results:
Microarray analysis indicated that OPN gene expression inversely correlated with that of VHL. These findings were confirmed by Northern blot analysis. ELISA studies and Western blot in a HNSCC cell line demonstrated that hypoxia exposure resulted in increased OPN secretion. Patients with VHL syndrome had significantly higher plasma OPN levels than healthy volunteers. Plasma OPN level inversely correlated with tumor pO2 (P = 0.003, r = −0.42). OPN levels correlated with clinical outcomes. The 1-year FFR and survival rates were 80 and 100%, respectively, for patients with OPN levels ≤450 ng/ml and 43 and 63%, respectively, for levels >450 ng/ml (P = 0.002 and 0.0005). Multivariate analysis revealed that OPN was an independent predictor for FFR and survival.
Conclusions:
Plasma OPN levels appeared to correlate with tumor hypoxia in HNSCC patients and may serve as noninvasive tests to identify patients at high risk for tumor recurrence.
Introduction
HNSCC3 is the fifth most common malignancy worldwide. These tumors arise from diverse anatomical locations, including oral cavity, oropharynx, larynx and hypopharynx, but have common epithelial origin and etiological association with tobacco and alcohol exposure. Despite modern intervention, the 5-year survival rate for this disease has improved only marginally over the past decade (1) and recurrent disease is observed in ~50% of the patients (2). Treatment failure for head and neck cancers can be attributed to multiple factors but difficult to predict. Factors such as age, sex, tumor site, TNM stage, and histological grade may help guide therapy but are not reliable predictors of outcomes (3). The most accurate clinical predictor for recurrence at present is the nodal stage; unfortunately, many patients present with advanced stage at presentation, and N-stage is not very discriminating in this group of patients. Recent studies have focused on the use of biomarkers and gene array technology for determining prognosis in these patients (4–8). Many of these studies require availability of tumor and normal tissues and local expertise in tissue processing, immunohisto-chemical studies, and gene array analysis. The time required to perform many of these studies may not be practical for routine clinical use to assess prognosis and to direct therapeutic management. In this study, we investigator the relationship between OPN, a secreted plasma marker with an established role in tumor transformation and invasion (9), to treatment outcomes and survival in patients with newly diagnosed locally advanced HNSCC.
Tumor hypoxia has been shown to affect the malignant progression of transformed cells and their response to therapy. It has also experimentally been shown to promote tumor progression through the selection of tumor cells with diminished apoptotic potential, stimulate proangiogenic gene expression, and increase metastatic potential (10). Past studies have demonstrated a strong correlation between pretreatment tumor pO2 and tumor control and survival in patients with HNSCC (11, 12). Studies have also indicated that hypoxia increases tumor invasiveness and dissemination in human solid tumors (13, 14). At present, the changes in gene and protein expression induced by hypoxia are unknown but have been hypothesized to be associated with secreted proteins (15). One means of gaining insight into hypoxia-related secreted proteins is to analyze changes in mRNA expression in tumor cells that possess mutations in genes previously shown to modulate hypoxia-induced gene expression such as the VHL tumor suppressor gene. The VHL gene is located on chromosome 3p, and the protein is part of a multi-protein complex that regulates the oxygen-dependent ubiquitination and proteolysis of the HIF-1α transcription factor (16). Loss of VHL function decreases HIF-1α degradation under aerobic conditions and increases expression of many hypoxia-related downstream genes (17). Because HIF-1α-deficient human tumor cells do not exist, analysis of tumor cells that vary in VHL expression presents a reasonable approach to analyze the hypoxic tumor phenotype. We analyzed the NCI-60 cancer cell line microarray expression dataset (18) using the LDA classification method, which was designed to analyze gene expression differences between different sets of cell lines (19). We found OPN to be the most predictive gene of VHL status in the dataset; its expression inversely correlated with VHL expression. These results suggest that OPN may be linked to tumor hypoxia. We further investigated the relationship between plasma OPN levels and tumor pO2 in patients with HNSCC. We found that plasma OPN was increased in the serum of those patients with hypoxic tumors. In the same group of patients, there was a strong correlation between OPN and treatment outcomes and OPN and survival. These experiments suggest that OPN and tumor relapse could be partly linked to tumor hypoxia.
Materials and Methods
LDA of NCI-60 Cancer Cell Line Gene Array Expression.
We used the publicly available NCI-60 cancer cell line microarray expression database generated from 60 cancer cell lines as reported by Ross et al. (18). The VHL gene was represented by two separate spots on each microarray. For each microarray, information from both spots was combined using the following formula: log2 ratio = log2 [(Spot 1 Chan1 Diff + Spot 2 Chan1 Diff)/(Spot 1 Chan2 Diff + Spot 2 Chan2 Diff), where diff = difference in intensity of hybridized signals between the two spots]. The cells were partitioned into two groups: high VHL expressers (VHL log2 ratio > 0.5) and low VHL expressers (VHL log2 ratio ≤ 0.5) based on VHL log2 ratio. Cells with intermediate VHL log2 ratios were not considered for additional analysis. We used LDA, a machine learning algorithm method (19) to identify a gene profile that could best distinguish between the two groups of VHL expressers. The algorithm is implemented at CLEAVer 1.0 online.4
Cell Cultures.
The human SCC4 cells (tongue squamous cell carcinoma), ACHN and A498 cells (renal cell carcinomas), BT549 and MDA-MB-435S cells (breast carcinomas), and HCT15 cells (colorectal carcinoma) were obtained from the American Type Culture Collection (Manassas, VA). A549 cells (lung carcinoma) and DU145 (prostate carcinoma) were provided by Dr. J. Martin Brown (Stanford University) and Dr. Donna Peehl (Stanford University), respectively. The cells were grown in media containing 10% (v/v) FCS as specified by American Type Culture Collection.
Northern Blot Analysis.
Total RNA was isolated with Trizol. RNA (10 μg) was denatured in glyoxal and separated by agarose gel electrophoresis. The gel was then transferred by capillary action overnight to a Nytran membrane and cross-linked with UV light. OP-30 probe (OPN; American Type Culture Collection) and VHL probe (generously provided by Dr. Judith Frydman, Stanford University) were gel purified and labeled with 32P by random priming. Hybridization to 32P-labeled probes was carried out at 65°C using ExpressHyb solution (Clontech) and washed for 2 h to a stringency of 0.2 × SSC/1% SDS. Equal loading and transfer was demonstrated by methylene blue staining of 28S and 18S ribosomal bands. All membranes were exposed and quantitated with ImageQuant software.
Western Blot.
After hypoxia or reoxygenation treatment, the conditioned media was centrifuged at 1200 rpm for 4 min to remove cell debris and concentrated over 10-fold using Amicon concentrators. Protein concentration was estimated by the bicinchinonic acid (Rockford, IL). The conditioned media were mixed with 2 × SDS sample buffer to the appropriate concentration, heated to 95°C for 5 min, and separated by SDS-PAGE. A total of 20 μg of protein was loaded/well. After electrophoresing for 2 h at 40 mA in a 10% acrylamide gel, the gel was then transferred onto Hybond enhanced chemiluminescence (Amersham, Arlington Heights, IL) for 2 h and stained with 15% Ponceau-S to ensure uniform transfer. The membranes were blocked with 5% dried milk in TBST (Tris-buffered saline/0.2% Tween 20) for 1 h, incubated at 4°C overnight with 1:200 dilution of LF-124, a rabbit-raised polyclonal antibody, which was generously provided by Dr. Larry W. Fisher at the National Cancer Institute (20). The blot was then washed four times with TBST, incubated with antirabbit secondary antibodies conjugated with alkaline phosphatase at 1:2500 dilution for 1 h, washed four times with TBST, and autoradiographed using enhanced chemiluminescence (ECF; Amersham) according to the manufacturer’s protocol.
Hypoxia Treatment.
Cells were cultured as described above. Cells were washed with PBS and incubated in serum-free media immediately before treating for various amounts of time in a 37°C hypoxic incubator (Sheldon Manufacturing, Inc.), which maintained an environment <0.05% oxygen. The normoxic cells were similarly treated and maintained for various amounts of time in a 37°C incubator at room air. All experiments were performed at 70–80% cell confluence in the media pH of 7.0–7.4 for the duration of the experiment.
Patients.
Criteria for patients participating in the study include: (a) histologically confirmed diagnosis of HNSCC; (b) newly diagnosed without prior radiation or chemotherapy treatment; (c) palpable involved neck node or accessible primary tumor of microelectrode measurement; and (d) willing to sign an inform consent approved by the Stanford institutional review board (in accord with an assurance filed with and approved by the U.S. Department of Health and Human Services). Between 1999 and 2001, all patients who fit the above criteria and were evaluated at the Stanford Head and Neck tumor board were offered enrollment in the study. Approximately one-third of the patients otherwise eligible for the study consented to participate. Therefore, the patient study group consisted of 54 adults with newly diagnosed HNSCC; 49 had both OPN and pO2 measurements and 5 had OPN measurements only. Table 1 shows patient, tumor, and treatment characteristics.
Table 1.
Patient, tumor, and treatment characteristics
| Characteristic | No. of patients (%) | |
|---|---|---|
| Age | ≤55 | 29 (54) |
| >55 | 25 (46) | |
| Gender | Male | 40 (74) |
| Female | 14 (26) | |
| Tumor site | Oral cavity | 12 (22) |
| Oropharynx | 30 (56) | |
| Hypopharynx | 8 (15) | |
| Others | 4 (7) | |
| Tumor volume | ≤28 cm3 | 23 (43) |
| >28 cm3 | 24 (44) | |
| Unknown | 7 (13) | |
| Median tumor pO2 | ≤10 mm Hg | 24 (44) |
| >10 mm Hg | 25 (46) | |
| Unknown | 5 (9) | |
| Hb | <14 g/dl | 25 (46) |
| ≥14 g/dl | 28 (52) | |
| Unknown | 1 (2) | |
| OPN level | ≤450 μg/ml | 29 (54) |
| >450 μg/ml | 25 (46) | |
| Surgery | No | 28 (52) |
| Yes | 26 (48) | |
| Chemotherapy | No | 14 (26) |
| Yes | 40 (74) | |
| TPZ | No | 37 (69) |
| Yes | 17 (31) | |
| Radiotherapy | No | 4 (7) |
| Yes | 50 (93) |
The staging evaluation for all patients included history and physical examination, panendoscopy and examination under anesthesia, chest radiographs, complete blood count, and liver function tests. All also had head and neck imaging studies, either CT or magnetic resonant imaging studies. All were staged according to the 1988 American Joint Committee on Cancer staging system (21). Table 2 shows patient staging distribution by TNM staging. All patients were treated with either chemoradiotherapy or surgery plus radiotherapy. Four patients did not receive radiotherapy because of either patient refusal (1), early treatment related death (1), or rapid tumor progression resulting in death during induction chemotherapy (2). Patients were followed after primary treatment, initially monthly and then at longer intervals in a follow-up clinic where they were examined by radiation oncologists, head and neck surgeons, and medical oncologists. All first relapses were documented by tissue biopsy.
Table 2.
TNM staging distribution of 54 patients
| T-stage | ||||||
|---|---|---|---|---|---|---|
| N-stage | 0 | 1 | 2 | 3 | 4 | Total |
| 0 | 0 | 0 | 3 | 0 | 5 | 8 |
| 1 | 0 | 0 | 0 | 0 | 1 | 1 |
| 2 | 2 | 2 | 12 | 7 | 11 | 34 |
| 3 | 1 | 4 | 3 | 0 | 3 | 11 |
| Total | 3 | 6 | 18 | 7 | 20 | 54 |
A separate VHL patient group consisted of 31 patients with a confirmed VHL diagnosis by genetic screening. All of these patients had at least one of their VHL genes mutated. A third of these patients also had hemangioblastomas involving the central nervous system as a result of the second allelic loss in these areas at the time of plasma collection. One patient underwent a renal transplant for bilateral renal cell carcinomas. He was free of renal cell tumor at the time the plasma was obtained.
The control group consisted of 15 healthy volunteers (7 males and 8 females) who were in a similar age group as the VHL patients. These volunteers consisted of mainly hospital personnel recruited into the study. All study subjects (VHL patients, healthy volunteers, and head and neck cancer patients) signed an institutional review board-approved informed consent form, and all guidelines for human subject investigation were followed.
Oxygen Tension Measurement.
All measurements were performed using a computerized histograph (Sigma Eppendorf PO2 Histograph, Hamburg, Germany) as described previously (22). Fifty to eighty pO2 measurements in two to three tracks were recorded from each tumor, and an equal number of measurements were taken from normal tissues. Tumor pO2 was obtained from the primary tumor in 8 patients and from the involved neck node in 41 patients. These measurements were pooled together based on a prior publication indicating a highly significant correlation between pO2 measurements taken from the primary tumor or the involved neck nodes in the same patients for HNSCC (23). CT guided placement of the electrode was used in patients with lymph node ≤2 cm. The measurements were presented in the form of histograms along with the calculation of a median pO2, percentage of values <2.5 mm Hg (HF2.5), and percentage of values <5 mm Hg (HF5) for each measured site. In all patients, the median tumor pO2 was consistently lower than that of normal s.c. tissues from the same patient.
Plasma Sample.
A 5-ml blood sample was obtained by venipuncture into a vacutainer coated with 3.2% sodium citrate. The samples were centrifuged at 3000 rpm at 4°C for 10 min within 30 min of collection. The plasma was aliquoted and stored at −80°C until analysis.
OPN ELISA Analysis.
OPN protein levels were measured using an ELISA method (Assay Designs, Inc., Ann Arbor, MI) according to the manufacturer’s instructions. The ELISA is designed to detect human OPN in serum with a detection limit ≥ 2.2 ng/ml, a 5% intra-assay, and a 2% interassay variability.
Statistical Analysis.
Statistical analysis was performed using Statistix (Analytical Software, Inc., Tallahassee, MI) and Stata (Computing Resource Center, San Monica, CA) statistical software. Spearman rank test was used to determine the relationship between OPN and median tumor pO2. The stepwise linear regression method was used in multivariate analysis to identify factors that correlated with median tumor pO2 (24). Studied variables were age, gender, pack-year of cigarette used, tumor stage, nodal stage, Hb, and OPN levels. FFR was computed with the Kaplan-Meier product-limit method (24). Outcomes were measured from the date of diagnosis to the date of failure. Log-rank statistics were used to identify important prognostic factors for FFR and overall survival. Analyzed variables were age, gender, tumor stage, nodal stage, treatment methods, median tumor pO2, tumor volume, Hb, and OPN levels. Only factors that achieved statistical significance on univariate analysis (P < 0.05) were entered into a step-wise Cox proportional hazard model for multivariate analysis (25). The t test was used to compare the difference in the mean OPN levels between VHL patients and healthy volunteers (24).
Results
OPN Expression in Relation to VHL Gene Expression and Tumor pO2.
Of the 60 cell lines in the National Cancer Institute database, we identified 16 low and 9 high VHL expressing cell lines. Given the small number of samples in each of the labeled groups relative to the large number of genes in each sample, it was important to select an appropriate machine-learning strategy. LDA is a simple well-studied machine-learning algorithm that has few parameters that are selected in a principled manner; parameter selection is constrained by the assumption that the data are normally distributed. Additionally, LDA provides confidence scores for its predictions and discrimination weights for each gene. Using LDA, we were able to identify a gene profile that can best distinguish high VHL expressers from low expressers in these 25 cell lines with an estimated accuracy of 81.6% on unseen profiles over 10 cross-validation trials. Within this gene profile, OPN was the highest weighted gene. Its expression was inversely correlated with VHL expression (Fig. 1A). Eighteen cell lines had adequate information on both OPN and VHL gene expression. Of these, 11 were low and 7 were high expressers. Eight of 11 low expressers had high OPN mRNA expression on the gene array.
Fig. 1.
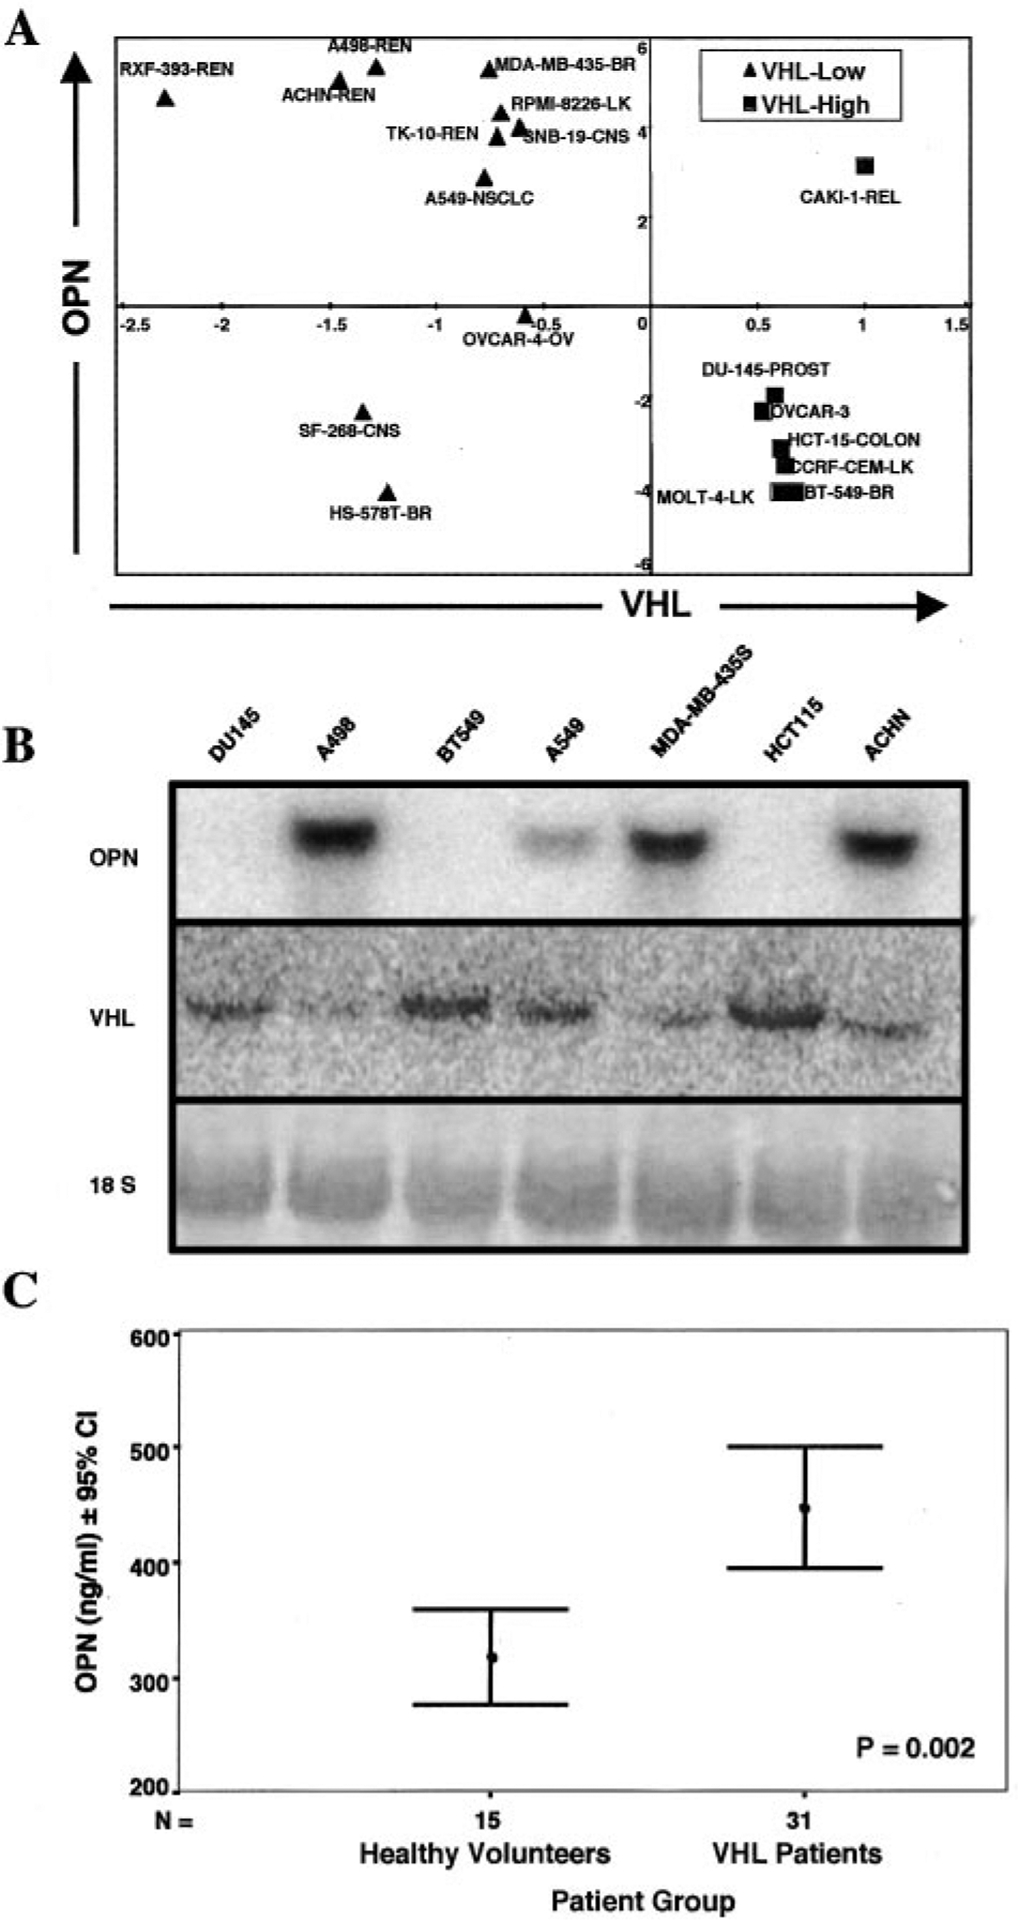
VHL versus OPN expression. A, identification of 11 low VHL expressers (VHL log2 ratio < −0.5) and 7 high VHL expressers (VHL log2 ratio > 0.5). The remaining cell lines had VHL log2 ratios between 0.5 and −0.5 and were not considered further in this analysis. Using LDA, we were able to identify OPN as a VHL regulated gene that encoded a secreted product. B, Northern blot analysis of OPN and VHL gene expressions in seven human cancer cell lines identified from LDA analysis. These results support the gene arrays data. Methylene blue staining showed equal loading of all lanes. C, comparison of mean plasma OPN levels in 31 VHL patients and 15 healthy volunteers by ELISA assay. VHL patients had significantly higher OPN plasma levels than that of age-matched volunteers.
Northern blot analysis of seven randomly chosen cell lines from Fig. 1A confirmed the inverse relationship of VHL and OPN gene expression (Fig. 1B). As predicted from the gene array analysis, ACNH, A498, MDA-MB-435S, and A549 expressed intermediate to high levels of OPN and low levels of VHL mRNA. Similarly, BT549, HCT15, and DU145 expressed undetectable levels of OPN and elevated levels of VHL mRNA. ELISA analysis of OPN protein levels in these cell lines validated the Northern blot results. Cells with low VHL expression had intermediate to high OPN protein levels, and cells with high VHL expression had low OPN protein levels (data not shown).
To determine whether OPN levels were elevated in patients lacking the VHL tumor suppressor gene, we compared OPN levels in 31 VHL patients with the comparable 15 control healthy volunteers. The mean OPN level for healthy volunteers was 318 ng/ml (range: 233–461) and that for VHL patients was 447 ng/ml (range: 261–843.2; Fig. 1C). The difference of OPN level between the two groups was statistically significant by t test (P = 0.002).
To assess whether OPN is also regulated by hypoxia, we investigated the levels of intracellular and secreted OPN proteins in SCC4, a HNSCC cancer cell line after exposure to either normoxia or different time courses of hypoxia (Fig. 2A). OPN levels in the media was 0 ng/ml at 2 and 4 h, 1.2 ng/ml at 6 h, 123 ng/ml at 12 h, and 322 ng/ml at 24 h of hypoxia exposure, suggesting hypoxia stimulated OPN secretion into the media. Normoxia controls showed that after 24 h, a low level of OPN secretion could be detected in the media but less when compared with hypoxia. These results were confirmed by the Western blot in Fig. 2B, which shows that OPN levels in the cultured media significantly increased with hypoxia exposure or hypoxia with reoxygenation in comparison to that from cells exposed to the same time course under normoxia. These results suggest that hypoxia and reoxygenation regulate OPN extracellular secretion in SCC4 cells.
Fig. 2.
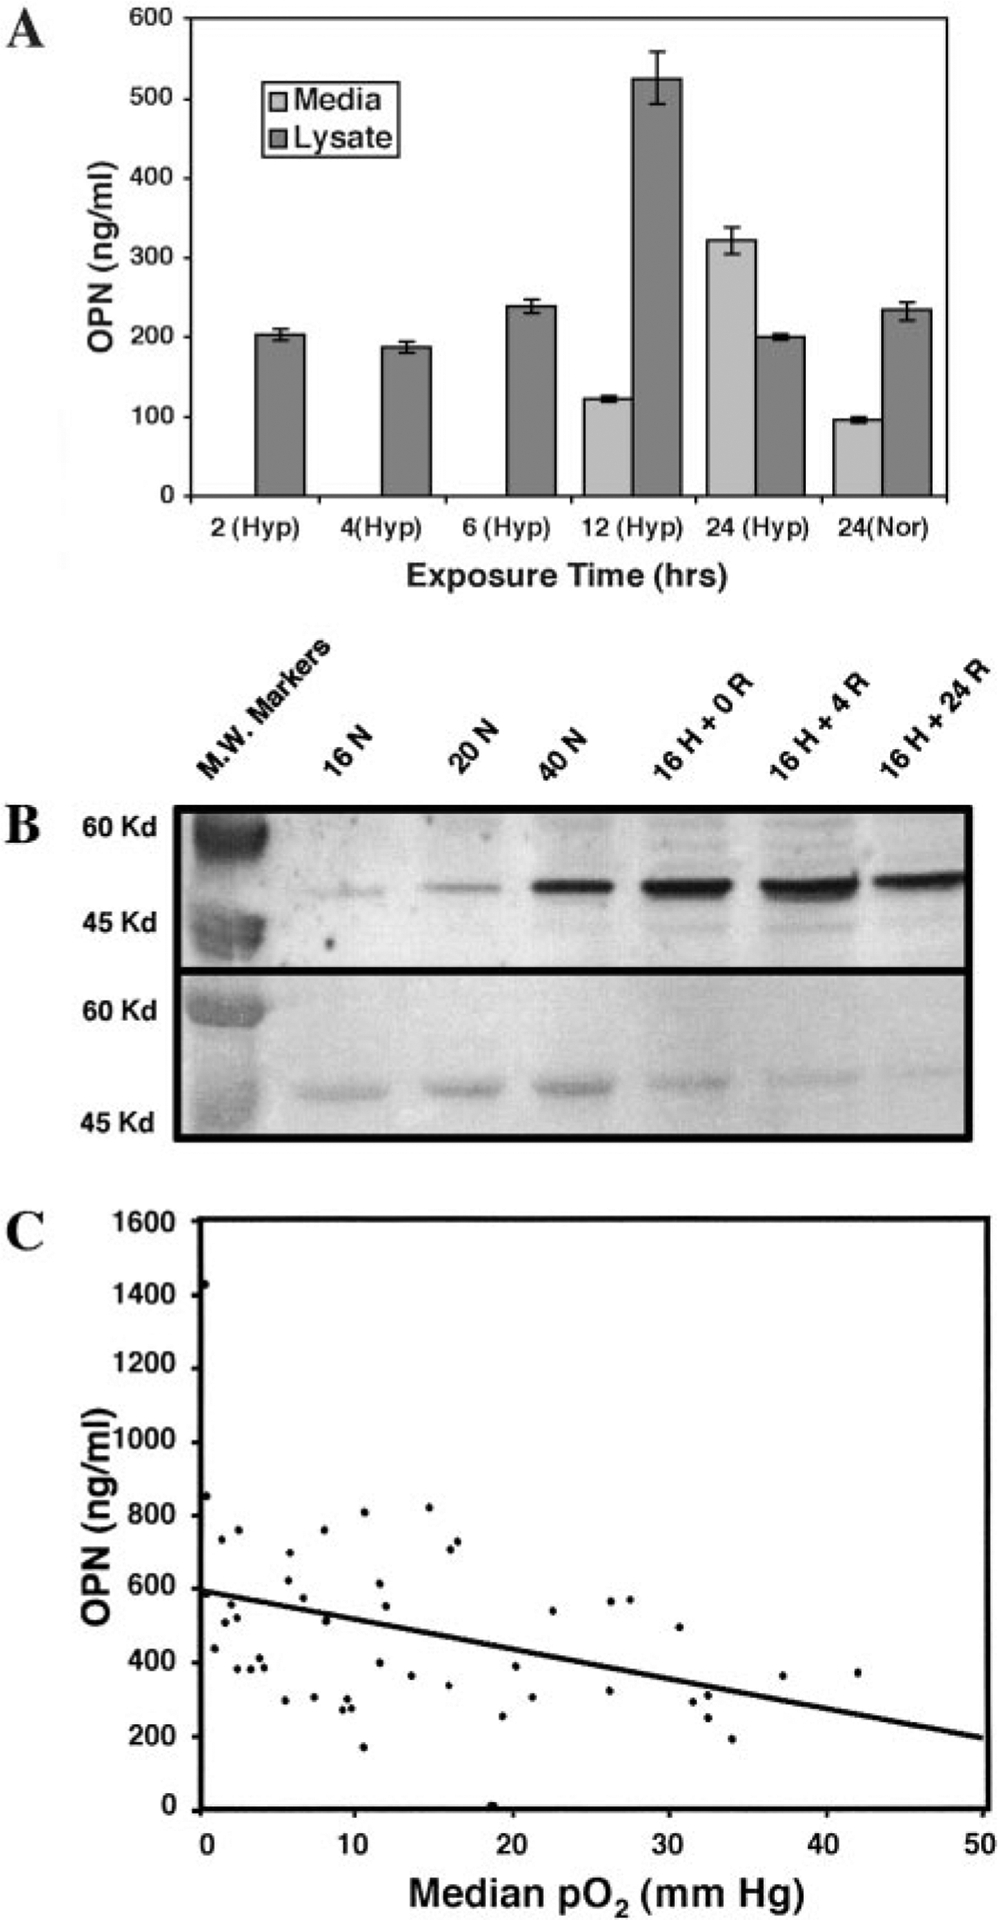
OPN and tumor hypoxia. A, ELISA analysis of OPN expression in serum-free conditioned media and cell lysates from SCC4 cells after a time course of hypoxia exposure or 24 h of normoxia. Error bars represented replicated measurements. B, Western blot showing OPN expression in serum-free conditioned media from SCC4 cells after (a) 16 h of normoxia, (b) 20 h of normoxia, (c) 40 h of normoxia, (d) 16 h of hypoxia, (e) 16 h of hypoxia + 4 h of reoxygenation, (f) 16 h of hypoxia + 24 h of reoxygenation. Ponceau-S staining show equal loading for all lanes. Hypoxia and hypoxia and reoxygenation enhanced OPN secretion into the media. C, correlation between plasma OPN levels and median tumor pO2 in patients with HNSCC.
To assess the relationship between OPN levels and tumor hypoxia, we measured OPN plasma levels and tumor pO2 in 49 patients with previously untreated HNSCC. Fig. 2C shows the correlation between the median pO2 and plasma OPN levels in this patient group with a correlation coefficient of −0.42 and a P of 0.003 using the Spearman rank method. We also performed a stepwise regression analysis to identify factors that correlate with tumor median pO2. Factors evaluated were age, gender, pack-year of cigarette use, tumor stage, nodal stage, tumor volume, Hb, and OPN. OPN had the strongest correlation with tumor pO2 and preserved its statistical significance in combination with the remaining factors (P = 0.01).
OPN and Clinical Outcomes.
We then investigated the relationship between OPN levels and treatment outcomes in the 54 HNSCC patients. The median follow-up was 14.4 months (range: 2–32.2 months) and all but 2 alive and non-relapsing patients have had at least 1 year of follow-up. No patients were lost to follow-up. To date, 24 patients have relapsed. The median time to relapse in patients who relapsed was 6.1 months and 20 of 24 relapses occurred within 1 year of treatment. The 1-year FFR rate was 62%. Patients were grouped as having high or low OPN levels based on the median OPN level for the entire patient population (OPN > 450 ng/ml versus ≤450 ng/ml). Patients with high OPN levels had significantly poorer tumor control than those with low OPN (P = 0.005, Fig. 3A). Other factors that appeared to influence FFR on univariate analyses with a P < 0.05 were age, primary tumor site (favoring oropharynx over other sites) and the use of chemotherapy. Patients with median tumor pO2 ≤ 10 mm Hg had a lower FFR rate than those with median pO2 > 10 mm Hg. The 1 and 2-year FFR rates were 57 and 42%, respectively, for patients with median pO2 ≤ 10 mm Hg, and they were 68 and 63%, respectively, for patients with median pO2 > 10 mm Hg. However, the difference did not reach statistical significance (P = 0.29). Multivariate analysis showed that plasma OPN levels (favoring low OPN, P = 0.01) and primary tumor site (favoring oropharyngeal site, P = 0.03) were the only significant predictors for FFR after adjusting for the other factors significant in univariate analysis (Table 3). At the last follow up, 19 patients have died; 1 from treatment-related toxicity, 1 from a second primary tumor, and 17 from HNSCC. The 1-year overall survival was 81%. OPN was an important prognostic factor for survival (P = 0.0006, Fig. 3B). Univariate analysis revealed that age, N-stage, tumor volume, and OPN levels were potential prognostic factors for survival with Ps < 0.05. Multivariate analysis including only these four significant factors revealed that OPN levels (favoring low levels, P = 0.02) and N-stage (favoring N0–2 patients, P = 0.007; Table 3) were significant predictors for survival. Age was of borderline significance (P = 0.06). Within each N-stage group (N0–2 and N3), OPN also appeared to be an independent predictor for survival (Fig. 3, C and D).
Fig. 3.

A, Kaplan-Meier estimates of FFR by OPN plasma levels. B, overall survival by OPN plasma levels. C, overall survival by OPN plasma levels in patients with N0–2 neck nodes. D, overall survival by OPN plasma levels in patients with N3 neck nodes.
Table 3.
Results of multivariate Cox proportional hazard model analysis on freedom from relapse and overall survival
| FFR | Overall Survival | |||||
|---|---|---|---|---|---|---|
| Parameter | P | HRa | 95% CI | P | HR | 95% CI |
| Age (continuous) | 0.37 | 1.01/yr | 0.98–1.05 | 0.06 | 1.04/yr | 1.00–1.09 |
| OPN (≤450 versus >450 μg/ml) | 0.01 | 3.0 | 1.3–7.3 | 0.02 | 6.3 | 1.4–68.9 |
| Chemotherapy (yes versus no) | 0.18 | 0.53 | 0.2–1.3 | NA | NA | NA |
| Primary tumor site (oropharynx versus others) | 0.03 | 2.5 | 1.1–5.9 | NA | NA | NA |
| TV (≤28 versus >28 cm3) | NA | NA | NA | 0.46 | 1.6 | 0.5–5.0 |
| N-stage (0–2 versus 3) | NA | NA | NA | 0.007 | 5.3 | 1.6–17.7 |
HR, hazard ratio; CI, confidence interval; NA, not applicable. The parameter was not entered into the multivariate model because of its lack of significance on univariate analysis.
Discussion
We first identified the possible link between OPN and tumor hypoxia based on its relationship with VHL on microarray analysis. This finding led us to further investigate the relationship between OPN and hypoxia. This method of marker discovery highlights the importance of publicly available microarray datasets and tools for their analysis. With the tremendous increase in gene expression data, this information will serve as an invaluable resource for target and marker identification.
OPN, located on chromosome 4, is a secreted calcium binding glycophosphoprotein and is expressed by a limited number of normal cells and tissues (26). OPN has been identified as a tumor-associated protein, and its expression has been linked to HNSCC tumor progression (27). The OPN protein contains several cell adhesive domains, including an arginineglycine-aspartate sequence, which mediates cell-substrate attachment and chemotaxis (28). In this prospective study, we showed that OPN plasma levels are elevated in all studied VHL patients in comparison to healthy volunteers. Although the number of patients is small, the findings are consistent with the gene array analysis, suggesting OPN may be a VHL-modulated protein.
In this study, we found a correlation between OPN plasma level and tumor pO2 as measured by microelectrode readings, a widely accepted method of assessing tumor hypoxia. Although there was a highly significant P, the correlation coefficient was only 0.42. There are a number of possible explanations for this finding. First, because of a number of constrains, we were able to perform CT-guided pO2 measurement only in patients with lymph nodes <2 cm. Although all patients were required to have pathologic documentation of nodal involvement and we were confident that the tip of the electrode penetrated the capsule of the lymph node, it could be possible that our pO2 measurements include those in the tumor areas as well as those in nearby normal nodal tissues. Likewise, similar to other secreted factors, OPN level may be up-regulated by other nonhypoxic stimuli such as inflammatory states or interstitial pressure (29, 30). In addition, there may be other sources of OPN in patients that may not be related to tumors such as those secreted by macrophages and lymphocytes (31, 32). We have recently found that OPN is up-regulated at the mRNA level by hypoxia in differentiated macrophages (data not shown). OPN blood levels may also be influenced by existing medical comorbidities, which cannot be taken into account in this small group of older patients (26, 33). Finally, OPN and oxygen electrode readings may represent two different measurements of tumor hypoxia. Oxygen electrode measurements are likely to be dominated by the necrosis (34), whereas OPN secretion is more likely to be related to chronic hypoxia as suggested by the cell line experiments. Despite these factors that can adversely influence the correlation between the two methods, there was nevertheless a significant correlation between the OPN and tumor pO2, supporting the feasibility of using a serum marker to identify patients with hypoxic tumors. A panel of secreted makers or a combination of tissue and secreted markers would probably be more useful in assessing tumor hypoxia than a single marker alone. We are in the process of evaluating other potential markers that can be used in combination with OPN to assess tumor hypoxia.
Although patients with hypoxic tumors (median pO2 ≤ 10 mg Hg) had lower FFR rates than those with more oxic tumors (median pO2 > 10 mg Hg), tumor pO2 was not an independent predictor for treatment outcomes in this study. This may be because 17 of these patients also received TPZ, a hypoxic cell toxin, in combination with standard chemoradiotherapy as part of an institutional Phase II study. The use of TPZ may negate the adverse effect of tumor hypoxia in this small group of patients. Interestingly, the use of TPZ did not appear to nullify the prognostic impact of OPN. This suggests that OPN exert its adverse effect by additional mechanisms other than hypoxia. For example, OPN has been shown to enhance tumor cell invasion, an effect most likely independent of hypoxia (35). In addition, overexpression of OPN leads to increase in activation of growth receptor pathways and increased proteolytic enzyme activities (36). Finally, OPN is highly expressed in tumor-associated macrophages (37), the presence of which has been associated with poor outcomes in solid tumors (38).
OPN has been shown to be a prognostic factor for tumor progression and survival in a number of solid neoplasms, including breast (39), gastric (40), and brain tumors (41). OPN overexpression is found only in dysplastic and cancerous HNSCC and not in normal mucosa (27). OPN gene knockout studies indicated that OPN inhibits macrophage function and enhances the growth and survival of metastases (42). Experiments from these studies suggest that OPN is involved in tumor protection from immune surveillance and enhancement of tumor cell survival. In this study, we found a significant correlation between plasma OPN level and the risk of tumor relapse and death in patients with HNSCC. Patients with higher OPN levels appeared to have highly aggressive tumors compared with those with low levels because 16 of 18 patients died of persistent or relapsing tumors. This study suggests that one possible link between OPN and tumor aggressiveness could be via tumor hypoxia; however, other mechanisms cannot be ruled out (35). We recognize that this is a small study with a relatively short follow-up in a group of patients that were treated heterogeneously. Some patients were treated with surgery and postoperative radiotherapy, whereas others received definitive chemoradiotherapy with surgery reserved for salvage therapy. The impact of OPN and tumor hypoxia on the treatment outcomes in relation to different treatment modalities is unclear. Hockel et al. (14, 43) noted that hypoxia was an adverse prognostic factor in both surgically or radiation treated patients, regardless of the type of treatment received. In contrast, the expression of HIF-1a in tumor tissues was associated with poor outcomes in HNSCC patients treated with radiation therapy but not with surgery (44, 45). We attempted to control for the effects of treatment by evaluating the impact of individual therapy on FFR and overall survival in this group of patients. The use of chemotherapy appeared to influence FFR on univariate analysis; however, it was not significant on multivariate analysis. The use of surgery either as definitive or as a salvage treatment did not impact either FFR or overall survival. OPN, on the other hand, continues to be the most significant predictor for both tumor relapse and survival even when controlled for other potential prognostic variables. Additional follow-up and a larger patient sample size will be necessary to confirm these findings.
In summary, we have shown that OPN plasma levels are elevated in VHL patients and in HNSCC patients with hypoxic tumors. OPN plasma levels may also serve as a potential prognostic factor for tumor relapse and survival in HNSCC patients. Additional follow-up and more patients are required to confirm the findings in this study.
Acknowledgments
We thank Sharon Clarke for assistance with preparation of the manuscript. We also thank Eunice Chen for the assistance with the Western blots and all of the members of the Giaccia lab for technical assistance and helpful discussions.
Supported by the American Society of Therapeutic Radiology Young Investigator Grant and Stanford Clinical Cancer Center Grant (to Q-T. L.) and PHS Grant CA67166, awarded by the National Cancer Institute, Department of Health and Human Services (to A. J. G.). Presented at the Society of Clinical Oncology Annual Meeting, Orlando, FL, May 2002.
Footnotes
The abbreviations used are: HNSCC, head and neck squamous cell carcinoma; OPN, osteopontin; TNM, Tumor-Node-Metastasis; VHL, von Hippel Lindau; HIF-1, hypoxia-induced factor-1; LDA, linear discriminant analysis; CT, computed tomography; Hb, hemoglobin; FFR, freedom from relapse; TPZ, Tirapazamine.
Internet address: classify.stanford.edu.
Contributor Information
Quynh-Thu Le, Department of Radiation Oncology, Center for Clinical Science Research-South, Stanford, California 94305-5152.
Patrick D. Sutphin, Department of Radiation Oncology, Center for Clinical Science Research-South, Stanford, California 94305-5152
Soumya Raychaudhuri, Department of Radiation Oncology, Center for Clinical Science Research-South, Stanford, California 94305-5152.
Sheue Ching T. Yu, Department of Radiation Oncology, Center for Clinical Science Research-South, Stanford, California 94305-5152
David J. Terris, Department of Otolaryngology, Stanford University, Stanford, California 94305
Ho Sheng Lin, Department of Otolaryngology, Stanford University, Stanford, California 94305.
Bert Lum, Department of Medicine, Stanford University, Stanford, California 94305.
Harlan A Pinto, Department of Medicine, Stanford University, Stanford, California 94305.
Albert C. Koong, Department of Radiation Oncology, Center for Clinical Science Research-South, Stanford, California 94305-5152
Amato J. Giaccia, Department of Radiation Oncology, Center for Clinical Science Research-South, Stanford, California 94305-5152
References
- 1.Greenlee RT, Hill-Harmon MB, Murray T, and Thun M Cancer statistics, 2001. CA - Cancer J. Clin, 51: 15–36, 2001. [DOI] [PubMed] [Google Scholar]
- 2.Takes RP, Baatenburg de Jong RJ, Schuuring E, Hermans J, Vis AA, Litvinov SV, and van Krieken JH Markers for assessment of nodal metastasis in laryngeal carcinoma. Arch. Otolaryngol. Head Neck Surg, 123: 412–419, 1997. [DOI] [PubMed] [Google Scholar]
- 3.Piccirillo JF, and Feinstein AR Clinical symptoms and comorbidity: significance for the prognostic classification of cancer. Cancer (Lond.), 77: 834–842, 1996. [PubMed] [Google Scholar]
- 4.Koch WM, Brennan JA, Zahurak M, Goodman SN, Westra WH, Schwab D, Yoo GH, Lee DJ, Forastiere AA, and Sidransky D p53 mutation and locoregional treatment failure in head and neck squamous cell carcinoma. J. Natl. Cancer Inst. (Bethesda), 88: 1580–1586, 1996. [DOI] [PubMed] [Google Scholar]
- 5.Brennan JA, Mao L, Hruban RH, Boyle JO, Eby YJ, Koch WM, Goodman SN, and Sidransky D Molecular assessment of histopathological staging in squamous-cell carcinoma of the head and neck. N. Engl. J. Med, 332: 429–435, 1995. [DOI] [PubMed] [Google Scholar]
- 6.Lee DJ, Koch WM, Yoo G, Lango M, Reed A, Califano J, Brennan JA, Westra WH, Zahurak M, and Sidransky D Impact of chromosome 14q loss on survival in primary head and neck squamous cell carcinoma. Clin. Cancer Res, 3: 501–505, 1997. [PubMed] [Google Scholar]
- 7.Zeng Q, Smith DC, Suscovich TJ, Gooding WE, Trump DL, and Grandis JR Determination of intermediate biomarker expression levels by quantitative reverse transcription-polymerase chain reaction in oral mucosa of cancer patients treated with liarozole. Clin. Cancer Res, 6: 2245–2251, 2000. [PubMed] [Google Scholar]
- 8.Grandis JR, Melhem MF, Gooding WE, Day R, Holst VA, Wagener MM, Drenning SD, and Tweardy DJ Levels of TGF-α and EGFR protein in head and neck squamous cell carcinoma and patient survival. J. Natl. Cancer Inst. (Bethesda), 90: 824 – 832, 1998. [DOI] [PubMed] [Google Scholar]
- 9.Chambers AF Regulation and function of osteopontin in ras-transformed cells. Ann. N. Y. Acad. Sci, 760: 101–108, 1995. [DOI] [PubMed] [Google Scholar]
- 10.Brown JM, and Giaccia AJ The unique physiology of solid tumors: opportunities (and problems) for cancer therapy. Cancer Res., 58: 1408–1416, 1998. [PubMed] [Google Scholar]
- 11.Nordsmark M, Overgaard M, and Overgaard J Pretreatment oxygenation predicts radiation response in advanced squamous cell carcinoma of the head and neck. Radother. Oncol, 41: 31–39, 1996. [DOI] [PubMed] [Google Scholar]
- 12.Brizel DM, Dodge RK, Clough RW, and Dewhirst MW Oxygenation of head and neck cancer: changes during radiotherapy and impact on treatment outcome. Radiother. Oncol, 53: 113–117, 1999. [DOI] [PubMed] [Google Scholar]
- 13.Fyles AW, Milosevic M, Wong R, Kavanagh MC, Pintilie M, Sun A, Chapman W, Levin W, Manchul L, Keane TJ, and Hill RP Oxygenation predicts radiation response and survival in patients with cervix cancer. Radiother. Oncol, 48: 149 – 156, 1998. [DOI] [PubMed] [Google Scholar]
- 14.Hockel M, Schlenger K, Aral B, Mitze M, Schaffer U, and Vaupel P Association between tumor hypoxia and malignant progression in advanced cancer of the uterine cervix. Cancer Res., 56: 4509–4515, 1996. [PubMed] [Google Scholar]
- 15.Denko N, Schindler C, Koong A, Laderoute K, Green C, and Giaccia A Epigenetic regulation of gene expression in cervical cancer cells by the tumor microenvironment. Clin. Cancer Res, 6: 480–487, 2000. [PubMed] [Google Scholar]
- 16.Maxwell PH, Wiesener MS, Chang GW, Clifford SC, Vaux EC, Cockman ME, Wykoff CC, Pugh CW, Maher ER, and Ratcliffe PJ The tumour suppressor protein VHL targets hypoxia-inducible factors for oxygen-dependent proteolysis. Nature (Lond.), 399: 271–275, 1999. [DOI] [PubMed] [Google Scholar]
- 17.Wykoff CC, Pugh CW, Maxwell PH, Harris AL, and Ratcliffe PJ Identification of novel hypoxia dependent and independent target genes of the von Hippel-Lindau (VHL) tumour suppressor by mRNA differential expression profiling. Oncogene, 19: 6297–6305, 2000. [DOI] [PubMed] [Google Scholar]
- 18.Ross DT, Scherf U, Eisen MB, Perou CM, Rees C, Spellman P, Iyer V, Jeffrey SS, Van de Rijn M, Waltham M, Pergamenschikov A, Lee JC, Lashkari D, Shalon D, Myers TG, Weinstein JN, Botstein D, and Brown PO Systematic variation in gene expression patterns in human cancer cell lines. Nat. Genet, 24: 227–235, 2000. [DOI] [PubMed] [Google Scholar]
- 19.Riley BD Pattern Recognition and Neural Networks, pp. 91–120. Cambridge, United Kingdom: Cambridge University Press, 1999. [Google Scholar]
- 20.Fisher LW, Stubbs JT III, and Young MF Antisera and cDNA probes to human and certain animal model bone matrix noncollagenous proteins. Acta Orthop. Scand. Suppl, 266: 61–65, 1995. [PubMed] [Google Scholar]
- 21.Sobin LH, Hermanek P, and Hutter RV TNM classification of malignant tumors. A comparison between the new (1987) and the old editions. Cancer (Phila.), 61: 2310–2314, 1988. [DOI] [PubMed] [Google Scholar]
- 22.Terris DJ, and Dunphy EP Oxygen tension measurements of head and neck cancers. Arch. Otolaryngol. Head Neck Surg, 120: 283–287, 1994. [DOI] [PubMed] [Google Scholar]
- 23.Becker A, Hansgen G, Bloching M, Weigel C, Lautenschlager C, and Dunst J Oxygenation of squamous cell carcinoma of the head and neck: comparison of primary tumors, neck node metastases, and normal tissue. Int. J. Radiat. Oncol. Biol. Phys, 42: 35–41, 1998. [DOI] [PubMed] [Google Scholar]
- 24.Glanz SA, and Slinker BK Primer of applied regression analysis of variance, pp. 50–109, 512–68. New York: McGraw-Hill, Inc, 1990. [Google Scholar]
- 25.Cox DR Regression models and life tables. J. R. Stat. Soc, 34: 187–220, 1972. [Google Scholar]
- 26.Denhardt DT, Lopez CA, Rollo EE, Hwang SM, An XR, and Walther SE Osteopontin-induced modifications of cellular functions. Ann. N. Y. Acad. Sci, 760: 127–142, 1995. [DOI] [PubMed] [Google Scholar]
- 27.Devoll RE, Li W, Woods KV, Pinero GJ, Butler WT, Farach-Carson MC, and Happonen RP Osteopontin (OPN) distribution in premalignant and malignant lesions of oral epithelium and expression in cell lines derived from squamous cell carcinoma of the oral cavity. J. Oral Pathol. Med, 28: 97–101, 1999. [DOI] [PubMed] [Google Scholar]
- 28.Denhardt DT, and Guo X Osteopontin: a protein with diverse functions. FASEB J., 7: 1475–1482, 1993. [PubMed] [Google Scholar]
- 29.Sodek J, Ganss B, and McKee MD Osteopontin. Crit. Rev. Oral Biol. Med, 11: 279–303, 2000. [DOI] [PubMed] [Google Scholar]
- 30.Klein-Nulend J, Roelofsen J, Semeins CM, Bronckers AL, and Burger EH Mechanical stimulation of osteopontin mRNA expression and synthesis in bone cell cultures. J. Cell. Physiol, 170: 174–181, 1997. [DOI] [PubMed] [Google Scholar]
- 31.Uede T, Katagiri Y, Iizuka J, and Murakami M Osteopontin, a coordinator of host defense system: a cytokine or an extracellular adhesive protein? Microbiol. Immunol, 41: 641–648, 1997. [DOI] [PubMed] [Google Scholar]
- 32.Ashkar S, Weber GF, Panoutsakopoulou V, Sanchirico ME, Jansson M, Zawaideh S, Rittling SR, Denhardt DT, Glimcher MJ, and Cantor H Eta-1 (osteopontin): an early component of type-1 (cell-mediated) immunity. Science (Wash. DC), 287: 860 – 864, 2000. [DOI] [PubMed] [Google Scholar]
- 33.Denhardt DT, and Noda M Osteopontin expression and function: role in bone remodeling. J. Cell. Biochem Suppl., 30–31: 92–102, 1998. [PubMed] [Google Scholar]
- 34.Loncaster JA, Harris AL, Davidson SE, Logue JP, Hunter RD, Wycoff CC, Pastorek J, Ratcliffe PJ, Stratford IJ, and West CM Carbonic anhydrase (CA IX) expression, a potential new intrinsic marker of hypoxia: correlations with tumor oxygen measurements and prognosis in locally advanced carcinoma of the cervix. Cancer Res., 61: 6394–6399, 2001. [PubMed] [Google Scholar]
- 35.Tuck AB, Arsenault DM, O’Malley FP, Hota C, Ling MC, Wilson SM, and Chambers AF Osteopontin induces increased invasiveness and plasminogen activator expression of human mammary epithelial cells. Oncogene, 18: 4237–4246, 1999. [DOI] [PubMed] [Google Scholar]
- 36.Tuck AB, and Chambers AF The role of osteopontin in breast cancer: clinical and experimental studies. J. Mammary Gland Biol. Neoplasia, 6: 419–429, 2001. [DOI] [PubMed] [Google Scholar]
- 37.Brown LF, Papadopoulos-Sergiou A, Berse B, Manseau EJ, Tognazzi K, Perruzzi CA, Dvorak HF, and Senger DR Osteopontin expression and distribution in human carcinomas. Am. J. Pathol, 145: 610–623, 1994. [PMC free article] [PubMed] [Google Scholar]
- 38.Bingle L, Brown NJ, and Lewis CE The role of tumour-associated macrophages in tumour progression: implications for new anticancer therapies. J. Pathol, 196: 254–265, 2002. [DOI] [PubMed] [Google Scholar]
- 39.Singhal H, Bautista DS, Tonkin KS, O’Malley FP, Tuck AB, Chambers AF, and Harris JF Elevated plasma osteopontin in metastatic breast cancer associated with increased tumor burden and decreased survival. Clin. Cancer Res, 3: 605–611, 1997. [PubMed] [Google Scholar]
- 40.Ue T, Yokozaki H, Kitadai Y, Yamamoto S, Yasui W, Ishikawa T, and Tahara E Co-expression of osteopontin and CD44v9 in gastric cancer. Int. J. Cancer, 79: 127–132, 1998. [DOI] [PubMed] [Google Scholar]
- 41.Saitoh Y, Kuratsu J, Takeshima H, Yamamoto S, and Ushio Y Expression of osteopontin in human glioma. Its correlation with the malignancy. Lab Investig., 72: 55–63, 1995. [PubMed] [Google Scholar]
- 42.Crawford HC, Matrisian LM, and Liaw L Distinct roles of osteopontin in host defense activity and tumor survival during squamous cell carcinoma progression in vivo. Cancer Res., 58: 5206 – 5215, 1998. [PubMed] [Google Scholar]
- 43.Hockel M, Schlenger K, Hockel S, and Vaupel P Hypoxic cervical cancers with low apoptotic index are highly aggressive. Cancer Res., 59: 4525–4528, 1999. [PubMed] [Google Scholar]
- 44.Aebersold DM, Burri P, Beer KT, Laissue J, Djonov V, Greiner RH, and Semenza GL Expression of hypoxia-inducible factor-1α: a novel predictive and prognostic parameter in the radiotherapy of oropharyngeal cancer. Cancer Res., 61: 2911–2916, 2001. [PubMed] [Google Scholar]
- 45.Beasley NJ, Leek R, Alam M, Turley H, Cox GJ, Gatter K, Millard P, Fuggle S, and Harris AL Hypoxia-inducible factors HIF-1α and HIF-2α in head and neck cancer: relationship to tumor biology and treatment outcome in surgically resected patients. Cancer Res., 62: 2493–2497, 2002. [PubMed] [Google Scholar]