Abstract
Many neurodegenerative diseases are characterized by the accumulation of amyloid fibers in the brain, which can occur when a protein misfolds into an extended β-sheet conformation. The nucleation of these β-sheet aggregates is of particular interest, not only because it is the rate-determining step toward fiber formation but also because early, soluble aggregate species may be the cytotoxic entities in many diseases. In the case of the prion peptide H1 (residues 109–122 of the prion protein) stable amyloid fibers form only after the β-strands of the peptide have adopted their equilibrium antiparallel β-sheet configuration with residue 117 in register across all strands. In this article, we present the kinetic details of the realignment of these β-strands from their fastformed nonequilibrium structure, which has no regular register of the strands, into the more ordered β-sheets capable of aggregating into stable fibers. This process is likely the nucleating step toward the formation of stable fibers. Isotope-edited IR spectroscopy is used to monitor the alignment of the β-strands by the introduction of a 13C-labeled carbonyl at residue 117. Nonexponential kinetics is observed, with a complex dependence on concentration. The results are consistent with a mechanism in which the β-sheet realigns by both the repeated detachment and annealing of strands in solution and reptation of polypeptide strands within an aggregate.
Keywords: IR spectroscopy, peptide aggregation, isotope-edited, prion peptide, amyloid fiber
The misfolding of proteins into a β-sheet configuration and the subsequent aggregation of these β-sheets is associated with many neurological disorders, including Alzheimer's, Huntington's, and Creutzfeldt–Jakob disease (1). These diseases are associated with the presence of large amyloid plaques, which contain fibrous aggregates of protein. Several detailed models for the mechanism of amyloid growth have been proposed, but all involve a conformational change in the protein that leads to the formation of soluble oligomers, which eventually nucleate the growth of larger fibers. With several diseases, including Alzheimer's and Parkinson's, the oligomeric intermediates may be the primary cytotoxic species (2–4).
The soluble oligomeric intermediates are difficult to isolate and, because of their large size and dynamic nature, difficult to characterize with traditional biophysical techniques. For these reasons, many studies aimed at studying the aggregation process use small peptides, derived from full-length proteins of interest, which also show amyloidogenic behavior. Among the peptides studied extensively include the NFGAIL sequence from the islet amyloid polypeptide (5–7), fragments of the prion protein that include the AGAAAAGA amyloidogenic region (8–12), and many different fragments of the Alzheimer's Aβ peptide (13–18). In simulations of these peptides, ensembles of β-sheet oligomers are initially formed, including species that have a non-native hydrogen-bonding registry or mix parallel and antiparallel organization of the strands. In simulations of the Aβ16–22 fragment using an activation-relaxation technique and the optimized potential for efficient peptide–structure prediction, Derreumaux, Mousseau, and coworkers (17, 18) have observed that these non-native oligomers rearrange to the native conformation by reptation of polypeptide chains. These types of rearrangements from rapidly formed disordered β-sheets to well ordered oligomers are likely an essential step for forming a template capable of nucleating growth into larger fibrils.
Despite the observation of these disordered oligomers in simulations, there has been no spectroscopic observation of these species. IR spectroscopy is well suited for probing these systems. β-Sheet aggregates give distinctive amide I bands in the IR spectrum, and the inclusion of specific isotope labels in the peptide (isotope-edited IR spectroscopy) gives residue-level structural details on the peptide conformation (19–25), including the detailed registry of strands within the β-sheet (11, 12, 20, 22, 25). When 13C-labeled residues of different polypeptides are aligned and connected by hydrogen bonds within β-sheets, strong coupling between the 13C amide I′ modes results in a decrease in 13C amide I band intensity and shift in 13C amide I band frequency. These effects, observed experimentally and in simulations, make the isotope-edited IR spectra of β-sheet aggregates a sensitive probe for strand order and register; a regular strand register of ≈ nine strands or more gives rise to unique spectral properties in specifically labeled peptides (20, 22, 25).
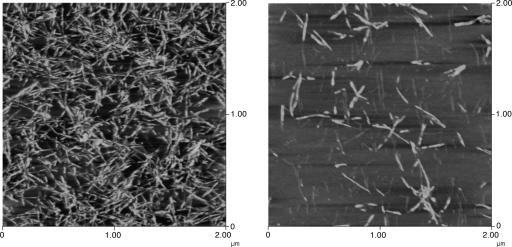
In previous studies, we have used isotope-edited IR to probe the structure of a series of peptides based on residues 109–122 of the Syrian hamster prion protein (H1). This sequence is thought to contain the most amyloidogenic region of the prion protein (8, 10). After prolonged incubation at room temperature, or heating to 75°C, the β-strands align such that the hydrophilic residues (residues 109–111) form an overhang for effective interaction with the solvent, whereas the hydrophobic core of the peptide strands (residues 112–122) packs closely together, facilitating the formation of interstrand hydrogen bonds that are characteristic of β-sheets (12). In this equilibrium alignment, residue 117 is in register across all strands (Fig. 1). If the backbone carbonyl of residue 117 is labeled with 13C this alignment causes strong transition dipole coupling of the backbone 13C-labeled carbonyls, resulting in a large (≈10 cm-1) shift in the frequency of the 13C amide I′ band (already notably downshifted from the 12C amide I′ band and thus well resolved). These aggregates have also been imaged with atomic force microscopy (Fig. 2). Peptides that do not adopt the 117 registry form smooth fibrils in solution. However, once this registry is adopted, the H1 peptide is capable of forming large, twisted fibers (where two fibrils wrap around each other), which are resistant to heating and dilution, whereas peptide derivatives that do not adopt this registry do not (11).
Fig. 1.
Schematic depiction of the rearrangement of β-strands within aggregates of H1. The gray circles represent the 13C-labeled carbonyl of residue 117. Initially the strands are misaligned; over time the alignment process causes the strands to align with residue 117 in register.
Fig. 2.
Atomic force microscopy images of H1 peptides, immediately after dissolution in 1:1 Hepes buffer/acetonitrile. (Left) A sample at high peptide concentration (integrated amide I band area ≈77). (Right) A sample at low concentration (integrated amide I area ≈7). (Magnification: 2.85 × 10⁴.)
Here, we present a series of kinetic experiments that have been carried out at varying concentrations and temperatures to elucidate the mechanism by which H1 aligns. The temperature dependence observed is relatively predictable and simple, whereby the rate of alignment of the β-strands increases as temperature increases. The concentration dependence on the alignment rate is more complex, revealing that the mechanism itself varies with concentrations.
Methods
Peptide Synthesis and Purification. Peptides with sequence Ac-MKHMAGAAAAGAVV-NH2 were synthesized and purified as described (11). Two variants were prepared: H1* with residue 117 of the sequence labeled with a 13C carbonyl to allow the alignment to be followed and H1 with no 13C labels. To prepare samples for IR spectra, the peptides were then exchanged in 0.05 M DCl for 5 h to remove the trifluoroacetic acid used to cleave the peptide from the solid-phase support and to replace amide protons with deuterons, before being lyophilized overnight.
IR Measurements. Samples of H1* were dissolved in a 1:1 mixture of acetonitrile and D2O buffer (20 mM Hepes/100 mM NaCl, pH 7.4) and vortexed until dissolution was complete. The concentration of the H1* peptide solution was systematically varied to cover a range from <6 mg·ml-1 to ≈50 mg·ml-1. The exact concentrations of the IR samples are not accurately known, and so the area of the amide I′ band, which is proportional to the concentration of the sample, is obtained by integration and used to determine relative concentrations. The SD of the area of the amide I′ band for each concentration was <2%. IR measurements were taken with a Vector 22 Fourier transform IR (FTIR) spectrometer (Bruker, Billerica, MA) operating at a resolution of 4 cm-1; the spectra were averaged over 512 scans. The IR cell was fitted with two CaF2 windows separated by a 100-μm Teflon spacer. FTIR measurements were taken at 35°C every 30–60 min until alignment was complete (as determined by the completion of growth of the aligned 13C band in the difference FTIR spectra). The temperature of the cell was controlled by a water jacket connected to an external water bath. Additional measurements were taken for samples of H1* of approximately equal concentrations monitoring the alignment of the β-strands at temperatures between 35°C and 55°C.
Isotope Dilution Studies. Solutions of H1 and H1* were prepared to approximately equal concentrations individually in the 1:1 acetonitrile/D2O buffer. The samples of equivalent concentration were immediately combined, and FTIR spectra were taken at regular intervals over 24 h. Additionally, a sample of H1* was preheated to force the alignment of the β-strands at residue 117; this sample was then added to a freshly prepared (and therefore as yet misaligned) sample of H1, and FTIR was again measured over a 24-h period.
Data Analysis. Spectra were first scaled to the area of the first measurement to correct for any cell expansion or evaporation of solvent that may occur over time. Difference FTIR spectra were then calculated by subtracting the first measurement from all subsequent spectra. Where alignment occurs at residue 117, the difference spectra show a decrease in the intensity of the band at ≈1,601 cm-1 (caused by misaligned β-strands) and a concurrent increase in the intensity of the band at ≈1,591 cm-1 (caused by β-strands aligned with residue 117 in register). The change in absorbance at 1,591 cm-1 was plotted against time and fit to a stretched exponential fit function where the time constant and the deviations from monoexponentiality were allowed to vary freely.
Atomic Force Microscopy. Atomic force microscopy images were collected as described (11). Samples were prepared in a 1:1 mixture of acetonitrile and D2O buffer (20 mM Hepes/100 mM NaCl, pH 7.4) as described above. Small aliquots of peptide solutions were reserved from the IR samples. Once the IR spectra were initiated, the reserved aliquot was immediately diluted 50-fold (to disperse the aggregates) then deposited onto a small piece of freshly cleaved mica. The substrate was then rinsed with distilled water to remove any salts and any loosely bound peptide, air-dried, and affixed to a glass slide. The samples were imaged with a Digital Instruments (Santa Barbara, CA) Dimensions 3100 atomic force microscope, with an etched silicon probe, operating in the tapping mode by using a scan rate of 1 Hz over a 2- × 2-μm area and 2 Hz over a 500- × 500-nm area.
Results
The Alignment of H1. 13C isotope labeling of a single residue of the H1 peptide results in a low-frequency shoulder to the main 12C β-sheet band. The frequency of the 13C β-sheet band depends on which residue of the peptide chain carries the isotope label (12). When residue 117 is labeled, the frequency of the 13C band is initially ≈1,601 cm-1; as has been reported, heating or prolonged incubation of a sample of H1* causes the band to downshift to ≈1,591 cm-1 (Fig. 3) as the labeled carbonyls become aligned and are therefore able to couple (11, 12). The kinetics of H1 alignment was monitored by plotting the change in intensity of the absorbance at 1,591 cm-1 (as determined from the difference spectra, Fig. 3B) against time (Fig. 3C).
Fig. 3.
Changes in FTIR spectra of H1* during realignment. (A and B) The initial and final FTIR spectra of H1* (A) are shown together with the difference spectra (B), which were constructed by subtraction of the first spectrum from all subsequent measurements. In its misaligned (initial) form, the 13C β-sheet band is found at 1,601 cm-1; as the peptide aligns, this band decreases and a band at 1,591 cm-1, caused by the coupling 13C carbonyls, emerges as seen in B. (C) The kinetic trace for the alignment process as a plot of the increase in intensity at 1,591 cm-1 with time.
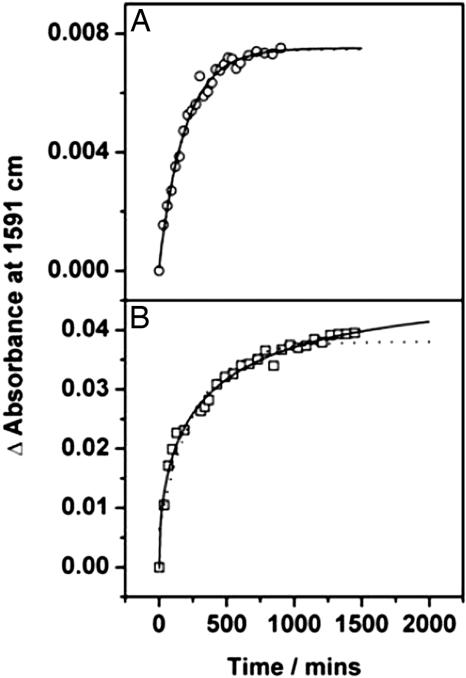
The plots of the intensity of the 1,591-cm-1 band in the difference spectra for two representative concentrations are shown in Fig. 4. At low and high concentrations, the traces can be fit by a single exponential; at intermediate concentrations, the traces deviate significantly from monoexponential behavior (Fig. 4). In each case (and for those concentrations not explicitly shown here) the data were fit to a stretched exponential function: y = y0 + A·exp(-xk)α, where k is the rate constant and α represents the deviations from monoexponentiality (i.e., α = 1 would indicate monoexponential kinetics). This function is particularly well suited for phenomenon where there is a distribution of rate constants (26); the parameter α reflects the degree of heterogeneity.
Fig. 4.
The kinetics of the alignment process at 35°C are shown at low (A) and intermediate (B) concentrations. Dotted lines through the data points show the monoexponential fits to the data; solid lines are the results of stretched exponential fits. At low concentration the data are well fit to a monoexponential curve; however, at higher concentration notable deviations from monoexponentiality are observed and the stretched exponential represents a much better fit to the data.
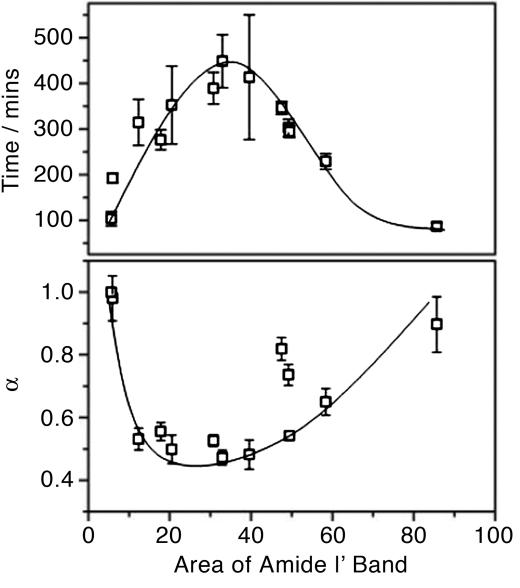
Concentration Dependence of the Alignment Kinetics. The kinetics of strand alignment was measured at 12 different concentrations; the concentration dependence of the fit parameters is illustrated in Fig. 5. The time constant for the alignment of β-strands in H1 goes through a maximum at intermediate concentrations. At the lowest and highest concentrations investigated the time constants for the alignment process are 103 and 86.9 min, respectively; however, at intermediate concentrations alignment of the strands at residue 117 takes as long as 448 min. The data cannot be well described by a linear relationship between concentration and alignment rate (either decreasing or increasing with increasing concentration) caused by the presence of multiple points, indicating rates faster than 250 min at both extremes of concentration. A similar turnover is observed for deviations from monoexponentiality; at the lowest concentrations investigated here, the data are well fit to a single exponential (α = 1); at intermediate concentrations the fit becomes highly stretched with values being returned for α of <0.5; at high concentrations, the deviations from monoexponentiality are reduced (α → 1), although the function never becomes completely monoexponential at the concentrations investigated here.
Fig. 5.
The effect of peptide concentration on the time constant for the alignment of the β-strands of H1 and the deviations from monoexponentiality. The turnover observed for both time (Upper) and α (Lower) as concentration increases is indicative of two mechanisms being responsible for the alignment of H1*. Lines are added to guide the eye.
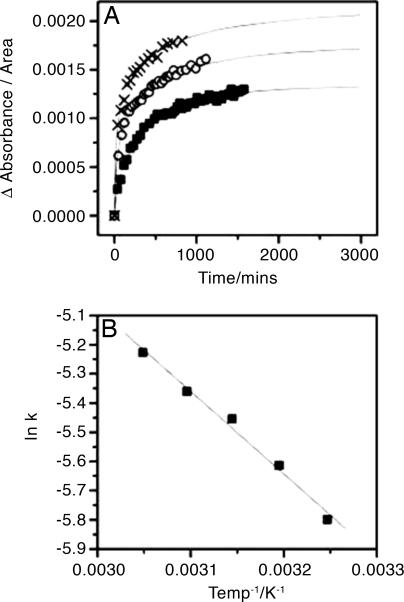
Temperature Dependence of the Alignment Kinetics. Fig. 6A shows the kinetic traces for the alignment of H1 at an intermediate concentration (amide I′ area of ≈24.3) at variable temperature. It can be seen that the alignment rate at 35°C, 45°C, and 55°C is rapid initially and then slows; however, monoexponential kinetics are not observed. At all concentrations investigated, the rate of alignment of H1 increases with increasing temperature. Data from an intermediate concentration (amide I′ area ≈24.3) is plotted in Fig. 6B; a linear Arrhenius plot is observed, giving an Arrhenius activation energy of 23.5 kJ·mol-1.
Fig. 6.
Alignment kinetics as a function of temperature. (A) The kinetics of the alignment process as a function of time. Data were collected for one peptide sample at 35°C (▪), 45°C (○), and 55°C (crosses) and have been normalized for the slight variation in area of amide I′ band. Lines through the data points represent the stretched exponential fits to the data. Kinetic measurements were also taken at 40°C and 50°C (data not shown). All five data sets confirm the hypothesis that the alignment process increases in rate as temperature increases. (B) An Arrhenius plot was constructed for each set of temperature-dependent kinetic results. The linear fit confirms the Arrhenius-type behavior of the kinetics. Activation energy was calculated from the gradient of the line.
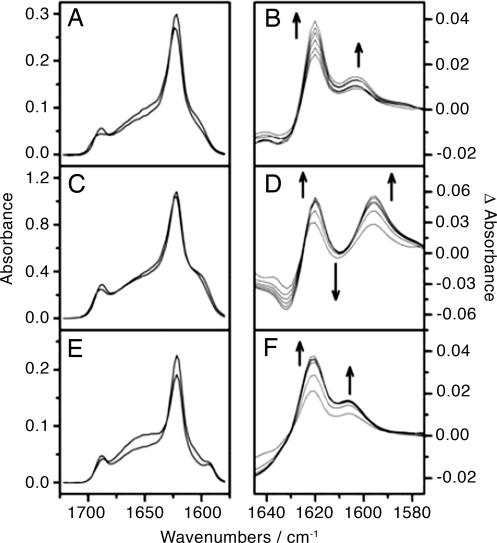
Isotope Dilution Experiments. To investigate whether the alignment process involved exchange of peptides between β-sheets or rearrangements within β-sheets, IR spectra were measured after mixing samples of labeled and unlabeled β-sheets. Samples of H1 and H1* at low concentrations (amide I′ area of ≈10.4) were combined immediately after sample preparation. The initial and final spectra (Fig. 7A) are very similar with regard to the positions of the bands, and the difference spectra (Fig. 7B) show neither an increasing band at 1,591 cm-1 nor a decreasing band ≈1,601 cm-1. Both the 12C (1,620 cm-1) and the 13C (1,603 cm-1) β-sheet bands increase in intensity over time, which simply indicates an increasing amount of total β-sheet. When H1 and H1* samples are combined at high concentrations (amide I′ area of ≈ 45.8), the initial and final FTIR spectra (Fig. 7C) do not show the same frequency for the 13C-labeled β-sheet band, and the difference spectra (Fig. 7D) do demonstrate a downshift of the 13C band as time passes. No increase in intensity at 1,603 cm-1 is observed to correlate with the increased amount of β-sheet indicated by the increase in the 12C β-sheet band. Furthermore, there is an increase in intensity of a 13C β-sheet band at 1,594 cm-1. This increase is evidence for the 13C-labeled carbonyls moving close enough to one another for transition dipole coupling to occur.
Fig. 7.
FTIR spectra from isotope dilution experiments. (A, C, and E) The initial and final FTIR spectra for the isotope dilution experiments conducted at 35°C. (B, D, and F) The difference spectra, calculated by subtracting the first spectrum from all subsequent spectra taken as time progressed. (A) Low concentration solutions of H1 and H1* were mixed together; the 13C band is not seen to shift with time. (B) The difference spectra confirm that although both the 12C and the 13C β-sheet bands are increasing in intensity because of the presence of more β-sheet, there is no shift of the 13C band to indicate the coupling of the 13C-labeled carbonyls. (C) High-concentration solutions of H1 and H1* were mixed together; the 13C band is seen to shift to lower frequency with time. (D) The difference spectra confirm that, in addition to the increase in intensity of the β-sheet bands, the 13C band at 1,591 cm-1 increases with time; the decrease in intensity at 1,601 cm-1 is masked by the increase in the intensity of the 12C β-sheet band. (E) Low-concentration solutions of freshly prepared H1 and prealigned H1* were mixed together; the 13C band remains at 1,591 cm-1 throughout the experiment. (F) The difference spectra show no decrease in the band at 1,592 cm-1 to match the increasing band at ≈1,606 cm-1.
Mixing experiments were also performed with a sample of H1* at low concentration (amide I′ area of ≈7.9) that had been prealigned, in other words, heated and recooled to bring the strands into the stable registry (aligned at 117, with 13C amide I′ at 1,591 cm-1). When this sample is mixed with a freshly prepared H1 sample, the 13C amide I′ band appears initially at 1,592 cm-1 and does not shift, although the total amount of β-sheet is again seen to increase (Fig. 7 E and F).
Discussion
H1 Quickly Forms Disordered, Heterogeneous Oligomers in Solution. Upon dissolution into the water/acetonitrile buffer, a portion of the H1 peptides very rapidly forms soluble β-sheet oligomers; the signature β-sheet spectrum is observed in the first spectrum measured after mixing. Deconvolution of the IR spectrum of H1 reveals that, even after strand rearrangement, only ≈50% of the peptides are involved in β-sheets, with the remainder remaining as monomeric species (11). The fast formation of intermolecular β-sheets may occur as a consequence of the hydrophobic character of the peptide; the hydrophobic core of the peptide strands collapse together into a conformation that maximizes both hydrophobic interactions and intersheet hydrogen bonding. There is likely to be a distribution in the size of the aggregates, with the mean aggregate size increasing with increasing concentration (20, 22). The disorder in the aggregate organization is indicated by the band intensity and frequency of the 13C amide I′ band in the spectrum of the peptide specifically labeled at residue 117. A regular register, in which residue 117 is aligned at all positions, would result in a stronger coupling between the 13C amide I′ modes and a lower band frequency and slightly diminished band intensity in the spectrum (11, 12, 22, 26). Over time, the aggregates adopt the ordered, equilibrium register, and the 13C amide I′ band shifts from 1,601 to 1,591 cm-1.
The Mechanism of Strand Alignment Depends on Concentration of Solution/Size of Oligomer. Once the strands have collapsed into disordered oligomeric aggregates, rearrangement into the native hydrogen-bond registry can occur by two different competing mechanisms, both of which have been observed in simulations of β-sheet aggregation (9, 17, 18). One possibility is the detachment of one or more strands, followed by reattachment, or annealing, of new β-strands taken from the available pool of monomers. Out-of-register strands would detach faster than strands in the energetically favorable, aligned conformation, and after repeated cycles of this process, the β-sheets would be arranged in the stable registry. Alternatively, changes in the strand registry could occur within a β-sheet without detachment of a strand by the sliding or reptation of individual peptide strands relative to one another. In this mechanism, peptides would slowly diffuse within the β-sheets, breaking and reforming intrasheet hydrogen bonds, until the most energetically favorable alignment and packing of strands are achieved.
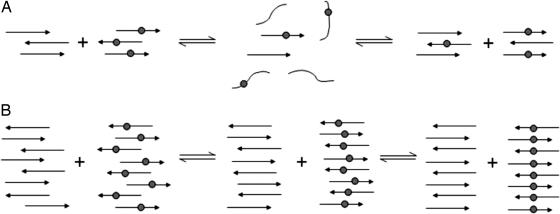
These two mechanisms of intrasheet and intersheet strand realignments can be distinguished by the isotope-dilution experiments. If the realignment process occurs by the intersheet detachment/annealing mechanism, the final β-sheet oligomers formed by mixing samples of labeled and unlabeled peptides would contain randomly intermixed labeled and unlabeled strands (Fig. 8A). Because the labeled strands within these β-sheets would be interspersed with unlabeled strands, the coupling between 13C carbonyls would be disrupted, and the 13C amide I′ band should remain at 1,601 cm-1 throughout the alignment process. This is what is observed with H1 at low concentrations (Fig. 7 A and B), suggesting that the detachment/annealing mechanism dominates at low concentration (small aggregate size).
Fig. 8.
Schematic representations of the mixing of solutions of H1 and H1* at low (A) and high (B) concentrations. The labeled β-strands have a gray circle to represent the 13C-labeled residue 117. (A) Shown is the detachment of the β-strands from the domains of labeled and unlabeled peptide beginning a mixing of the strands. As the strands reattach in the aligned form, complete mixing occurs and the 13C labels are separated by an unlabeled residue 117, such that no coupling can occur despite the peptide being aligned with residue 117 in register across all strands. (B) Shown are the strands remaining within the domains of labeled and unlabeled peptide and beginning to slide over one another in a reptation mechanism until the entire peptide is aligned with residue 117 in register. The 13C-labeled carbonyls in the labeled domain of the peptide will then couple, resulting in a downshift of the 13C β-sheet band.
If the realignment process occurs via an intrasheet reptation mechanism, there should be little intersheet mixing of labeled and unlabeled strands, because the rearrangements are all intrasheet (Fig. 7B). As a result, there is minimal interspersion of labeled and unlabeled strands, enabling the 13C carbonyls to couple once alignment begins, which results in a shift in the 13C amide I′ band. This shift is observed when H1 is mixed at high concentration, where the number of strands per aggregate is high (Fig. 7 C and D); over time, the absorbance at 1,591 cm-1 grows. The differences in the isotope dilution experiments at high and low concentrations confirm that the mechanism of alignment depends on the concentration of solution and the size of the aggregates.
These mechanisms also provide an explanation for the unusual concentration dependence of the alignment process. At low concentrations, the intrasheet (detachment/anneal) mechanism is favored, perhaps because the size or complexity of the aggregates is small, and realignment occurs primarily through the detachment/anneal mechanism. As the concentration increases, it is reasonable to assume that the size of the aggregates increases, making strand detachment from the center of the aggregates more difficult, resulting in a slowing of intrasheet kinetics. At intermediate concentrations, both alignment mechanisms occur; the outer strands can undergo detachment/annealing, whereas the inner strands undergo reptation. These two processes result in the highly nonexponential kinetics observed in this range. At higher concentrations, these end effects diminish, and the bulk of alignment occurs by the intersheet reptation mechanism.
Conclusions
To nucleate the growth of large, fibrous aggregates, the initial β-sheets formed by the prion peptide H1 must adopt a stable registry that can serve as an effective template for incoming strands. Initial β-sheets formed in solution are highly disordered, containing a mixed registry. A slow (t ≈ 8 h at 35°C) rearrangement of these sheets occurs; at low concentrations, out-of-register β-strands detach from the small aggregates relatively easily and can reattach with residue 117 aligned. On the other hand, at high peptide concentrations (where higherorder aggregates may form or the sheets may be larger), the strands rearrange via an intersheet, reptation-like mechanism. This experiment confirms the behavior predicted in simulations of peptide aggregation, in which peptides initially form mixed-registry sheets that must rearrange to form a nucleating core.
Both mechanisms (the detachment/reanneal and the reptation mechansim) demonstrate that amyloid fibrils are dynamic species, in which both a dynamic equilibrium between monomers and fibrils and strand rearrangements within a fibril occur. A similar observation has recently been reported by Carulla et al. (27), who proposed a mechanism of “strand recycling” within amyloid fibrils formed from a Src homology 3 domain. Characterization of the dynamic properties of polypeptides involved in fibrous aggregates may give insights into the mechanism of amyloid formation and lead to strategies for the design of amyloid inhibitors or disrupters.
Author contributions: S.M.D. designed research; S.A.P. performed research; and S.A.P. and S.M.D. wrote the paper.
This paper was submitted directly (Track II) to the PNAS office.
Abbreviation: FTIR, Fourier transform IR.
References
- 1.Dobson, C. M. (2003) Nature 246, 884-890. [DOI] [PubMed] [Google Scholar]
- 2.Caughey, B. & Lansbury, P. T., Jr. (2003) Annu. Rev. Neurosci. 26, 267-298. [DOI] [PubMed] [Google Scholar]
- 3.Hardy, J. & Selkoe, D. J. (2002) Science 297, 353-356. [DOI] [PubMed] [Google Scholar]
- 4.Kayed, R., Head, E., Thompson, J. L., McIntire, T. M., Milton, S. C., Cotman, C. W. & Glabe, C. G. (2003) Science 300, 486-489. [DOI] [PubMed] [Google Scholar]
- 5.Tenidis, K., Waldner, M., Bernhagen, J., Fischle, W., Bergmann, M., Weber, M., Merkle, M.-L., Voelter, W., Brunner, H. & Kapurniotu, A. (2000) J. Mol. Biol. 295, 1055-1071. [DOI] [PubMed] [Google Scholar]
- 6.Zanuy, D., Ma, B. & Nussinov, R. (2003) Biophys. J. 84, 1884-1894. [DOI] [PMC free article] [PubMed] [Google Scholar]
- 7.Zanuy, D. & Nussinov, R. (2003) J. Mol. Biol. 329, 565-584. [DOI] [PubMed] [Google Scholar]
- 8.Gasset, M., Baldwin, M. A., Lloyd, D. H., Gabriel, J.-M., Holtzman, D. M., Cohen, F. E., Fletterock, R. & Prusiner, S. B. (1992) Proc. Natl. Acad. Sci. USA 89, 10940-10944. [DOI] [PMC free article] [PubMed] [Google Scholar]
- 9.Ma, B. & Nussinov, R. (2002) Protein Sci. 11, 2335-2350. [DOI] [PMC free article] [PubMed] [Google Scholar]
- 10.Nguyen, J., Baldwin, M. A., Cohen, F. E. & Prusiner, S. B. (1995) Biochemistry 34, 4186-4192. [DOI] [PubMed] [Google Scholar]
- 11.Petty, S. A., Adalsteinsson, T. & Decatur, S. M. (2005) Biochemistry 44, 4720-4726. [DOI] [PubMed] [Google Scholar]
- 12.Silva, R. A. G. D., Barber-Armstrong, W. & Decatur, S. M. (2003) J. Am. Chem. Soc. 125, 13674-13675. [DOI] [PubMed] [Google Scholar]
- 13.Balbach, J. J., Ishii, Y., Antzutkin, O. N., Leapman, R. D., Rizzo, N. W., Dyda, F., Reed, J. & Tycko, R. (2000) Biochemistry 39, 13748-13759. [DOI] [PubMed] [Google Scholar]
- 14.Klimov, D. K. & Thirumalai, D. (2003) Structure (London) 11, 295-307. [DOI] [PubMed] [Google Scholar]
- 15.Lu, K., Jacob, J., Thiyagarajan, P., Conticello, V. P. & Lynn, D. G. (2003) J. Am. Chem. Soc. 125, 6391-6393. [DOI] [PubMed] [Google Scholar]
- 16.Petkova, A. T., Buntkowsky, G., Dyda, F., Leapman, R. D., Yau, W.-M. & Tycko, R. (2004) J. Mol. Biol. 335, 247-260. [DOI] [PubMed] [Google Scholar]
- 17.Santini, S., Mousseau, N. & Derreumaux, P. (2004) J. Am. Chem. Soc. 126, 11509-11516. [DOI] [PubMed] [Google Scholar]
- 18.Santini, S., Wei, G., Mousseau, N. & Derreumaux, P. (2004) Structure (London) 12, 1245-1255. [DOI] [PubMed] [Google Scholar]
- 19.Barber-Armstrong, W., Donaldson, T., Wijesooriya, H., Silva, R. A. G. D. & Decatur, S. M. (2004) J. Am. Chem. Soc. 126, 2339-2345. [DOI] [PubMed] [Google Scholar]
- 20.Brauner, J. W., Dugan, C. & Mendelsohn, R. (2000) J. Am. Chem. Soc. 122, 677-683. [Google Scholar]
- 21.Decatur, S. M. & Antonic, J. (1999) J. Am. Chem. Soc. 121, 11914-11915. [Google Scholar]
- 22.Kubelka, J. & Keiderling, T. A. (2001) J. Am. Chem. Soc. 123, 6142-6150. [DOI] [PubMed] [Google Scholar]
- 23.Setnicka, V., Huang, R., Thomas, C. L., Etienne, M. A., Kubelka, J., Hammer, R. P. & Keiderling, T. A. (2005) J. Am. Chem. Soc. 127, 4992-4993. [DOI] [PubMed] [Google Scholar]
- 24.Silva, R. A. G. D., Kubelka, J., Bour, P., Decatur, S. M. & Keiderling, T. A. (2000) Proc. Natl. Acad. Sci. USA 97, 8318-8323. [DOI] [PMC free article] [PubMed] [Google Scholar]
- 25.Paul, C., Wang, J. Wimley, W. D., Hochstrasser, R. M. & Axelsen, P. H. (2004) J. Am. Chem. Soc. 126, 5843-5850. [DOI] [PMC free article] [PubMed] [Google Scholar]
- 26.Simdyankin, S. I. & Mousseau, N. (2003) Phys. Rev. E 68, 041110-1-041110-7. [DOI] [PubMed] [Google Scholar]
- 27.Carulla, N., Caddy, G. L., Hall, D. R., Zurdo, J., Gairi, M., Feliz, M., Giralt, E., Robinson, C. V. & Dobson, C. M. (2005) Nature 436, 554-558. [DOI] [PubMed] [Google Scholar]


