

Abstract
Tumour necrosis is associated with poor prognosis in cancer1,2 and is thought to occur passively when tumour growth outpaces nutrient supply. Here we report, however, that neutrophils actively induce tumour necrosis. In multiple cancer mouse models, we found a tumour-elicited Ly6GHighLy6CLow neutrophil population that was unable to extravasate in response to inflammatory challenges but formed neutrophil extracellular traps (NETs) more efficiently than classical Ly6GHighLy6CHigh neutrophils. The presence of these ‘vascular-restricted’ neutrophils correlated with the appearance of a ‘pleomorphic’ necrotic architecture in mice. In tumours with pleomorphic necrosis, we found intravascular aggregates of neutrophils and NETs that caused occlusion of the tumour vasculature, driving hypoxia and necrosis of downstream vascular beds. Furthermore, we found that cancer cells adjacent to these necrotic regions (that is, in ‘perinecrotic’ areas) underwent epithelial-to-mesenchymal transition, explaining the paradoxical metastasis-enhancing effect of tumour necrosis. Blocking NET formation genetically or pharmacologically reduced the extent of tumour necrosis and lung metastasis. Thus, by showing that NETs drive vascular occlusion, pleomorphic necrosis and metastasis, we demonstrate that tumour necrosis is not necessarily a passive byproduct of tumour growth and that it can be blocked to reduce metastatic spread.
Subject terms: Cancer microenvironment, Metastasis, Tumour immunology
Neutrophils actively induce tumour necrosis, driving vascular occlusion, pleomorphic necrosis and metastasis.
Main
Tumour necrosis is a prognostic factor, yet its causal mechanisms and effects on cancer cells are poorly understood. The prevailing, intuitive idea is that a necrotic tumour ‘core’ forms when cancer cell proliferation outpaces the available nutrient supply. This largely passive process has traditionally been considered non-targetable.
The host environment influences cancer progression and tumours alter the physiology of the host3. In particular, haematopoiesis is altered as tumours progress4; both increased haematopoietic output and a myeloid skew (production of myeloid cells over other lineages) are common in patients with cancer5,6. Among altered myeloid cells, neutrophils (or polymorphonuclear leukocytes (PMNs)) have gained attention, as they can promote metastasis, including by releasing NETs. NETs are extracellular web-like DNA structures associated with granule-derived proteins that neutrophils expel in response to pathogens7. NETs can promote most steps of metastasis8, and when formed intravascularly, are cytotoxic to the vasculature9, acting as mediators of thrombosis10. Although NETs are known to drive thrombosis in cancer11, and thrombosis can cause local tissue necrosis, it is unclear whether NET-mediated vascular occlusion actively drives necrosis and how this in turn would affect metastasis. Here we examined how tumours become necrotic, not by passively outgrowing the nutrient supply but by actively altering haematopoiesis to favour intravascular NET formation.
Neutrophils block perfusion, correlating with necrosis
Primary tumour necrosis has been correlated with worse prognosis across cancer types1,2. We evaluated magnetic resonance imaging (MRI) images12 of 200 patients with breast cancer for necrosis. Patients with necrotic tumours had shorter recurrence-free and overall survival and increased axillary adenopathy frequency (suggesting regional lymph node metastasis; Extended Data Fig. 1a).
Extended Data Fig. 1. Tumor necrosis in human breast cancer and different cancer models.

a, Representative images (aI) of breast cancer patient MRI images with (top) or without (bottom) necrosis in the primary tumor, as determined based on the vascular contrast signal. The percentage of recurrence-free survival (aII, p = 0.012) and overall survival (aIII, p = 0.015) were higher in patients without necrosis, as was the incidence of axillary adenopathy (consistent with metastatic spread to local lymph nodes, aIV, p < 0.0001). The percentage of each molecular subtype for both categories is also shown (aV). b, Representative image of the accumulation of neutrophils (MPO, cyan) and the absence of vasculature (CD31, green) in necrotic regions (DAPI, nuclear morphology in blue, top right, non-necrotic; bottom right, necrotic) in cleared 4T1 tumors. Representative of N = 6 cleared tumors. c, Representative immunostaining (left) and quantification (right) showing neutrophils (MPO, cyan; non-necrotic vs peri-necrotic p = 0.0002, non-necrotic vs necrotic p < 0.0001, peri-necrotic vs necrotic p < 0.0001) and NETs (DAPI+, MPO+ blue, citH3+ red; non-necrotic vs peri-necrotic p = 0.25, non-necrotic vs necrotic p < 0.0001, peri-necrotic vs necrotic p < 0.0001) accumulate in necrotic regions in 4T1 tumors. N = 6 tumors. d, Representative imaging mass cytometry images of 4T1 tumors showing that necrosis-infiltrating cells (inside yellow dashed line) are bona fide neutrophils by markers. Representative of n = 16 regions from eight 4T1 tumors. e, High magnification image of DNA and NETs in necrotic regions of 4T1 tumors (another example shown in Fig. 1b, right). Representative of n = 4 tumors. f, LLC tumors show similar pleomorphic necrosis, neutrophil infiltration, and perfused/non-perfused vessels as 4T1 tumors. Representative of n = 3 cleared tumors. g, Representative view of perfused vessels (red, i.v. lectin) in a primary LLC tumor showing intravascular neutrophil aggregates (arrowheads, MPO) upstream of non-perfused vessels (CD31). Representative of n = 3 cleared tumors. h, H&E staining of C3(1)-Tag tumors showing the presence of pleomorphic necrosis in the primary tumor of this model. Representative of n = 5 mice. i, Micrograph of cleared C3(1)-Tag tumors showing neutrophils (MPO) forming aggregates in the vasculature (CD31). Representative of n = 5 cleared tumors. j, Micrograph of cleared C3(1)-Tag tumors showing neutrophil accumulation (MPO) in necrotic regions (nuclear morphology, right) devoid of vasculature (CD31). Representative of n = 5 cleared tumors. k, Representative cleared MMTV-PyMT tumor stained for vessels (CD31), neutrophils (MPO), and nuclei (DAPI), showing the presence of smaller, non-pleomorphic central necrotic cores with fewer infiltrating neutrophils and NETs (MPO+, citH3+). Representative of n = 3 cleared tumors. l, Representative images and m, quantification of the number of neutrophils (p < 0.0001) and NETs (p = 0.0003) in necrotic areas (yellow dashed line) in MMTV-PyMT and 4T1 tumors. N = 3 mice per group. n, Representative view of perfused vessels (red, i.v. lectin) in a primary 4T1 tumor. Dashed lines outline a vessel (CD31, green) perfused until an intravascular neutrophil aggregate appears (yellow arrowhead). Downstream of the aggregate, perfusion is lost. Representative of n = 5 tumors. o, Micrograph showing a hypoxic region (hypoxyprobe, green) around a vessel (CD31) containing a neutrophil aggregate (yellow arrowhead, MPO). Representative of n = 4 tumors. Error bars show mean + s.e.m. ***P < 0.001, ns, not significant, as determined by one-way ANOVA with Tukey’s multiple comparison test in (c) or unpaired two-tailed Student’s t-test (m). Survival curves analyzed using log-rank (Mantel-Cox) test in (aII-III). Axillary adenopathy data in aIV analyzed using Two-sided Fisher’s exact test.
Having established a correlation between necrosis and outcome for patients with breast cancer, we next used whole-mount tissue clearing13 to analyse tumour necrosis in mice with orthotopically implanted triple-negative breast cancer (TNBC) 4T1 cells. Necrotic tumour regions were readily identified by disrupted nuclear morphology, lack of vasculature and heavy infiltration by neutrophils (Extended Data Fig. 1b,c). To validate that the cells in necrotic regions were bona fide neutrophils, we used imaging mass cytometry of 4T1 tumours (Extended Data Fig. 1d). NETs (myeloid peroxidase (MPO)+, citrullinated histone 3 (citH3)+ and DNA (DAPI)+) were abundant in and around the necrotic regions (Fig. 1a,b and Extended Data Fig. 1c,e). The overall spatial architecture of necrosis was intricate and inconsistent with a passive necrotic core forming away from the vasculature (Fig. 1b, Extended Data Fig. 1b,c and Supplementary Videos 1 and 2). We termed this distinct necrotic architecture ‘pleomorphic necrosis’ to differentiate it from the classical ‘central necrotic core’.
Fig. 1. Pleomorphic necrosis associates with intravascular neutrophil aggregates blocking blood flow.

a, Cleared 4T1 tumour showing the nuclear morphology of normal and necrotic regions: necrotic regions lack vasculature (CD31) and are enriched in neutrophils (MPO) and NETs (DAPI+, citH3+ and MPO+). Representative of n = 5 tumours. b, Tile scan of a 4T1 tumour showing the intricate pleomorphic architecture of neutrophil-rich and NET-rich (DAPI+, citH3+ and MPO+) necrotic tissue (left), and high magnification showing NETs (triple colocalization of DNA, MPO and citH3) in necrotic regions (right). Representative of n = 4 tumours. c, Quantification of intravascular NETs in necrotic or perinecrotic regions compared with non-necrotic regions in 4T1 tumours, normalized to the volume of vessels in each captured volume. n = 9 volumes from 5 tumours. P = 0.0022. d, Vessels adjacent to necrotic regions contain neutrophil aggregates (the dashed region magnified on the right) and NETs. Representative of n = 5 tumours. e, Representative view of perfused vessels (red, intravenous lectin) in regions adjacent to the necrotic tissue. The dashed region (zoomed in on the right) shows a vessel perfused until an intravascular neutrophil aggregate appears (arrowheads; arrows in the single channels below). Perfusion is lost downstream of the aggregate. Representative of n = 5 tumours. f, Extent of unperfused vasculature in the primary tumour correlates with the number of neutrophil aggregates in the vasculature. n = 12 volumes from 4 tumours. P < 0.0001. g, Micrograph showing intravascular accumulation of neutrophils (MPO) in the vasculature (CD31) of needle biopsies of primary tumours from patients with TNBC. Representative of n = 8 out of 20 total needle biopsies. h, Human TNBC pre-treatment needle biopsies show pleomorphic necrosis (by disrupted nuclear morphology; left) and extensive neutrophil infiltration (MPO) and NET formation (DAPI+, citH3+ and MPO+). Representative of n = 4 pleomorphic of 20 total needle biopsies. The bars show mean + s.e.m. **P < 0.01, as determined by unpaired, two-tailed Student’s t-test (c) or two-tailed Pearson correlation (f). The error bands show 95% confidence interval (f).
We next evaluated the pleomorphic, necrotic architecture and associated neutrophil or NET aggregates in additional tumour models. Lewis lung carcinoma (LLC) tumours in C57BL/6 mice and tumours from the genetically engineered C3(1)-Tag spontaneous breast cancer model (in the FVB/n background) showed pleomorphic necrosis, abundant neutrophil infiltration and intravascular neutrophil aggregates, whereas MMTV-PyMT tumours did not (Extended Data Fig. 1f–m and Supplementary Videos 5–9).
Of note, aggregated neutrophils and NETs were found inside the vasculature around the pleomorphic, necrotic regions of 4T1 tumours (Fig. 1c,d and Supplementary Video 3). We hypothesized that neutrophils blocking blood flow inside the tumour vasculature may cause downstream regions of the affected vascular branch to become necrotic. We thus visualized perfused vessels via intravenous (i.v.) injection of a rhodamine-conjugated lectin. In all analysed tumours, we found vessels perfused up to an intravascular neutrophil aggregate, downstream of which there was no perfusion (Fig. 1e, Extended Data Fig. 1n and Supplementary Video 4). Furthermore, the number of intravascular neutrophil aggregates correlated with the extent of non-perfused vessels (Fig. 1f) and with hypoxia in the surrounding region (Extended Data Fig. 1o). These data suggest that neutrophil aggregates can block blood flow inside the tumour vasculature, leading to regions with hypoxia and necrosis.
To extend our findings to human cancer, we analysed pre-treatment needle biopsy specimens (Extended Data Fig. 2a) from newly diagnosed patients with stage I–III TNBC. Although the biopsies were small, we found intravascular NETs (Fig. 1g) in 40% and pleomorphic necrosis in 20% of the samples (Extended Data Fig. 2b). The pleomorphic, necrotic regions were also highly infiltrated by neutrophils and NETs (Fig. 1h and Extended Data Fig. 2c), which was confirmed using an antibody14 (3D9) to NET-specific cleaved histone 3 (Extended Data Fig. 2d,e). Thus, pleomorphic, necrotic architectures were present in tumours from patients with TNBC and in orthotopic, subcutaneous and genetic mouse tumour models.
Extended Data Fig. 2. 4T1 tumors over time.
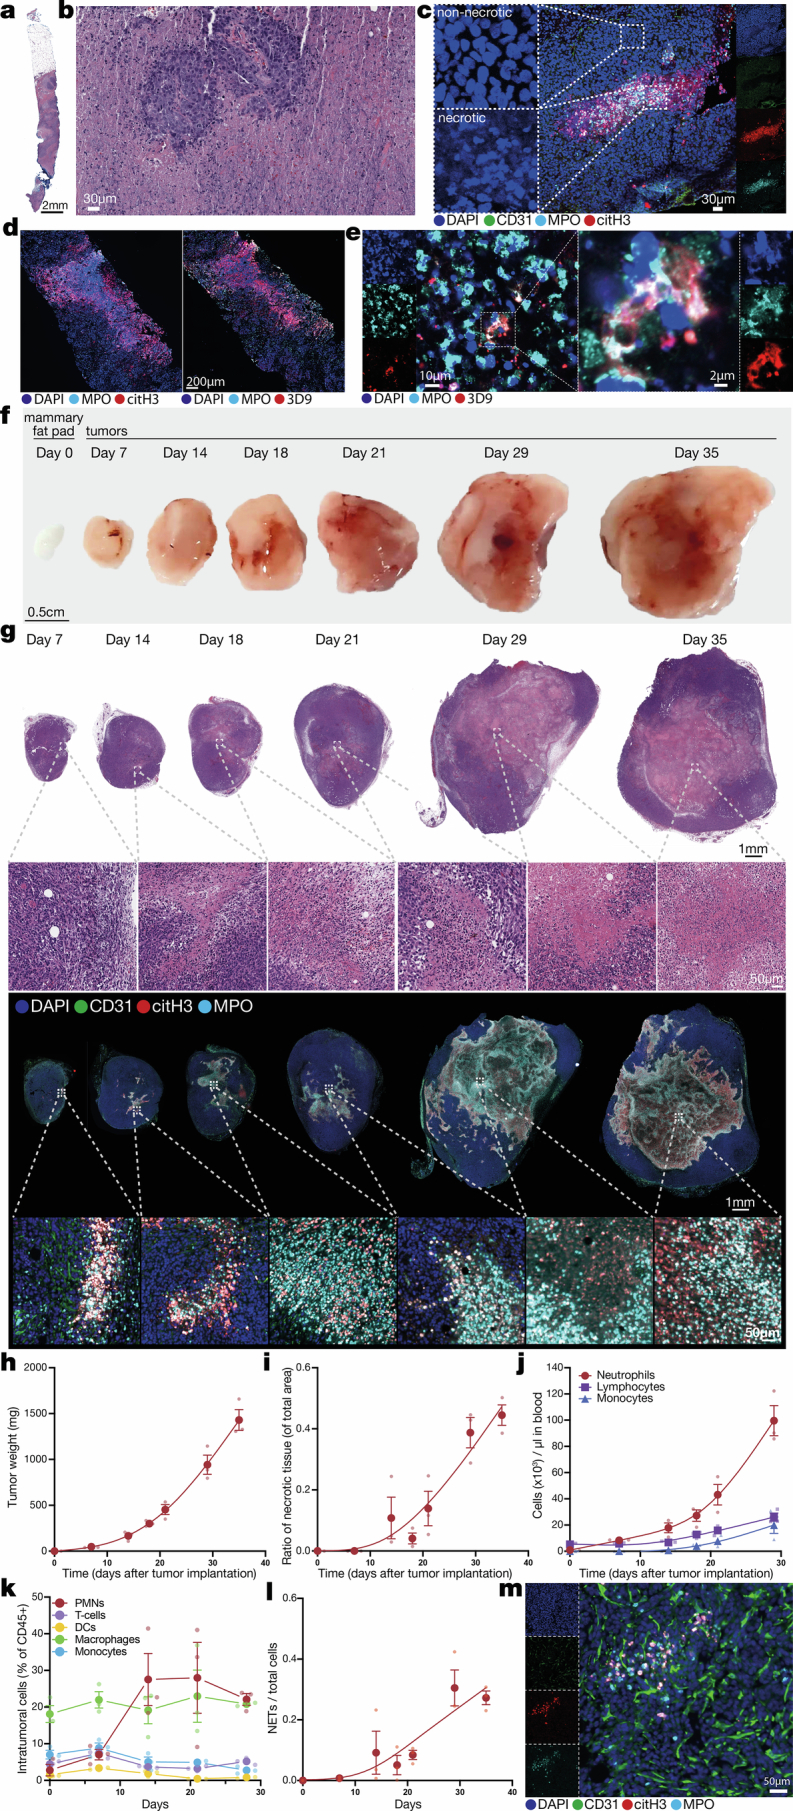
a, Representative overview of a biopsy from a TNBC patient; pre-treatment needle biopsies were stained for H&E and show pleomorphic, necrotic architecture. Representative of n = 4 evident pleomorphic, necrotic samples from 20 total needle biopsies. b, Higher magnification of necrotic regions from the tumor shown in (a). c, Representative image of a necrotic region from a needle biopsy of a TNBC tumor, showing neutrophils and NETs accumulating in the necrotic regions (nuclear morphology in the left panels). Representative of n = 4 pleomorphic, necrotic biopsies. d, Sections from the same necrotic TNBC tumors stained for NETs using either the citH3/MPO/DNA (left) or 3D9 (right) methods. Representative of n = 3 needle biopsies. e, High magnification images of NETs stained with 3D9 antibody from the TNBC shown in (d). f, Representative gross appearance and g, H&E-stained (top) or immunostained (bottom) midline sections of 4T1 tumors at indicated times after tumor implantation, showing that pleomorphic necrosis is already extensive at day 14 after tumor implantation (with necrosis emerging as early as day 7). Representative of 3 mice per timepoint. h, Quantification of 4T1 tumor weight over time. N = 3 mice per timepoint. i, Ratio of necrotic to total tissue area in the 4T1 primary tumors over time, as quantified from H&E stainings. N = 3 mice per timepoint. j, Counts of neutrophils, lymphocytes, and monocytes in circulation in 4T1 tumor-bearing mice over time. Note that neutrophils change first and the most strongly in response to the presence of the primary tumor (day 8 represents an 8-fold increase over day 0), while monocytes and lymphocytes start increasing at much later timepoints (day 18 onwards). N = 3 mice per timepoint. k, Percentage of immune cells in 4T1 primary tumors over time (time 0 represents the percentage in naïve mammary fat pads). N = 3 mice per timepoint. DC, dendritic cell. l, Quantification of NETs in 4T1 tumors over time from immunofluorescence-stained tissue sections (as shown in b). N = 3 mice per timepoint (except N = 1 for mammary fat pad at time 0, as baseline reference). m, Representative image of 4T1 tumors 7 days after tumor implantation, showing the presence of NETs in areas not yet necrotic or avascular. Representative of n = 3 mice. Error bars show mean ± s.e.m.
We used the 4T1 model to temporally dissect the emergence of tumour necrosis and NETs: both were detectable at day 7 and widespread at day 14 after cancer cell implantation (Extended Data Fig. 2f–i), suggesting that tumour necrosis is not a late-stage phenomenon. Pleomorphic necrosis architectures were found at all timepoints but seemed to coalesce over time. Of the major circulating immune cell populations, neutrophils changed the earliest and most dramatically in response to the presence of the tumour (Extended Data Fig. 2j). Neutrophil tumour infiltration was already increased at early timepoints (Extended Data Fig. 2k). As early as day 7, NETs were detectable in the tumour, including in tumour areas that did not yet appear avascular or necrotic (Extended Data Fig. 2l,m).
Next, we next analysed the vascular compartment in 4T1 tumours and found patches of intraluminally exposed laminin (an extracellular matrix protein) that were associated with neutrophils in vessels poorly covered with pericytes (Extended Data Fig. 3a,b and Supplementary Videos 10 and 11). In addition, around the necrotic regions, neutrophils in the vessels formed NETs and were associated with fibrin and platelets (Extended Data Fig. 3c–e and Supplementary Video 12). Intravascular fibrin deposition and platelet aggregation were absent in non-necrotic tumour regions (Extended Data Fig. 3f,g). We also observed platelets aggregating and interacting with neutrophils in the tumour vasculature (Extended Data Fig. 3h,i) in vivo using intravital imaging15 (Supplementary Videos 13–15). Using LLC tumours in genetically neutropenic mice16 (Lyz2Cre;Mcl1fl/fl; Extended Data Fig. 3j), we found that tumour necrosis was driven by neutrophils (Extended Data Fig. 3k). We next tested whether platelets regulated tumour necrosis by treating with dipyridamole (phosphodiesterase and adenosine deaminase inhibitor, which reduces erythrocyte-dependent platelet adhesion17) or tirofiban (which blocks glycoprotein IIb/IIIa receptors, inhibits fibrinogen binding and reduces platelet–neutrophil interactions18) in 4T1 tumours. Neither drug affected the number of circulating neutrophils or platelets (Extended Data Fig. 3l,m); tirofiban reduced tumour necrosis, whereas dipyridamole had no effect (Extended Data Fig. 3n). This suggests that platelet–neutrophil and platelet–fibrinogen interactions are important for tumour necrosis.
Extended Data Fig. 3. Intraluminal extracellular matrix components and fibrin and platelet deposition correlate with neutrophils and necrosis in the primary tumor.

a, Representative image of intravascular laminin (i.v. injected anti-laminin antibody) deposition in the microvasculature (CD31) of 4T1 tumors. Neutrophils (MPO) interact with the intravascular laminin patches. Representative of n = 3 mice. b, Representative image (left) and quantification (right) showing that perivascular cell-poor (defined as perivascular αSMA+ cells, green) vessels (CD31, red) contain more luminally exposed laminin (i.v. injected anti-laminin antibody, cyan) than pericyte-covered vessels (vessels with high pericyte coverage). N = 6 volumes from 3 mice. p = 0.0454. c, Tumor regions surrounding necrosis also contain intravascular (i.v. lectin, red) deposits of fibrin in close association with neutrophils (MPO). Right panel: quantification of the neutrophil-fibrin distance compared to the distance to random intravascular points, showing that intravascular neutrophils are in close proximity to the fibrin deposits. N = 3 mice. d, NETs (citH3+, MPO+) are found in and around fibrin deposits in the tumor vasculature. Representative of n = 3 mice. e, Intravascular fibrin deposits colocalize with platelet aggregates near necrotic regions, whereas f, neither fibrin nor platelet deposits are found in non-necrotic tumor regions. Representative of n = 3 mice. g, Tile scan of a 4T1 tumor showing that necrotic regions (dashed areas) and surrounding regions contain fibrin and platelet deposits. Representative of n = 3 mice. h-i, Still images from real-time intravital imaging of the tumor microvasculature (lectin, cyan), showing neutrophils (LysM-GFP, green) and platelets (anti-CD41, red) forming intravascular aggregates in vivo in two independent tumor regions. Representative of n = 3 mice. j, Representative flow cytometry plots (left) and quantification (right) of neutrophils in our neutropenic mice (and Cre– littermate controls). N = 4 controls and 3 neutropenic mice. P = 0.0011. k, Representative H&E stainings (left) and quantification (right) of the necrotic area in LLC tumors implanted into neutropenic mice or littermate controls. N = 4 control and 3 neutropenic mice. p = 0.0303. l, Number of circulating neutrophils and platelets in 4T1 tumor-bearing mice treated with dipyridamole or vehicle control. N = 3 mice per group. m, Number of circulating neutrophils and platelets in mice treated with tirofiban or vehicle control. N = 3 mice per group. n, Representative H&E stainings (left) and quantification (right) of the necrotic area in 4T1 tumors from mice treated with dipyridamole or tirofiban. N = 20 control-, 10 dipyridamole-, and 10 tirofiban-treated mice. Control vs Tirofiban p = 0.0358. Control vs Dipyridamole p = 0.6313. Bars show mean + s.e.m. *P < 0.05, **P < 0.01, ns, not significant, as determined by unpaired two-tailed Student’s t-test (b, j-m) or one-way ANOVA with Tukey’s multiple comparison test (n).
Together, our data show that in tumours exhibiting pleomorphic necrosis, neutrophils increase in circulation early upon tumour implantation and form intravascular NETs and aggregates with platelets in the tumour vasculature at sites of fibrin deposition. This process would block blood flow, rendering areas supplied by the occluded vessels necrotic, and would be consistent with the observed pleomorphic, necrotic architecture.
Perinecrotic areas gain pro-metastatic traits
Tumour necrosis is correlated with metastasis in patients with cancer19 and animal models20, but as necrotic cancer cells cannot metastasize, we focused on analysing the changes occurring in perinecrotic tumour regions, noting that these regions are larger in pleomorphic than in classical central necrotic tumours (Extended Data Fig. 4a). Hypoxic tumour regions were almost exclusively located in perinecrotic areas (Fig. 2a and Supplementary Video 16), thus we used hypoxia as a proxy for perinecrosis. In a single-cell RNA sequencing (scRNA-seq) dataset21 of 4T1 tumours, cancer cells categorized as hypoxic (Methods) expressed a set of genes that included, as expected, Hif1a and Vegfa, but also Cxcl1, Ddit4, Egr1 (inducing TGFβ expression), Mcl1, Tnc (promoting tumour migration), Limd1 (promoting the repression of E-cadherin expression) and Ltbp1 (increasing TGFβ activity and promoting epithelial-to-mesenchymal transition (EMT); Extended Data Fig. 4b and Supplementary Table 1). A Gene Ontology analysis of the genes differentially expressed in hypoxic cancer cells identified terms or pathways related to hypoxia and metabolism, but also to migration, TGFβ signalling and EMT (Extended Data Fig. 4c and Supplementary Table 2). We found similar gene-level changes and altered terms or pathways (related to migration, EMT and TGFβ) in hypoxic cancer cells from an scRNA-seq dataset of C3(1)-Tag tumours22 (Extended Data Fig. 4d and Supplementary Tables 3 and 4).
Extended Data Fig. 4. Hypoxic peri-necrotic regions induce pro-metastatic programs in tumor cells.

a, Illustration of the increased peri-necrotic area when necrotic regions are pleomorphic. A representative H&E image of a 4T1 tumor, showing a necrotic area (yellow dashed area) and an adjacent peri-necrotic area (blue dashed area). A circular region with an identical necrotic area (yellow circle, right), representing a non-pleomorphic, necrotic region) and its peri-necrotic area. The ratio of necrotic to peri-necrotic area is >3.4x higher in the pleomorphic case. b, Volcano plot (top) showing an overview of the genes upregulated in paired hypoxic cells (left) or normoxic cells (right) from 4T1 tumors by scRNA-seq and heatmap (bottom) of the genes upregulated in hypoxic 4T1 cancer cells compared to non-hypoxic cancer cells in the same tumors (with a list of selected genes). c, GO terms of the genes upregulated in hypoxic 4T1 cancer cells, including pathways related to hypoxia, EMT metabolism, and migration. d, Heatmap (bottom left) showing the genes upregulated in hypoxic C3(1)-Tag cancer cells (with a list of selected genes) compared to normoxic tumor cells (based on their expression of the “hypoxia response” pathway), and GO term analysis (right) of the pathways corresponding to the genes upregulated in hypoxic C3(1)-Tag cancer cells, showing pathways related to hypoxia (blue), metabolism (purple), migration (green), and EMT (red). e-f, Representative micrographs of two C3(1)-Tag tumors stained for E-cadherin (red) and vimentin (cyan). Representative of n = 3 mice. g, Quantification of E-cadherin (p < 0.0001) and h, quantification of vimentin (p < 0.0001) in cells from the peri-necrotic and non-peri-necrotic regions of C3(1)-Tag tumors. N = 1,687 non-peri-necrotic and 2,679 peri-necrotic cells from tumors from 3 mice per group. i-j, Two representative micrographs of needle biopsies from TNBC patients stained for E-cadherin and vimentin. Bars show mean. ***P < 0.001, as determined by unpaired two-tailed Student’s t-test (g, h), Wald test with Benjamini-Hochberg (BH) correction (b), or Fisher’s cumulative hypergeometric probability with multiple testing correction (c, d).
Fig. 2. Perinecrotic cancer cells gain pro-metastatic traits.

a, Representative micrograph showing hypoxia in perinecrotic regions (hypoxyprobe) of 4T1 tumours. Representative of n = 4 tumors. b, Representative images of 4T1 tumours stained for E-cadherin and vimentin as markers of EMT in perinecrotic regions. Representative of n = 3 tumours. c,d, Quantification of the mean fluorescence intensity (MFI) of E-cadherin (c; P < 0.0001) and vimentin (d; P = 0.0001) in cells from the perinecrotic and non-perinecrotic regions of 4T1 tumours. n = 426 non-perinecrotic and 291 perinecrotic cells from 3 mice per group. e–g, Representative images of LLC tumours stained for E-cadherin and vimentin (e), and quantification of E-cadherin (f; P < 0.0001) and vimentin (g; P < 0.0001) in cells from the perinecrotic and non-perinecrotic regions of LLC tumours. n = 2,186 non-perinecrotic and 1,739 perinecrotic cells from 3 mice per group. h, Gene Ontology (GO) term analysis of the genes upregulated in hypoxic cancer cells compared with non-hypoxic cells from patients with TNBC. dsRNA, double-stranded RNA. i–k, Representative images of human TNBC tumours stained for E-cadherin and vimentin (i), and quantification of E-cadherin (j; P < 0.0001) and vimentin (k; P < 0.0001) in cells from the perinecrotic and non-perinecrotic regions of human TNBC tumours. n = 1,136 non-perinecrotic and 1,646 perinecrotic cells from 3 human samples. The bars show mean. ***P < 0.001, as determined by unpaired, two-tailed Student’s t-test (c,d,f,g,j,k) or Fisher’s cumulative hypergeometric probability with multiple testing correction (h).
We then evaluated the protein expression of E-cadherin and vimentin (which decrease and increase, respectively, during EMT) in perinecrotic areas. Consistent with our sequencing data, E-cadherin levels were reduced and vimentin levels were increased in the perinecrotic regions of 4T1, LLC and C3(1)-Tag tumours (Fig. 2b–g and Extended Data Fig. 4e–h). Thus, the perinecrotic regions of several tumour models across different genetic backgrounds all showed changes consistent with EMT and increased metastatic potential.
In human tumours, we found similar results: an analysis of a publicly available scRNA-seq dataset of human TNBC tumours23 showed similar expression patterns in pathways related to hypoxia, migration and EMT, and in our TNBC needle biopsies, we consistently found decreased E-cadherin and increased vimentin levels, specifically in the perinecrotic regions (Fig. 2h–k, Extended Data Fig. 4i,j and Supplementary Table 5).
Response to TGFβ, a classical EMT inducer24, appeared in all of our transcriptomic analyses. Consistently, TGFβ protein was present mainly in perinecrotic, hypoxic regions in 4T1 tumours (Extended Data Fig. 5a), and was significantly higher in perinecrotic than in adjacent non-perinecrotic regions of 4T1, LLC and C3(1)-Tag tumours (Extended Data Fig. 5b–g).
Extended Data Fig. 5. Characterization of peri-necrotic regions.

a, Representative micrograph of a 4T1 tumor stained for hypoxia (hypoxyprobe, red) and TGFβ, showing high TGFβ protein in the hypoxic, peri-necrotic regions. Insets: high magnification of nuclear staining to visualize necrotic (top) and non-necrotic (bottom) regions. Representative of n = 3 cleared tumors. b, Representative micrograph of a 4T1 tumor, showing high TGFβ protein present in the peri-necrotic regions adjacent to neutrophil-rich (MPO) necrotic areas. Representative of n = 3 tumors. c, Quantification of the mean fluorescence intensity (MFI) of TGFβ signal in cells in the peri-necrotic and non-peri-necrotic areas of 4T1 tumors. N = 590 non-peri-necrotic and 892 peri-necrotic cells from 3 mice. p < 0.0001. d, Representative micrograph of an LLC tumor showing high TGFβ protein present in the peri-necrotic regions adjacent to neutrophil-rich (MPO) necrotic areas. Representative of n = 3 tumors. e, Quantification of the TGFβ signal in cells in the peri-necrotic and non-peri-necrotic areas of LLC tumors. N = 4,126 non-peri-necrotic and 2,756 peri-necrotic cells from tumors from 3 mice. p < 0.0001. f, Representative micrograph of a C3(1)-Tag tumor showing high TGFβ protein present in the peri-necrotic regions adjacent to neutrophil-rich (MPO) necrotic areas. Representative of n = 3 mice. g, Quantification of the MFI of TGFβ signal in cells in peri-necrotic and non-peri-necrotic areas of C3(1)-Tag tumors. N = 546 non-peri-necrotic and 885 peri-necrotic cells from 3 mice. p < 0.0001. h, H&E stainings of two additional 4T1 tumors subjected to spatial transcriptomics (top, related to Fig. 3a). Necrotic (red), peri-necrotic (orange), and non-necrotic (green) clusters are based on their transcriptomic profile (bottom). i, Heatmap showing the expression of the combined top 15 differentially regulated genes of each cluster. j, Volcano plot showing genes differentially expressed between peri-necrotic (clusters 2 and 5) and non-necrotic (clusters 4, 3, and 6) tumor regions. k, Representative spatial distribution of selected differentially expressed genes in necrotic, peri-necrotic, and non-necrotic regions of 4T1 tumors (from tumor 2 shown in Fig. 3a). l, Spatial pathway analysis showing some pathways enriched in peri-necrotic regions. Bars show mean. ***P < 0.001, as determined by unpaired two-tailed Student’s t-test (c, e, g) or Wald test with Benjamini-Hochberg correction (j).
To unambiguously identify pathways upregulated specifically in perinecrotic regions, we performed spatial transcriptomic analyses of 4T1 tumours (Fig. 3a and Extended Data Fig. 5h). Unbiased clustering was able to differentiate between necrotic, perinecrotic and non-necrotic tumour regions (Fig. 3b and Extended Data Fig. 5h), and these regions also separated clearly in the low-dimensional uniform manifold approximation and projection (UMAP) representation (Fig. 3c). Many genes were differentially expressed among the different clusters, including increased expression of EMT-associated Vim (encoding vimentin) and Twist1, specifically in perinecrotic regions (Fig. 3d,e and Extended Data Fig. 5i–k). Genes upregulated in the perinecrotic regions belonged to pathways related to hypoxia, migration, EMT and TGFβ (Fig. 3f, Extended Data Fig. 5l and Supplementary Tables 6 and 7). Thus, perinecrotic regions are hypoxic and activate transcriptomic programs associated with increased migratory and metastatic potential, consistent with the known link between hypoxia and EMT25.
Fig. 3. Spatial mapping of transcriptional programs in perinecrotic tumour regions.

a, Haematoxylin and eosin (H&E) scans of 4T1 tumours subjected to spatial transcriptomics. Representative of n = 4. b, Necrotic (red), perinecrotic (orange) and non-necrotic (green) clusters based on the transcriptomic profile. c, Low-dimensional UMAP representation of the spatial clusters in the dataset. d, Overview of the genes differentially regulated in the different clusters. e, Representative spatial distribution of some of the genes differentially expressed in necrotic, perinecrotic and non-necrotic regions in 4T1 tumours (corresponding to tumour 2 in panel a). f, Gene Ontology terms enriched in the upregulated genes in perinecrotic clusters as compared with non-necrotic clusters showing terms related to hypoxia, EMT, metabolism and migration. g, Tumours expressing dominant-negative TGFβR2 (dnTGFβR2) show no difference in neutrophil counts in blood. n = 5 mice per group. EV, empty vector. h, Representative H&E images (left) and quantification (right) of necrosis in EV (control) or dnTGFβR2-expressing 4T1 tumours. n = 5 mice per group. i, Representative H&E images (left) and quantification (right) of metastatic spread to the lungs of EV (control) or dnTGFβR2 expressing 4T1 tumours. P = 0.0018. n = 9 mice per group. The bars show mean + s.e.m. **P < 0.01 and not significant (NS), as determined by unpaired, two-tailed Student’s t-test (g–i) or Fisher’s cumulative hypergeometric probability with multiple testing correction (f).
Finally, to examine the spatial relationships among necrotic regions, hypoxia and pro-metastatic traits in human cancers, we analysed a publicly available transcriptomics dataset of eight human non-small-cell lung cancer (NSCLC) samples26. As neutrophils heavily and preferentially infiltrate necrotic areas in both mouse and human tumours (Extended Data Fig. 6a), we used neutrophil-dense regions as a proxy for necrotic areas. In cancer cells near neutrophil-dense regions, we identified differentially expressed genes belonging to pathways related to hypoxia, migration, EMT and TGFβ (Extended Data Fig. 6b,c and Supplementary Table 8). In agreement with our mouse spatial transcriptomics data, these results suggest that cancer cells in perinecrotic regions of human tumours, near neutrophil-dense areas, are hypoxic and undergo pro-metastatic transcriptional changes.
Extended Data Fig. 6. NSCLC spatial transcriptomics and TGF-β involvement.

a, H&E and MPO stainings of sections from the same human TNBC and mouse 4T1 tumors, showing that neutrophils (MPO) are highly enriched in necrotic areas. b, Examples of genes that show spatial correlation with neutrophils (neutrophils identified from dataset metadata; indicated as red dots in top-left panel) in an NSCLC spatial transcriptomics dataset. c, GO term analysis of the interaction changing genes (ICGs) in cancer cells that interact with neutrophils, showing terms related to hypoxia, EMT, metabolism, and migration. d, Representative image (left) and quantification (right) of E-cadherin (p < 0.0001) and vimentin (p = 0.0373) in peri-necrotic regions of dnTGFbR2 tumors, showing that these areas no longer show decreased E-cadherin and increased vimentin, consistent with a lack of EMT in these regions, when TGFβ signaling in cancer cells is disrupted. N = 3 mice. e, Representative images (left) and intensity quantification (right) of pSMAD2 in empty vector (control) or TGFbR2 dominant-negative 4T1 tumors. p < 0.0001. f, Numbers of monocytes and T-cells in the blood of mice bearing empty vector (control) or TGFbR2 dominant-negative 4T1 tumors. N = 5 mice per group. g, Representative images of dnTGFbR2 tumors, showing tumor necrosis, neutrophil infiltration, and NET formation. Representative of n = 3 mice. h, Quantification of the number of metastatic foci (p = 0.0004) and the average size of metastatic lesions (p = 0.9997) in the lungs of empty vector (control) or dnTGFbR2 4T1 tumors. N = 9 mice per group. i, TGFβ signaling pathway dominance (outgoing strength on x-axis) in different cell types by CITE-Seq analysis of 4T1 tumors. ILCs, innate lymphoid cells. NKTs, natural killer T-cells. j, Transcriptional production of key TGFβ signaling pathway members in different cell types by CITE-Seq data analysis of 4T1 tumors. NK cells, natural killer cells. k, Representative imaging mass cytometry images showing macrophages (CD68) are enriched around neutrophil-rich (Ly6G) necrotic regions. Representative of n = 16 regions from eight 4T1 tumors. Bars show mean + s.e.m. *P < 0.05, ***P < 0.001, ns, not significant, as determined by unpaired two-tailed Student’s t-test (d, e, f, h) or Fisher’s cumulative hypergeometric probability with multiple testing correction (c).
We next directly analysed the involvement of TGFβ signalling in cancer cells in the metastatic spread of tumours containing pleomorphic necrosis. We generated 4T1 cells expressing a dominant-negative TGFβ receptor (dnTGFβR2)27 or empty vector as control. The tumours expressing dnTGFβR2 showed reduced pSMAD2 activity and no signs of EMT (decreased E-cadherin and increased vimentin levels) in perinecrotic regions (Extended Data Fig. 6d,e), consistent with inhibition of TGFβ signalling. Four weeks post-implantation, we found no changes in the numbers of neutrophils, monocytes or T cells in circulation in control versus dnTGFβR2 4T1 tumour-bearing mice, nor obvious changes in the numbers of NETs or the amount of pleomorphic necrosis in the tumours (Fig. 3g,h and Extended Data Fig. 6f,g), indicating that TGFβ signalling in cancer cells is dispensable for tumour necrosis. However, mice with dnTGFβR2 tumours showed reduced metastasis to the lungs compared with controls (Fig. 3i and Extended Data Fig. 6h). TGFβ signalling in cancer cells in perinecrotic regions is thus critical to induce EMT and metastasis from tumours with pleomorphic necrosis.
To understand which cells express TGFβ in 4T1 tumours, we performed CITE-seq, imaging mass cytometry and tissue-clearing analyses, which suggested that TGFβ in the perinecrotic regions is produced by macrophages (Extended Data Fig. 6i–k and Supplementary Video 17).
Together, our data show that necrosis of the primary tumour generates a perinecrotic, hypoxic region where cancer cells, through TGFβ signalling, undergo EMT-like changes that promote metastasis.
Tumours affect the haematopoietic compartment
To understand why some models (for example, 4T1 or LLC) showed pleomorphic necrosis, whereas the MMTV-PyMT model did not, we injected MMTV-PyMT and LLC cancer cells into the mammary gland and opposite flank, respectively, of mice. MMTV-PyMT tumours showed increased pleomorphic necrosis and NETs when LLC tumours were also present in the same mouse (Extended Data Fig. 7a), suggesting that systemic changes to the tumour-bearing mice were responsible for tumour necrosis. When we compared 4T1 and MMTV-PyMT breast cancer cells from a published scRNA-seq dataset21, we found many differentially expressed genes belonging to pathways related to hypoxia, neutrophil-mediated immunity and, interestingly, haematopoiesis regulation (Extended Data Fig. 7b–d and Supplementary Table 9).
Extended Data Fig. 7. Tumor-induced hematopoietic changes.

a, Representative H&E image (left), immunofluorescence staining for neutrophils and NETs (center), and quantifications (right) of a MMTV-PyMT tumor implanted alone or in a mouse with a LLC tumor implanted in the contralateral flank, showing that the presence of a LLC tumor in the same host increases the amount of necrosis (p = 0.0442) and NETs (p = 0.0406) in MMTV-PyMT tumors of similar size (p = 0.3667). N = 3 mice per group. b, Top differentially expressed genes between 4T1 (forming pleomorphic necrosis) and MMTV-PyMT (not forming pleomorphic necrosis) cancer cells. c, Reactome pathway analysis of the genes differentially regulated in 4T1 and MMTV-PyMT cancer cells, which includes pathways related to hypoxia (red text). d, Aggregated expression of pathways regulating hematopoiesis (top), hypoxia response (center), and neutrophil-mediated immunity (bottom) in 4T1 and MMTV-PyMT cancer cells. e, Representative gross anatomical view of the bone marrow from naïve mice or mice bearing 4T1 (top) or LLC (bottom) tumors, showing a distinct pale white appearance of the bone marrow of the tumor-bearing mice 4 weeks after tumor implantation. f, Simplified schematic representation of the hematopoietic system showing the main populations. LT-HSCs (long term-hematopoietic stem cells). ST-HSCs (short term-hematopoietic stem cells). CMPs (common myeloid progenitors). CLPs (common lymphoid progenitors). MPPs (multipotent progenitors). MEPs (megakaryocyte, erythrocyte progenitors). GMPs (granulocyte-monocyte progenitors). NK (natural killer cells). RBCs (red blood cells, erythrocytes). Baso/Eo (basophils, eosinophils). g, Dimensionality reduction (left) and quantification (right) of LSKs, GMPs, and MEPs (gating strategy in panel h) in the bone marrow of 4T1, LLC, and MMTV-PyMT tumor-bearing mice and naïve controls, showing a myeloid skew in 4T1 and LLC mice. N = 5 (4T1, MMTV-PyMT) or 4 (LLC) mice per group. 4T1: LSKs p = 0.0254, GMPs p = 0.0048, MEPs p = 0.0093. LLC: LSKs p = 0.002, GMPs p = 0.0003, MEPs p = 0.0009. PyMT: LSKs p = 0.7513, GMPs p = 0.1005, MEPs p = 0.4827. h, Gating strategy for the cytometric analysis of HSPCs. i, Quantification of LSKs and GMPs in the spleen of 4T1 (LSK p = 0.0017, GMPs p = 0.0031), LLC (LSK p = 0.0783, GMPs p = 0.0219), and MMTV-PyMT (LSK p = 0.1274, GMPs p = 0.1124) tumor-bearing mice. N = 5 (4T1 and MMTV-PyMT) or 4 (LLC) mice per group. Bars show mean + s.e.m. *P < 0.05, **P < 0.01, ***P < 0.001, ns, not significant, as determined by unpaired two-tailed Student’s t-test (a, g, i), binomial test with Benjamini-Hochberg multiple testing correction (c), or Wilcoxon rank sum test (d).
As the models with pleomorphic necrosis showed increased numbers of circulating neutrophils and transcriptomic programs related to haematopoiesis, and the bone marrow of 4T1 and LLC tumour-bearing mice had a macroscopic white appearance (Extended Data Fig. 7e; suggesting increased leukocyte production or retention), we interrogated our models for changes to the haematopoietic compartment (Extended Data Fig. 7f) by flow cytometry. We found more early progenitors (lineage−, Sca1+ and Kit+ cells (LSKs)) and granulocyte–monocyte progenitors (GMPs) and fewer megakaryocyte–erythrocyte progenitors (MEPs) in the models with pleomorphic necrosis (4T1 and LLC) than in non-tumour-bearing controls, but no changes in the haematopoietic compartment of mice with a small, transplanted and non-pleomorphic necrotic MMTV-PyMT tumour (Extended Data Fig. 7g,h), which contrasts to the haematopoietic changes reported in transgenic MMTV-PyMT mice with multiple, large tumours28. Finally, we found similar results in splenic populations, consistent with the spleen hosting extramedullary emergency haematopoiesis (Extended Data Fig. 7i).
When we next analysed13 the immune compartment in several tissues, we found increased numbers of myeloid cells, especially neutrophils, in the bone marrow, blood, spleen and lungs of 4T1 and LLC tumour-bearing mice, but only modest changes in MMTV-PyMT tumour-bearing mice compared with non-tumour-bearing controls (Extended Data Fig. 8a–e). Together, these data suggest that in the models showing pleomorphic necrosis, there is a haematopoietic skew towards granulopoiesis.
Extended Data Fig. 8. The primary tumor induces a myeloid skew in the hematopoietic compartment.

a, Dimensionality reduction (left) and quantification (right) of mature immune cells in the bone marrow, blood, spleen, and lung of naïve and 4T1 tumor-bearing mice, showing a myeloid expansion and low-dimensionality position switch for neutrophils. N = 5 mice per group. Bone marrow: Neutrophils p = 0.0177, Monocytes p = 0.0628, T-cells p = 0.0029. Blood: Neutrophils p = 0.0124, Monocytes p = 0.0007, T-cells p = 0.0143. Spleen: Neutrophils p = <0.0001, Monocytes p = 0.0003, T-cells p = 0.0011. Lung: Neutrophils p = 0.0044, Monocytes p = 0.0158, T-cells p = 0.8036. b, Low-dimensional representation of mature T-cells, neutrophils, and monocytes in the bone marrow (BM), blood, lung, and spleen of naïve and tumor-bearing LLC mice. N = 4 mice per group. c, Quantification of mature T-cells, neutrophils (PMNs), and monocytes in the bone marrow, blood, lung, and spleen of naïve and tumor-bearing LLC mice. N = 4 mice per group. Bone marrow: Neutrophils p = 0.0044, Monocytes p = 0.7725, T-cells p = 0.0183. Blood: Neutrophils p = 0.0001, Monocytes p = 0.0001, T-cells p = 0.0066. Lung: Neutrophils p < 0.0001, Monocytes p = 0.8447, T-cells p = 0.0910. Spleen: Neutrophils p = 0.0137, Monocytes p = 0.0093, T-cells p = 0.0010. d, Low-dimensional representation of mature T-cells, neutrophils, and monocytes in the bone marrow, blood, lung, and spleen of naïve and tumor-bearing MMTV-PyMT mice. N = 5 mice per group. e, Quantification of mature T-cells, neutrophils (PMNs), and monocytes in the bone marrow, blood, lung, and spleen of naïve and tumor-bearing MMTV-PyMT mice. N = 5 mice per group. Bone marrow: Neutrophils p = 0.0061, Monocytes p = 0.0534, T-cells p = 0.0150. Blood: Neutrophils p = 0.0173, Monocytes p = 0.0477, T-cells p = 0.0811. Lung: Neutrophils p = 0.0721, Monocytes p = 0.4823, T-cells p = 0.3911. Spleen: Neutrophils p = 0.0193, Monocytes p = 0.0312, T-cells p = 0.0731. Bars show mean + s.e.m. *P < 0.05, **P < 0.01, ***P < 0.001, ns, not significant, as determined by unpaired two-tailed Student’s t-test (a, c, e).
CXCR2 signalling can prevent stem cell exhaustion29 and promote the release of neutrophils30 and haematopoietic stem and progenitor cells (HSPCs)31 into the circulation. Neutrophils also undergo phenotypic changes in response to CXCR2 stimulation32–34. One gene differentially expressed in the 4T1 versus MMTV-PyMT models was Cxcl1, a chemokine acting through the CXCR2 receptor. To test whether cancer cell-expressed Cxcl1 could drive the changes in the haematopoietic compartment, we generated two independent 4T1 Cxcl1-knockout lines (Extended Data Fig. 9a). Orthotopic tumour implantation with CXCL1-deficient cancer cells significantly reduced the number of GMPs in the bone marrow and the expansion of myeloid populations, including neutrophils, in peripheral blood (Extended Data Fig. 9b). Furthermore, stimulating purified HSPCs in vitro with CXCL1 increased the number of GMPs and mature neutrophils (Extended Data Fig. 9c). This suggest that the myeloid skew in tumour-bearing mice was, at least partially, caused by cancer cells expressing Cxcl1 and stimulating HSPCs directly.
Extended Data Fig. 9. Primary tumor-hematopoiesis interplay.

a, Cxcl1-deficient 4T1 cells show minimal expression of CXCL1 in the supernatants, as determined by ELISA (right, showing mutants generated with 2 independent sgRNA constructs). b, Low-dimensional projection of mature T-cells, neutrophils (PMNs), and monocytes in circulation of mice bearing control or Cxcl1-deficient 4T1 tumor cells (left). Neutrophils and monocytes are significantly reduced in these mice (center graphs), indicating a reduced myeloid output from the bone marrow consistent with reduced number of GMPs in the bone marrow (right). N = 8 control, 3 Cxcl1-KO1 (sgRNA 1), and 5 Cxcl1-KO2 (sgRNA 2) mice for neutrophil and monocyte quantification; N = 5 mice per group for GMP quantification. Neutrophils: control vs KO-1 p = 0.0143, control vs KO-2 p = 0.0104. Monocytes: control vs KO-1 p = 0.0103, control vs KO-2 p = 0.0071. GMPs: control vs KO-1 p = 0.0053, control vs KO-2 p = 0.0145. c, Number of GMPs and neutrophils after 11 days of culturing purified hematopoietic stem and progenitor cells in vitro with CXCL1. NT, non treated (media only). N = 5. GMPs p = 0.0001, Neutrophils p < 0.0001. d, Metaclusters of the FlowSOM unbiased cytometric analyses of 4T1 tumor-bearing blood populations, showing neutrophil metaclusters 2, 3, 5, and 6 expressing varying levels of different markers, including Ly6C and CD11c. N = 5 mice per group. e, Overview of the metacluster marker expression from the data shown in (d). f, Metacluster abundance comparing tumor-bearing and naïve mice, showing that in naïve mice, only neutrophil cluster 2 (from panel e and g) is present. g, Clustering of flow cytometric data of blood cells from 4T1 tumor-bearing mice, showing 4 neutrophil clusters (2, 3, 5, and 6) with phenotypical differences in several markers (right), including Ly6C and CD11c. N = 5 mice. h, Clustering of flow cytometric data of blood cells from Cxcl1-knockout 4T1 tumor-bearing mice, showing only one neutrophil cluster (1, left) with minor phenotypical variation (right), suggesting that neutrophil heterogeneity is reduced when cancer cells do not express Cxcl1 (compare with panel g). N = 5×10⁵ cells from N = 8 mice. i, Backgating for the Ly6CLow neutrophil gate. j, Volcano plot showing some of the genes overrepresented in Ly6CHigh (left) or Ly6CLow (right) neutrophils. k, GO terms analysis of the differentially expressed genes downregulated in Ly6CLow neutrophils, highlighting terms related to migration and extravasation (red text). l, Cytometric analysis of selected surface markers on Ly6CHigh, Ly6CInt, and Ly6CLow neutrophils. N = 5 mice except for ICAM1, where N = 3. CD62L: Hi vs Int p = 0.0012, Int vs Lo p = 0.2626, Hi vs Lo p = 0.0036. SiglecF: Hi vs Int p = 0.0001, Int vs Lo p = 0.0031, Hi vs Lo p = 0.0001. CXCR2: Hi vs Int p = 0.0001, Int vs Lo p = 0.0023, Hi vs Lo p = 0.0002. CD11b: Hi vs Int p = 0.0750, Int vs Lo p = 0.3596, Hi vs Lo p = 0.1205. CXCR4: Hi vs Int p < 0.0001, Int vs Lo p = 0.3407, Hi vs Lo p = 0.0001. ICAM1: Hi vs Int p = 0.0468, Int vs Lo p = 0.0421, Hi vs Lo p = 0.0437. CD11c: Hi vs Int p = 0.0035, Int vs Lo p = 0.0014, Hi vs Lo p = 0.0023. m, Representative images (left) and quantification of the number of nuclear lobes of sorted Ly6CHigh and Ly6CLow neutrophils from the blood of 4T1 tumor-bearing mice, showing no differences in nuclear morphology. N = 41 Ly6CHigh and 36 Ly6cLow neutrophils. n, Representative cytometric plot showing the levels of CD101 in Ly6CHigh/Int/Low neutrophils from the blood of 4T1 tumor-bearing mice and o, quantification of the percentage of immature CD101Low neutrophils in each category. N = 4 mice. Hi vs Int p = 0.0866, Int vs Lo p = 0.0044, Hi vs Lo p = 0.0026. p, In vivo phagocytosis assay showing no differences in the phagocytosis potential of the different neutrophil populations by flow cytometry in the blood of 4T1 tumor-bearing mice. N = 5 mice. q, Representative histogram (left) and quantification (right) of ROS (dihydroethidium, DHE) production by Ly6CHigh/Int/Low neutrophils, showing no basal differences in ROS content between the populations, as determined by flow cytometry. N = 5 mice. r, Representative flow cytometry plot (left) and quantification (right) of the dcTRAIL-R1 signal in circulating neutrophils, showing very few positive circulating neutrophils regardless of Ly6C status. N = 3 mice per group. Hi vs Int p = 0.1995, Int vs Lo p = 0.4578, Hi vs Lo p = 0.0402. Bars show mean + s.e.m. *P < 0.05, **P < 0.01, ***P < 0.001, ns, not significant, as determined by paired two-tailed Student’s t-test (c), one-way ANOVA with Geisser-Greenhouse or Tukey’s multiple comparison test (b, l, o-r), Wald test with Benjamini-Hochberg correction (j) or Fisher’s cumulative hypergeometric probability with multiple testing correction in (k).
Finally, when comparing the mature immune populations in the blood and tissues of tumour-bearing versus non-tumour-bearing mice, we observed that neutrophils, but not monocytes or T cells, shifted in position in the low-dimensional t-distributed stochastic neighbour embedding (tSNE) space in the models with pleomorphic necrosis (4T1 and LLC), but not in the model with classical/central necrosis (MMTV-PyMT; Extended Data Fig. 8a,b,d). We therefore investigated the phenotypic heterogeneity of neutrophils in tumour-bearing mice and found increased neutrophil heterogeneity in several markers (Extended Data Fig. 9d–g; neutrophil metaclusters 2, 3, 5 and 6), including CD11b, CD11c, MHC class II and Ly6C. In comparison, naive mice had only one of those neutrophil metaclusters (metacluster 2; Extended Data Fig. 9f). Furthermore, circulating neutrophils from Cxcl1-knockout tumour-bearing mice showed reduced heterogeneity (Extended Data Fig. 9h compared with Extended Data Fig. 9g).
Together, these data suggest that the primary tumour, at least partially through Cxcl1 expression, induces a skew towards myelopoiesis in the bone marrow that systemically increases neutrophil numbers and heterogeneity, particularly in the tumour-bearing mice that develop pleomorphic necrosis.
Tumours induce vascular-restricted neutrophils
Of the phenotypic changes to the neutrophils in tumour-bearing mice, one was particularly unexpected: the appearance of a Ly6GHighLy6CLow population of neutrophils in the blood (neutrophils usually express high levels of Ly6C, albeit lower levels than monocytes). We found circulating Ly6CLow neutrophils present in 4T1 and LLC tumour-bearing mice, but not in naive or MMTV-PyMT mice (Fig. 4a and backgating in Extended Data Fig. 9i).
Fig. 4. Ly6CLow neutrophils form more NETs and are vascular restricted.

a, Ly6C in circulating neutrophils from naive, MMTV-PyMT, 4T1 or LLC tumour-bearing mice. b, Heatmap of genes differentially expressed in Ly6CLow versus Ly6CHigh neutrophils from 4T1 tumour-bearing mice; selected genes are noted on the right. c, Gene Ontology terms from genes downregulated in Ly6CLow neutrophils (the red text denotes pathways related to extravasation). PRR, pattern recognition receptor. d, Time course of Ly6CHigh/Int/Low neutrophil presence in circulation. n = 3 mice per timepoint. e, Ex vivo PMA-induced NET formation comparing Ly6CHigh and Ly6CLow neutrophils from the blood of 4T1 tumour-bearing mice; representative images (left; the arrows point to NETs) and quantification (right) are shown. n = 24 fields from 4 mice per condition. P = 0.9996 for Ly6CHigh-vehicle versus Ly6CHigh-PMA; P = 0.2780 for Ly6CHigh-vehicle versus Ly6CLow-vehicle; P = 0.0026 for Ly6CLow-vehicle versus Ly6CLow-PMA; and P < 0.0001 for Ly6CHigh-PMA versus Ly6CLow-PMA. f, Representative plots of neutrophils from the blood and peritoneal lavage of naive and 4T1 tumour-bearing mice with Zymosan-induced peritonitis, showing Ly6CLow neutrophils in 4T1 tumour-bearing mice (bottom row, red) present in blood (left) but not extravasating to the peritoneal cavity (right). g, Quantification of Ly6CLow neutrophils from panel f. n = 5 mice per group. P = 0.7159 for naive blood versus peritoneal lavage (PL); P < 0.0001 for 4T1 blood versus PL; P < 0.0001 for naive blood versus 4T1 blood; and P = 0.7040 for naive PL versus 4T1 PL. h, Neutrophil clusters from scRNA-seq data of patients with TNBC and their numbers in blood versus tumour tissue, showing a cluster (3) abundant in blood but not in tumour. i, Aggregated Ly6CLow neutrophil signature in clusters from panel h, showing enrichment in cluster 3. j, Aggregated ‘cell extravasation’ pathway genes in clusters from panel h; cluster 3 has the lowest expression of extravasation-related genes. P < 2.22 × 10⁻¹⁶ for 1 versus 2; P = 0.00067 for 1 versus 3; and P = 6.2 × 10⁻¹⁴ for 2 versus 3. The bars show mean + s.e.m. **P < 0.01 and ***P < 0.001, as determined by one-way analysis of variance (ANOVA) with Tukey’s test (e,g), Kruskal–Wallis test (j) or Fisher’s cumulative hypergeometric probability with multiple testing correction (c).
We performed RNA-seq of Ly6CLow and Ly6CHigh neutrophils sorted from 4T1 tumour-bearing mice (Extended Data Fig. 9j) and generated a signature of differentially expressed genes in Ly6CLow compared with Ly6CHigh neutrophils (Fig. 4b and Supplementary Table 10). This signature included increased expression of Cyria (a Rac1 inhibitor and integrin internalization promoter), Dok1 (which reduces integrin activation), Icam1 (important for cell–cell and cell–matrix adhesion), Itgax (encoding CD11c, a fibrinogen receptor) and Itga4 (encoding a fibronectin receptor). The signature also included reduced expression of Ly6c1 and Ly6c2 (suggesting Ly6C downregulation at the transcriptomic level), among others. A Gene Ontology term analysis of the differentially expressed genes (Extended Data Fig. 9k and Supplementary Table 11) yielded many pathways related to inflammatory responses, translation regulation and, interestingly, cell motility and migration. Moreover, the genes downregulated in Ly6CLow neutrophils belonged to several pathways related to innate immune response, motility, adhesion to endothelium and extravasation (Fig. 4c and Supplementary Table 12). The downregulation of extravasation-related pathways was intriguing, given the intravascular neutrophil aggregates in the tumour vasculature (Fig. 1c–f). We analysed the protein-level expression of select genes from the sequencing data, as well as classical neutrophil markers by flow cytometry, and found changes in CD62L, SiglecF, CXCR2, CXCR4, ICAM1 and CD11c levels in Ly6CLow neutrophils (Extended Data Fig. 9l).
Regarding temporal dynamics, the Ly6CLow neutrophils in 4T1 tumour-bearing mice were already detectable at day 9 after cancer cell implantation (4,595 ± 379 Ly6CLow neutrophils per millilitre of blood), coinciding with the appearance of pleomorphic necrosis in the primary tumour (Fig. 4d and Extended Data Fig. 2g).
We next explored the properties of the Ly6CLow neutrophil population. Although immature neutrophils have been implicated in cancer progression35, the nuclear morphology of Ly6CLow and Ly6CHigh neutrophils was similar, and Ly6CLow neutrophils did not show increased percentage of CD101Low immature population (Extended Data Fig. 9m–o), suggesting that they are not an immature population. We also found no differences in phagocytosis or reactive oxygen species production (Extended Data Fig. 9p–q). In agreement with a recent paper that found dcTRAIL-R1+ neutrophils in hypoxic regions of the tumour but not in circulation36, we found no dcTRAIL-R1 enrichment in Ly6CLow neutrophils (Extended Data Fig. 9r). Because the neutrophil aggregates in the microvasculature of the tumours with pleomorphic necrosis were associated with NETs (Fig. 1d), we tested the NET formation ability of Ly6CHigh neutrophils. Ly6CLow neutrophils formed NETs more efficiently upon phorbol 12-myristate 13-acetate (PMA) stimulation than did the Ly6CHigh counterparts sorted from the same host (Fig. 4e).
Given the multiple changes in pathways associated with cell motility and extravasation in our RNA-seq data, we analysed the ability of Ly6CLow neutrophils to infiltrate inflamed tissues using a Zymosan-based peritonitis model. In agreement with the sequencing data, Ly6CLow neutrophils did not extravasate from the blood to migrate into the peritoneal cavity (Fig. 4f,g and Extended Data Fig. 10a). In addition, consistent with a preferential extravasation and tissue infiltration of Ly6CHigh neutrophils upon dermal laser injury37, as assessed by intravital microscopy, the mean Ly6C signal on the total neutrophil population increased as neutrophils infiltrated the tissue, suggesting that Ly6CLow neutrophils did not extravasate (Extended Data Fig. 10b–d and Supplementary Video 18). Consistent with their decreased extravasation capacity, the half-life of the Ly6CLow neutrophils (28.8 h) in circulation was also longer than that of Ly6CHigh neutrophils (14.6 h; Extended Data Fig. 10e). Yet, Ly6CLow neutrophils had no defect in chemotaxis (Extended Data Fig. 10f). Nevertheless, blocking Ly6C with antibodies reduced neutrophil infiltration into the peritoneal cavity in response to Zymosan (Extended Data Fig. 10g), suggesting that Ly6C has a direct role in regulating extravasation.
Extended Data Fig. 10. Characterization of vascular-restricted neutrophils.

a, Quantification of Ly6CHigh/Int neutrophils in blood and peritoneal lavage of naïve and 4T1 tumor-bearing mice subjected to Zymosan-induced peritonitis. N = 5 mice per group. b, Still captures of neutrophils infiltrating the dermis during the experimental laser injury model (dashed circle: injury area), showing the dynamics of neutrophil infiltration over time. SHG, second harmonic generation. c, Representative still images of neutrophils from 4T1 tumor-bearing LysM-GFP mice intravascularly stained for Ly6C infiltrating the dermis in a laser injury experiment, showing that extravasating neutrophils have higher Ly6C signal than neutrophils inside the vasculature. Representative of n = 3 mice. d, Quantification of the number (top) and mean per-cell fluorescence intensity of Ly6C (bottom) in neutrophils infiltrating the dermis over time, showing that neutrophils infiltrating the tissue harbor higher Ly6C signal than neutrophils at early timepoints (mostly vascular), indicating that extravasating neutrophils have higher Ly6C expression. Representative of n = 3 mice. e, Quantification of neutrophil half-life in circulation. N = 5 mice. p = 0.0398. f, Proportion of Ly6CLow neutrophils in the starting population (input) and among the cells migrating spontaneously (not treated, NT) or towards CXCL1 in a chemotaxis assay. N = 3 mice. g, Absolute number (abs #) of neutrophils extravasated to the peritoneal cavity after Zymosan-induced peritonitis in mice treated with anti-Ly6C or isotype control antibodies. N = 5 isotype- and 4 αLy6C-treated mice. p = 0.0012. h, Representative flow cytometry plots and i, quantification of the proportion of the Ly6CLow (p = 0.0197), Ly6CInt (p = 0.0076), and Ly6CHigh (p = 0.0011) neutrophil populations after isolation from blood (input) and adhesion to fibrin, showing that Ly6CLow and Ly6CInt neutrophils adhere to fibrin better than Ly6CHigh neutrophils. N = 3 mice. j, Quantification of the adhesion to fibrin of Ly6CLow neutrophils pretreated with antibodies against CD11c. Neutrophils isolated from the blood of n = 10 mice. p = 0.0010. k, NET formation frequency of neutrophils attached to fibrin-coated slides and stimulated with PMA. N = 3 mice. Hi vs Int p = 0.0628, Hi vs Lo p = 0.0347. l, Quantification of neutrophil-platelet aggregates in the blood of 4T1 tumor-bearing mice. N = 5 mice. Hi vs Int p = 0.8602, Int vs Lo p = 0.1032, Hi vs Lo p = 0.0475. m, Percentage of multiplets (left) and normalized values (to better visualize rate of change, right) over time upon fMLP stimulation of sorted neutrophils. n, NET formation frequency of neutrophils attached to poly-L-Lysine-coated slides and stimulated with PMA. N = 4 mice. Hi vs Int p = 0.0514, Hi vs Low p = 0.0417. o, Representative flow cytometry plots and p, quantification of the number and percentage of Ly6CLow neutrophils in Cxcl1-knockout 4T1 tumors compared to control, showing that cancer cell-produced CXCL1 is at least partially responsible for the systemic increase of Ly6CLow neutrophils. N = 8 control, 3 Cxcl1-ko1, and 5 Cxcl1-ko2 tumor-bearing mice. Percent: Control vs. ko-1 p = 0.0022. Control vs. ko-2 p = 0.0276; Number: Control vs. ko-1 p = 0.0288. Control vs. ko-2 p = 0.0203. q, Quantification of tumor necrosis (Control vs. ko-1 p = 0.0278. Control vs. ko-2 p = 0.0228) and lung metastasis (Control vs. ko-1 p = 0.0296. Control vs. ko-2 p = 0.0356) and r, representative images of tumor necrosis in Cxcl1-knockout 4T1 tumors compared to controls, showing reduced necrosis in Cxcl1-deficient tumors. N = 12 control, 3 Cxcl1-ko1, and 5 Cxcl1-ko2 mice for tumor necrosis, and N = 3 control and Cxcl1-ko mice and 5 Cxcl1-ko2 mice for lung metastasis. s, Representative flow cytometry plots (left) and quantification (right) of the number of Ly6CLow neutrophils in dnTGFbR2 tumor-bearing mice, showing that TGFβ signaling in cancer cells is not required for the appearance of Ly6CLow neutrophils. N = 5 mice per group. t, Quantification of several phenotypic markers in circulating neutrophils, showing that the neutrophil phenotypes in dnTGFbR2 tumor-bearing mice are similar to those in control mice. N = 5 mice per group. CD11c p = 0.0179. u, Ly6CLow neutrophil signature violin plots of human TNBC neutrophils, showing that cluster 3 had the highest overlap with the Ly6CLow transcriptomic signature. For all comparisons, p < 2.22E-16. Bars show mean + s.e.m. *P < 0.05, **P < 0.01, ***P < 0.001, ns, not significant, as determined by unpaired two-tailed Student’s t-test in (e, g, s, t), paired two-tailed Student’s t-test (i, j), one-way ANOVA with Geisser-Greenhouse or Tukey’s multiple comparison test in (a, f, k, l, n, p, q), or Kruskal-Wallis test in (u).
Because we found increased levels of CD11c (a fibrinogen receptor) and ICAM-1 (which also interacts with fibrinogen38) on Ly6CLow neutrophils (Extended Data Fig. 9l), we tested their ability to adhere to fibrin. Ly6CLow neutrophils adhered to fibrin better than Ly6CHigh neutrophils, had reduced adhesion to fibrin when neutrophils were pre-treated with antibodies to CD11c, formed more NETs when adhering to fibrin and were better able to aggregate with platelets than Ly6CHigh neutrophils (Extended Data Fig. 10h–l). Finally, Ly6CHigh neutrophils showed lower aggregation than other neutrophils at baseline, but when stimulated with N-formylmethionine-leucyl-phenylalanine (fMLP), the rate of aggregation was similar between the neutrophil populations (Extended Data Fig. 10m). Of note, Ly6CInt neutrophils showed an intermediate phenotype: they were able to extravasate, although less efficiently than Ly6CHigh neutrophils (Extended Data Fig. 10a), and like Ly6CLow neutrophils, they also adhered better to fibrin and formed more NETs when adhered to fibrin or poly-l-lysine than Ly6CHigh neutrophils, suggesting that they can also contribute to vascular occlusion (Extended Data Fig. 10h–i,k,n). Together, our data support a model in which the Ly6CLow neutrophils do not extravasate but attach to fibrin or exposed basal membrane components in the lumen of the tumour vasculature, interact with platelets and form NETs to ultimately cause a thromboinflammatory occlusion of the vessel.
Consistent with the effects of CXCL1 on the haematopoietic compartment and neutrophil heterogeneity, Cxcl1-knockout tumour-bearing mice showed a reduced percentage and number of circulating Ly6CLow neutrophils and, importantly, reduced primary tumour necrosis and lung metastasis (Extended Data Fig. 10o–r). These findings support the idea that Cxcl1 expressed by cancer cells is important for the appearance of Ly6CLow neutrophils and, furthermore, that Ly6CLow neutrophils regulate necrosis. Moreover, the number of Ly6CLow neutrophils was unchanged in dnTGFβR2 tumour-bearing mice compared with controls, as were other neutrophil markers (Extended Data Fig. 10s,t), suggesting that Ly6CLow neutrophils are upstream of TGFβ signalling in cancer cells.
Finally, we analysed publicly available scRNA-seq data from patients with breast cancer39. Although human cells do not express Ly6C, when we clustered the neutrophils, comparing their abundance in tumour versus blood samples (Fig. 4h), the Ly6CLow signature was enriched in one particular cluster (cluster 3; Fig. 4i, Extended Data Figs. 10u and 11a,b and Supplementary Table 13). This cluster was enriched in the blood but absent in the tumour (Fig. 4h), and showed reduced cellular extravasation pathways (Fig. 4j), suggesting reduced extravasation ability.
Extended Data Fig. 11. scRNA-seq analysis of TNBC patient blood and NET blockade.

a, Differentially expressed genes of the clusters shown in Fig. 4h (human TNBC scRNA-seq), showing the genes upregulated and downregulated in Cluster 3, with selected genes noted to the right. b, GO terms of the genes upregulated in cluster 3, as shown in Fig. 4h. c, LLC tumor growth over time in PAD4ΔN and PAD4WT mice. Line shows the non-linear least squares fit of the data. N = 5 mice per group. p = 0.048. d, Quantification of circulating immune cells in PAD4ΔN and PAD4WT mice 4 weeks after tumor implantation. N = 5 mice per group. e, Quantification of NETs (DAPI+, citH3+, MPO+) in tumors from PAD4ΔN and PAD4WT mice. N = 8 cleared tumor volumes from 4 mice per group. p < 0.0001. f, H&E staining of the lungs of PAD4ΔN and PAD4WT mice 2 weeks after i.v. injection of 5×10⁵ LLC cells (experimental metastasis model) and, g, quantification of the metastatic area, h, number of metastatic foci, and i, mean area of metastatic foci in the lungs of PAD4ΔN and PAD4WT mice subjected to experimental metastasis. N = 8 PAD4WT and 7 PAD4ΔN mice. j, Representative micrograph of an LLC tumor 4 weeks after injection into PAD4WT or k, PAD4ΔN mice and stained for E-cadherin and vimentin. Representative of n = 3 mice per group. l, Quantification of circulating immune cells in mice treated with DNase I or vehicle. N = 4 mice per group. Neutrophils p = 0.0005, Monocytes p = 0.0149, % Ly6cLow p = 0.1003. m, Representative H&E images (left) and quantification of necrosis (right) showing that daily treatment with DNase I reduced 4T1 tumor necrosis (yellow dashed line). N = 10 mice per group. p = 0.0372. n, Representative H&E staining and o, quantification of metastasis as percentage of total lung area of 4T1 tumor-bearing mice treated with DNase I or vehicle control. N = 9 control and 10 DNase I treated mice. p = 0.0441. Bars show mean + s.e.m. *P < 0.05, ***P < 0.001, as determined by unpaired two-tailed Student’s t-test in (d, e, g, h, i, l, m, o) or two-way ANOVA in (c). P-value in (b) calculated using a Fisher’s cumulative hypergeometric probability with multiple testing correction (using gProfiler).
Blocking NETs reduces necrosis and metastasis
NETs induce vascular occlusion in several diseases9,40,41 including cancer42. Given that Ly6CLow neutrophils were vascular restricted and more prone to form NETs, and that NETs were present in the intravascular aggregates blocking blood flow, we hypothesized that the intravascular release of NETs could drive vascular occlusion (and subsequent pleomorphic necrosis) in the primary tumour.
To test this hypothesis, we generated mice deficient in protein-arginine deiminase 4 (PAD4; which is key for NET formation43) in neutrophils (MRP8Cre;Padi4fl/fl (hereafter, ‘PAD4ΔN’) mice). We transplanted LLC cancer cells into PAD4ΔN or PAD4WT mice (Cre-negative littermates) and analysed the tumours after 4 weeks. PAD4ΔN mice showed slightly smaller tumours, but no major changes in circulating immune cells, and their tumours were still infiltrated by neutrophils, but showed no citrullinated NETs, consistent with Pad4 deletion (Extended Data Fig. 11c–e). Consistent with a loss of vasculature-damaging NETs, tumours of PAD4ΔN mice showed no vasculature loss in neutrophil-enriched areas, in contrast to tumours of PAD4WT mice (Fig. 5a). Of note, by both gross appearance and histology, tumours of similar size and growth rate showed almost no necrosis in PAD4ΔN mice but up to 60% necrosis in PAD4WT mice (Fig. 5b–d). These data demonstrate that citrullinated NETs are critical for pleomorphic necrosis formation and that tumour necrosis is not necessarily a passive byproduct of tumour growth. When we analysed lung metastasis, we found that in PAD4ΔN mice, the metastatic burden and number of metastatic foci were significantly reduced, whereas the mean size of the metastatic foci was similar (Fig. 5e–h). This suggests that the absence of NETs affected dissemination or cancer cell seeding to the lungs, but did not impair growth upon seeding. We next used an experimental metastasis model, i.v. injecting LLC cells, to analyse the seeding of cancer cells that had already reached the vasculature. We found no differences in metastatic area, number of foci or average lesion size (Extended Data Fig. 11f–i). Hence, the reduction in metastasis that we found (Fig. 5e) was probably due to fewer cancer cells being released from the primary tumour in PAD4ΔN mice.
Fig. 5. Pleomorphic necrosis formation is not passive and requires NET formation.

a, Representative images (left) of cleared LLC tumours from PAD4WT (able to form citrullinated NETs) and PAD4ΔN mice (unable to form citrullinated NETs), showing lack of citrullinated NETs (DAPI+, citH3+ and MPO+) and no loss of vasculature (CD31; quantified on the right) in neutrophil-rich (MPO) areas in tumours from PAD4ΔN compared with PAD4WT mice (the arrow points to neutrophil-rich, NET-rich, avascular necrotic region). n = 8 volumes from 4 mice per group. P = 0.0042. b, Examples of gross appearance of LLC tumours from PAD4WT and PAD4ΔN mice, showing that necrosis depends on NET formation. c, Representative midline sections of LLC tumours from PAD4WT or PAD4ΔN mice stained with H&E. d, Quantification of the necrotic area of the H&E-stained tissues. n = 8 PAD4WT and n = 9 PAD4ΔN mice. P = 0.0025. e–g, Quantification of lung metastasis showing reduced metastatic area (e; P = 0.0095), absolute number of metastatic foci (f; P = 0.0144) and no differences in mean area of individual metastatic foci (g) in PAD4WT and PAD4ΔN LLC tumour-bearing mice. n = 19 mice per group. h, Representative H&E staining of the lungs quantified in panels e–g. i, Heatmap (bottom left) of the genes upregulated in cancer cells from necrotic PAD4WT mice compared with non-necrotic PAD4ΔN mice and Gene Ontology terms analysis (right) of those genes, showing that cancer cells in necrotic tumours upregulate pathways related to haematopoiesis, EMT, metabolism, migration and necrosis. The bars show mean + s.e.m. *P < 0.05 and **P < 0.01, as determined by unpaired, two-tailed Student’s t-test (a,d–g) or Fisher’s cumulative hypergeometric probability with multiple testing correction (i).
To determine whether the transcriptomic changes in perinecrotic regions (Fig. 3f) were due to the exposure of cancer cells to necrosis, we performed RNA-seq of LLC cancer cells isolated from non-necrotic tumours from PAD4ΔN mice and necrotic tumours from PAD4WT mice. The presence of tumour necrosis increased the expression of genes (including Cxcl1, Cxcl2, Ncam1 and Rhoq) belonging to several Gene Ontology terms related to metabolic changes, necrotic cell death (as expected), cell migration and EMT, again supporting that necrosis increases the metastatic potential of cancer cells (Fig. 5i and Supplementary Tables 14 and 15). Moreover, the levels of vimentin were increased and E-cadherin decreased in perinecrotic regions of LLC tumours in PAD4WT mice, but regions with cancer cells that had undergone EMT were absent in PAD4ΔN mice (Extended Data Fig. 11j–k). Thus, targeting NETs reduced necrosis and the activation of pro-metastatic transcriptomic programs in cancer cells. PAD4-independent NET formation has been reported44, so we also treated 4T1 tumour-bearing mice with DNase I as another approach to inhibit NETs45. DNase I increased the number of circulating neutrophils and monocytes, but the proportion of Ly6CLow neutrophils was unchanged (Extended Data Fig. 11l). Similar to PAD4 targeting, DNase I treatment reduced the extent of tumour necrosis and lung metastasis (Extended Data Fig. 11m–o).
We have recently showed that disulfiram, a pleiotropic FDA-approved drug, blocks NET formation in models of lung injury46, so testing the translational potential of our findings, we fed 4T1 tumour-bearing mice a disulfiram-containing or control diet. Disulfiram treatment reduced NET formation in the primary tumour, with no differences in primary tumour growth (Extended Data Fig. 12a–c). In addition, disulfiram-treated mice showed a slightly reduced number of neutrophils and monocytes in circulation, and no differences in HSPC populations in the bone marrow (Extended Data Fig. 12d,e). Disulfiram reduced necrosis, and the increased vimentin and decreased E-cadherin levels in 4T1 tumours from control mice were not observed in tumours of disulfiram-treated mice (Extended Data Fig. 12f–i). Furthermore, disulfiram-treated mice had reduced lung metastatic burden and fewer metastatic foci, with no effect on mean metastatic foci size (Extended Data Fig. 12j–m), supporting that inhibition of necrosis can reduce metastasis by reducing the release of cancer cells from the primary tumour.
Extended Data Fig. 12. NET blockade reduces necrosis in the primary tumor.

a, 4T1 tumor growth over time in wild-type BALB/c mice fed a control or disulfiram-containing diet from the moment of tumor implantation. Line shows the non-linear least squares fit of the data. N = 5 control diet mice and 9 disulfiram diet mice. p = 0.085. b, Representative micrographs showing that disulfiram treatment reduced the number of NETs formed in the tumors. c, Quantification of NETs in the cleared tumors from 4T1 tumor-bearing mice fed a control or disulfiram-containing diet (CTRL or DS, respectively), showing disulfiram reduces NET formation in the tumors. N = 6 volumes from 3 tumors per group. p = 0.0006. d, Quantification of circulating immune cells in 4T1-tumor bearing mice fed a control or disulfiram-containing diet (CTRL or DS, respectively), 6 weeks after tumor implantation. N = 5 mice per group. Neutrophils p = 0.0147. Monocytes p = 0.0296. e, Disulfiram treatment does not affect HSPCs in the bone marrow of 4T1 tumor-bearing mice. N = 5 mice per group. LKSs (Lineage-, cKit+, Sca1+). LT-HSCs (long term-hematopoietic stem cells). ST-HSCs (short term-hematopoietic stem cells). MPPs (multipotent progenitors). MPs (myeloid progenitors). CMPs (common myeloid progenitors). GMPs (granulocyte-monocyte progenitors). MEPs (megakaryocyte, erythrocyte progenitors). f, Representative H&E staining of midline tumor section used for the quantification (shown in panel f) of the response to pharmacological inhibition of NET formation using disulfiram in 4T1 mice (yellow dashed line outlines necrotic area). g, Quantification of the extent of necrotic tissue in 4T1 tumors from mice given disulfiram or control diets, showing that blocking NETs pharmacologically reduces necrosis. N = 8 mice per group. p = 0.0396. h-i, Representative micrograph of a 4T1 tumor after 6 weeks of growth in mice fed h, a control diet or i, a disulfiram diet and stained for E-cadherin (red) and vimentin (cyan). N = 3 mice per group. j, Representative images of H&E-stained sections of lungs from disulfiram or control diet, 4T1 tumor-bearing mice 6 weeks after tumor implantation. Representative of n = 11 mice per group. k, Quantification showing reduced metastatic area (p = 0.0476) and l, absolute number of metastatic foci (p = 0.0111), with m, no differences in the average area of individual metastatic foci (p = 0.4074) in the lungs of disulfiram-treated mice. N = 11 mice per group. n, Graphical abstract. The primary tumor, in part through CXCL1 expression (1), drives an expansion and a myeloid skew of the hematopoietic compartment and gives rise to a “vascular-restricted” neutrophil population (2) defined by a specific transcriptomic profile (of which Ly6CLow or CD11cHigh are mouse markers), that is inefficient in extravasation and has increased NET formation capacity. This increased neutrophil output from the bone marrow eventually reaches the tumor, where it encounters a poorly organized vascular network (with abnormal pericyte coverage and intraluminal exposition of extracellular matrix proteins), where neutrophils deploy NETs and aggregate (3). This, in turn, restricts the blood flow and causes necrosis of the downstream vascular bed, giving rise to a spatially distinct form of necrosis that we termed “pleomorphic necrosis”, which is different from the classical/central core necrosis (4). In the regions adjacent to overt necrosis (i.e., the peri-necrotic regions), the tumor cells are subjected to hypoxic conditions. Cancer cells in peri-necrotic regions respond by engaging transcriptomic programs that enhance their migratory and invasion potentials, driving an EMT phenotype, leading to increased metastasis (5). Bars show mean + s.e.m. *P < 0.05, ***P < 0.001, ns, not significant, as determined by two-way ANOVA (a) or unpaired two-tailed Student’s t-test (c, d, e, g, k-m).
Discussion
In summary (Extended Data Fig. 12n and Supplementary Video 19), we propose that the primary tumour, partly through Cxcl1 expression, drives an expansion and myeloid skew of the haematopoietic compartment and gives rise to a vascular-restricted neutrophil subpopulation (vrPMNs), defined by a particular transcriptomic profile (of which Ly6CLow and CD11cHigh are two mouse cell-surface markers), that is inefficient in extravasation and has increased NET formation capacity. The Ly6CInt neutrophil subpopulation showed an intermediate phenotype between Ly6CLow and Ly6CHigh neutrophils in most of our assays and may also have a role in driving necrosis. In the primary tumour, the increased neutrophil output from the bone marrow encounters abnormal vascular network in which neutrophils aggregate, possibly in response to luminally exposed basal membrane components and fibrin deposition. Then, neutrophils probably enter a feed-forward loop of NET formation, NET-driven vascular damage, platelet activation, neutrophil recruitment and further NET formation, similar to what has been described in NET-driven thrombosis9,41. This step, in turn, restricts blood flow and causes necrosis of the downstream vascular bed, giving rise to a necrotic architecture that we termed pleomorphic necrosis, different from a classical/central necrotic core architecture. We confirmed pleomorphic necrosis in breast cancer 4T1 (orthotopic), lung cancer LLC (subcutaneous) and breast cancer C3(1)-Tag (genetically engineered) mouse models across different genetic backgrounds, as well as in breast cancer samples from humans. In the regions adjacent to overt necrosis (that is, the perinecrotic regions), cancer cells are in a hypoxic environment, which is known to induce EMT47. Cancer cells respond by engaging transcriptomic programs that enhance their migratory and metastatic potentials, including increased TGFβ-related pathways, driving EMT and leading to increased metastasis. Of note, latent TGFβ can be activated by NETs48, which are abundant in the vicinity of perinecrotic cells. Our findings complement recent literature showing that metastasis can start from the tumour interior49 and is promoted by tumour necrosis, for example, via ANGPTL7 expression20. It is likely that the intricate architecture of pleomorphic necrosis greatly increases the volume of adjacent perinecrotic tissue (Extended Data Fig. 4a), thus promoting metastasis by driving EMT in a larger number of cells than would a classical central necrotic architecture. Although there is currently no completely specific method for targeting NETs, we targeted NET formation via three orthogonal and well-established approaches43,45,46 (conditional neutrophil Pad4 deletion or treatment with DNase I or disulfiram). The fact that all three methods reduced tumour necrosis and decreased lung metastasis critically demonstrates that tumour necrosis can be targeted to reduce metastasis and offers compelling support for a critical role of NETs in the process.
The distinct intravascular location of vrPMNs is probably a key feature of this population in relation to pleomorphic necrosis. Neutrophils are known to be able to dynamically modulate their migratory ability, as exemplified by the circadian changes in their migratory patterns32, as well as in their NET formation ability33. We found NETs deployed in the necrotic regions of primary tumours, even in the cancer model without pleomorphic necrosis. Yet, only in the models showing pleomorphic necrosis were NETs found inside the tumour vasculature. Therefore, the particular location where neutrophils are located or where NETs are deployed, and not merely their presence or absence, must be carefully analysed. For example, neutrophil-rich niches have been found to contain metastasis-seeding subclones in a lung cancer study50, and another study has found neutrophils interacting with cancer and endothelial cells in higher-grade histological pattern lung cancer—a spatial relationship that might represent neutrophils promoting cancer cell intravasation and metastasis51.
Our data add to a growing body of literature showing that the haematopoietic compartment responds centrally to different insults, including cancer, by altering the myeloid compartment and neutrophil behaviour. Several important questions remain, including whether vrPMNs appear under physiological conditions or in diseases other than cancer, and if so, what their physiological role is.
Finally, the appearance of vrPMNs in cancer could contribute to the abnormally elevated levels of thrombosis found among patients with cancer8 and should be carefully studied. In fact, the relationship between cancer and thrombosis is clinically very relevant, as thromboembolic events are one of the main causes of death in patients with cancer52 and in patients who have been successfully treated for cancer53.
Methods
Mice
All mice were housed in animal facilities at Cold Spring Harbor Laboratory (CSHL), with food and water available ad libitum and in a 12 h–12 h light–dark regime, and were used at 7–14 weeks of age. BALB/c mice (BALB/cAnNCrl) were obtained from Charles River. C57BL/6 mice were obtained from The Jackson Laboratory. LysM–eGFP mice were originally provided by M. Looney (University of California, San Francisco). MMTV-PyMT mice were purchased from The Jackson Laboratory. The C3(1)-Tag mice were originally obtained from The Jackson Laboratory and bred in-house. PAD4ΔN mice were generated in-house by crossing Mrp8Cre mice (B6.Cg-Tg(S100A8-cre,-eGFP)1Ilw/J) with Padi4fl/fl mice and were compared with Cre-negative Padi4fl/fl littermates. NSG mice were purchased from The Jackson Laboratory. Neutropenic mice were generated in-house by crossing Lyz2Cre mice with Mcl1fl/fl mice, both purchased from The Jackson Laboratory. All mice were acclimated to the animal housing facility for at least 1 week before initiating experiments. No specific randomization method was followed in this study. No statistical methods were used to predetermine sample size: they were determined based on prior experience or pilot experiments performed in the Egeblad lab. Allocation of mice to groups ensured similar distribution of age and gender. Unless especified in the corresponding method, no specific blinding method was used.
All procedures were approved by the CSHL Institutional Animal Care and Use Committee and were conducted in accordance with the NIH’s Guide for the Care and Use of Laboratory Animals.
Tumour models
PyMT cancer cells for orthotopic implantation were isolated from the primary tumours of MMTV-PyMT mice (C57BL/6 background). Tumours were mechanically dissociated and digested for 1 h with collagenase/hyaluronidase (10X, StemCell Technologies) containing DNase I (2 U ml−1; Roche) in Roswell Park Memorial Institute (RPMI)-1640 medium supplemented with 5% fetal bovine serum (FBS) (VWR Life Science Seradigm). Debris was removed by pulse centrifugation in Hanks’ balanced salt solution (HBSS) supplemented with 5% FBS. Purified carcinoma organoids were further dissociated into a single-cell suspension in 0.05% trypsin with 0.1% EDTA supplemented with 2 U ml−1 of DNase I for 2–3 min. Single cancer cells were isolated by passing through a 100-µm cell strainer (BD Biosciences), washed with PBS, and immediately injected into the fourth mammary fat pads of anaesthetized C56BL/6 mice (2 × 10⁵ cells per fat pad in 20 ml 1:1 PBS:Matrigel) to obtain the transplanted PyMT tumours. For the 4T1 tumour model, 5 × 10⁴ 4T1 cells were transplanted into the fourth mammary fat pads of anaesthetized BALB/c mice. For the LLC model, 1 × 10⁵ LCC cells were subcutaneously injected into the shaved flanks of anaesthetized C57BL/6 mice. The C3(1)-Tag tumour model is a spontaneous genetic model in the FVB/n background that develops tumours that were analysed when the mice reached 22–26 weeks of age. Mice were bred and monitored for tumours. All cell lines were tested negative for Mycoplasma, as well as Corynebacterium, Ectromelia, EDIM, Hantaan, K virus, LCMV, LDEV, MAC1, MAV2, mCMV, MHV, MNV, MTV, MKPV, MVM, MPV, Polyoma, PVM, REO3, Sendai and TMEV.
TdTomato-expressing LLC tumour model
We generated tdTomato-expressing tumour cells using the third-generation lentivector pLenti6-EF1a-tdTomato-IRES-Blasti (provided by D. Plenker). After transduction, cells were selected with blasticidin, and tdTomato expression was confirmed by confocal microscopy.
Cxcl1-knockout 4T1 cells
Cxcl1 gene editing in 4T1 cells was done using a third-generation lentivector pLenti6-EF1a-Cas9-blasticidin-U6-guide RNA (provided by T. Zillinger). Single guide RNAs (sgRNAs) were designed using the E-CRISP design tool provided by the German Cancer Research Center and introduced into pLenti6-EF1a-Cas9-blasticidin-U6-guide RNA by Gibson assembly using the following sgRNA sequences: sg1 Cxcl1 – GCGCTGCACAGAGAAGCGAG, sg2 Cxcl1 – GCAGAGGTGTCCCCAAGTAA. Empty vector controls were transduced with the lentivector. After transduction of 4T1 cells and selection with blasticidin (5 µg ml−1), knockout cells were verified by Sanger sequencing. To confirm the depletion, we checked CXCL1 levels in culture supernatants using the Mouse CXCL1/KC DuoSet ELISA from R&D Systems (DY453) according to the manufacturer’s instructions.
dnTGFβR2-expressing 4T1 cells
dnTGFβR2-expressing 4T1 tumour cells were generated using the lentivector pLenti-CMV-Blast-DNTGFBR2-HA, which was from G.-P. Dotto27 (Addgene plasmid #130888) or a pLenti-CMV-Blast-DEST backbone for the control 4T1 cells. After transduction, cells were selected with blasticidin.
Flow cytometry and cell sorting
Flow cytometric analyses were performed using a Fortessa Analyzer (BD Biosciences) using BD Diva Software v8. The analysis was performed using FlowJo v10 (Tree Star Inc.). Cell sorting experiments were performed using a fluorescence-activated cell sorting (FACS) Aria cell sorter (BD Biosciences). All analyses were conducted at the Flow Cytometry Shared Resource at CSHL. Absolute quantification was done using Trucount absolute counting beads (340334, BD Biosciences) according to the manufacturer’s instructions.
Neutrophils were isolated from blood by FACS. In brief, blood was drawn into EDTA-coated tubes, red blood cells were lysed in ammonium–chloride–potassium (ACK; A1049201, Gibco) lysis buffer (Thermo Fisher), and blood cells were stained with antibodies to Ly6G, Ly6C and CD11b (Supplementary Fig. 1, immune panel). Immediately before flow cytometric analysis, DAPI was added to the cells. Then, DAPI−, CD11b+ and Ly6GHigh neutrophils were sorted. For some experiments, from this neutrophil population, Ly6CHigh and Ly6CLow neutrophils were sorted.
Cytometric analyses of blood and tissues from naive and tumour-bearing mice were performed as previously reported13. In brief, tissues (tumour, bone marrow, liver, lung and spleen) were extracted, kept in cold PBS (except liver, kept at room temperature in HBSS) and processed immediately upon collecting all samples. The lungs and tumours were digested in HBSS with liberase (1 U ml−1, Roche) and DNase I (1 mU ml−1, Sigma) for 30 min at 37 °C. The bone marrow and spleen were mechanically dissociated to prepare single-cell suspensions by flushing and straining, respectively. Leukocytes in the liver were enriched by centrifugation at 800g for 30 min, using a 36% Percoll (GE Healthcare; diluted in HBSS) gradient. Blood counts were analysed in an automated haemocytometer, and red blood cells were lysed in ACK hypotonic buffer. Single-cell suspensions from all tissues were incubated with fluorescently conjugated antibodies from the haematopoietic panel (bone marrow and spleen) or from the immune panel (all tissues). See Supplementary Fig. 1 for antibodies used for flow cytometry. Unbiased flow cytometric analysis tools54 were used for the data on Extended Data Fig. 9d–h.
Ex vivo NET formation assays with mouse neutrophils
Neutrophils were sorted as described above, and 4 × 10⁴ neutrophils were plated in serum-free RPMI medium on poly-l-lysine-covered 8-well μ-slides (Ibidi), then left for 30 min at 37 °C in a cell culture incubator to adhere. Cells were plated in a drop of medium in the centre of the well to enhance their adhesion to the central area of the well and to avoid their deposition at the edges. Cells were subsequently incubated for 2 h with 100 nM PMA or vehicle. Cells were then fixed using 4% paraformaldehyde (PFA) in PBS for 10 min; blocked and permeabilized with PBS containing 0.1% Triton X-100, 25% FBS and 5% bovine serum albumin (BSA); and stained with antibodies to citH3 (Abcam) and MPO (R&D Systems) at 1:200 dilution in blocking buffer at 4 °C overnight. Then, the cells were washed and stained with secondary antibodies: donkey anti-goat AF647 (A21447, Invitrogen) and donkey anti-rabbit AF568 (A10042, Invitrogen) at 1:400 and counterstained with DAPI (1:1,000) for 2 h at room temperature. Z-stack images were acquired with a SP8 microscope (Leica) and analysed using Imaris (Bitplane) or custom-made ImageJ macros (see the section ‘Code availability’) to identify NETs (defined as triple co-localized MPO+, citH3+ and DNA (DAPI)+ and therefore citrullinated NETs).
Whole-mount immunostaining and tissue clearing
Mice were euthanized with CO2, and their tissues were immediately excised and submerged in 4% PFA in PBS and fixed at 4 °C overnight. After three washes with PBS for 1 h each at room temperature, the tissues were permeabilized in methanol (MetOH) gradients in PBS (PBS > MetOH 50% > MetOH 80% > MetOH 100%, for 30 min in each solution). Then, the tissues were bleached with Dent’s bleach (15% H2O2 and 16.7% dimethyl sulfoxide (DMSO) in MetOH) for 1 h at room temperature and rehydrated through descending methanol gradients in PBS (MetOH 80% > MetOH 50% > PBS, 30 min in each solution). Then, the tissues were incubated with a blocking buffer containing PBS with 0.3% Triton X-100, 0.2% BSA, 5% DMSO, 0.1% azide and 25% FBS overnight at 4 °C with shaking. Afterwards, the tissues were stained with primary antibodies (Supplementary Fig. 2) at 1:200 in blocking buffer for 3 days at 4 °C with shaking. After washing for 24 h in washing buffer (PBS with 0.2% Triton X-100 and 3% NaCl), the tissues were stained with secondary antibodies (Supplementary Fig. 2) at 1:400 for 3 days at 4 °C with shaking. Then, the tissues were washed for 24 h in washing buffer and thereafter dehydrated in MetOH gradients in dH20 using glass containers (MetOH 50% > MetOH 70% > MetOH 90% > 3× MetOH 100%, 30 min for each step). The tissues were then cleared for 30 min in 50% MetOH and 50% benzyl alcohol, benzyl benzoate (BABB, mixed 1:2) and for 1 h in 100% BABB and, finally, imaged on an SP8 microscope (Leica, typical Z-depths of 300–500 µm). Quantification was performed with Imaris software (Bitplane).
In some cases, when we needed to preserve endogenous fluorescence, we changed our clearing procedure and used clear, unobstructed brain imaging cocktails and computational analysis (CUBIC), a different tissue clearing protocol technique that maintains the endogenous fluorescence from fluorescent proteins. Tissues were excised and fixed as stated above, and then soaked in CUBIC-I solution in a 15-ml conical tube. CUBIC-I was prepared by mixing 108 ml of ddH2O with 75 g of urea (U5128, Sigma), 75 g of N,N,N′,N′-tetrakis(2-hydroxypropyl)ethylenediamine (122262, Sigma) and 42 ml of Triton X-100 (X100, Sigma). Samples were maintained at 37 °C on a shaker for 7 days, with the media changed every other day or until clear. The samples were washed in PBS and then blocked and stained as described above for the BABB protocol, except no methanol and no DMSO were used. Once the staining was complete, the samples were placed back in CUBIC-I to clear and then were counterstained for DAPI in CUBIC-I (1:1,000) for 24 h and washed in CUBIC-I overnight. Images were acquired and analysed as described above.
Slide immunofluorescence staining
Tissues were sectioned at the CSHL Animal and Tissue Imaging Shared Resource. To stain formalin-fixed paraffin-embedded (FFPE) slides, paraffin sections were first deparaffinized and rehydrated, and antigen retrieval was carried out by boiling slides in Tris EDTA buffer (10 mM Tris base and 1 mM EDTA, pH 9.0) for 10 min in a pressure cooker. Then, the tissues were incubated with a blocking buffer containing PBS with 0.1% Triton X-100 and 0.2% BSA for 30 min at room temperature. The tissues were incubated with the corresponding primary antibodies (see Supplementary Fig. 2 for a list of antibodies used in this study) overnight at 4 °C. The next day, the samples were washed three times in PBS and stained with the corresponding secondary antibodies for 2 h at room temperature. Then, the samples were washed, counterstained with DAPI and mounted with antifade medium (ProLong Gold, P10144, Thermo Fisher). The 3D9 antibody to stain NETs in human tissues14 was provided by A. Zychlinsky.
Perfused or unperfused vessel identification
To visualize vessels perfused in vivo, we injected 50 μg of rhodamine-conjugated Griffonia simplicifolia lectin (RL-1102, Vector Laboratories) i.v. in 100 μl of sterile PBS for 3 h and again 10 min before euthanasia. Then, the tissues were immediately fixed, submerged in 4% PFA in PBS overnight and cleared as stated above. The vascular-specific lectin staining was independently confirmed by i.v. injecting 10 μg PE-conjugated vascular endothelial (VE)-cadherin (138106, BioLegend) in sterile PBS.
Immunofluorescence image quantification
Intravascular NETs were quantified in Bitplane Imaris. In brief, using the CD31 channel, a surface was generated that contained all of the vasculature and was used to mask the outside in the rest of the channels to quantify only intravascular events. Then, the triple colocalization of DNA, citH3 and MPO was used as the criterion to detect and quantify the NETs using Imaris spots.
To quantify the correlation between neutrophil aggregates and non-perfused vessels, we also used Imaris. In brief, a surface of perfused vessels (using i.v. injected lectin) and other of non-perfused vessels (CD31+lectin–) was generated. Then, the data type was set to 32 bit (float), and the distance transformation was calculated for both surfaces (A = perfused and B = non-perfused). Then, a new channel was generated using the formula A-B that yielded the intermediate regions (transition zones) between perfused and unperfused vessels. This new channel was used to generate a new surface (C = transition zones) that was used to mask the neutrophil channel (outside to zero). Finally, the number of neutrophil aggregates was calculated using the surfaces tool on that channel, with a minimum number of voxels of 100.
E-cadherin, vimentin and TGFβ in the slides were quantified using Imaris. In brief, a region of interest (ROI) was defined in perinecrotic and non-perinecrotic areas. Perinecrotic areas were defined as regions adjacent to necrotic areas up to 400 µm from the edge of necrosis (evaluated using nuclear morphology). Then, cells were detected using the DAPI signal, with a threshold (area over 200 μm2) to avoid smaller immune cells and only detect cancer cells, using the surfaces tool. Then, the per-cell intensities of the different channels were exported and used for quantification.
Imaging mass cytometry
Slides were cut from the FFPE blocks onto Superfrost Plus slides (Fisher Scientific). The slides were first baked for 2 h at 60 °C, dewaxed in xylene wash for 20 min and rehydrated in an alcohol gradient (100%, 95%, 80% and 70% EtOH in Maxpar water (Standard BioTools) for 5 min each). The slides were then washed with Maxpar Water for 5 min, then incubated in an Antigen Retrieval Agent (Cell Conditioning Solution CC1) at a temperature of 105 °C for 1 h. Slides were blocked with 3% BSA in Maxpar PBS for 45 min at room temperature in a hydration chamber. Selected antibodies were conjugated in-house, diluted to a concentration ranging from 0.25 mg ml−1 to 0.5 mg ml−1, then aliquoted for use. The slides were stained with the final antibody cocktail (Supplementary Fig. 3) overnight at 4 °C. Slides were subsequently washed with Triton-X100 in Maxpar PBS for 16 min, then washed in Maxpar PBS for 16 min. For DNA labelling, Cell-ID Intercalator-Ir (Fluidigm) was diluted at 1:400 in Maxpar PBS and used to stain for 30 min at room temperature in a hydration chamber. As a tissue counterstain, ruthenium tetroxide 0.5% stabilized aqueous solution (Polysciences) was diluted at 1:2,000 in Maxpar PBS and used for staining for 3 min. A final wash was performed in Maxpar Water for 5 min. Images were acquired with a Hyperion Imaging System (Standard BioTools) at the Sydney Kimmel Comprehensive Cancer Center Flow/Mass Cytometry and Technology Development Shared Resources. Following acquisition, stacks of multilayered ome.tiff images were exported, and representative images were generated utilizing MCD Viewer (Standard BioTools). Further analysis was performed using QuPath.
Intraluminal extracellular matrix component exposition assay
To visualize intraluminal exposition of extracellular matrix components in vivo, we i.v. injected 10 μg of antibodies against laminin (polyclonal anti-laminin antibody, ab11575, Abcam) into tumour-bearing mice. After 10 min of recirculation, mice were euthanized in CO2, and the tissues were immediately fixed, submerged in 4% PFA in PBS overnight and cleared as stated above (laminin was detected using a secondary antibody (Invitrogen; donkey anti-rabbit AF568) against the primary antibody; Supplementary Fig. 2).
Fibrin deposition assay
To analyse fibrin deposition in the primary tumour, we i.v. injected 15 mg kg−1 of fibrinogen conjugated to AF647 (F35200, Invitrogen) into tumour-bearing mice 24 h before euthanizing them and recovering the tissues. Then, the tissues were fixed and cleared using CUBIC-I (see the section ‘Whole-mount immunostaining and tissue clearing’).
Hypoxic region analysis
To visualize hypoxic regions in the tumours, we i.v. injected the tumour-bearing mice with 60 mg kg−1 of pimonidazole (part of the Hypoxyprobe-Biotin, HP10-1000kit, Hypoxyprobe) and waited 90 min, according to manufacturer’s instructions. After that, the mice were euthanized, and tissues were resected and immediately fixed using 4% PFA in PBS. Then, the samples were cleared (see the section ‘Whole-mount immunostaining and tissue clearing’) and stained using the reagents included in the kit.
Nuclear morphology analysis
To analyse nuclear morphology, sorted Ly6CHigh or Ly6CLow neutrophils were plated into an eight-well Ibidi μ-slide and allowed to adhere for 30 min at 37 °C. Then, the cells were fixed with 4% PFA in PBS for 10 min. The cells were stained for MPO and DAPI and imaged on an SP8 microscope (Leica). Finally, the number of nuclear lobes per cell was manually quantified using ImageJ (Fiji).
Chemotaxis assay
Chemotaxis assays were performed using Corning HTS transwell 24-well permeable supports (6.5 mm in diameter, pore size of 3 µm, Sigma) and Corning ultra-low attachment plates (Sigma). Either 600 µl of RPMI-1640 or RPMI-1640 containing 20 ng ml−1 CXCL1 (R&D Systems) was added to the lower chambers. The upper chambers were seeded with neutrophils (200 µl at 5 × 10⁶ cells per millilitre) and incubated for 2 h at 37 °C in 5% CO2. The transmigrated neutrophils were collected from the lower chamber and analysed using flow cytometry.
Neutrophil–platelet and neutrophil–neutrophil aggregation experiments
To analyse the ability of neutrophils to interact with platelets, we quantified the ratio of neutrophil–platelet aggregates in circulation for Ly6CHigh, Ly6CInt and Ly6CLow neutrophils by flow cytometry. In brief, blood was collected in EDTA tubes, RBC lysed, and stained for Ly6G, Ly6C and CD41 as described above. Then, the proportion of Ly6G+ neutrophils with CD41+ signal was calculated.
To analyse the ability of our neutrophil populations to aggregate (neutrophil–neutrophil aggregation), Ly6CHigh, Ly6CInt and Ly6CLow neutrophils were sorted as previously described55,56. One million neutrophils of each category were stained with CellTracker Green CMFDA (Invitrogen) as per the manufacturer’s instructions, and then resuspended in 1 ml of RPMI and brought to the flow cytometer. Then, fMLP (Tocris) was added to the neutrophils to a final concentration of 1 μM, and each tube was immediately captured undisturbed for 6 min. Then, the percentage of neutrophil multiplets (based on Ly6G–AF647 and CellTracker Green signal) was calculated at 1-min intervals using FlowJo.
EdU labelling and half-life calculation
Pulse labelling was performed with 50 mg kg−1 of EdU (BaseClick) intraperitoneally (i.p.) injected. Then, the percentage of EdU+Ly6G+ cells was determined at days 1, 3 and 5 after injection by flow cytometry according to the manufacturer’s instructions. The half-life of neutrophils in circulation was calculated as follows: the decay constant λ was calculated from the formula: Nt = Np × e(−λ × Δt), where Nt is the percentage at time t, Np is the percentage at peak, and Δt is the difference in hours between Np and Nt. Then, using the decay constant λ, the half-life ‘h’ was calculated using the formula: 1 = 2 × e(−λ × h).
Neutrophil adhesion to fibrin
Uncoated Ibidi μ-slide (eight-well) plates were coated with fibrin overnight as previously described57. In brief, 0.6 μg ml−1 of mouse fibrinogen (Innovative Research) + 5 U ml−1 mouse thrombin (Innovative Research) were added to the uncoated slides and incubated at 37 °C overnight in a humidified incubator. The excess thrombin was then washed with RPMI, and the slides were allowed to dry for 15 min. RBC-lysed blood from 4T1 tumour-bearing mice was then added to the fibrin-coated wells and incubated at 37 °C in 5% CO2 for 30 min and subsequently washed with PBS to remove non-adherent cells. Then, the adhered cells were incubated with 0.05% trypsin for 1 min to detach them from the plate and were analysed by flow cytometry. The proportions of Ly6CHigh, Ly6CInt and Ly6CLow neutrophils in the input blood were then compared with the proportions in the fibrin-adhered cells. In some experiments, neutrophils were incubated with 10 μg ml−1 of anti-CD11c (BE0038, BioXcell) or control (BE0091, BioXcell) antibodies for 5 min before plating. In other experiments, Ly6CHigh, Ly6CInt and Ly6CLow neutrophils sorted from 4T1 tumour-bearing mice were plated onto fibrin-coated μ-slides and after 30 min of adhesion were incubated with 100 nM PMA to induce NET formation. After 2 h, plates were then fixed in 4% PFA for 10 min and stained for NETs as previously described.
CXCL1 treatment of isolated HSPCs in vitro
HSPCs were enriched from the bone marrow cells of BALB/c mice with the EasySep Mouse Hematopoietic Progenitor Cell Isolation Kit (19856, StemCell Technologies). These HSPCs were grown in SFEM medium (StemSpan Serum-Free Expansion Medium, 09650, StemCell Technologies), 10% FBS, 20 ng ml−1 stem cell factor (78064.1, StemCell Technologies), 20 ng ml−1 Flt3-L (250-31L, PeproTech), with or without 30 ng ml−1 CXCL1 (453-KC-010, R&D Systems). Cells were cultured for 11 days, and the medium was changed every 3–4 days. At the end point, the cells were counted and analysed by flow cytometry as previously stated.
Zymosan-induced peritonitis to measure extravasation efficiency
Mice were i.p. injected with 1 mg of Zymosan (Sigma). After 2 h, we took blood samples and obtained the peritoneal lavage for cytometric analyses and cell counts. We compared the percentage of neutrophils in the peritoneum versus blood from each donor to estimate the migration efficiencies of the neutrophils (percentage in peritoneum to percentage in blood). In some experiments, mice were i.v. injected with 50 µg of anti-Ly6C (InVivoMAb anti-mouse Ly6C, BE0203, BioXcell) or isotype control antibodies (InVivoMAb rat IgG2a isotype control, BE0089, BioXcell) immediately before the i.p. injection of Zymosan.
NET inhibition with disulfiram in the diet
Gamma-irradiated Purina rodent chow diet (#5053) repelleted (as control) and Purina chow diet (#5053) with 1 g of disulfiram per kg of diet (experimental) were purchased from Research Diets. Mice were fed with the control or experimental diet ad libitum starting upon tumour implantation and for the duration of the experiment. We previously confirmed the inhibition of NET formation in independent experiments using a model of acute lung injury, as well as in the tumour-bearing mice, and we confirmed this inhibition in all of the experimental groups.
Injectable drug treatments
Mice bearing 4T1 tumours were treated with 16 mg kg−1 of dipyridamole (Sigma) i.p. once a day, 0.5 mg kg−1 of tirofiban (Sigma) i.p. twice a day, or 300 U of DNase I (Roche) i.p. once a day starting 1 week after tumour implantation and until end point at day 28 after implantation. Control animals were treated with their respective vehicles (PBS for tirofiban and DNase I, sesame oil for dipyridamole).
ROS quantification
To analyse ROS levels in circulating neutrophils, RBC-lysed blood was stained with 5 mM dihydroethidium (Thermo Fisher) for 20 min and stained with antibodies to Ly6G and Ly6C (Supplementary Fig. 1) for cytometric analysis.
Phagocytosis assay
To analyse the ability of neutrophils to phagocytose in vivo, tumour-bearing mice were i.v. injected with 100 μg of Alexa Fluor 488-conjugated Zymosan BioParticles (Z23373, Invitrogen). Two hours later, blood was withdrawn and prepared for flow cytometry as described above, and the number of AF488-containing neutrophils was quantified. In parallel, some of the blood was used for direct imaging to confirm internalization using a Leica SP8 confocal microscope.
Experimental metastasis model
We performed an experimental metastasis assay to test the homing and growing ability of LLC cells independently of shedding from the primary tumour. First, 5 × 10⁴ LLC cells were injected into the tail vein of PAD4WT or PAD4ΔN mice. Then, the mice were monitored for 2 weeks and euthanized at the end of the 2-week period. The lungs were excised and fixed overnight in 4% PFA in PBS and then sent to the CSHL Animal & Tissue Imaging Shared Resource for sectioning and H&E staining to quantify the metastatic burden (see the section ‘Quantification of H&E slides (metastasis and necrosis)’ below).
Quantification of H&E slides (metastasis and necrosis)
H&E lung or primary tumour slides from the different tumour-bearing mice were evaluated using QuPath software (v0.2.3) for quantitative pathology and bioimage analysis. The metastatic area in the lungs was calculated using multilayer perceptron (MLP-ANN) pixel classifier in QuPath trained to metastasis regions and compared with total lung area (excluding alveolar space). The necrotic area was similarly calculated using the MLP-ANN pixel classifier in QuPath trained to the necrotic regions and compared with the total tumour area (excluding adipose tissue, also trained in the classifier).
Intravital microscopy of the skin and laser injury
For intravital microscopy of the dermal microcirculation, the hair-removed (Veet) dorsal side of the ear of anaesthetized LysM–GFP mice was mounted on a custom-built support, and the ear was immersed in ultrasound gel and covered with a coverslip. Mice were then injected with antibodies to Ly6C (Ly6C–PE, BioLegend), and multiphoton imaging and laser ablation were performed as previously reported37 on an upright LaVision BioTec TrimScope (Bielefeld) equipped with a 16× water immersion objective, two lasers (Mai Tai and InSight, Spectra-Physics) and an optical parametric oscillator. The following Longpass Dichroic Beamsplitters (Chroma) were used to direct the signal towards photomultiplier tubes: T560LP, T665LPXXR and T495lxpr.
Intravital microscopy of LLC tumours
LysM–GFP mice were subcutaneously implanted with LLC tumours in the flank. Seven days after implantation, the mice were anaesthetized with inhaled isoflurane, the skin was carefully removed, and a transparent PDMS window was implanted as previously reported15. The mice were allowed to recover for 1 week, and then imaging was performed on the same LaVision system described above. To visualize neutrophil–platelet dynamics in the microvasculature in vivo, mice were injected with 0.5 μg of anti-CD41–PE antibodies (CD41–PE, BioLegend) and 50 μg of AF647-conjugated G. simplicifolia lectin to visualize blood vessels.
RNA-seq
Ly6CHigh and Ly6CLow neutrophils or TdTomato-expressing cancer cells from PAD4WT or PAD4ΔN mice were sorted as stated above. Then, total RNA was extracted using a Qiagen RNeasy Plus kit, according to the manufacturer’s instructions. We then measured the concentration of the total RNA using Qubit (Thermo Fisher) and an Agilent RNA 6000 Nano kit (5067-1511) to analyse its quality. Libraries were made using the Kapa mRNA Hyper prep protocol: the mRNA was captured with oligo-dT beads and then fragmented using heat and magnesium. The first cDNA strand was synthesized using random priming. Then, this step was followed by a combined second-strand synthesis and A-tailing, which converted the cDNA–RNA hybrid to double-stranded cDNA, incorporated dUTP into the second cDNA strand, and added dAMP to the 3′ ends of the resulting double-stranded cDNA. The next steps were Illumina adaptor ligation and then library amplification using high-fidelity, low-bias PCR. The strand marked with dUTP was not amplified, allowing strand-specific sequencing. As starting material, we used 100 ng of total RNA in 50 μl of DNase-free water. For fragmentation, we incubated the samples for 6 min at 85 °C (fragments of 300–400 bp). For PCR enrichment, we used 13 cycles. Quality control for the final libraries was done using Qubit (DNA HS assay) and Bioanalyzer (DNA HS assay), and then we pooled the samples and checked the final library using the Kapa qPCR. Sequencing was done using the Illumina NextSeq 500/550 Mid Output Kit v2.5 (approximately 24 million single-end 75-cycle reads for each sample).
Further analyses were performed using R 4.0.4 (‘Lost Library Book’) and Bioconductor 3.12. In brief, Gene Ontology terms were obtained with gProgileR, using a maximum P value of 0.05 and the false discovery rate (FDR) as the correction method. Lists of DESeq2-detected upregulated and downregulated genes (that is, the upregulated and downregulated gene signature of Ly6CLow neutrophils) were also analysed using gProgileR with the same settings. A reactome pathway analysis was performed using the enrichPathway function of the ReactomePA library, from the ENTREZ nomenclature (mapped with the mapIds function of the AnnotationDb library) of the same lists used for the Gene Ontology terms, with a q value and P value cut-off of 0.05 in both cases. Only pathways with an adjusted P value under 0.05 were kept. Volcano plots were represented using the EnhancedVolcano library, with a fold-change cut-off of 2 and a P value cut-off of 0.05. Reactome pathway clustering was performed using pathfinder: first, the run_pathfindR function was run on the reactome gene set using the same input lists as before. Then, we used the cluster_enriched_terms function to perform the actual clustering of the reactome pathways. Top genes were extracted with dplyr. The session used the following libraries: limma (3.46.0), edgeR (3.32.1), tximport (1.18.0), edgeR (3.32.1), sva (3.38.0), RColorBrewer (1.1-2), pheatmap (1.0.12), biomaRt (2.46.3), ggplot2 (3.3.3), gplots (3.1.1), ggfortify (0.4.11), NMF (0.23.0), cluster (2.1.1), fpc (2.2-9), plyr (1.8.6), dplyr (1.0.5), pvclust (2.2-0), ggrepel (0.9.1), amap (0.8-18), gProfileR (0.7.0), xtable (1.8-4), ggpubr (0.4.0), tidyr (1.1.3), DESeq2 (1.30.1), ReactomePA (1.34.0), stringr (1.4.0), Org.Hs.eg.db (3.12.0), pathfindR (1.6.1), CompGO (1.26), EnhancedVolcano (1.8.0) and GeneBook (1.0).
Computational analysis of cytometric data using FlowSOM
To analyse neutrophil heterogeneity using flow cytometry data, we used a computational analysis with the FlowSOM library using R 4.1.2 (‘Bid Hippie’). First, compensated data were cleaned (DAPI negative, single cells) and exported using FlowJo. Then, the data were loaded into R using the flowCore library, and all non-trivial, non-DAPI channels were used as marker columns. Then, a flowFrame was created, and from it, a FlowSOM object using the selected marker columns, using a 10 × 10 grid of clusters and automatic metaclustering. tSNE plots were computed using the Rtsne function. The final report was built using the FlowSOMmary function. The session used the following libraries: ggrepel (0.9.1), cytofkit2 (0.99.80), VGAM (1.1-6), reticulate (1.22), plyr (1.8.6), slingshot (2.2.0), TrajectoryUtils (1.2.0), princurve (2.1.6), uwot (0.1.11), Matrix (1.4-0), destiny (3.9.0), RColorBrewer (1.1-2), reshape2 (1.4.4), scales (1.1.1), dplyr (1.0.7), SingleCellExperiment (1.16.0), SummarizedExperiment (1.24.0), Biobase (2.54.0), GenomicRanges (1.46.1), GenomeInfoDb (1.30.1), IRanges (2.28.0), S4Vectors (0.32.3), BiocGenerics (0.40.0), MatrixGenerics (1.6.0), matrixStats (0.61.0), Rtsne (0.15), FlowSOM (2.2.0), igraph (1.2.10), flowCore (2.6.0), pheatmap (1.0.12), BiocManager (1.30.16), viridisLite (0.4.0) and ggplot2 (3.3.5).
scRNA-seq analyses of 4T1 and MMTV-PyMT tumours
We analysed the Gene Expression Omnibus (GEO) dataset GSE123366 for 4T1 (GSM3502134) and MMTV-PyMT (GSM3502136) cancer cells using R 4.1.2 (Bid Hippie). The datasets were subjected to quality control, and cells with mitochondrial transcripts above 10% were discarded (we used AnnotationHub to retrieve chromosomal localizations), as well as cells with a low number of detected features or low total counts (less than 10% of the mean). Then, counts were log normalized using the logNormCounts function, and both datasets were merged using the scMerge library. Cell annotation was performed using SingleR and the ImmGenData libraries. High-variable gene selection was performed with the getTopHVGs function, keeping all genes above the fit for the variance of the log-normalized expression values for each gene across all cells in the population, calculated with the modelGeneVar function. Principal component analysis (PCA) was then calculated using Scater, and elbow calculation using the PCAtools library was used to trim the principal components. The tSNE was calculated using the Scater library. Differential gene set activity for Gene Ontology terms between 4T1 and MMTV-PyMT cells was calculated for the Gene Ontology term aggregated data using the sumCountsAcrossFeatures function from the Scuttle library. Pseudobulk analyses were performed using DESeq2. Differentially expressed genes were defined as those with an adjusted P value under 0.05. Reactome pathway clustering was performed using pathfindr and the Reactome gene set. The session used the following libraries: DESeq2 (1.34.0), png (0.1-7), apeglm (1.16.0), reshape2 (1.4.4), magrittr (2.0), edgeR (3.36.0), Matrix.utils (0.9.8), enrichplot (1.14.1), ggpubr (0.4.0), GO.db (3.14.0), clusterProfiler (4.2.2), genesorteR (0.4.3), RColorBrewer (1.1-2), slingshot (2.2.0), TrajectoryUtils (1.2.0), princurve (2.1.6), scRNAseq (2.8.0), pathview (1.34.0), limma (3.50.0), dynamicTreeCut (1.63-1), dendextend (1.15.2), pheatmap (1.0.12), clustree (0.4.4), ggraph (2.0.5), msigdbr (7.4.1), kableExtra (1.3.4), scran (1.23.1), org.Mm.eg.db (3.14.0), AnnotationDbi (1.56.2), batchelor (1.10.0), dittoSeq (1.6.0), SingleR (1.8.1), scMerge (1.10.0), scater (1.22.0), scuttle (1.4.0), AnnotationHub (3.2.1), BiocFileCache (2.2.1), dbplyr (2.1.1), DropletUtils (1.14.2), RCurl (1.98-1.5), cowplot (1.1.1), scales (1.1.1), Matrix (1.4-0), forcats (0.5.1), stringr (1.4.0), dplyr (1.0.7), purrr (0.3.4), readr (2.1.2), tidyr (1.1.4), tibble (3.1.6), ggplot2 (3.3.5), tidyverse (1.3.1), SeuratObject (4.0.4), Seurat (4.1.0), SingleCellExperiment (1.16.0), SummarizedExperiment (1.24.0), GenomicRanges (1.46.1), GenomeInfoDb (1.30.1), IRanges (2.28.0), S4Vectors (0.32.3), MatrixGenerics (1.6.0), matrixStats (0.61.0), GEOquery (2.62.2), Biobase (2.54.0) and BiocGenerics (0.40.0).
scRNA-seq analyses of 4T1 and C3(1)-Tag tumours for hypoxic cells
We analysed the GEO dataset GSE123366 for 4T1 tumours (sample GSM3502134) and GEO data series GSE199515 for C3(1)-Tag tumours (samples GSM5974489 and GSM5974490). Quality control and annotation were performed as stated above. Only epithelial cells were kept for subsequent analysis. We calculated the Gene Ontology terms using the goana function of the limma library, keeping only those that were of the biological processes ontology, significant and not overly general (n ≤ 500). Then, using sumCountsAcrossFeatures, as stated above, we aggregated the data by Gene Ontology term and used the term ‘response to hypoxia’ (GO:0001666) to split the cells into two groups: hypoxic cells, that is, those expressing values higher than the median of the total population for the ‘response to hypoxia’ term, and normoxic cells, those expressing values lower than the median. PCA was then calculated using Scater and trimmed using the elbow calculation of the PCAtools library. tSNE was calculated using the Scater library. Marker genes upregulated in both categories were identified using the findMarkers function of the Scran library and the Wilcoxon rank-sum test, keeping those with an FDR under 0.05. Heatmaps of those marker genes were plotted using the plotMarkerHeat function of the genesorteR library. Category terms from these markers were calculated using the goana function as stated above, and Gene Ontology terms were plotted using ggplot2, showing only those with an adjusted P value under 0.0000001. Reactome pathways were calculated using the ReactomePA library, using the same gene marker lists, with a P and q value cut-off of 0.05, and keeping only those pathways with an adjusted P value under 0.05. The session used the following libraries: ReactomePA (1.38.0), pathfindR (1.6.3), pathfindR.data (1.1.2), CompGO (1.28.0), RDAVIDWebService (1.26.0), GOstats (2.60.0), Category (2.60.0), graph (1.72.0), DESeq2 (1.34.0), png (0.1-7), apeglm (1.16.0), reshape2 (1.4.4), magrittr (2.0.1), edgeR (3.36.0), Matrix.utils (0.9.8), enrichplot (1.14.1), ggpubr (0.4.0), GO.db (3.14.0), clusterProfiler (4.2.2), genesorteR (0.4.3), RColorBrewer (1.1-2), slingshot (2.2.0), TrajectoryUtils (1.2.0), princurve (2.1.6), scRNAseq (2.8.0), pathview (1.34.0), limma (3.50.0), dynamicTreeCut (1.63-1), dendextend (1.15.2), pheatmap (1.0.12), clustree (0.4.4), ggraph (2.0.5), msigdbr (7.4.1), kableExtra (1.3.4), scran (1.23.1), org.Mm.eg.db (3.14.0), AnnotationDbi (1.56.2), batchelor (1.10.0), dittoSeq (1.6.0), SingleR (1.8.1), scMerge (1.10.0), scater (1.22.0), scuttle (1.4.0), AnnotationHub (3.2.1), BiocFileCache (2.2.1), dbplyr (2.1.1), DropletUtils (1.14.2), RCurl (1.98-1.5), cowplot (1.1.1), scales (1.1.1), Matrix (1.4-0), forcats (0.5.1), stringr (1.4.0), dplyr (1.0.7), purrr (0.3.4), readr (2.1.2), tidyr (1.1.4), tibble (3.1.6), ggplot2 (3.3.5), tidyverse (1.3.1), SeuratObject (4.0.4), Seurat (4.1.0), SingleCellExperiment (1.16.0), SummarizedExperiment (1.24.0), GenomicRanges (1.46.1), GenomeInfoDb (1.30.1), IRanges (2.28.0), S4Vectors (0.32.3), MatrixGenerics (1.6.0), matrixStats (0.61.0), GEOquery (2.62.2), Biobase (2.54.0) and BiocGenerics (0.40.0).
scRNA-seq and analyses of 4T1 tumours for TGFβ communication patterns
We performed CITE-seq of dissociated 4T1 tumours. Tumours were digested as previously stated, sorted for viability and stained with TotalSeq-B Mouse Universal Cocktail, V1.0 (199902, BioLegend), TotalSeq-B0109 anti-mouse CD16/32 antibody (101345, BioLegend) and TotalSeq-B0301-5 anti-mouse Hashtag 3 (BioLegend), all according to the manufacturer’s instructions. Samples were then used as input into the Chromium 3′ single-cell kit for feature barcoding (PN-1000121, 10X Genomics). Libraries were prepared according to manufacturer’s instructions (CG000206, User Guide) and sequenced to 29,000 mean reads per cell for the gene expression library and 16,000 reads per cell for the multiplexing and feature barcoding libraries on a NS2000 P2 flow cell. Data were mapped using Cell Ranger v7.1.0 to the mouse genome (mm10-2020-A – 10X Genomics) in multi-mode. We analysed the data using R v4.3.3 (‘Angel Food Cake’). Quality control and annotation were performed as stated above. Cell identities were assigned using SingleR and the Immunological Genome Project cell-type reference. Then, we used the CellChat (v1.6.1) library to analyse the cell–cell communication patterns. We filtered out the cell–cell communication patterns involving fewer than 10 cells in the dataset. We then plotted the abundance of genes in the TGFβ signalling pathway and used the function netAnalysis_signalingRole_scatter to plot a scatterplot of the incoming–outgoing interaction strengths for the TGFβ signalling pathway.
scRNA-seq analyses of tumours from patients with breast cancer
To analyse the presence of neutrophils showing the Ly6CLow signature in patients with breast cancer, we used the dataset available with GEO accession number GSE114727. We performed quality control, and cells with mitochondrial transcripts above 10% were discarded (we used AnnotationHub to retrieve chromosomal localizations), as well as cells with a low number of detected features or low total counts (less than 10% of the mean). Then, counts were log normalized using the logNormCounts function, and datasets were merged using the scMerge library. Cell annotation was performed using the SingleR library and the HumanPrimaryCellAtlasData() function of the Celldex library. Batch correction was performed using the batchelor library, and then we kept only the neutrophils for subsequent analyses. High-variable gene selection was performed with the getTopHVGs function, keeping all genes above the fit for the variance of the log-normalized expression values for each gene across all cells in the population, calculated with the modelGeneVar function. PCA was then calculated using Scater and trimmed using the elbow calculation of the PCAtools library. tSNE was calculated using the Scater library. Clustering was done using k-means, and the number of centres was computed using the clusGap and maxSE functions of the cluster library. Cluster-specific genes were detected using the findMarkers function of the scran library, using the Wilcoxon rank-sum test, and keeping those with an FDR under 0.05. Category terms from these markers were calculated using the goana function from the limma library. Pseudotime analyses were conducted with slingshot, with no pre-determined starting cluster. The Ly6CLow neutrophil signature generated earlier in our mouse RNA-seq study (Fig. 4b and Supplementary Table 10) was then converted to human homologue genes using biomaRt, the getLDS function, and the mouse (mmusculus_gene_ensembl) and human (hsapiens_gene_ensembl) datasets. Then, the signature genes present in the dataset were used in the sumCountsAcrossFeatures function to aggregate the expression of the signature genes across cells and compare the expression of the Ly6CLow neutrophil signature in the different clusters. The session used the following libraries: cluster (2.1.2), celldex (1.4.0), data.table (1.14.2), enrichplot (1.14.1), ggpubr (0.4.0), GO.db (3.14.0), clusterProfiler (4.2.2), genesorteR (0.4.3), RColorBrewer (1.1-2), slingshot (2.2.0), TrajectoryUtils (1.2.0), princurve (2.1.6), scRNAseq (2.8.0), pathview (1.34.0), limma (3.50.0), dynamicTreeCut (1.63-1), dendextend (1.15.2), pheatmap (1.0.12), clustree (0.4.4), ggraph (2.0.5), msigdbr (7.4.1), kableExtra (1.3.4), scran (1.23.1), org.Hs.eg.db (3.14.0), AnnotationDbi (1.56.2), batchelor (1.10.0), dittoSeq (1.6.0), SingleR (1.8.1), scMerge (1.10.0), scater (1.22.0), scuttle (1.4.0), AnnotationHub (3.2.1), BiocFileCache (2.2.1), dbplyr (2.1.1), DropletUtils (1.14.2), RCurl (1.98-1.5), cowplot (1.1.1), scales (1.1.1), Matrix (1.4-0), forcats (0.5.1), stringr (1.4.0), dplyr (1.0.7), purrr (0.3.4), readr (2.1.2), tidyr (1.1.4), tibble (3.1.6), ggplot2 (3.3.5), tidyverse (1.3.1), SeuratObject (4.0.4), Seurat (4.1.0), SingleCellExperiment (1.16.0), SummarizedExperiment (1.24.0), GenomicRanges (1.46.1), GenomeInfoDb (1.30.1), IRanges (2.28.0), S4Vectors (0.32.3), MatrixGenerics (1.6.0), matrixStats (0.61.0), GEOquery (2.62.2), Biobase (2.54.0), BiocGenerics (0.40.0) and biomaRt (2.50.3).
Spatial transcriptomic analysis of 4T1 tumours
FFPE tissue blocks were cut down to approximately 6.5 mm × 6.5 mm in size and sectioned onto the capture areas of the Visium slide according to 10X Genomics Tissue Preparation Guide CG000408. Slides were then deparaffinized and H&E-stained according to the 10X Genomics Demonstrated Protocol CG000409 and imaged at the Animal & Tissue Imaging Core Facility at CSHL.
After imaging, the tissue was decrosslinked, and probe hybridization with the Visium Mouse Transcriptome Probe Kit (PN-1000365, 10X Genomics) was performed overnight at 50 °C. Probe ligation, probe release and extension, and library preparation were performed according to the manufacturer’s instructions, and final libraries were sequenced on a NextSeq 500 System (Illumina) to target 20,000 reads per spot. Sequencing data were processed with Space Ranger v2.0.0 (10x Genomics).
Further analyses were performed using R (4.2.0) and the Giotto library. In brief, the four sequenced tissues were combined in a Giotto object that was subsequently normalized using the normalizeGiotto function. We next calculated highly variable features; harmonized the datasets (using the runGiottoHarmony function); and further calculated the nearest network, Leiden clusters and spatial networks using Giotto. Unbiased clusters based on transcriptomic data were then assigned to necrotic, perinecrotic or non-necrotic regions of the tissue based on visual inspection of the clusters and the H&E staining. Cluster markers were detected using the ‘scran’ method of the findMarkers_one_vs_all function from Giotto, and Gene Ontology term analyses were performed using gprofiler2 using the cluster markers detected by the findScranMarkers Giotto function, combining all perinecrotic clusters and comparing them with all non-necrotic clusters. Fold change was subsequently used to define the upregulated and downregulated genes, which were subjected to Gene Ontology term analysis using gprofiler2. For the resolution enhancement used in the plots of individual genes in Fig. 3e and Extended Data Fig. 5k, we used BayesSpace. To compute spatial pathway enrichment, we used GOfuncR to query the genes in particular Gene Ontology terms and then used the Gene Ontology-associated genes for PAGE (parametric analysis of gene set enrichment) score. The session used the following packages: gprofiler2 (0.2.1), enhancedvolcano (1.14.0), ggrepel (0.9.1), ggpubr (0.4.0), ggplot2 (3.3.6), BayesSpace (1.6.0), SingleCellExperiment (1.18.0), GOfuncR (1.16.0) and Giotto (2.0.0.998).
Spatial transcriptomic analysis of NSCLC
To analyse the spatial relationship between neutrophils and cancer cells using spatial transcriptomics, we analysed a public domain NSCLC26 dataset using the provided Giotto object in R (v4.2.0 ‘vigorous calisthenics’). We first normalized the dataset using the normalizeGiotto function (with log normalization, library size normalization, and feature and cell scaling). We next calculated highly variable features, the nearest network, Leiden clusters and spatial networks using Giotto, and we identified genes with spatially coherent expression profiles using binSpect (method set as k-means). We then found the genes associated with the proximity to other cell types using the findICF() function (with the scaled values and Delaunay network, clustered by cell type and using the Wilcoxon rank-sum test, with a minimum of 20 unique and interacting cells, and FDR as the adjustment method, for 100 permutations). From the list, we selected the interaction changing genes of tumour cells interacting with neutrophils and used that list to analyse the associated Gene Ontology terms with the goana library. Finally, we plotted the results using ggplot2. The session used the following libraries: limma (3.52.0), scran (1.24.0), scuttle (1.6.0), SingleCellExperiment (1.18.0), SummarizedExperiment (1.26.1), GenomicRanges (1.48.0), GenomeInfoDb (1.32.1), MatrixGenerics (1.8.0), matrixStats (0.62.0), org.Hs.eg.db (3.15.0), AnnotationDbi (1.58.0), IRanges (2.30.0), S4Vectors (0.34.0), Biobase (2.56.0), BiocGenerics (0.42.0), ggplot2 (3.3.6) and Giotto (2.0.0.9021).
Human samples
We identified patients (female, mean of 56 years of age) with newly diagnosed stage I–III TNBC from electronic medical records in the Northwell Health system. We excluded patients with active or a previous history of malignancies (except for treated localized skin malignancies); those who had previously had any systemic therapies, including chemotherapy, hormonal therapy, molecular-targeted therapy and/or immunotherapies, for any reason before sample collection through core needle biopsy; those who had an active infection, uncontrolled rheumatological problems or known deep vein thrombosis or pulmonary embolism at the time of biopsy; and those who were or had been on systemic steroids and/or non-steroidal anti-inflammatory drugs within 30 days before biopsy. Archival FFPE tissue samples were identified by a breast pathologist at Northwell Health. This study was approved by the Institutional Review Board (protocol number: 21-0064) at Feinstein Institutes for Medical Research Northwell Health, and a waiver of informed consent was granted based on the retrospective nature of the study.
Analysis of MRI data from tumour necrosis in patients with breast cancer
Patient imaging and metadata were taken from the Duke-Breast-Cancer-MRI8 dataset12 deposited in the Cancer Imaging Archive. We included the first 200 patients in the dataset in the analysis. Recurrence-free survival, overall survival and tumour-type data were extracted from the provided clinical data sheets. Images from dynamic contrast-enhanced bilateral MRI studies were independently analysed for enhancement patterns by two independent investigators, including one breast radiation oncologist, who were blinded to the outcome data. Patients were categorized into those with primary tumours containing necrotic areas (defined as tumours with internal regions of low-contrast-enhanced signal) and those with primary tumours not containing necrotic areas (defined as tumours with homogeneous, high-contrast-enhanced signal). Radiological evidence of axillary or internal mammary adenopathy was noted during image review.
Statistical analysis
Unless otherwise indicated, data are represented as mean + s.e.m. Paired or unpaired, two-tailed t-tests or Wilcoxon rank-sum test were used to compare two groups, and more than two datasets were compared using one-way analysis of variance (ANOVA) with Tukey’s multiple comparison test or Kruskal–Wallis test. Where applicable, normality was estimated using D’Agostino and Pearson or Shapiro–Wilk normality tests. log-rank (Mantel–Cox) analysis was used for Kaplan–Meier survival curves. The tests used are stated in the figure legends. No samples were excluded. All statistical analyses, except for RNA-seq analyses (see the section ‘RNA-seq’), were performed using Prism v8, v9 or v10 (GraphPad). A P < 0.05 was considered statistically significant; non-significant (NS) differences are indicated in the figures.
Reporting summary
Further information on research design is available in the Nature Portfolio Reporting Summary linked to this article.
Online content
Any methods, additional references, Nature Portfolio reporting summaries, source data, extended data, supplementary information, acknowledgements, peer review information; details of author contributions and competing interests; and statements of data and code availability are available at 10.1038/s41586-025-09278-3.
Supplementary information
Table of flow cytometry antibodies. Antibodies used for flow cytometry in this study.
Table of flow immunofluorescence staining antibodies. Antibodies used for immunofluorescence staining in this study.
Table of imaging mass cytometry antibodies. Antibodies used for imaging mass cytometry in this study.
Supplementary Tables 1–15.
4T1 tumor tissue clearing – neutrophils and NETs in necrotic regions. A 4T1 tumor cleared 4 weeks after orthotopic implantation and stained for the vasculature (CD31, green), neutrophils (MPO, cyan), citrullinated histone 3 (when colocalized with DAPI and MPO, a marker of NETs, red), and DAPI (blue), showing necrotic regions enriched in neutrophils and NETs and devoid of vasculature, as well as the overall “pleomorphic” architecture of the necrotic tissue.
4T1 tumor tissue clearing – neutrophils and NETs in necrotic regions. Another example of a 4T1 tumor cleared 4 weeks after orthotopic implantation and stained for the vasculature (CD31, green), neutrophils (MPO, cyan), citrullinated histone 3 (when colocalized with DAPI and MPO, a marker of NETs, red), and DAPI (blue), showing necrotic regions enriched in neutrophils and NETs and devoid of vasculature, as well as the overall “pleomorphic” architecture of the necrotic tissue.
4T1 tumor tissue clearing – neutrophils and NETs form aggregates inside the vasculature. A third example of a 4T1 tumor cleared 4 weeks after orthotopic implantation and stained for the vasculature (CD31, green), neutrophils (MPO, cyan), citrullinated histone 3 (when colocalized with DAPI and MPO, a marker of NETs, red), and DAPI (blue), showing the presence of intravascular neutrophil and NET aggregates.
4T1 tumor tissue clearing – intravascular neutrophil aggregates block blood flow. A 4T1 tumor cleared 4 weeks after orthotopic implantation and labeled in vivo for perfused vessels (i.v. lectin, red) and ex vivo for all of the vasculature (CD31, green), neutrophils (MPO, cyan), and DAPI (blue), showing that some vessels are perfused up to a neutrophil aggregate and that perfusion is lost downstream of the aggregate.
LLC tumor tissue clearing – necrotic regions, neutrophils, and vasculature. An LLC tumor cleared 4 weeks after implantation and stained in vivo for perfused vessels (i.v. lectin, red) and ex vivo for all of the vasculature (CD31, green), neutrophils (MPO, cyan), and DAPI (blue), showing the same overall features as the 4T1 model: pleomorphic, necrotic architecture enriched in neutrophils and perfused/unperfused vessels—the latter containing intravascular neutrophil aggregates.
LLC tumor tissue clearing – neutrophils aggregate inside the vasculature and block blood flow. An LLC tumor cleared 4 weeks after implantation and labeled in vivo for perfused vessels (i.v. lectin, red) and ex vivo for all of the vasculature (CD31, green), neutrophils (MPO, cyan), and DAPI, showing that some vessels are perfused up to a neutrophil aggregate (cyan) and that perfusion is lost downstream of the aggregate.
C3(1)-Tag tumor tissue clearing – necrotic regions, neutrophils, and vasculature. A C3(1)-Tag tumor resected at 24 weeks of age and stained for the vasculature (CD31, green), neutrophils (MPO, cyan), and DAPI (blue), showing the same overall features as the 4T1 model: necrosis enriched in neutrophils, a lack of vasculature, and intravascular neutrophil aggregates.
MMTV-PyMT tumor tissue clearing – central necrotic core regions, neutrophils, NETs, and vasculature. An MMTV-PyMT tumor cleared 7 weeks after orthotopic implantation of primary MMTV-PyMT cells and stained for the vasculature (CD31, green), neutrophils (MPO, cyan), citrullinated histone 3 (when colocalized with DAPI and MPO, a marker of NETs, red), and DAPI (blue), showing that necrosis in this model is not pleomorphic, but consistent with a classical central necrotic core, away from the vasculature, and not enriched in neutrophils and NETs like the 4T1 or LLC models.
MMTV-PyMT tumor tissue clearing – central necrotic core regions, neutrophils, NETs, and vasculature. Another example of an MMTV-PyMT tumor cleared 7 weeks after orthotopic implantation of primary MMTV-PyMT cells and stained for the vasculature (CD31, green), neutrophils (MPO, cyan), citrullinated histone 3 (when colocalized with DAPI and MPO, a marker of NETs, red), and DAPI (blue), showing that the necrosis in this model is not pleomorphic, but consistent with a classical central necrotic core, away from the vasculature and not enriched in neutrophils and NETs like the 4T1 or LLC models.
4T1 tumor tissue clearing – intravascular laminin exposure and neutrophil interaction. A 4T1 tumor cleared 4 weeks after orthotopic implantation and labeled in vivo for intravascular laminin (i.v. anti-laminin, red) and ex vivo for the vasculature (CD31, green), neutrophils (MPO, cyan), and DAPI (blue), showing the exposed luminal patches of extracellular matrix with which neutrophils interact.
4T1 tumor tissue clearing – pericyte coverage, vasculature, and luminal laminin exposure. A 4T1 tumor cleared 4 weeks after orthotopic implantation and stained in vivo for intravascular laminin (i.v. anti-laminin, cyan) and perfused vessels (lectin, red) and ex vivo for perivascular αSMA+ cells (green) and DAPI (blue), showing that luminal patches of extracellular matrix appear preferentially in vessels devoid of perivascular cell coverage.
4T1 tumor tissue clearing – intravascular fibrin deposition around necrotic regions and neutrophil interaction. A 4T1 tumor cleared 4 weeks after orthotopic implantation, showing intravascular fibrin deposition (i.v. fibrinogen-AF647, green), perfused vessels (i.v. lectin, red), neutrophils (MPO, cyan), and DAPI (blue), showing the presence of extensive fibrin deposits near neutrophil-rich necrotic areas and neutrophils interacting with the fibrin deposits.
LLC tumor intravital imaging – peri-necrotic vasculature. Intravital imaging through silicone-based polydimethylsiloxane (PDMS) windows of LLC primary tumors 2 weeks after implantation, showing neutrophils (bright LysM-GFP+ cells, green) and platelets (i.v. CD41, red) interacting in the vasculature (lectin, cyan) in the vicinity of neutrophil-rich regions.
LLC tumor intravital imaging – peri-necrotic vasculature. Another example of intravital imaging through silicone-based polydimethylsiloxane (PDMS) windows of LLC primary tumors 2 weeks after implantation, showing neutrophils (bright LysM-GFP+ cells, green) and platelets (i.v. CD41, red) interacting in the vasculature (lectin, cyan) in the vicinity of neutrophil-rich regions.
Intravital imaging of a LLC tumor – vasculature z-scan. Intravital imaging of LLC primary tumors through silicone-based polydimethylsiloxane (PDMS) windows 2 weeks after implantation, with a z-scan of the tumoral vasculature showing neutrophils (bright LysM-GFP+ cells, green) and platelets (i.v. CD41, red) forming several vascular clots (vascular wall: lectin, cyan) in the primary tumor.
4T1 tumor tissue clearing – peri-necrotic regions, hypoxyprobe, perfused vessels, and neutrophils. A 4T1 tumor cleared 4 weeks after orthotopic implantation, stained for hypoxic regions (hypoxyprobe, green), perfused vessels (i.v. lectin, red), neutrophils (MPO, cyan), and DAPI (blue) and showing that the regions surrounding the neutrophil-rich necrotic areas (that is, the peri-necrotic regions) are hypoxic.
4T1 tumor tissue clearing – macrophages around neutrophil-rich necrotic areas. A 4T1 tumor cleared four weeks after orthotopic implantation, stained for macrophages (CD68, green), neutrophils (MPO, red), and DAPI (blue), showing that macrophages accumulate in the peri-necrotic regions.
Intravital imaging of the dermis of 4T1 tumor-bearing mice – laser injury, neutrophil infiltration, and Ly6C signal. Intravital imaging of the ear skin of 4T1 tumor-bearing mice 5 weeks after implantation, showing neutrophils (bright LysM-GFP+ cells, green), Ly6C signal (i.v. Ly6C, red), and second harmonic signal (SHG, white). Images were acquired for 2 hours after initiating laser injury (visible in the center of the frame). The video shows an overview of the infiltration of neutrophils to the dermis and separated green and red channels showing neutrophils that extravasate have high Ly6C (red) signal.
Video summary. The primary tumor, in part through Cxcl1 expression, drives an expansion and a myeloid skew of the hematopoietic compartment and gives rise to a “vascular-restricted” neutrophil population defined by a specific transcriptomic profile that is inefficient in extravasation and has increased NET formation capacity. This increased neutrophil output from the bone marrow eventually reaches the tumor, where it encounters a poorly organized vascular network with abnormal pericyte coverage and intraluminal exposition of extracellular matrix proteins, where neutrophils deploy NETs, interact with platelets and aggregate. This, in turn, restricts the blood flow and causes necrosis of the downstream vascular bed, giving rise to a spatially distinct form of necrosis that we termed “pleomorphic necrosis”. In the regions adjacent to overt necrosis (i.e., the peri-necrotic regions), the tumor cells are subjected to hypoxic conditions. Cancer cells in peri-necrotic regions respond by engaging transcriptomic programs that enhance their migratory and invasion potentials, driving an EMT phenotype, leading to increased metastasis.
Source data
Acknowledgements
This work was supported by funding provided to M.E. by the US National Institutes of Health (NIH R01CA237413 and R01CA297338) and The Giovanis Institute for Translational Cell Biology. J.M.A. was the recipient of a Cancer Research Institute Irvington Fellowship (CRI Award #3435), and receives funding from the British Heart Foundation (SP/F/24/150081) and by the Francis Crick Institute, which receives its core funding from Cancer Research UK (FC001003), the UK Medical Research Council (FC001003) and the Wellcome Trust (FC001003). X.H. is supported by an NIH award (NIH F99CA284292). N.S. is supported by an NIH award (NIH F31CA281246). This work was performed with assistance from CSHL and Sidney Kimmel Comprehensive Cancer Center Shared Resources, which are supported by Cancer Center Support Grants (P30CA045508 and P30CA006973) and S10OD034407 to W.J.H. We thank Shared Resource heads J. Preall, R. Rubino, P. Moody and Q. Gao for guidance and assistance; A. Zychlinsky for providing the 3D9 antibody; and J. M. Garcia Caceres for the video summary.
Extended data figures and tables
Author contributions
J.M.A. and M.E. conceptualized the study. M.E., J.M.A., X.H. and N.S. acquired funding. J.M.A., X.H., J.S., N.S., J.D.-P., C.E., C.D.C. and W.J.H. conducted the investigation. J.M.A., T.F., C.E., J.P. and G.R. curated and analysed the human samples. M.E. provided project administration and supervised the study. X.-Y.H. and R.S.P. provided resources and support. J.M.A. and M.E. wrote the original draft of the manuscript, which was edited by all authors.
Peer review
Peer review information
Nature thanks Luigi Ombrato and the other, anonymous, reviewer(s) for their contribution to the peer review of this work.
Data availability
All of the transcriptomics data are available in the Gene Expression Omnibus (GEO). Ly6CHigh and Ly6CLow RNA-seq data are available at the GEO under the accession number GSE228588. The RNA-seq data of TdTomato-expressing LLC cancer cells from PAD4WT or PAD4ΔN mice are also available at the GEO under the accession number GSE229953. scRNA-seq data of C3(1)-Tag cells are available at the GEO under the accession number GSE199515. The 4T1 spatial transcriptomic dataset is available at the GEO under the accession number GSE230098. The CITE-seq data of 4T1 tumours are available at the GEO under the accession number GSE272502. MRI data of patients with breast cancer are available at the Cancer Imaging Archive, collection: Duke-Breast-Cancer-MRI8 dataset (the first 200 patients were included in this study). scRNA-seq data from patients with breast cancer are available at the GEO under the accession number GSE114727. MMTV-PyMT and 4T1 tumour scRNA-seq data are available at the GEO under the accession number GSE123366. The GRCm39 Ensembl genome assembly was used as the mouse genome reference. Source data are provided with this paper.
Code availability
The ImageJ macro for ex vivo NET quantification is available in FigShare (10.6084/m9.figshare.14401958). No original software and/or algorithms were developed in the present study.
Competing interests
M.E. holds shares in Agios. J.D.-P. is an employee of Xilis, Inc. W.J.H. reports patent royalties from Rodeo/Amgen; received research funding from Sanofi, NeoTX and Riboscience (to Johns Hopkins University); and speaking and/or travel honoraria from Exelixis and Standard BioTools. All other authors declare no competing interests.
Footnotes
Publisher’s note Springer Nature remains neutral with regard to jurisdictional claims in published maps and institutional affiliations.
Contributor Information
Jose M. Adrover, Email: jose.adrover@crick.ac.uk
Mikala Egeblad, Email: mikala.egeblad@jhmi.edu.
Extended data
is available for this paper at 10.1038/s41586-025-09278-3.
Supplementary information
The online version contains supplementary material available at 10.1038/s41586-025-09278-3.
References
- 1.Richards, C. H., Mohammed, Z., Qayyum, T., Horgan, P. G. & McMillan, D. C. The prognostic value of histological tumor necrosis in solid organ malignant disease: a systematic review. Future Oncol.7, 1223–1235 (2011). [DOI] [PubMed] [Google Scholar]
- 2.Caruso, R. et al. Histologic coagulative tumour necrosis as a prognostic indicator of aggressiveness in renal, lung, thyroid and colorectal carcinomas: a brief review. Oncol. Lett.3, 16–18 (2012). [DOI] [PMC free article] [PubMed] [Google Scholar]
- 3.Rabas, N., Ferreira, R. M. M., Di Blasio, S. & Malanchi, I. Cancer-induced systemic pre-conditioning of distant organs: building a niche for metastatic cells. Nat. Rev. Cancer24, 829–849 (2024). [DOI] [PubMed] [Google Scholar]
- 4.Engblom, C. et al. Osteoblasts remotely supply lung tumors with cancer-promoting SiglecFhigh neutrophils. Science358, eaal5081 (2017). [DOI] [PMC free article] [PubMed] [Google Scholar]
- 5.Bao, Y. et al. Extramedullary hematopoiesis secondary to malignant solid tumors: a case report and literature review. Cancer Manag. Res.10, 1461–1470 (2018). [DOI] [PMC free article] [PubMed] [Google Scholar]
- 6.Wu, W. C. et al. Circulating hematopoietic stem and progenitor cells are myeloid-biased in cancer patients. Proc. Natl Acad. Sci. USA111, 4221–4226 (2014). [DOI] [PMC free article] [PubMed] [Google Scholar]
- 7.Brinkmann, V. et al. Neutrophil extracellular traps kill bacteria. Science303, 1532–1535 (2004). [DOI] [PubMed] [Google Scholar]
- 8.Adrover, J. M., McDowell, S. A. C., He, X.-Y., Quail, D. F. & Egeblad, M. NETworking with cancer: the bidirectional interplay between cancer and neutrophil extracellular traps. Cancer Cell41, 505–526 (2023). [DOI] [PMC free article] [PubMed]
- 9.Gómez-Moreno, D., Adrover, J. M. & Hidalgo, A. Neutrophils as effectors of vascular inflammation. Eur. J. Clin. Invest.48, 1–14 (2018). [DOI] [PubMed] [Google Scholar]
- 10.Martinod, K. et al. Neutrophil histone modification by peptidylarginine deiminase 4 is critical for deep vein thrombosis in mice. Proc. Natl Acad. Sci. USA110, 8674–8679 (2013). [DOI] [PMC free article] [PubMed] [Google Scholar]
- 11.Rosell, A., Martinod, K., Mackman, N. & Thålin, C. Neutrophil extracellular traps and cancer-associated thrombosis. Thromb. Res.213, S35–S41 (2022). [DOI] [PubMed] [Google Scholar]
- 12.Saha, A. et al. A machine learning approach to radiogenomics of breast cancer: a study of 922 subjects and 529 DCE-MRI features. Br. J. Cancer119, 508–516 (2018). [DOI] [PMC free article] [PubMed] [Google Scholar]
- 13.Vicanolo, T., Hidalgo, A. & Adrover, J. M. Measuring circadian neutrophil infiltration in tissues by paired whole-mount tissue clearing and flow cytometry. Methods Mol. Biol.2482, 265–284 (2022). [DOI] [PubMed]
- 14.Tilley, D. O. et al. Histone H3 clipping is a novel signature of human neutrophil extracellular traps. eLife11, e68283 (2022). [DOI] [PMC free article] [PubMed] [Google Scholar]
- 15.Maiorino, L. et al. Longitudinal intravital imaging through clear silicone windows. J. Vis. Exp.10.3791/62757 (2022). [DOI] [PMC free article] [PubMed]
- 16.Csepregi, J. Z. et al. Myeloid-specific deletion of Mcl-1 yields severely neutropenic mice that survive and breed in homozygous form. J. Immunol.201, 3793–3803 (2018). [DOI] [PMC free article] [PubMed] [Google Scholar]
- 17.Saniabadi, A. R., Tomiak, R. H. H., Lowe, G. D. O., Barbenel, J. C. & Forbes, C. D. Dipyridamole inhibits red cell-induced platelet activation. Atherosclerosis76, 149–154 (1989). [DOI] [PubMed] [Google Scholar]
- 18.Xiao, Z., Théroux, P. & Frojmovic, M. Modulation of platelet-neutrophil interaction with pharmacological inhibition of fibrinogen binding to platelet GPIIb/IIIa receptor. Thromb. Haemost.81, 281–285 (1999). [PubMed] [Google Scholar]
- 19.Carter, D., Pipkin, R. D., Shepard, R. H., Elkins, R. C. & Abbey, H. Relationship of necrosis and tumor border to lymph node metastases and 10-year survival in carcinoma of the breast. Am. J. Surg. Pathol.2, 39–46 (1978). [DOI] [PubMed] [Google Scholar]
- 20.Yamamoto, A. et al. Metastasis from the tumor interior and necrotic core formation are regulated by breast cancer-derived angiopoietin-like 7. Proc. Natl Acad. Sci. USA120, e2214888120 (2023). [DOI] [PMC free article] [PubMed] [Google Scholar]
- 21.Yeo, S. K. et al. Single-cell RNA-sequencing reveals distinct patterns of cell state heterogeneity in mouse models of breast cancer. eLife9, e58810 (2020). [DOI] [PMC free article] [PubMed] [Google Scholar]
- 22.Delgado, A. P. et al. Single-cell transcriptome analysis reveals evolutionarily conserved features during the transition from normal breast stromal cells to cancer-associated fibroblasts. Preprint at bioRxiv10.1101/2022.05.05.490693 (2024).
- 23.Karaayvaz, M. et al. Unravelling subclonal heterogeneity and aggressive disease states in TNBC through single-cell RNA-seq. Nat. Commun.9, 3588 (2018). [DOI] [PMC free article] [PubMed] [Google Scholar]
- 24.McEarchern, J. A. et al. Invasion and metastasis of a mammary tumor involves TGF-β signaling. Int. J. Cancer91, 76–82 (2001). [DOI] [PubMed] [Google Scholar]
- 25.Hapke, R. Y. & Haake, S. M. Hypoxia-induced epithelial to mesenchymal transition in cancer. Cancer Lett.487, 10–20 (2020). [DOI] [PMC free article] [PubMed] [Google Scholar]
- 26.He, S. et al. High-plex imaging of RNA and proteins at subcellular resolution in fixed tissue by spatial molecular imaging. Nat. Biotechnol.40, 1794–1806 (2022). [DOI] [PubMed]
- 27.Bordignon, P. et al. Dualism of FGF and TGF-β signaling in heterogeneous cancer-associated fibroblast activation with ETV1 as a critical determinant. Cell Rep.28, 2358–2372.e6 (2019). [DOI] [PMC free article] [PubMed] [Google Scholar]
- 28.Gerber-Ferder, Y. et al. Breast cancer remotely imposes a myeloid bias on haematopoietic stem cells by reprogramming the bone marrow niche. Nat. Cell Biol.25, 1736–1745 (2023). [DOI] [PubMed] [Google Scholar]
- 29.Agarwal, P. et al. TNF-α-induced alterations in stromal progenitors enhance leukemic stem cell growth via CXCR2 signaling. Cell Rep.36, 109386 (2021). [DOI] [PMC free article] [PubMed] [Google Scholar]
- 30.Eash, K. J., Greenbaum, A. M., Gopalan, P. K. & Link, D. C. CXCR2 and CXCR4 antagonistically regulate neutrophil trafficking from murine bone marrow. J. Clin. Invest.120, 2423–2431 (2010). [DOI] [PMC free article] [PubMed] [Google Scholar]
- 31.Laterveer, L., Lindley, I., Hamilton, M., Willemze, R. & Fibbe, W. Interleukin-8 induces rapid mobilization of hematopoietic stem cells with radioprotective capacity and long-term myelolymphoid repopulating ability. Blood85, 2269–2275 (1995). [PubMed] [Google Scholar]
- 32.Adrover, J. M. et al. A neutrophil timer coordinates immune defense and vascular protection. Immunity50, 390–402.e10 (2019). [DOI] [PubMed] [Google Scholar]
- 33.Adrover, J. M. et al. Programmed ‘disarming’ of the neutrophil proteome reduces the magnitude of inflammation. Nat. Immunol.21, 135–144 (2020). [DOI] [PMC free article] [PubMed] [Google Scholar]
- 34.Adrover, J. M., Nicolás-Ávila, J. A. & Hidalgo, A. Aging: a temporal dimension for neutrophils. Trends Immunol.37, 334–345 (2016). [DOI] [PubMed] [Google Scholar]
- 35.Mackey, J. B. G., Coffelt, S. B. & Carlin, L. M. Neutrophil maturity in cancer. Front. Immunol.10, 1912 (2019). [DOI] [PMC free article] [PubMed] [Google Scholar]
- 36.Ng, M. S. F. et al. Deterministic reprogramming of neutrophils within tumors. Science383, eadf6493 (2024). [DOI] [PMC free article] [PubMed] [Google Scholar]
- 37.Ng, L. G. et al. Visualizing the neutrophil response to sterile tissue injury in mouse dermis reveals a three-phase cascade of events. J. Invest. Dermatol.131, 2058–2068 (2011). [DOI] [PubMed] [Google Scholar]
- 38.Woodfin, A. et al. ICAM-1-expressing neutrophils exhibit enhanced effector functions in murine models of endotoxemia. Blood127, 898–907 (2016). [DOI] [PMC free article] [PubMed] [Google Scholar]
- 39.Azizi, E. et al. Single-cell map of diverse immune phenotypes in the breast tumor microenvironment. Cell174, 1293–1308.e36 (2018). [DOI] [PMC free article] [PubMed] [Google Scholar]
- 40.Knight, J. S. et al. Peptidylarginine deiminase inhibition reduces vascular damage and modulates innate immune responses in murine models of atherosclerosis. Circ. Res.114, 947–956 (2014). [DOI] [PMC free article] [PubMed] [Google Scholar]
- 41.Fuchs, T. A. et al. Extracellular DNA traps promote thrombosis. Proc. Natl Acad. Sci. USA107, 15880–15885 (2010). [DOI] [PMC free article] [PubMed] [Google Scholar]
- 42.Demers, M. et al. Cancers predispose neutrophils to release extracellular DNA traps that contribute to cancer-associated thrombosis. Proc. Natl Acad. Sci. USA109, 13076–13081 (2012). [DOI] [PMC free article] [PubMed] [Google Scholar]
- 43.Li, P. et al. PAD4 is essential for antibacterial innate immunity mediated by neutrophil extracellular traps. J. Exp. Med.207, 1853–1862 (2010). [DOI] [PMC free article] [PubMed] [Google Scholar]
- 44.Tsourouktsoglou, T.-D. et al. Histones, DNA, and citrullination promote neutrophil extracellular trap inflammation by regulating the localization and activation of TLR4. Cell Rep.31, 107602 (2020). [DOI] [PubMed] [Google Scholar]
- 45.Park, J. et al. Cancer cells induce metastasis-supporting neutrophil extracellular DNA traps. Sci. Transl. Med.8, 361ra138 (2016). [DOI] [PMC free article] [PubMed] [Google Scholar]
- 46.Adrover, J. M. et al. Disulfiram inhibits neutrophil extracellular trap formation and protects rodents from acute lung injury and SARS-CoV-2 infection. JCI Insight7, e157342 (2022). [DOI] [PMC free article] [PubMed] [Google Scholar]
- 47.Cooke, V. G. et al. Pericyte depletion results in hypoxia-associated epithelial-to-mesenchymal transition and metastasis mediated by Met signaling pathway. Cancer Cell21, 66–81 (2012). [DOI] [PMC free article] [PubMed] [Google Scholar]
- 48.Mousset, A. et al. Neutrophil extracellular traps formed during chemotherapy confer treatment resistance via TGF-β activation. Cancer Cell41, 757–775.e10 (2023). [DOI] [PMC free article] [PubMed] [Google Scholar]
- 49.TRACERx Renal Consortium et al. Selection of metastasis competent subclones in the tumour interior. Nat. Ecol. Evol.5, 1033–1045 (2021). [DOI] [PMC free article] [PubMed] [Google Scholar]
- 50.Enfield, K. S. S. et al. Spatial architecture of myeloid and T cells orchestrates immune evasion and clinical outcome in lung cancer. Cancer Discov.14, 1018–1047 (2024). [DOI] [PMC free article] [PubMed] [Google Scholar]
- 51.Sorin, M. et al. Single-cell spatial landscapes of the lung tumour immune microenvironment. Nature614, 548–554 (2023). [DOI] [PMC free article] [PubMed] [Google Scholar]
- 52.Khorana, A. A., Francis, C. W., Culakova, E., Kuderer, N. M. & Lyman, G. H. Frequency, risk factors, and trends for venous thromboembolism among hospitalized cancer patients. Cancer110, 2339–2346 (2007). [DOI] [PubMed] [Google Scholar]
- 53.Gernaat, S. A. M. et al. Risk of death from cardiovascular disease following breast cancer: a systematic review. Breast Cancer Res. Treat.164, 537–555 (2017). [DOI] [PMC free article] [PubMed] [Google Scholar]
- 54.Van Gassen, S. et al. FlowSOM: using self-organizing maps for visualization and interpretation of cytometry data. Cytom. Part J. Int. Soc. Anal. Cytol.87, 636–645 (2015). [DOI] [PubMed] [Google Scholar]
- 55.Simon, S. et al. β2-integrin and L-selectin are obligatory receptors in neutrophil aggregation. Blood82, 1097–1106 (1993). [PubMed] [Google Scholar]
- 56.Simon, S. I., Chambers, J. D., Butcher, E. & Sklar, L. A. Neutrophil aggregation is β2-integrin- and L-selectin-dependent in blood and isolated cells. J. Immunol.149, 2765–2771 (1992). [PubMed] [Google Scholar]
- 57.Silva, L. M. et al. Fibrin is a critical regulator of neutrophil effector function at the oral mucosal barrier. Science374, eabl5450 (2021). [DOI] [PMC free article] [PubMed] [Google Scholar]
Associated Data
This section collects any data citations, data availability statements, or supplementary materials included in this article.
Supplementary Materials
Table of flow cytometry antibodies. Antibodies used for flow cytometry in this study.
Table of flow immunofluorescence staining antibodies. Antibodies used for immunofluorescence staining in this study.
Table of imaging mass cytometry antibodies. Antibodies used for imaging mass cytometry in this study.
Supplementary Tables 1–15.
4T1 tumor tissue clearing – neutrophils and NETs in necrotic regions. A 4T1 tumor cleared 4 weeks after orthotopic implantation and stained for the vasculature (CD31, green), neutrophils (MPO, cyan), citrullinated histone 3 (when colocalized with DAPI and MPO, a marker of NETs, red), and DAPI (blue), showing necrotic regions enriched in neutrophils and NETs and devoid of vasculature, as well as the overall “pleomorphic” architecture of the necrotic tissue.
4T1 tumor tissue clearing – neutrophils and NETs in necrotic regions. Another example of a 4T1 tumor cleared 4 weeks after orthotopic implantation and stained for the vasculature (CD31, green), neutrophils (MPO, cyan), citrullinated histone 3 (when colocalized with DAPI and MPO, a marker of NETs, red), and DAPI (blue), showing necrotic regions enriched in neutrophils and NETs and devoid of vasculature, as well as the overall “pleomorphic” architecture of the necrotic tissue.
4T1 tumor tissue clearing – neutrophils and NETs form aggregates inside the vasculature. A third example of a 4T1 tumor cleared 4 weeks after orthotopic implantation and stained for the vasculature (CD31, green), neutrophils (MPO, cyan), citrullinated histone 3 (when colocalized with DAPI and MPO, a marker of NETs, red), and DAPI (blue), showing the presence of intravascular neutrophil and NET aggregates.
4T1 tumor tissue clearing – intravascular neutrophil aggregates block blood flow. A 4T1 tumor cleared 4 weeks after orthotopic implantation and labeled in vivo for perfused vessels (i.v. lectin, red) and ex vivo for all of the vasculature (CD31, green), neutrophils (MPO, cyan), and DAPI (blue), showing that some vessels are perfused up to a neutrophil aggregate and that perfusion is lost downstream of the aggregate.
LLC tumor tissue clearing – necrotic regions, neutrophils, and vasculature. An LLC tumor cleared 4 weeks after implantation and stained in vivo for perfused vessels (i.v. lectin, red) and ex vivo for all of the vasculature (CD31, green), neutrophils (MPO, cyan), and DAPI (blue), showing the same overall features as the 4T1 model: pleomorphic, necrotic architecture enriched in neutrophils and perfused/unperfused vessels—the latter containing intravascular neutrophil aggregates.
LLC tumor tissue clearing – neutrophils aggregate inside the vasculature and block blood flow. An LLC tumor cleared 4 weeks after implantation and labeled in vivo for perfused vessels (i.v. lectin, red) and ex vivo for all of the vasculature (CD31, green), neutrophils (MPO, cyan), and DAPI, showing that some vessels are perfused up to a neutrophil aggregate (cyan) and that perfusion is lost downstream of the aggregate.
C3(1)-Tag tumor tissue clearing – necrotic regions, neutrophils, and vasculature. A C3(1)-Tag tumor resected at 24 weeks of age and stained for the vasculature (CD31, green), neutrophils (MPO, cyan), and DAPI (blue), showing the same overall features as the 4T1 model: necrosis enriched in neutrophils, a lack of vasculature, and intravascular neutrophil aggregates.
MMTV-PyMT tumor tissue clearing – central necrotic core regions, neutrophils, NETs, and vasculature. An MMTV-PyMT tumor cleared 7 weeks after orthotopic implantation of primary MMTV-PyMT cells and stained for the vasculature (CD31, green), neutrophils (MPO, cyan), citrullinated histone 3 (when colocalized with DAPI and MPO, a marker of NETs, red), and DAPI (blue), showing that necrosis in this model is not pleomorphic, but consistent with a classical central necrotic core, away from the vasculature, and not enriched in neutrophils and NETs like the 4T1 or LLC models.
MMTV-PyMT tumor tissue clearing – central necrotic core regions, neutrophils, NETs, and vasculature. Another example of an MMTV-PyMT tumor cleared 7 weeks after orthotopic implantation of primary MMTV-PyMT cells and stained for the vasculature (CD31, green), neutrophils (MPO, cyan), citrullinated histone 3 (when colocalized with DAPI and MPO, a marker of NETs, red), and DAPI (blue), showing that the necrosis in this model is not pleomorphic, but consistent with a classical central necrotic core, away from the vasculature and not enriched in neutrophils and NETs like the 4T1 or LLC models.
4T1 tumor tissue clearing – intravascular laminin exposure and neutrophil interaction. A 4T1 tumor cleared 4 weeks after orthotopic implantation and labeled in vivo for intravascular laminin (i.v. anti-laminin, red) and ex vivo for the vasculature (CD31, green), neutrophils (MPO, cyan), and DAPI (blue), showing the exposed luminal patches of extracellular matrix with which neutrophils interact.
4T1 tumor tissue clearing – pericyte coverage, vasculature, and luminal laminin exposure. A 4T1 tumor cleared 4 weeks after orthotopic implantation and stained in vivo for intravascular laminin (i.v. anti-laminin, cyan) and perfused vessels (lectin, red) and ex vivo for perivascular αSMA+ cells (green) and DAPI (blue), showing that luminal patches of extracellular matrix appear preferentially in vessels devoid of perivascular cell coverage.
4T1 tumor tissue clearing – intravascular fibrin deposition around necrotic regions and neutrophil interaction. A 4T1 tumor cleared 4 weeks after orthotopic implantation, showing intravascular fibrin deposition (i.v. fibrinogen-AF647, green), perfused vessels (i.v. lectin, red), neutrophils (MPO, cyan), and DAPI (blue), showing the presence of extensive fibrin deposits near neutrophil-rich necrotic areas and neutrophils interacting with the fibrin deposits.
LLC tumor intravital imaging – peri-necrotic vasculature. Intravital imaging through silicone-based polydimethylsiloxane (PDMS) windows of LLC primary tumors 2 weeks after implantation, showing neutrophils (bright LysM-GFP+ cells, green) and platelets (i.v. CD41, red) interacting in the vasculature (lectin, cyan) in the vicinity of neutrophil-rich regions.
LLC tumor intravital imaging – peri-necrotic vasculature. Another example of intravital imaging through silicone-based polydimethylsiloxane (PDMS) windows of LLC primary tumors 2 weeks after implantation, showing neutrophils (bright LysM-GFP+ cells, green) and platelets (i.v. CD41, red) interacting in the vasculature (lectin, cyan) in the vicinity of neutrophil-rich regions.
Intravital imaging of a LLC tumor – vasculature z-scan. Intravital imaging of LLC primary tumors through silicone-based polydimethylsiloxane (PDMS) windows 2 weeks after implantation, with a z-scan of the tumoral vasculature showing neutrophils (bright LysM-GFP+ cells, green) and platelets (i.v. CD41, red) forming several vascular clots (vascular wall: lectin, cyan) in the primary tumor.
4T1 tumor tissue clearing – peri-necrotic regions, hypoxyprobe, perfused vessels, and neutrophils. A 4T1 tumor cleared 4 weeks after orthotopic implantation, stained for hypoxic regions (hypoxyprobe, green), perfused vessels (i.v. lectin, red), neutrophils (MPO, cyan), and DAPI (blue) and showing that the regions surrounding the neutrophil-rich necrotic areas (that is, the peri-necrotic regions) are hypoxic.
4T1 tumor tissue clearing – macrophages around neutrophil-rich necrotic areas. A 4T1 tumor cleared four weeks after orthotopic implantation, stained for macrophages (CD68, green), neutrophils (MPO, red), and DAPI (blue), showing that macrophages accumulate in the peri-necrotic regions.
Intravital imaging of the dermis of 4T1 tumor-bearing mice – laser injury, neutrophil infiltration, and Ly6C signal. Intravital imaging of the ear skin of 4T1 tumor-bearing mice 5 weeks after implantation, showing neutrophils (bright LysM-GFP+ cells, green), Ly6C signal (i.v. Ly6C, red), and second harmonic signal (SHG, white). Images were acquired for 2 hours after initiating laser injury (visible in the center of the frame). The video shows an overview of the infiltration of neutrophils to the dermis and separated green and red channels showing neutrophils that extravasate have high Ly6C (red) signal.
Video summary. The primary tumor, in part through Cxcl1 expression, drives an expansion and a myeloid skew of the hematopoietic compartment and gives rise to a “vascular-restricted” neutrophil population defined by a specific transcriptomic profile that is inefficient in extravasation and has increased NET formation capacity. This increased neutrophil output from the bone marrow eventually reaches the tumor, where it encounters a poorly organized vascular network with abnormal pericyte coverage and intraluminal exposition of extracellular matrix proteins, where neutrophils deploy NETs, interact with platelets and aggregate. This, in turn, restricts the blood flow and causes necrosis of the downstream vascular bed, giving rise to a spatially distinct form of necrosis that we termed “pleomorphic necrosis”. In the regions adjacent to overt necrosis (i.e., the peri-necrotic regions), the tumor cells are subjected to hypoxic conditions. Cancer cells in peri-necrotic regions respond by engaging transcriptomic programs that enhance their migratory and invasion potentials, driving an EMT phenotype, leading to increased metastasis.
Data Availability Statement
All of the transcriptomics data are available in the Gene Expression Omnibus (GEO). Ly6CHigh and Ly6CLow RNA-seq data are available at the GEO under the accession number GSE228588. The RNA-seq data of TdTomato-expressing LLC cancer cells from PAD4WT or PAD4ΔN mice are also available at the GEO under the accession number GSE229953. scRNA-seq data of C3(1)-Tag cells are available at the GEO under the accession number GSE199515. The 4T1 spatial transcriptomic dataset is available at the GEO under the accession number GSE230098. The CITE-seq data of 4T1 tumours are available at the GEO under the accession number GSE272502. MRI data of patients with breast cancer are available at the Cancer Imaging Archive, collection: Duke-Breast-Cancer-MRI8 dataset (the first 200 patients were included in this study). scRNA-seq data from patients with breast cancer are available at the GEO under the accession number GSE114727. MMTV-PyMT and 4T1 tumour scRNA-seq data are available at the GEO under the accession number GSE123366. The GRCm39 Ensembl genome assembly was used as the mouse genome reference. Source data are provided with this paper.
The ImageJ macro for ex vivo NET quantification is available in FigShare (10.6084/m9.figshare.14401958). No original software and/or algorithms were developed in the present study.