

Abstract
Background
A clear understanding of minimal clinically important difference (MCID) and substantial clinical benefit (SCB) is essential for effectively implementing patient-reported outcome measurements (PROMs) as a performance measure for total knee arthroplasty (TKA). Since not achieving MCID and SCB may reflect suboptimal surgical benefit, the primary aim of this study was to use machine learning to predict patients who may not achieve the threshold-based outcomes (i.e., MCID and SCB) on the Knee Injury and Osteoarthritis Outcome Score for Joint Replacement (KOOS JR) following TKA.
Methods
Data from 1064 patients who underwent TKA at a single academic medical center between 2016 and 2022 contained 81 preoperative variables, including routinely collected measures and PROMs (KOOS JR and Patient-Reported Outcomes Measurement Information Systems [PROMIS-10]). Several machine-learning models were developed, which include penalized logistic regression as a linear model, support vector machine with polynomial and radial kernels as nonlinear models, and random forest and extreme gradient boosting as nonparametric models. These models predicted both distribution- and anchor-based MCIDs and SCB. In addition, logistic regression models were used to identify relevant risk factors for failing to meet these thresholds.
Results
The random forest models and the penalized logistic regression models achieved acceptable area under the receiver operating characteristic curve (AUC) close to or above 0.7 for all the outcomes. Furthermore, the logistic regression models identified shared risk factors for the three outcomes: preoperative PROMs (i.e., KOOS JR score, PROMIS-10 global physical T-score, and PROMIS-10 general mental health), antidepressant medication history, age, and Kellgren–Lawrence grade.
Conclusions
Machine-learning models were able to identify patients at risk of failure to achieve the threshold-based metrics and relevant preoperative factors. As such, these models may be used to both improve shared decision-making and help create risk-stratification tools to improve quality assessment of surgical outcomes.
Supplementary Information
The online version contains supplementary material available at 10.1186/s43019-025-00289-y.
Keywords: Patient-reported outcome measures, Minimal clinical important difference, Substantial clinical benefit, Total knee arthroplasty, Machine learning, Risk factor analysis
Introduction
Patient-reported outcome measures (PROMs) are increasingly collected to monitor the impact of care episode delivery [1, 2]. These PROMs are intended to capture patients’ perspectives on their health conditions while complementing the evaluations traditionally made by healthcare providers [1, 3, 4]. Further, they provide a quantitative assessment of the effect on the healthcare intervention, theoretically allowing for comparisons across interventions, providers, sites of care, and even across patient factors. By capturing and comparing pre- and post-intervention PROM scores, clinicians can assess the patient’s perspective of the intervention and gauge a level of improvement [3, 5–9]. To aid in grading the impact of the intervention, a threshold-based outcome (i.e., whether the change in PROMs surpasses a specific level) is often used to evaluate the results [10].
Currently, several options exist to determine these thresholds. The minimal clinically important difference (MCID) [11], first defined by Jaeschke and colleagues in 1989, is intended to represent the smallest score difference that patients recognize as beneficial. Secondarily, the substantial clinical benefit (SCB) [13, 14], originally created by Glassman et al. and adopted for use in the total knee arthroplasty (TKA) population by Lyman et al. in 2017, has recently gained more visibility as it has been selected for mandatory reporting purposes [12]. The SCB represents the change where patients experience a substantial (i.e., rather than minimally detectable) improvement, serving as a benchmark for defining clinical success [13], especially in arthroplasty [14, 15]. Emphasizing the valued use of PROMs, the Centers for Medicare and Medicaid Services (CMS) has defined achievement of the SCB as a quality measure in arthroplasty that will be tracked and will influence reimbursement, intending to encourage high-quality care [16, 17].
The central role of PROMs in shared decision-making and as a key element of patient-centered care, along with their potential role in reimbursement determinations, makes understanding these instruments a core competency for the modern arthroplasty surgeon [18]. However, it is evident that a knowledge gap remains in how best to score and interpret these results. Currently, few standardized methods have been used to assign these thresholds. Moreover, the current risk adjustment method may be ineffective if CMS plans to use SCB to deem an encounter a success or failure [12, 16]; moreover, patient factors that predispose patients to either success or failure of the intervention are not routinely incorporated into the scoring system. This places some care episodes at substantial risk for failure to meet these thresholds, despite the high-quality decision-making and surgical intervention.
Currently, machine learning is widely used in the medical field to predict adverse outcomes and identify the factors driving these outcomes [19, 20]. Machine-learning models can process the vast amounts of data collected in healthcare, sparing clinicians from having to analyze all available information manually. In addition, these models have the potential to uncover risk factors that might not be identified using traditional models with fewer covariates [20, 21]. In addition, machine learning can assist clinicians in pinpointing high-risk patients prior to interventions to plan these interventions more effectively. Given that PROM-based metrics are now used to measure the quality of care, using machine learning to predict preoperative factors could enhance outcomes throughout a TKA intervention, as machine learning has demonstrated strong performance throughout other health outcomes, especially in arthroplasty, such as readmission [22, 23] and length of stay [24, 25].
The primary aim of this study was to use machine learning to predict patients who may not achieve the threshold-based outcomes (i.e., MCID and SCB) on the Knee Injury and Osteoarthritis Outcome Score for Joint Replacement (KOOS JR) [26] in a consecutive population of patients undergoing a total knee arthroplasty (TKA) at a single institution. In addition, we sought to identify relevant risk factors associated with failure to achieve the threshold-based outcomes available preoperatively to aid in both shared decision-making and potential risk stratification.
Materials and methods
Patient population
After institutional review board approval, data were retrospectively collected from the electronic health records (Epic Systems, Verona, WI, USA) for patients who underwent a primary TKA (CPT: 27447) at a single tertiary care center between January 2016 and July 2022. Patients were included in the study if they (1) had a primary TKA procedure performed and (2) had both preoperative (i.e., within 30 days) and 1-year postoperative (i.e., range 270–365 days) PROM scores specific to the KOOS JR and the Patient-Reported Outcomes Measurement Information Systems (PROMIS-10) [27]. For those patients who received multiple TKAs, only the first surgery was deemed as an index surgery and included. In addition, patients who were unable to achieve MCID and SCB (i.e., based on a preoperative KOOS JR score) were excluded owing to the inability to reach the change score per the definition [28]. This study cohort identification is shown in Fig. 1.
Fig. 1.

Study cohort identification. KOOS JR Knee Disability and Osteoarthritis Outcome Score Joint Replacement, TKA total knee arthroplasty
Patient-reported outcome measures
PROMs collected were specific to the PROMIS-10 and the KOOS JR. The PROMIS-10, version 1.2, is a ten-item general health PROM that assesses patients’ overall general physical health (i.e., global physical T-score) and mental health (i.e., global mental T-score). The PROMIS-10 items are scored on a range from 1 (i.e., “poor,” “not at all,” “always,” and “very severe”) to 5 (i.e., “none,” “completely,” and “never”), which is then summed and transformed to the T-score, ranging from 16.2 (i.e., worse overall physical health) to 67.7 (i.e., best overall physical health) [29].
The KOOS JR is a region-specific and disease-specific instrument aimed at measuring knee pain and function. The KOOS JR includes seven items scored from 0 (i.e., none) to 4 (i.e., extreme). The score is then summed on a scale from 0 to 28, then inversely transposed to an interval score of 0–100, where 0 is indicative of total knee disability, and 100 is indicative of perfect knee health [26]. In this study, all the survey-related items were considered as continuous variables [30].
Threshold-based outcomes
Specific outcomes of interest included the change in KOOS JR scores from the preoperative visit to postoperative visit (i.e., delta), not achieving two different MCIDs (i.e., anchor-based MCID and distribution-based MCID), and not achieving the SCB [10, 31, 32]. Anchor-based MCID and SCB rely on an anchor question that is determined by comparing the score change with corresponding responses to this question within the intended study population [31]. In 2017, Lyman et al. used the quality of life question from the Hospital for Special Surgery satisfaction survey as an anchor to derive both the anchor-based MCID and SCB [10]; this calculation was based on the comparison of the answers (i.e., those who reported “moderate improvement” [MCID] and those who reported “more improvement than I ever dreamed possible” and “great improvement” [SCB]) [10]. Several logistic regression models were constructed with each dichotomous independent variable based on KOOS JR scores and a dichotomous dependent variable based on the anchor question to identify the threshold for KOOS JR scores [10]. As an anchor question was not routinely collected, the present study adopted the anchor-based MCID threshold (i.e., 13.6 points) and the SCB threshold (i.e., 20 points) from the previous study by Lyman et al. [10]. In contrast, the distribution-based MCID is typically calculated from the statistical distribution of the population of interest [31]. Even though this value is considered less validated than the anchor-based MCID [10], the distribution-based MCID is easily accessible. Using the standard approach (i.e., 0.5 × the standard deviation of the difference in KOOS JR scores) [10], the distribution-based MCID was calculated to be 9.6 points within this study population.
Covariates
Covariates included in the analyses were comparable to those used in similar existing studies assessing outcomes related to PROMs [28, 33–35], along with additional relevant covariates accessible in the electronic health record (EHR) system for knowledge discovery. Covariates included in the set available at the time of TKA decision-making and the following categories were considered: (1) demographic (e.g., age and sex) and socioeconomic status, (2) preoperative care (e.g., body mass index [BMI] and Charlson Comorbidity Index [CCI]), (3) comorbidities and medical histories documented within 90 days of the index procedure, (4) medications documented within 90 days of the index procedure, and (5) preoperative survey. The covariates are presented in Table 1 for preoperative survey and Supplementary Material S1, with key highlights presented here. The Kellgren–Lawrence (KL) score, which indicates the presence and severity of knee radiographic osteoarthritis, and American Society of Anesthesiologists (ASA) physical status classification [36, 37] were collected during preoperative care. In addition, the age variable was categorized on the basis of quartiles (i.e., 18–66, 67–71, 72–77, and ≥ 78 years) [38]; BMI was based on standard categories (i.e., < 25.0, 25.0–29.9, 30.0–39.9, and ≥ 40 kg/m2) [39].
Table 1.
Univariate relationships between the change in KOOS JR scores and individual survey variables
| Covariates | Pearson’s correlation coefficient (r) | P-value |
|---|---|---|
| KOOS JR† | ||
| KOOS JR score | −0.530 | < 0.001 |
| Question (1)—Stiffness | 0.372 | < 0.001 |
| Question (2)—Twisting | 0.322 | < 0.001 |
| Question (3)—Straightening | 0.351 | < 0.001 |
| Question (4)—Going up or down | 0.370 | < 0.001 |
| Question (5)—Standing | 0.395 | < 0.001 |
| Question (6)—Rising | 0.406 | < 0.001 |
| Question (7)—Bending | 0.392 | < 0.001 |
| PROMIS-10†† | ||
| Global physical health T-score | −0.161 | < 0.001 |
| Global mental health T-score | 0.024 | 0.433 |
| Global01—General health | 0.024 | 0.434 |
| Global02—General quality of life | −0.027 | 0.381 |
| Global03—General physical health | −0.003 | 0.931 |
| Global04—General mental health | 0.084 | 0.006 |
| Global05—General satisfaction on social activities | −0.013 | 0.671 |
| Global09—General carrying out of social activities | −0.112 | < 0.001 |
| Global06—Carrying out of physical activities | −0.135 | < 0.001 |
| Global10—Emotional problems | 0.007 | 0.809 |
| Global08—Fatigue | −0.104 | 0.001 |
| Global07—Pain | −0.266 | < 0.001 |
†Questions: How severe is your knee stiffness after (1) first wakening in the morning, (2) twisting or pivoting on your knee, (3) straightening your knee fully, (4) going up or down stairs, (5) standing upright, (6) rising from sitting, and (7) bending to the floor to pick up an object
††Global01: In general, how would you say your health is?; Global02: In general, how would you say your quality of life is?; Global03: In general, how would you rate your physical health?; Global04: In general, how would you rate your mental health, including your mood and your ability to think?; Global05: In general, how would you rate your satisfaction with your social activities and relationships?; Global06: To what extent are you able to carry out your everyday physical activities?; Global07: How would you rate your pain on average?; Global08: How would you rate your fatigue on average?; Global09: In general, please rate how well you carry out your usual social activities and roles; Global10: How often have you been bothered by emotional problems such as feeling anxious, depressed, or irritable?
KOOS JR Knee Disability and Osteoarthritis Outcome Score Joint Replacement, PROMIS-10 Patient-Reported Outcomes Measurement Information System-10
Statistical analysis
Descriptive analyses were first conducted, including (1) examining the univariate association of each variable with the delta and (2) visualizing the preoperative scores (i.e., KOOS JR score and PROMIS-10 global physical health T-score) and the outcomes. Significant variables were identified using t-test for binary variables, analysis of variance (ANOVA) for categorical variables, and Pearson’s correlation test for continuous variables with an alpha level of P < 0.05.
Subsequently, machine-learning models were developed to predict the failure to achieve the MCIDs and SCB, respectively. Analyses were separated into prediction evaluation and risk factor identification. Prediction evaluation demonstrated how well models predict the outcomes within the data, while risk factor identification demonstrated what preoperative variables should be considered. For model evaluation, the entire dataset was split into a training set (i.e., for model building) and a test set (i.e., for assessments) in a 4:1 ratio [40]. Machine-learning models included penalized logistic regression (PLR) as a linear model, support vector machine (SVM) with polynomial and radial kernels as nonlinear models, and random forest (RF) and extreme gradient boosting (XGBoost) as nonparametric models. Deep-learning models and class balancing techniques were not considered for this analysis owing to the limited sample size [41, 42].
Regarding model specification, we used the least absolute shrinkage and selection operator (LASSO) for PLR models, tuning the penalty weight (λ) through cross-validation [43]. We built SVM models using two different kernels (i.e., polynomial and radial kernels), tuning the cost parameter (i.e., ranging from 1 to 5) [44]. In RF models, we fine-tuned the number of random variables selected at each split (3, 4, and 5) and the number of trees to grow (50, 100, 150, and 200) [45]. For the XGBoost models, optimal hyperparameters were identified for the L2 regularization term on weights (λ, tested at 0.01, 0.1, 0.5, 1, and 2) and the maximum tree depth, which ranged from 3 to 8 [46]. For hyperparameter tuning, we selected the hyperparameter that resulted in the smallest cross-validation error.
The model performances were measured using area under the receiver operating characteristic curve (AUC) and F1 score. The AUC assesses a model’s ability to distinguish between high-risk and low-risk patients [47], whereas the F1 score considers both recall (i.e., accounting for false negatives) and precision (i.e., accounting for false positives), while robustly evaluating machine-learning models for imbalanced outcomes [48]. Since false positives can lead to unnecessary care and false negatives may result in missed treatment opportunities, reporting the F1 score is essential for evaluating the performance of machine-learning models. Unlike the AUC, the F1 score requires a cutoff that divides estimated probabilities into two classes. We obtained the optimal cutoff that maximized the F1 score for the training set and applied the same for the test set [49]. In addition, the model performances were compared with the baselines of the AUC and the F1 score, which were obtained by randomly assigning outcomes with equal probability [50]. Being close to the baseline, such as the fixed value of 0.5 for AUC, indicates no improvement [50, 51]. To calculate the 95% confidence interval (CI) of model performances, the evaluation procedure was repeated 100 times [45].
For risk factor identification, logistic regression model was selected, as the linear models performed comparably well in the data to the RF models (Table 2). According to Occam’s razor [52], simpler models such as linear models are less susceptible to overfitting than complex models such as RF. In addition, the logistic regression model uniquely provides both directions and magnitudes of associations. To identify risk factors, a stepwise variable selection using Akaike information criterion from 81 variables was performed first to prevent overfitting and ensure the models remain generalizable [53]. Then, a logistic regression model was developed including the selected variables for each outcome and considered variables with P < 0.05 as significant [54]. Significant variables that shared commonality for the three outcomes were compared in terms of their direction and magnitude. In addition, an odds ratio (OR) < 1 indicates higher likelihood of achieving an MCID or an SCB, while an OR > 1 indicates a lower likelihood [55]. For the sanity check, a linear regression model with the same variable selection method was built [56]. All statistical analyses were conducted in R, version 4.2 [57], with the following packages: mice [58], glmnet [43], e1707 [59], randomForest [60], xgboost [46], and PROC [61].
Table 2.
Model performances
| Methods | Distribution-based MCID | Anchor-based MCID | SCB | |||
|---|---|---|---|---|---|---|
| AUC (avg [95% CI]) | F1 (avg [95% CI]) | AUC (avg [95% CI]) | F1 (avg [95% CI]) | AUC (avg [95% CI]) | F1 (avg [95% CI]) | |
| Baseline | 0.500 (0.500–0.500) | 0.209 (0.200–0.218) | 0.500 (0.500–0.500) | 0.285 (0.276–0.294) | 0.500 (0.500–0.500) | 0.368 (0.359–0.377) |
| Penalized logistic regression | 0.708 (0.698–0.719) | 0.348 (0.336–0.361) | 0.691 (0.683–0.699) | 0.412 (0.400–0.423) | 0.713 (0.706–0.719) | 0.526 (0.516–0.536) |
| SVM with a polynomial kernel | 0.667 (0.656–0.677) | 0.306 (0.296–0.317) | 0.678 (0.669–0.686) | 0.399 (0.390–0.409) | 0.692 (0.684–0.699) | 0.513 (0.504–0.521) |
| SVM with a radial kernel | 0.658 (0.648–0.668) | 0.301 (0.290–0.312) | 0.670 (0.662–0.679) | 0.392 (0.382–0.403) | 0.701 (0.694–0.708) | 0.521 (0.513–0.529) |
| Random forest | 0.708 (0.698–0.717) | 0.324 (0.309–0.338) | 0.706 (0.698–0.713) | 0.397 (0.384–0.409) | 0.720 (0.713–0.726) | 0.523 (0.514–0.533) |
| XGBoost | 0.706 (0.696–0.716) | 0.308 (0.293–0.323) | 0.693 (0.685–0.700) | 0.372 (0.359–0.385) | 0.691 (0.684–0.698) | 0.486 (0.476–0.497) |
AUC area under the receiver operating characteristic curve, avg average, CI confidence interval, MCID minimal clinically important difference, SCB substantial clinical benefit, SVM support vector machine, XGBoost extreme gradient boosting
Results
We identified 1064 patients who completed both preoperative and postoperative surveys. The cohort was divided into the following four age groups, each representing a quartile of the population: 18–66 years (24.9%), 67–71 years (21.1%), 72–77 years (28.3%), and 78 years or older (25.8%). The average preoperative KOOS JR score significantly differed between age groups (F[3, 1060] = 12.1, P < 0.001), with overall scores increasing across age groups (18–66 = 41.1, 67–71 = 45.7, 72–77 = 46.4, and ≥ 78 = 47.9). There were more female patients (N = 659, 61.9%) than male patients (N = 405, 38.1%), and the population was predominantly White (N = 679, 63.8%; Supplementary Table S1).
Threshold outcomes and change score
Correlation values between the delta and the survey-related variables are presented in Table 1. For all the KOOS JR individual survey items, patients who responded “extreme” were more likely to achieve significant improvement (r = 0.322–0.406, P < 0.001). Conversely, mixed correlations were observed across the PROMIS-10 items: the PROMIS-10 global health physical T-score was negatively correlated with total change (r = −0.161, P < 0.001), whereas Global03 (i.e., “In general, how would you rate your physical health?”) was not (r = 0.003, P = 0.93). Nonetheless, similar to the KOOS JR, responses of “poor” on physical health items were consistently weakly correlated with an increase in the KOOS JR score (r = −0.266 to −0.104, P < 0.001; Global06–08 in Table 1). Patients who responded “excellent” to Global04 (i.e., “In general, how would you rate your mental health, including your mood and your ability to think?”) were likely to experience an increase in their KOOS JR scores (r = 0.084; P = 0.006). In contrast, a higher global mental health T-score was not significantly associated with the score difference (r = 0.024, P = 0.433).
Regarding threshold-based outcomes, the majority of patients (N = 745, 70.0%) achieved all three clinical score thresholds (Fig. 2), with an average change of 30.0 points (first quartile = 16.3; third quartile = 42.2). A small number of patients (N = 49, 4.6%) reported worse scores postoperatively compared with their preoperative scores on the KOOS JR (i.e., change score was negative). Furthermore, the delta and the preoperative score formed a moderately negative correlation (r = −0.530, P < 0.001), and those with a lower preoperative score were more likely to exceed the three outcomes. In addition, 159 patients (14.9%) reached the maximum improvement possible following the TKA, with a postoperative score of 100. Of 1064 patients, 145 (13.6%) did not achieve the distribution-based MCID, 216 (20.3%) did not achieve the anchor-based MCID, and 319 (30.0%) patients did not achieve the SCB.
Fig. 2.
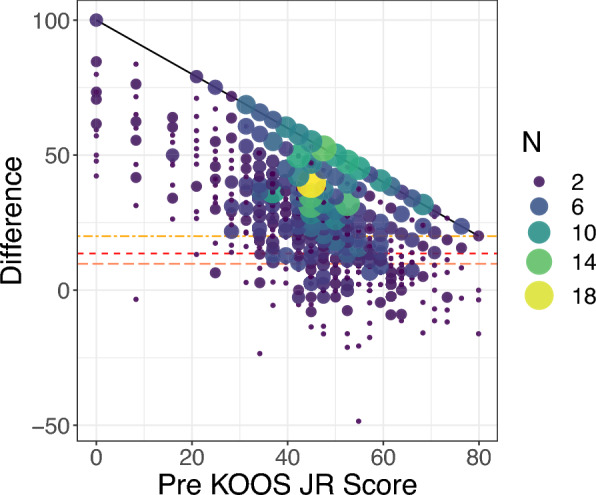
Relationships between the change in KOOS JR scores and the preoperative KOOS JR score. Changes below the three different horizontal lines are considered a failure to achieve the corresponding outcomes: the distribution-based MCID (the bottom horizontal line), the anchor-based MCID (middle), and the SCB (top). Diagonal (asymptotic) line indicates the maximum improvement score given a preoperative score. KOOS JR Knee Disability and Osteoarthritis Outcome Score Joint Replacement, MCID minimal clinically important difference, SCB substantial clinical benefit
We further examined the relationships between the threshold-based outcomes and survey responses on general health and knee-specific function. Figure 3a shows that patients who reached each threshold tended to have a statistically significantly lower preoperative KOOS JR score (P < 0.001) than those who did not attain each achievement. In contrast, little to no difference existed in the PROMIS-10 global physical health T-scores between patients who met the thresholds and those who did not (i.e., distribution- and anchor-based MCID: P = 0.21 and 0.38; SCB: P = 0.002, Fig. 3b). However, when two preoperative scores were visualized together, as shown in Fig. 3c, those with a higher preoperative PROMIS-10 global physical health T-score when conditioning on the same preoperative KOOS JR score were more likely to achieve all the outcomes. Among patients who were top performers on the KOOS JR scores (i.e., KOOS JR ≥ 52.5; N = 349), those with high PROMIS-10 global physical health T-scores (i.e., PROMIS-10 ≥ 44.9; N = 179) were more likely to exceed the thresholds than those with low T-scores (PROMIS-10 < 44.9; N = 170): 78.2% versus 71.8% for the distribution-based MCID, 72.1% versus 58.8% for the anchor-based MCID, and 58.1% versus 43.5% for the SCB.
Fig. 3.

Relationships between the preoperative scores and the threshold-based outcomes. a Relationships between the preoperative KOOS JR score and the threshold-based outcomes. b Relationships between the preoperative PROMIS-10 global physical T-score and the threshold-based outcomes. c Relationships between the preoperative PROMIS-10 global physical T-score and the preoperative KOOS JR score across the threshold-based outcomes. KOOS JR Knee Disability and Osteoarthritis Outcome Score Joint Replacement, MCID minimal clinically important difference, PROMIS-10 Patient-Reported Outcomes Measurement Information System-10, SCB substantial clinical benefit
Predictive analyses
For evaluation purposes, five separate models were built using the entire covariate set. All method performances in terms of the AUC and F1 score for the three threshold-based outcomes (i.e., distribution-based MCID, anchor-based MCID, and SCB) are presented in Table 2. Both the PLR and RF models were identified to produce close to or exceed the 0.70 AUC, which is considered as acceptable AUC in literature [47, 62], for all the three outcomes (i.e., averages [95% CI] for distribution-based MCID = 0.708 [0.698–0.719]; anchor-based MCID = 0.691–0.706 [0.683–0.713]; SCB = 0.713–0.720 [0.706–0.726]). However, as presented in Supplementary Table S2, RF models suffered from overfitting, meaning they performed well on the training set but significantly worse on the test set. Furthermore, F1 scores from the PLR models surpassed those from the others and the baseline for all the outcomes (averages [95% CI] for distribution-based MCID = 0.348 [0.336–0.361]; anchor-based MCID = 0.412 [0.400–0.423]; SCB = 0.526 [0.516–0.536]). Supplementary Table S3 presents the recall and precision performance of the models, and the recall exceeded the precision across most cases.
We identified risk factors for the MCIDs and the SCB using logistic regression with a stepwise variable selection. These significant risk factors for the three PROMs, along with risk factors for the delta, were obtained from a linear regression model and are shown in Fig. 4 and presented in Supplementary Tables S4–S7. Risk factors selected were for either (1) all the three threshold-based outcomes or (2) any two threshold-based outcomes and the delta. As such, a total of six shared risk factors were identified; three were specific to PROMs (i.e., pre-KOOS JR, pre-PROMIS-10 physical T-score, pre-PROMIS-10 mental T-score), one specific to medication (i.e., antidepressants), one specific to demographics (i.e., age), and one specific to preoperative care (i.e., KL grade).
Fig. 4.

Shared risk factors across the three threshold-based outcomes. An odds ratio > 1 indicates that the factor is associated with a higher likelihood of not achieving the outcome, while an odds ratio < 1 suggests a higher likelihood of achieving the outcome. For instance, patients with a high preoperative KOOS JR score are more likely to not achieve the MCDs and the SCB, whereas those with a high preoperative PROMIS-10 global physical T-score are more likely to achieve the outcomes. KL score Kellgren–Lawrence score, KOOS JR Knee Disability and Osteoarthritis Outcome Score Joint Replacement, MCID minimal clinically important difference, PROMIS-10 Patient-Reported Outcomes Measurement Information System-10, SCB substantial clinical benefit
In the preoperative PROM category, a higher preoperative KOOS JR score was associated with poorer outcomes (ORs = 1.063–1.139; 95% confidence interval [CI] 1.034–1.179). In contrast, higher PROMIS-10 global physical health T-scores (ORs = 0.899–0.938; 95% CI 0.852–0.974) and better responses on the individual PROMIS-10 questionnaire item “In general, how would you rate your mental health, including your mood and your ability to think?” (ORs = 0.756–0.818; 95% CI 0.612–0.989) were positively associated with the achievements of the MCIDs and the SCB. These findings are consistent with the results shown in Fig. 3c.
Of the variables collected within the demographics, medication, and preoperative care categories, a higher KL grade was linked to better threshold-based outcomes (ORs = 0.338–0.435; 95% CI 0.205–0.756). Moreover, patients who had been prescribed antidepressants were more likely to achieve the anchor-based MCID and SCB (ORs = 0.446–0.504; 95% CI 0.216–0.960). Finally, the older age group of patients (i.e., 72 years and older), despite having a higher preoperative KOOS JR score (i.e., 72–77 years = 46.4 points and ≥ 78 years = 47.9 points), were more likely to achieve the MCIDs and the SCB (ORs = 0.486–0.556; 95% CI 0.288–0.903; Supplementary Tables S3–S5).
Discussion
Prediction of not achieving the threshold-based outcomes
Understanding the ability of patients undergoing TKA to achieve meaningful changes in disease-specific PROMs is growing ever more important for clinicians as well as policymakers, while PROM performance measures increase in importance for shared decision-making [63], quality reporting [64], and reimbursement models [65, 66]. Upon the descriptive analyses and identification of the reliable machine-learning models, the reliable preoperative identification for patients at high risk for not meeting the threshold-based outcomes was enabled (i.e., distribution-based and anchor-based MCID and the SCB). Such identification can create opportunities for improved shared decision-making preoperatively and improve risk stratification and risk adjustment for those charged with adjudicating quality of care processes for surgeons performing TKA (e.g., CMS, commercial payers, and quality-assessing organizations) [47, 62].
Risk factors beyond preoperative KOOS JR score
The current prediction models demonstrate that patients who reported having a “better functioning” knee prior to surgery, as indicated by an overall higher score on the KOOS JR, were more likely to not meet the MCIDs, which aligns with prior studies [28, 33, 34, 67–69], and moreover, the SCB. The current study, however, provides further depth on the importance of preoperative PROMs (i.e., not just the KOOS JR score independently) to add power for identifying unique patient cohorts with different risk levels for poor outcomes following a TKA. In the current descriptive analysis (Fig. 3a–c), we identified the relationships between the changes in the total KOOS JR score and several individual survey items in both the PROMIS-10 and KOOS JR (Table 1). Furthermore, the current prediction model identified that patients who reported overall good general physical health (i.e., a high preoperative PROMIS-10 global physical T-score) but poor knee function (i.e., a low preoperative KOOS JR score) were more likely to achieve the two MCIDs and the SCB.
Moreover, using a combination of PROMs, demographics, comorbidities, and medical histories collected preoperatively, rather than relying solely on the KOOS JR score, gains a holistic view of a patient’s health state and risk factors. Our models identified that older patients were more likely to succeed in achievement of the TKA-related MCIDs and SCB when compared with younger patients; these findings are consistent with previous reported findings of patients aged 55–90 years having reported overall better outcomes postoperatively compared with those aged 19–54 years [70]. Though older patients here reported relatively high preoperative KOOS JR scores, relying solely on these scores for decision-making may misleadingly suggest a higher likelihood of not achieving the MCIDs and SCB in this population.
In addition, our predictive models demonstrated that the state of mental health preoperatively, as measured by antidepressant prescription history and PROMIS-10 mental health T-score, was significantly linked to achieving the MCIDs and the SCB cutoff values. Specifically, patients who were previously prescribed antidepressants, rather than those merely diagnosed with depression, were more likely to reach both MCIDs and SCB cutoffs. While depression history was excluded during variable selection, antidepressant prescription history remained and was considered a significant finding. In addition, patients with a high general mental health measured by PROMIS-10 Global04 (“In general, how would you rate your mental health, including your mood and your ability to think?”) were likely to surpass the threshold-based outcomes, which is also consistent in previous studies [71, 72]. Notably, patients’ self-reported mental health offered a valuable patient perspective that antidepressant prescription history alone may not capture, as both factors were retained in our final models and were considered a strong predictor.
Lastly, our model uniquely found that patients with more severe knee osteoarthritis (i.e., as indicated by a higher KL score) were more likely to achieve both MCIDs and SCB. These findings are supported by previous literature in which authors demonstrated that a more severe osteoarthritis (OA) diagnosis preoperatively often results in better pain and functional outcomes following a TKA [73, 74]. Specifically, these findings have been revealed in several studies reporting patients who were diagnosed with more severe OA reported lower preoperative scores on the PROMs and also demonstrated a larger, more significant change in scores preoperatively to postoperatively following a TKA [75]. As such, it is imperative for clinicians to consider all these preoperative patient-specific factors to ensure a more individualized approach to treatment to produce meaningful outcomes measured through the patient perspective.
Model evaluations
Linear models, such as PLR, assume linear relationships between dependent and independent variables, leading to straightforward models and easily interpretable results [56]. Nonlinear models (e.g., SVMs with polynomial and radial kernels) can capture complex relationships between variables but are less interpretable than linear models [44]. Nonparametric models (e.g., random forest and XGBoost) do not rely on any assumption for a specific relationship and are more flexible [76]. However, their results can be more challenging to interpret compared with parametric models, which use parameters to represent these relationships. Compared with linear models, the other two models have a higher risk of overfitting, meaning that they perform well on the training set but worse on the test set, especially when the sample size is small [52]. In our prediction analysis, accounting for the 95% CI of performance metrics, the RF and the PLR demonstrated comparable and superior AUC scores on the test sets compared with the SVMs and the XGBoost. However, considering the potential for overfitting and F1 scores, the PLR could be more robust than the RF.
For the anchor-based MCID, models identified in this study can be compared with models in existing studies [33, 35]; previous authors identified success rates of achieving the MCID ranging from 76% to 82%, which are similar to that identified in the current study (i.e., 80%). The AUCs presented here are also comparable to, or even better than, those in the existing studies (i.e., average AUCs = 0.610–0.760) considering the SD [33, 35]. For the other threshold-based outcomes, a previous study analyzed the distribution-based MCID but used a different short-form version of the KOOS (i.e., Knee Injury and Osteoarthritis Outcome Score–Physical Function Shortform [KOOS-PS]) and not KOOS JR used in this study [34]. However, to our knowledge, minimal literature exists attempting to predict achieving the SCB within the arthroplasty population. Nonetheless, the current models show significant improvements in the AUC for all the three outcomes, increasing up to 46% compared with the baseline AUC. In addition, the F1 scores saw substantial gains, which increased by 70% for the distribution-based MCID, 48% for the anchor-based MCID, and 47% for the SCB, compared with the respective baseline F1 scores. In scenarios where one class predominates, the F1 score tends to be lower owing to the scarcity of positive cases, as seen in the distribution-based MCID. Despite the challenge posed by the challenge of extreme class imbalance, the current predictive models enhanced the prediction of failures, particularly in achieving the distribution-based MCID. Notably, recall performance exceeds precision (Supplementary Table S3), indicating that the models are effective at identifying high-risk patients, albeit with a tendency to occasionally classify low-risk individuals as high risk. This false positive result in the current study may warrant a more in-depth discussion with patients as part of a shared decision-making process and should not negatively impact the care episode. Overall, given acceptable AUCs, our models demonstrate strong performance in identifying at-risk patients across both MCIDs and SCB, with a general inclination to classify patients as positive. This predictive capability can support clinical decision-making based on PROMs.
Limitations
This study is not without limitations that warrant discussion. This study was conducted at a single academic medical center, which may limit the generalizability of the findings and make it challenging to apply them to other settings. Owing to privacy concerns, obtaining data from other institutions is challenging. Consequently, external validation is difficult, and studies on PROMs, including the current study, are primarily single-institution studies [28, 33–35]. We believe meta-analyses combining research findings have the potential to provide more comprehensive conclusions in the future [77].
Moreover, Black patients in this study (11.2%) were less represented than those in the national population (15.4%) [78]. However, bias was not identified in the outcomes within the current data across racial groups (Supplementary Table S8). In addition, the racial factor was not identified as significant, demonstrating that there were no racial differences in achieving the threshold-based outcomes. Nonetheless, future research should collect and incorporate a larger sample from minority groups to minimize the risk of algorithmic bias.
Furthermore, this study did not collect responses to an anchor question from our population and adopted established thresholds for the anchor-based MCID and SCB. Although these thresholds may not be applicable to our study population, the rates at which patients achieved the anchor-based MCID and SCB were similar to other studies [28, 33, 35]. Moreover, for some patients, the absence of a 1-year postoperative survey may be associated with poorer health outcomes (i.e., missing not at random) [79], potentially leading to attrition bias [80].
Lastly, although the machine-learning models identified in the present study are comparable to those in recently published studies [33, 35], the prediction performances are generally only moderate. To improve the capability to distinguish patients, future effort should be devoted to collect more high-quality PROM data and include more preoperative predictors.
Conclusions
This study demonstrates that machine-learning models can predict the achievement of the distribution-based MCID, the anchor-based MCID, and the SCB for TKA procedures using several preoperatively available variables, including those easily obtained through administration of the KOOS JR and PROMIS-10. The PROMIS-10 global physical health T-score and patient age affect the accuracy of the KOOS JR score in predicting score change, which may impact both the surgical decision-making process and post hoc outcome assessment. A tool that incorporates these elements for shared decision-making can provide clinicians with an evidence-based method to counsel patients considering TKA, ultimately improving care delivery and outcomes in this highly utilized intervention.
Supplementary Information
Acknowledgements
Not applicable.
Abbreviations
- ANOVA
Analysis of variance
- ASA
American Society of Anesthesiologists
- BMI
Body mass index
- CCI
Charlson Comorbidity Index
- CMS
Centers for Medicare and Medicaid Services
- EHR
Electronic health record
- KL score
Kellgren–Lawrence score
- KOOS JR
Knee disability and osteoarthritis outcome score joint replacement
- LASSO
Least absolute shrinkage and selection operator
- MCID
Minimal clinically important difference
- OR
Odds ratio
- PROM
Patient-reported outcome measure
- PROMIS-10
Patient-Reported Outcomes Measurement Information System-10
- RF
Random forest
- AUC
Area under the receiver operating characteristic curve
- SCB
Substantial clinical benefit
- SD
Standard deviation
- SVM
Support vector machine
- TKA
Total knee arthroplasty
- XGBoost
Extreme gradient boosting
Author contributions
All authors, J.P., X.Z., E.M., and C.G., developed the study design; J.P. conducted the data analyses and the statistical tests; all authors, J.P., X.Z., E.M., and C.G., interpreted the results; E.M. and J.P. made major contributions to writing the manuscript. All authors, J.P., X.Z., E.M., and C.G., proofread the manuscript and approved the final manuscript.
Funding
Not applicable.
Data availability
The datasets analyzed during the current study are available from the corresponding author on reasonable request.
Declarations
Ethics approval and consent to participate
Ethics approval was obtained from the University of Florida Institutional Review Board (UF IRB no. IRB201901961). The requirement for written informed consent was waived owing to the retrospective nature of the study by the University of Florida Institutional Review Board. All procedures performed in this study were in accordance with the ethical standards of the institutional research committee and with the 1964 Helsinki Declaration and its later amendments.
Consent for publication
Not applicable.
Competing interests
Chancellor F. Gray is a consultant for Smith & Nephew Inc, and a committee member for the AAOS. The other authors declare that they have no competing interests.
Footnotes
Publisher’s Note
Springer Nature remains neutral with regard to jurisdictional claims in published maps and institutional affiliations.
References
- 1.Sayah FA, Lahtinen M, Bonsel GJ, Ohinmaa A, Johnson JA (2021) A multi-level approach for the use of routinely collected patient-reported outcome measures (PROMs) data in healthcare systems. J Patient-Rep Outcomes 5(Suppl 2):98. 10.1186/s41687-021-00375-1 [DOI] [PMC free article] [PubMed] [Google Scholar]
- 2.Wittich L, Tsatsaronis C, Kuklinski D et al (2024) Patient-reported outcome measures as an intervention: a comprehensive overview of systematic reviews on the effects of feedback. Value Health 27(10):1436–1453. 10.1016/j.jval.2024.05.013 [DOI] [PubMed] [Google Scholar]
- 3.Chen J, Ou L, Hollis SJ (2013) A systematic review of the impact of routine collection of patient reported outcome measures on patients, providers and health organisations in an oncologic setting. BMC Health Serv Res 13(1):211. 10.1186/1472-6963-13-211 [DOI] [PMC free article] [PubMed] [Google Scholar]
- 4.Ziegenfuss JY, Grossman ES, Solberg LI et al (2022) Is the promise of PROMs being realized? Implementation experience in a large orthopedic practice. Am J Med Qual 37(6):489. 10.1097/JMQ.0000000000000079 [DOI] [PubMed] [Google Scholar]
- 5.Kotronoulas G, Kearney N, Maguire R et al (2014) What is the value of the routine use of patient-reported outcome measures toward improvement of patient outcomes, processes of care, and health service outcomes in cancer care? A systematic review of controlled trials. J Clin Oncol 32(14):1480–1501. 10.1200/JCO.2013.53.5948 [DOI] [PubMed] [Google Scholar]
- 6.Baumhauer JF (2017) Patient-reported outcomes—Are they living up to their potential? N Engl J Med 377(1):6–9. 10.1056/NEJMp1702978 [DOI] [PubMed] [Google Scholar]
- 7.Ehlers AP, Khor S, Cizik AM et al (2017) Use of patient-reported outcomes and satisfaction for quality assessments. Am J Manag Care 23(10):618–622 [PMC free article] [PubMed] [Google Scholar]
- 8.Oliver BJ, Nelson EC, Kerrigan CL (2019) Turning feed-forward and feedback processes on patient-reported data into intelligent action and informed decision-making: case studies and principles. Med Care 57:S31–S37. 10.1097/MLR.0000000000001088 [DOI] [PubMed] [Google Scholar]
- 9.Chrenka EA, Solberg LI, Asche SE et al (2022) Is shared decision-making associated with better patient-reported outcomes? A longitudinal study of patients undergoing total joint arthroplasty. Clin Orthop 480(1):82–91. 10.1097/CORR.0000000000001920 [DOI] [PMC free article] [PubMed] [Google Scholar]
- 10.Lyman S, Lee YY, McLawhorn AS, Islam W, MacLean CH (2018) What are the minimal and substantial improvements in the HOOS and KOOS and JR versions after total joint replacement? Clin Orthop 476(12):2432. 10.1097/CORR.0000000000000456 [DOI] [PMC free article] [PubMed] [Google Scholar]
- 11.Jaeschke R, Singer J, Guyatt GH (1989) Measurement of health status. Ascertaining the minimal clinically important difference. Control Clin Trials 10(4):407–415. 10.1016/0197-2456(89)90005-6 [DOI] [PubMed] [Google Scholar]
- 12.Plate JF, Deen JT, Deans CF, Pour AE, Yates AJ, Sterling RS (2024) Implementation of the new Medicare-mandated patient-reported outcomes after joint arthroplasty performance measure. J Arthroplasty 39(5):1136–1139. 10.1016/j.arth.2024.01.038 [DOI] [PubMed] [Google Scholar]
- 13.Glassman SD, Copay AG, Berven SH, Polly DW, Subach BR, Carreon LY (2008) Defining substantial clinical benefit following lumbar spine arthrodesis. J Bone Joint Surg 90(9):1839. 10.2106/JBJS.G.01095 [DOI] [PubMed] [Google Scholar]
- 14.Martin RL, Kivlan BR, Christoforetti JJ et al (2019) Minimal clinically important difference and substantial clinical benefit values for the 12-item international hip outcome tool. Arthrosc J Arthrosc Relat Surg 35(2):411–416. 10.1016/j.arthro.2018.09.028 [DOI] [PubMed] [Google Scholar]
- 15.Lizaur-Utrilla A, Gonzalez-Parreño S, Martinez-Mendez D, Miralles-Muñoz FA, Lopez-Prats FA (2020) Minimal clinically important differences and substantial clinical benefits for Knee Society Scores. Knee Surg Sports Traumatol Arthrosc 28(5):1473–1478. 10.1007/s00167-019-05543-x [DOI] [PubMed] [Google Scholar]
- 16.Pasqualini I, Piuzzi NS (2024) New CMS policy on the mandatory collection of patient-reported outcome measures for total hip and knee arthroplasty by 2027: what orthopaedic surgeons should know. J Bone Jt Surg 106(13):1233–1241. 10.2106/JBJS.23.01013 [DOI] [PubMed] [Google Scholar]
- 17.Mandatory CMS inpatient THA/TKA PRO-PM frequently asked questions. https://www.aaos.org/globalassets/quality-and-practice-resources/patient-reported-outcome-measures/pro-pm-frequently-asked-questions-fact-sheet.pdf. Accessed 22 July 2024.
- 18.Gagnier JJ (2017) Patient reported outcomes in orthopaedics. J Orthop Res 35(10):2098–2108. 10.1002/jor.23604 [DOI] [PubMed] [Google Scholar]
- 19.Rong G, Mendez A, Bou Assi E, Zhao B, Sawan M (2020) Artificial intelligence in healthcare: review and prediction case studies. Engineering 6(3):291–301. 10.1016/j.eng.2019.08.015 [Google Scholar]
- 20.Stiglic G, Kocbek P, Fijacko N, Zitnik M, Verbert K, Cilar L (2020) Interpretability of machine learning-based prediction models in healthcare. WIREs Data Min Knowl Discov 10(5):e1379. 10.1002/widm.1379 [Google Scholar]
- 21.Ng K, Sun J, Hu J, Wang F (2015) Personalized predictive modeling and risk factor identification using patient similarity. AMIA Summits Transl Sci Proc 2015:132–136 [PMC free article] [PubMed] [Google Scholar]
- 22.Mohammadi R, Jain S, Namin AT et al (2020) Predicting unplanned readmissions following a hip or knee arthroplasty: retrospective observational study. JMIR Med Inform 8(11):e19761. 10.2196/19761 [DOI] [PMC free article] [PubMed] [Google Scholar]
- 23.Park J, Zhong X, Miley EN et al (2024) Machine learning-based predictive models for 90-day readmission of total joint arthroplasty using comprehensive electronic health records and patient-reported outcome measures. Arthroplasty Today 25:101308. 10.1016/j.artd.2023.101308 [DOI] [PMC free article] [PubMed] [Google Scholar]
- 24.Klemt C, Tirumala V, Barghi A, Cohen-Levy WB, Robinson MG, Kwon YM (2022) Artificial intelligence algorithms accurately predict prolonged length of stay following revision total knee arthroplasty. Knee Surg Sports Traumatol Arthrosc 30(8):2556–2564. 10.1007/s00167-022-06894-8 [DOI] [PubMed] [Google Scholar]
- 25.Park J, Zhong X, Miley EN, Gray CF (2023) Preoperative prediction and risk factor identification of hospital length of stay for total joint arthroplasty patients using machine learning. Arthroplasty Today 22:101166. 10.1016/j.artd.2023.101166 [DOI] [PMC free article] [PubMed] [Google Scholar]
- 26.Osteoarthritis & Joint Replacement Outcome Surveys | HSS. Hospital for special surgery. https://www.hss.edu/hoos-jr-koos-jr-outcomes-surveys.asp. Accessed 6 July 2022
- 27.PROMIS. https://www.healthmeasures.net/index.php?option=com_content&view=category&layout=blog&id=147&Itemid=806. Accessed 11 July 2023
- 28.Fontana MA, Lyman S, Sarker GK, Padgett DE, MacLean CH (2019) Can machine learning algorithms predict which patients will achieve minimally clinically important differences from total joint arthroplasty? Clin Orthop 477(6):1267–1279. 10.1097/CORR.0000000000000687 [DOI] [PMC free article] [PubMed] [Google Scholar]
- 29.PROMIS global health scoring manual. https://www.healthmeasures.net/images/PROMIS/manuals/Scoring_Manuals_/PROMIS_Global_Health_Scoring_Manual.pdf. Accessed 14 Aug 2024
- 30.Wu H, Leung SO (2017) Can likert scales be treated as interval scales?—A simulation study. J Soc Serv Res 43(4):527–532. 10.1080/01488376.2017.1329775 [Google Scholar]
- 31.Wright A, Hannon J, Hegedus EJ, Kavchak AE (2012) Clinimetrics corner: a closer look at the minimal clinically important difference (MCID). J Man Manip Ther 20(3):160. 10.1179/2042618612Y.0000000001 [DOI] [PMC free article] [PubMed] [Google Scholar]
- 32.Franceschini M, Boffa A, Pignotti E, Andriolo L, Zaffagnini S, Filardo G (2023) The minimal clinically important difference changes greatly based on the different calculation methods. Am J Sports Med 51(4):1067–1073. 10.1177/03635465231152484 [DOI] [PMC free article] [PubMed] [Google Scholar]
- 33.Harris AHS, Kuo AC, Bowe TR, Manfredi L, Lalani NF, Giori NJ (2021) Can machine learning methods produce accurate and easy-to-use preoperative prediction models of one-year improvements in pain and functioning after knee arthroplasty? J Arthroplasty 36(1):112-117.e6. 10.1016/j.arth.2020.07.026 [DOI] [PubMed] [Google Scholar]
- 34.Katakam A, Karhade AV, Collins A et al (2022) Development of machine learning algorithms to predict achievement of minimal clinically important difference for the KOOS-PS following total knee arthroplasty. J Orthop Res 40(4):808–815. 10.1002/jor.25125 [DOI] [PubMed] [Google Scholar]
- 35.Langenberger B, Schrednitzki D, Halder AM, Busse R, Pross CM (2023) Predicting whether patients will achieve minimal clinically important differences following hip or knee arthroplasty. Bone Joint Res 12(9):512–521. 10.1302/2046-3758.129.BJR-2023-0070.R2 [DOI] [PMC free article] [PubMed] [Google Scholar]
- 36.Doyle DJ, Hendrix JM, Garmon EH (2024) American Society of Anesthesiologists classification. In: StatPearls. StatPearls Publishing. http://www.ncbi.nlm.nih.gov/books/NBK441940/. Accessed 19 Nov 2024 [PubMed]
- 37.Macri EM, Runhaar J, Damen J, Oei EHG, Bierma-Zeinstra SMA (2022) Kellgren/Lawrence grading in cohort studies: methodological update and implications illustrated using data from a Dutch hip and knee cohort. Arthritis Care Res 74(7):1179–1187. 10.1002/acr.24563 [DOI] [PMC free article] [PubMed] [Google Scholar]
- 38.O’Brien SM (2004) Cutpoint selection for categorizing a continuous predictor. Biometrics 60(2):504–509. 10.1111/j.0006-341X.2004.00196.x [DOI] [PubMed] [Google Scholar]
- 39.Weir CB, Jan A (2024) BMI classification percentile and cut off points. In: StatPearls. StatPearls Publishing. http://www.ncbi.nlm.nih.gov/books/NBK541070/. Accessed 19 Nov 2024 [PubMed]
- 40.Kahloot KM, Ekler P (2021) Algorithmic splitting: a method for dataset preparation. IEEE Access 9:125229–125237. 10.1109/ACCESS.2021.3110745 [Google Scholar]
- 41.Vabalas A, Gowen E, Poliakoff E, Casson AJ (2019) Machine learning algorithm validation with a limited sample size. PLoS ONE 14(11):e0224365. 10.1371/journal.pone.0224365 [DOI] [PMC free article] [PubMed] [Google Scholar]
- 42.Fernández A, García S, Galar M, Prati RC, Krawczyk B, Herrera F (2018) Learning from imbalanced data sets. Springer, Berlin [Google Scholar]
- 43.Friedman JH, Hastie T, Tibshirani R (2010) Regularization paths for generalized linear models via coordinate descent. J Stat Softw 33:1–22. 10.18637/jss.v033.i01 [PMC free article] [PubMed] [Google Scholar]
- 44.Awad M, Khanna R (2015) Support vector machines for classification. In: Awad M, Khanna R (eds) Efficient learning machines: theories, concepts, and applications for engineers and system designers. Apress, New York, pp 39–66 [Google Scholar]
- 45.Raschka S. Model evaluation, model selection, and algorithm selection in machine learning. Published online November 10, 2020. http://arxiv.org/abs/1811.12808. Accessed 14 Aug 2024
- 46.Chen T, Guestrin C (2016) XGBoost: a scalable tree boosting system. In: Proceedings of the 22nd ACM SIGKDD International Conference on Knowledge Discovery and Data Mining. KDD ’16. Association for Computing Machinery, 2016:785–794. 10.1145/2939672.2939785
- 47.de Hond AAH, Steyerberg EW, van Calster B (2022) Interpreting area under the receiver operating characteristic curve. Lancet Digit Health 4(12):e853–e855. 10.1016/S2589-7500(22)00188-1 [DOI] [PubMed] [Google Scholar]
- 48.Thölke P, Mantilla-Ramos YJ, Abdelhedi H et al (2023) Class imbalance should not throw you off balance: choosing the right classifiers and performance metrics for brain decoding with imbalanced data. Neuroimage 277:120253. 10.1016/j.neuroimage.2023.120253 [DOI] [PubMed] [Google Scholar]
- 49.Lipton ZC, Elkan C, Naryanaswamy B (2014) Optimal thresholding of classifiers to maximize F1 measure. Mach Learn Knowl Discov Databases Eur Conf ECML PKDD 8725:225–239. 10.1007/978-3-662-44851-9_15 [DOI] [PMC free article] [PubMed] [Google Scholar]
- 50.Çorbacıoğlu ŞK, Aksel G (2023) Receiver operating characteristic curve analysis in diagnostic accuracy studies: a guide to interpreting the area under the curve value. Turk J Emerg Med 23(4):195–198. 10.4103/tjem.tjem_182_23 [DOI] [PMC free article] [PubMed] [Google Scholar]
- 51.Verbakel JY, Steyerberg EW, Uno H et al (2020) ROC curves for clinical prediction models part 1. ROC plots showed no added value above the AUC when evaluating the performance of clinical prediction models. J Clin Epidemiol 126:207–216. 10.1016/j.jclinepi.2020.01.028 [DOI] [PubMed] [Google Scholar]
- 52.Domingos P (1999) The role of Occam’s razor in knowledge discovery. Data Min Knowl Discov 3(4):409–425. 10.1023/A:1009868929893 [Google Scholar]
- 53.Heinze G, Wallisch C, Dunkler D (2018) Variable selection – A review and recommendations for the practicing statistician. Biom J 60(3):431–449. 10.1002/bimj.201700067 [DOI] [PMC free article] [PubMed] [Google Scholar]
- 54.Zhang Z (2016) Variable selection with stepwise and best subset approaches. Ann Transl Med 4(7):136. 10.21037/atm.2016.03.35 [DOI] [PMC free article] [PubMed] [Google Scholar]
- 55.Tenny S, Hoffman MR (2024) Odds ratio. In: StatPearls. StatPearls Publishing. http://www.ncbi.nlm.nih.gov/books/NBK431098/. Accessed 19 Nov 2024 [PubMed]
- 56.Montgomery DC, Peck EA, Vining GG (2021) Introduction to linear regression analysis. John Wiley & Sons, Hoboken [Google Scholar]
- 57.R Core Team (2020) R: a language and environment for statistical computing. R Foundation for Statistical Computing. https://www.R-project.org/
- 58.van Buuren S, Groothuis-Oudshoorn K (2011) mice: multivariate imputation by chained equations in R. J Stat Softw 45:1–67. 10.18637/jss.v045.i03 [Google Scholar]
- 59.Meyer D, Dimitriadou E, Hornik K, et al. e1071: Misc functions of the Department of Statistics, Probability Theory Group (formerly: E1071), TU Wien. Published online September 16, 2021. https://CRAN.R-project.org/package=e1071. Accessed 25 Jan 2022
- 60.Breiman L (2001) Random forests. Mach Learn 45(1):5–32. 10.1023/A:1010933404324 [Google Scholar]
- 61.Robin X, Turck N, Hainard A et al (2011) pROC: an open-source package for R and S+ to analyze and compare ROC curves. BMC Bioinformatics 12(1):77. 10.1186/1471-2105-12-77 [DOI] [PMC free article] [PubMed] [Google Scholar]
- 62.Hosmer DW, Lemeshow S, Sturdivant RX (2013) Applied logistic regression. John Wiley & Sons, Hoboken [Google Scholar]
- 63.Damman OC, Jani A, de Jong BA et al (2020) The use of PROMs and shared decision-making in medical encounters with patients: an opportunity to deliver value-based health care to patients. J Eval Clin Pract 26(2):524–540. 10.1111/jep.13321 [DOI] [PMC free article] [PubMed] [Google Scholar]
- 64.Ayers DC (2017) Implementation of patient-reported outcome measures in total knee arthroplasty. J Am Acad Orthop Surg 25(Suppl 1):S48–S50. 10.5435/JAAOS-D-16-00631 [DOI] [PubMed] [Google Scholar]
- 65.Chen DQ, Parvataneni HK, Miley EN et al (2023) Lessons learned from the comprehensive care for joint replacement model at an academic tertiary center: the good, the bad, and the ugly. J Arthroplasty 38:S54–S62. 10.1016/j.arth.2023.02.014 [DOI] [PMC free article] [PubMed] [Google Scholar]
- 66.Ghoshal S, Harary J, Jay JF et al (2024) Evaluating patient-reported outcome measure collection and attainment of substantial clinical benefit in total joint arthroplasty patients. J Arthroplasty. 10.1016/j.arth.2024.11.044 [DOI] [PubMed] [Google Scholar]
- 67.Huber M, Kurz C, Leidl R (2019) Predicting patient-reported outcomes following hip and knee replacement surgery using supervised machine learning. BMC Med Inform Decis Mak 19(1):3. 10.1186/s12911-018-0731-6 [DOI] [PMC free article] [PubMed] [Google Scholar]
- 68.Zhang S, Lau BPH, Ng YH, Wang X, Chua W (2022) Machine learning algorithms do not outperform preoperative thresholds in predicting clinically meaningful improvements after total knee arthroplasty. Knee Surg Sports Traumatol Arthrosc 30(8):2624–2630. 10.1007/s00167-021-06642-4 [DOI] [PubMed] [Google Scholar]
- 69.Kunze KN, Karhade AV, Sadauskas AJ, Schwab JH, Levine BR (2020) Development of machine learning algorithms to predict clinically meaningful improvement for the patient-reported health state after total hip arthroplasty. J Arthroplasty 35(8):2119–2123. 10.1016/j.arth.2020.03.019 [DOI] [PubMed] [Google Scholar]
- 70.Miley EN, Pickering MA, Cheatham SW, Larkins L, Cady AC, Baker RT (2024) Psychometric analysis of the hip disability and osteoarthritis outcome score joint replacement (HOOS-JR). Osteoarthritis Cartilage Open 6(1):100435. 10.1016/j.ocarto.2024.100435 [DOI] [PMC free article] [PubMed] [Google Scholar]
- 71.Lavernia CJ, Alcerro JC, Brooks LG, Rossi MD (2012) Mental health and outcomes in primary total joint arthroplasty. J Arthroplasty 27(7):1276–1282. 10.1016/j.arth.2011.11.015 [DOI] [PubMed] [Google Scholar]
- 72.Moghtadaei M, Yeganeh A, Hosseinzadeh N et al (2020) The impact of depression, personality, and mental health on outcomes of total knee arthroplasty. Clin Orthop Surg 12(4):456–463. 10.4055/cios19148 [DOI] [PMC free article] [PubMed] [Google Scholar]
- 73.Hoorntje A, Witjes S, Koenraadt KLM, Aarts R, de Weert T, van Geenen RCI (2018) More severe preoperative Kellgren–Lawrence grades of knee osteoarthritis were partially associated with better postoperative patient-reported outcomes in TKA patients. J Knee Surg 32:211–217. 10.1055/s-0038-1635114 [DOI] [PubMed] [Google Scholar]
- 74.Batailler C, Lording T, De Massari D, Witvoet-Braam S, Bini S, Lustig S (2021) Predictive models for clinical outcomes in total knee arthroplasty: a systematic analysis. Arthroplasty Today 9:1–15. 10.1016/j.artd.2021.03.013 [DOI] [PMC free article] [PubMed] [Google Scholar]
- 75.Kahn TL, Soheili A, Schwarzkopf R (2013) Outcomes of total knee arthroplasty in relation to preoperative patient-reported and radiographic measures: data from the osteoarthritis initiative. Geriatr Orthop Surg Rehabil 4(4):117–126. 10.1177/2151458514520634 [DOI] [PMC free article] [PubMed] [Google Scholar]
- 76.Krennmair P, Schmid T (2022) Flexible domain prediction using mixed effects random forests. J R Stat Soc Ser C Appl Stat 71(5):1865–1894. 10.1111/rssc.12600 [Google Scholar]
- 77.Crespi CM, Cobian KP (2022) A meta-analysis approach for evaluating the effectiveness of complex multisite programs. New Dir Eval 2022(174):47–56. 10.1002/ev.20508 [DOI] [PMC free article] [PubMed] [Google Scholar]
- 78.U.S. Census Bureau quickFacts: United States. https://www.census.gov/quickfacts/fact/table/US. Accessed 9 May 2025
- 79.Mack C, Su Z, Westreich D (2019) Managing missing data in patient registries: addendum to registries for evaluating patient outcomes: a user’s guide, third edition. Agency for Healthcare Research and Quality (US). http://www.ncbi.nlm.nih.gov/books/NBK493611/. Accessed 19 Nov 2024 [PubMed]
- 80.Nunan D, Aronson J, Bankhead C (2018) Catalogue of bias: attrition bias. BMJ Evidence-Based Med 23(1):21–22. 10.1136/ebmed-2017-110883 [DOI] [PubMed] [Google Scholar]
Associated Data
This section collects any data citations, data availability statements, or supplementary materials included in this article.
Supplementary Materials
Data Availability Statement
The datasets analyzed during the current study are available from the corresponding author on reasonable request.