Abstract
A rice spotted leaf (lesion-mimic) gene, Spl7, was identified by map-based cloning. High-resolution mapping with cleaved amplified polymorphic sequence markers enabled us to define a genomic region of 3 kb as a candidate for Spl7. We found one ORF that showed high similarity to a heat stress transcription factor (HSF). Transgenic analysis verified the function of the candidate gene for Spl7: leaf spot development was suppressed in spl7 mutants with a wild-type Spl7 transgene. Thus, we conclude that Spl7 encodes the HSF protein. The transcript of spl7 was observed in mutant plants. The levels of mRNAs (Spl7 in wild type and spl7 in mutant) increased under heat stress. Sequence analysis revealed only one base substitution in the HSF DNA-binding domain of the mutant allele, causing a change from tryptophan to cysteine.
Throughout its life cycle, a plant is subject to various kinds of abiotic environmental stresses, including water, temperature, light, and soil. These stresses can cause various types of physiological damage in plants. Because they cannot move, plants can defend themselves against such stresses only by making metabolic and structural adjustments. To achieve this defense, genes need to be expressed in response to a stress stimulus to induce or suppress the production of specific proteins, such as heat shock proteins (HSPs). Thus, plants develop stress tolerance at the cellular level. If there is a defect in such a system, cells may have trouble surviving. Many studies of plant stress tolerance have been performed (1). However, the molecular mechanisms preventing cell death from various environmental stresses are very complicated and are controlled by many genes; further information is needed.
Mutants inducing spontaneous cell death during growth have been reported in various plants, including maize, Arabidopsis, barley, and rice (2, 3). The mutants are called disease lesion mimics, because their phenotypes resemble either disease symptoms or pathogen-inducible, hypersensitive-response cell death (4). Several genes controlling lesion-mimic phenotypes have been identified. For example, Arabidopsis LSD1 encodes a small novel protein containing three putative zinc finger domains (5), and it negatively regulates cell death by inhibiting signals from superoxide production (6). Mlo of barley probably encodes a novel class of plant-specific proteins with seven integral transmembrane-spanning helices (7, 8), functioning as a negative regulator of cell death. Maize Lls1 encodes a protein with two conserved binding motifs resembling those found in aromatic-ring-hydroxylating dioxygenases that might inhibit cell death by degrading a phenolic mediator of cell death (9). RP1 in maize encodes an NBS-LRR (nucleotide binding site–leucine-rich repeat)-type resistance protein (10). All of these gene mutants had improved resistance to pathogens when lesions developed (5, 11–13). This fact suggests that these genes are related to the control of cell death in the pathogen-defense response in plants.
However, most lesion-mimic mutants are caused by physiological alterations and are not directly associated with defense response (14). For example, the Arabidopsis acd1 mutant shows enhanced lesion formation upon pathogen infection or abiotic stress and is susceptible to opportunistic leaf pathogens (15). The light-dependent lesion-mimic mutant gene Les22 in maize encodes uroporphyrinogen decarboxylase, a key enzyme in the biosynthetic pathway of tetrapyrroles (chlorophyll and heme; ref. 16). In rice, several leaf spot mutants have been identified so far. Each phenotype is controlled by a single recessive spl (spotted leaf) gene (3). So far, 10 spl loci have been mapped on the rice chromosomes (17, 18). The appearance of mutant phenotypes is often influenced by environmental conditions, such as high temperature and solar radiation (3, 19). Recently, nine spl mutants were characterized with resistance to pathogens (20). An spl7 mutant plant was susceptible to several pathogens and showed very low expression of the five genes strongly correlated with the onset of defense response. spl7 lesions could not be readily triggered by mechanical wounding. Thus, the lesion formation of spl7 might not be directly associated with hypersensitive-response cell death. Rather, it seems to be necrosis caused by environmental stresses.
As a first step in clarifying the molecular mechanisms involved in environmental stress tolerance, we undertook the positional cloning of the spotted leaf gene Spl7 in rice. We demonstrate here that Spl7 encodes a heat stress transcription factor (HSF) protein. We also discuss the role of Spl7 in making plants tolerant to cell death caused by environmental stresses, such as high temperature.
Materials and Methods
Plant Materials and Phenotyping.
An spl7 mutant line, KL210, was induced from the rice japonica cultivar Norin 8 in a γ-ray field (3). Spl7 is located on chromosome 5 (18). The mutant line was crossed with chromosome segment substitution line SL18, which contains chromosome 5 of Kasalath (indica) in a Nipponbare (japonica) background. The resultant F2 population was grown in the paddy field and used for linkage mapping. F3 seeds of selected recombinant plants were collected for progeny testing to determine the genotype of the Spl7 locus.
Restriction Fragment-Length Polymorphism (RFLP) Analysis.
The cetyltrimethylammonium bromide (CTAB) method (21) was used, with modification, for extracting total DNA from rice leaves. The CTAB-nucleic acid precipitate was dissolved in 1 M NaCl and 10 μg/ml RNase A, and the CsCl ultracentrifugation step was omitted. The DNA was collected by ethanol precipitation. All experimental procedures for Southern blotting, hybridization, and linkage map construction have been described by Kurata et al. (22).
Screening of Genomic Clones.
A published rice Nipponbare YAC (yeast artificial chromosome)-based physical map (available at http://rgp.dna.affrc.go.jp/Publicdata.html) was used to select the candidate YACs corresponding to the Spl7 region by using sequence-tagged sites (STSs) of flanking markers. A rice Nipponbare P1-derived artificial chromosome (PAC) library (23) was used to screen corresponding genomic clones. In total, 18,432 clones were screened by STS primers for C11368.
Generation of DNA Markers.
YAC- and PAC-end DNA fragments were cloned by using the cassette PCR method (24). End clones then were used for RFLP analysis.
We determined the sequence of PCR products derived from Kasalath genomic DNA by using primers designed from the sequence data of the 16-kb Spl7 candidate region of the Nipponbare genome. Then cleaved amplified polymorphic sequence (CAPS) markers were generated according to polymorphism between Nipponbare and Kasalath that was based on sequence comparison.
Sequence Analysis of Candidate Genomic Region.
PAC clone P0029H1 was digested with the restriction enzymes SalI and NotI, and then DNA fragments containing the Spl7 region were identified by Southern hybridization analysis with DNA clones flanking Spl7. Ten-kilobase SalI fragments and 13-kb NotI fragments were cut out and cloned to make sublibraries for sequencing. Sequencing was performed for both strands of subclones. The assembled sequence data of the candidate genomic region was analyzed with GENSCAN software (ref. 25; available at http://genes.mit.edu/GENSCAN.html) tuned with Arabidopsis or maize sequences to predict putative ORFs. The predicted amino acid sequence was used for BLAST searches (26) of nonredundant protein databases at GenBank.
Genomic regions of mutant spl7 alleles were amplified by PCR with primers designed from the genomic sequence of Nipponbare. Amplified products were cloned into pCR2.1 vector (Invitrogen) and sequenced.
Complementation Test.
A 5.6-kb NspV–BglII fragment containing the candidate Spl7 gene was subcloned into binary plasmid vector pPZP2H-lac (27). The 5.6-kb fragment was transformed for complementation testing into Agrobacterium strain EHA101 (28) and then infected into calluses of the spl7 mutant, which then were grown in darkness at 25°C for 3 days. Plants regenerated from hygromycin-resistant calluses were grown in an isolated greenhouse. Individual plants were assessed for leaf spot development 2 months later.
RNA Extraction and Reverse Transcription–PCR (RT-PCR) Analysis.
Total RNA was extracted from leaves at several stages by using a single-step method (29) with minor modifications. Poly(A)+ RNA was recovered from total RNA by using Oligotex-dT30 (Takara, Tokyo, Japan) and treated with DNase overnight. A first-strand cDNA was synthesized with the First-Strand cDNA Synthesis Kit (Amersham Pharmacia) according to the manufacturer's instructions. The first-strand cDNA was used as a template, and amplification was performed for 30 PCR cycles (30 s at 95°C, 90 s at 68°C) for Spl7, or 25 PCR cycles (45 s at 95°C, 45 s at 63°C, 60 s at 72°C) for the actin control. The primers for Spl7 were U9 [5′-GTCTCCGTGGCCGTGGCTGA-3′ (sense)] and L8 [5′-GGTCACGGGAGAAGTCGAGC-3′ (antisense)]. Actin primers were 5′-TCCATCTTGGCATCTCTCAG-3′ (sense) and 5′-GTACCCGCATCAGGCATCTG-3′ (antisense). RT-PCR assay was performed at least three times for each sample.
Rapid amplification of cDNA ends (RACE)-PCR was performed by using a Marathon cDNA Amplification Kit (CLONTECH). The gene-specific primer for the primary 5′ RACE-PCR was L4 [5′-CACGATGTTCTTCTGCCGTT-3′ (antisense)] or L2 [5′-GCGTCCTCCACCATCTCGTA-3′ (antisense)], and for the nested PCR reaction, the primer was L2 or L5 [5′-CCGAGTCGCCAAAAGACAGC-3′ (antisense)]. The primers for the 3′ RACE-PCR reaction were 5′-CTCGACTTCTCCCGTGACCT-3′ (sense, primary) and 5′-ACGATGTGTTTTGGGAGCGG-3′ (sense, nested). RACE-PCR products were cloned and sequenced.
Results
spl7 Mutant of Rice.
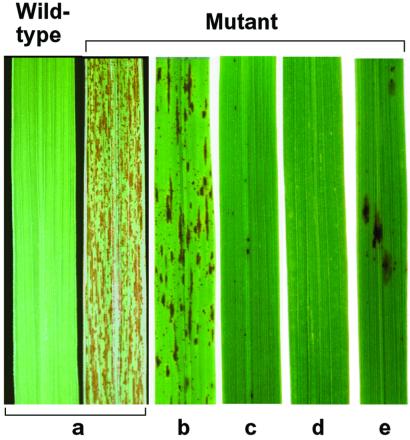
Rice spotted leaf mutant spl7 (line KL210) showed relatively small, reddish brown lesions scattered over the whole surfaces of leaves (Fig. 1). Under natural summer field conditions (maximum temperature 30°C to 35°C), the lesions appeared from the tillering stage and continuously increased to heading time. The density of the lesions decreased in a greenhouse (26°C, solar radiation). When UV rays were intercepted by covering the plants with UV-cut sheet, the density of the lesions also decreased remarkably. On the other hand, no lesions were observed on mutant plants grown in a controlled growth chamber (26°C, artificial light), and a small number of lesions appeared in a high-temperature growth chamber (35°C, artificial light). No lesions appeared on seedlings or young leaves in all conditions above mentioned. These results suggest that the accumulation of stresses, such as high temperature or UV solar radiation, causes lesion development.
Figure 1.
Lesion-mimic phenotype of the spl7 mutant. Leaves of 2-month-old plants grown under various conditions. (a) Natural summer field. (b) Green-house (26°C, solar radiation). (c) Green-house (26°C, UV-filtered solar radiation). (d) Growth chamber (26°C, artificial light). (e) Growth chamber (35°C, artificial light).
Delimitation of a Candidate Genomic Region of Spl7.
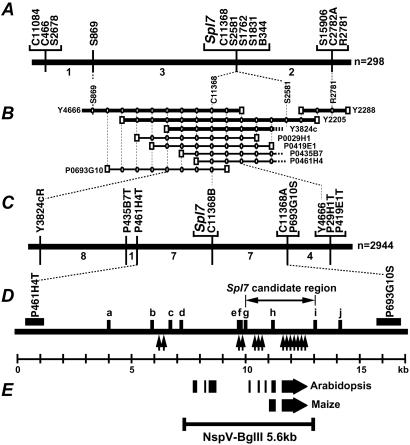
The Spl7 locus had been roughly mapped between RFLP marker G81 and the end of the long arm of chromosome 5 (within about 20 cM; ref. 18). Linkage analysis with 298 F2 plants by using RFLP markers around this region revealed that Spl7 must exist in the interval of 1.3 cM between S869 and R2781; five RFLP markers, C11368, S2581, S1762, S1831, and B344, cosegregated with it (Fig. 2A).
Figure 2.
Delimitation of candidate genomic region of Spl7. (A) Genetic linkage map of 298 F2 plants showing the relative position of Spl7 with the RFLP markers on chromosome 5. The numbers under the linkage map indicate the number of recombinants in the adjacent marker intervals. (B) YAC (Y) and PAC (P) clone contigs spanning the Spl7 region. Squares indicate YAC/PAC-end clones. Circles indicate STSs generated from the YAC/PAC-end sequences. (C) Fine-scale, high-resolution genetic linkage map of the Spl7 region developed from the analysis of 2,944 F2 plants. The numbers under the linkage map indicate the number of recombinants in the adjacent marker intervals. (D) Fine-scale genetic and physical map of the 16-kb Spl7 region. a to j indicate the CAPS markers. The estimated positions of recombination are shown by arrows. (E) The ORFs in the Spl7 candidate region predicted by GENSCAN. A 5.6-kb NspV-BglII wild-type genomic fragment containing the entire Spl7 candidate ORF was used in the complementation analysis.
A physical map covered the Spl7 locus was constructed by four YAC clones (Y4666, Y2205, Y3824c, and Y2288) and five PAC clones (P0029H1, P0419E1, P0435B7, P0461H4, and P0693G10). End sequences of these YACs and PACs were used to determine the overlaps among them. As a result, a region between YAC-end markers Y3824cR and Y4666R was found to contain Spl7 (Fig. 2B). High-resolution linkage mapping was performed by the use of CAPS markers developed from Y3824cR and Y4666R. Twenty-seven recombinant plants were selected from 2944 F2 plants and used for further fine-scale linkage analysis. As a result, Spl7 was mapped between P461H4T and P693G10S and cosegregated with C11368B (Fig. 2C).
The 16-kb genomic sequence between P461H4T and P693G10S was completely determined. We developed 10 CAPS markers (a to j in Fig. 2D) from the sequence data. These CAPS markers enabled us to detect recombination events between markers b and c, e and f, f and g, g and h, and h and i. Marker h cosegregated with Spl7 (Fig. 2D). Finally, the Spl7 candidate genomic region was delimited to 3 kb between g and i.
GENSCAN analysis predicted one putative gene in the candidate region (Fig. 2E). A BLAST search revealed that the putative gene showed considerable similarity to an HSF gene. This HSF homologue was a likely candidate for Spl7 and was used in further analyses.
Functional Complementation with Candidate Gene in Transgenic Rice.
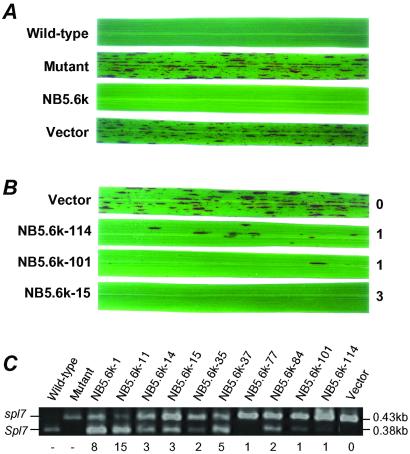
A 5.6-kb NspV–BglII fragment of Nipponbare (Fig. 2E) containing only the candidate Spl7 ORF was transferred into spl7 mutant. Southern blot analysis of transgenic plants revealed that plants showing no lesion formation had 1 to 25 bands of the transgene. This result suggests that they had 1 to 25 copies of the transgene (data not shown). Two months after regeneration, all 150 transgenic plants with the transgene showed no development of lesions (Fig. 3A). On the other hand, all 50 transgenic plants with only the vector sequence showed vigorous leaf spots like those of the spl7 mutant (Fig. 3A). Progeny of transgenic plant that had one copy of the transgene was analyzed for Mendelian inheritance of the transgene. Two types of distinct phenotypes, normal (18 plants) and spotted leaf (6 plants), were observed in the progeny. The segregation ratio fitted the expected ratio of 3:1. Thus, we conclude that Spl7 encodes an HSF protein.
Figure 3.
Functional complementation test of candidate gene. (A) The leaves of 2-month-old plants. Nontransgenic control: wild type and mutant. Transgenic plants: spl7 mutant with the 5.6-kb NspV–BglII fragment of the wild-type gene (NB5.6k) and spl7 mutant with the vector but no insert (Vector). (B) Three-month-old transgenic plants. The copy number of transgenes is shown on the right. (C) RT-PCR analysis of transgenic plants. PCR products were digested with the restriction enzyme ApaI, whose recognition site was just on the mutated point of the wild-type gene. The 0.43-kb band is derived from intrinsic spl7, and the 0.38-kb band is derived from the transgene (Spl7). The copy number of transgenes is shown below the gel.
Sequence Analysis of the Spl7 Gene.
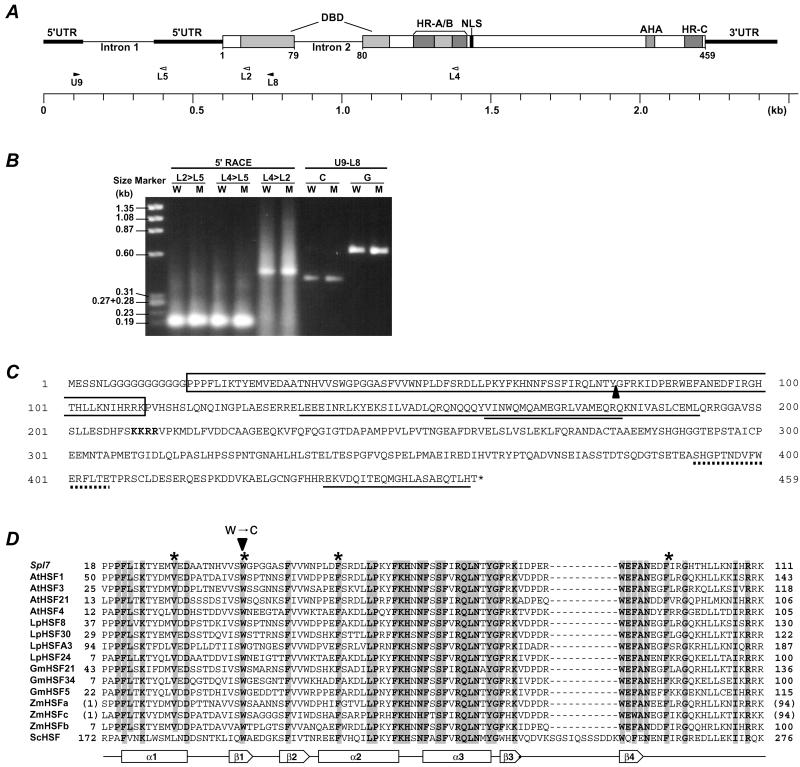
We determined the entire cDNA sequence of Spl7. Sequence comparison between genomic DNA and cDNA showed that Spl7 is composed of three exons (125, 469, and 1389 bp) separated by two introns (243 and 237 bp; Fig. 4A). Exon 1 and intron 1 lie in the 5′-untranslated region (5′UTR). The size of 5′ RACE-PCR products showed that the 5′ end of the Spl7 cDNA lies about 450 bp upstream of primer L2 or about 170 bp upstream of primer L5 (Fig. 4B). Sequence analysis of these RACE-PCR products showed the same 5′ end points. Comparison of the size of the PCR products from genomic DNA or cDNA templates by using primers U9 and L8 revealed the existence of exon 1 with a size of about 120 bp (Fig. 4B). Finally, the entire Spl7 cDNA was determined to be 1983 bp long, comprising a 1380-bp coding sequence (CDS). The CDS contains all domains essential for the protein's function as an HSF (30–34). The second intron lies in the putative HSF DNA-binding domain (DBD) in a position characteristic of plant HSFs. The third exon contains five kinds of functionally distinct domains: oligomerization domains with a hydrophobic heptad repeat region (HR-A and HR-B); a putative nuclear localization sequence (NLS); a transcriptional activation motif characterized by aromatic, large hydrophobic and acidic amino acid residues (AHA); and carboxyl-terminal hydrophobic heptad repeats linked with maintenance of the inactive monomer state of an HSF protein (HR-C), located in the C terminal region (Fig. 4 A and C).
Figure 4.
The structure of Spl7. (A) The block diagram of the Spl7 structure indicates the position of the typical functional elements. The positions of the primers used for 5′ RACE-PCR are shown by white arrowheads, and those of the primers used for RT-PCR are shown by black arrowheads. (B) Gel blot of the PCR products. W shows wild-type template and M shows mutant template. L2>L5 means that 5′ RACE used the gene-specific primer L2 for the primary PCR and L5 for the nested PCR. U9-L8 shows that the PCR products used the primer combination U9 and L8. C and G show cDNA template and genomic DNA template, respectively. (C) The predicted amino acid sequence. The sequence is shown in single-letter code. The DBD is boxed and the position of intron 2 is shown by a black triangle. The nuclear localization sequence (NLS) is written in bold. The hydrophobic heptad repeat regions are single-underlined (HR-A/B amino acids 134–191, HR-C amino acids 438–458), and an insertion of 21 aa residues between HR-A and HR-B is double-underlined. The AHA is dot-underlined. (D) Alignment of deduced amino acid sequence of Spl7 and known HSF DBD regions. The numbers on both sides indicate the amino acid positions of each protein. Because ZmHSFa and ZmHSFc are partial cDNA clones of DBDs, the temporary amino acid positions are displayed in parentheses. Conserved amino acids among all of the plant HSFs listed here are shaded. The position of the amino acid substitution is shown by an arrowhead. The secondary structure elements based on the LpHSF24 crystal structure (51) are shown below the sequence alignment: α1 to α3, α-helix; β1 to β4, β-sheet. The putative amino acids constituting the central hydrophobic core of the tertiary structure are shown by asterisks.
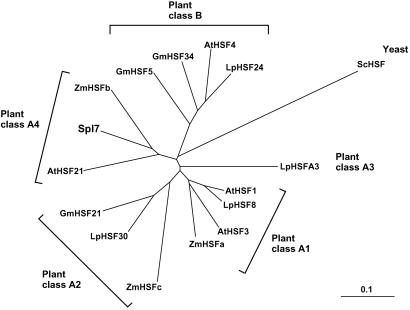
Spl7 shows a high level of homology with maize HSFb (ZmHSFb) (35), Arabidopsis HSF21 (AtHSF21) (30), Arabidopsis HSF1 (AtHSF1) (36), and tomato HSF8 (LpHSF8) (37). The DBD and HR-A/B of Spl7 are 72% to 76% and 32% to 42%, respectively, identical to these homologues. There is little identity in other regions. Fig. 5 presents a parsimony-based phylogenic tree of DBDs of Spl7 and 14 known plant HSFs, plus a yeast HSF. This analysis reveals that Spl7 is a plant class A4 HSF (31, 38).
Figure 5.
HSF phylogenetic tree from parsimony analysis of DBDs. Plant HSFs plus a yeast HSF were analyzed by using CLUSTALX V.1.8 software (52) with 1,000 repetitions by the bootstrap method. A consensus tree was generated with TREEVIEW software (53). At, Arabidopsis thaliana; Lp, Lycopersicon esculentum; Gm, Glycine max; Zm, Zea mays; Sc, Saccharomyces cerevisiae. Sequence data were taken from the GenBank database for the following accession numbers: AtHSF1, X76167; AtHSF3, Y14068; AtHSF21, U68561; AtHSF4, U68017; LpHSF8, X67600; LpHSF30, X67601; LpHSFA3, AF208544; LpHSF24, X55347; GmHSF21, Z46952; GmHSF34, Z46953; GmHSF5, Z46956; ZmHSFa, S61458; ZmHSFb, S61448; ZmHSFc, S61459; ScHSF, J03139.
Comparison of the sequences between the wild-type and mutant alleles revealed that only one base substitution occurred in the region of the DBD of the mutant allele. This base substitution replaced the predicted 40th amino acid tryptophan with Cys (Fig. 4D). This Trp-40 is highly conserved among known HSFs.
Expression of Spl7.
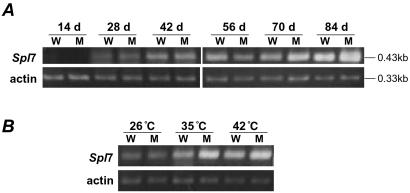
To determine whether the spl7 is transcribed, and whether the level of Spl7 or spl7 mRNA varies with growth or is induced by heat stress, we performed RT-PCR analysis. spl7 mRNA was observed in mutant plants as well as Spl7 mRNA in wild-type plants (Figs. 6 A and B). In the field, both mRNAs were hardly detected in young leaves at 14 days after sowing (DAS) but were detected in adult leaves at 28 DAS and increased with growing stage (Fig. 6A). At 70 DAS, lesion mimics began to appear on the mutant leaves, and the level of spl7 mRNA was greatly increased. The mRNAs were observed at 42 DAS in a growth chamber (constant 26°C), and they increased greatly upon heat stress treatment (Fig. 6B). The increase was greater in spl7 than in Spl7.
Figure 6.
Expression analysis of Spl7 by RT-PCR assay. (A) Change in expression with growth stage. Plants were grown in the field, and leaves were collected every 14 days after sowing (DAS) for RNA extraction. Actin primers were used in the control amplification. (B) Change in expression with heat stress. Plants were grown in a growth chamber for 6 weeks (26°C, control) and then were incubated at 35°C for 1 day and at 42°C for 1 day more.
Discussion
In adult plants, spl7 mutants formed small, reddish brown necrotic lesions; formation was enhanced by high temperature and suppressed by UV interception. Cells in adult leaves accumulate various stresses (39) but are usually prevented from dying by cell survival factors, e.g., HSPs (40). Spl7, a rice HSFA4, may control such cell survival factors.
HSFs play a central role in the transmission of information regarding environmental stress to the nucleus, where the binding of activated HSFs to heat shock elements in promoters of HSP genes results in the transcriptional induction of the heat stress response (41). Genes for HSFs have been isolated and characterized from yeast (42, 43), Drosophila (44), and some vertebrates (41). In plants, they have been reported in tomato (37, 45), Arabidopsis (36, 46), soybean (47), maize (35), and others. All HSF proteins have an evolutionarily conserved core consisting of a DBD and an oligomerization domain, HR-A/B. HSFs are multigene families in both plants and vertebrates (30). On the basis of phylogeny of DBDs and organization of HRs, plant HSFs can be subdivided into three major classes: A, B, and C (31). Spl7 seems to be a plant class A HSF. We used three main criteria for the classification: (i) Spl7 has a class A-specific insertion of 21 aa residues between HR-A and HR-B (refs. 30 and 31; Fig. 4C). (ii) Spl7 has an NLS located adjacent to the HR-A/B region (refs. 31 and 32; Fig. 4 A and C). In class B HSFs, the NLS is located more distally, close to the C terminus (30, 31). (iii) Spl7 has an HR-C and an AHA (Fig. 4 A and C) which are absent from class B HSFs (33, 34). Parsimony analysis of DBDs (Fig. 5) shows that Spl7 is a class A4 HSF. At present, five HSFs (two from Arabidopsis, one each from tobacco, maize, and alfalfa) have been classified into class A4 (31, 33); of these, AtHSF21 and ZmHSFb are heat-inducible, like Spl7. The biological function of class A4 HSFs in plants remains to be shown.
spl7 mRNA was transcribed in spl7 mutant plants (Fig. 6 A and B), which suggests that no critical change occurred in the transcription system of the spl7 gene. However, one base substitution was detected, which resulted in the replacement of Trp-40 with Cys in the DBD region (Fig. 4D). The substitution is likely to cause a loss of function in the mutant allele. The tertiary structures of yeast and Drosophila HSFs have been investigated by means of x-ray crystallography and NMR techniques (48, 49). The HSF DBD contains a central helix-turn-helix motif that is thought to be responsible for specific DNA recognition (48), and the orientation of the DNA recognition helix is stabilized by a hydrophobic core in the central part of the tertiary structure (48, 49). We simulated the tertiary structure of Spl7 DBD in a model of Drosophila HSF (data not shown). Spl7's Trp-40 constitutes the hydrophobic core together with Val-29, Phe-47, and Phe-96 (Fig. 4D). These amino acids are conserved among most HSFs (Fig. 4D) and must contribute to the stability of the tertiary structure of DBDs. In the mutant spl7, replacement of Trp-40 with Cys-40 caused an imperfect hydrophobic interaction. In yeast, Ala-scanning mutational analysis revealed nine critical residues in HSFs (50). Five lie within helix H3 and probably play a direct role in DNA recognition. It should be emphasized that the amino acid that corresponds to Trp-40 of Spl7 is one of the other four critical residues.
Heat-inducible HSF signal transduction is accomplished through a cascade of events: trimerization induced by heat stress, then nuclear localization and DNA binding, and, finally, acquisition of transcriptional competence (41). The mutant spl7 protein retains all conserved functional domains except the DBD. We suggest that the mutant spl7 protein might be converted into an active trimeric state but might not bind well to the specific DNA sequence, thus having little ability to activate the target gene transcription. In the complementation experiment, the wild-type Spl7 gene was transformed into spl7 mutant rice. All transgenic plants that gained more than three copies of Spl7 showed no lesion development throughout the growth period. On the other hand, several transgenic plants with one copy, which showed no lesions at 2 months, developed a small number of lesions at the heading stage (3–3.5 months; Fig. 3B). In individual transgenic plants, the amount of transcriptional product was almost proportional to the copy number (Fig. 3C). This result might be explained by the following hypothesis. The mutant protein formed heteromultimeric complexes with the wild-type protein, leading to trimers of HSF with decreased DNA-binding affinity. At the later growth stage, at which various stresses accumulate, the low-copy transgenic plants could not supply enough perfect wild-type HSF trimers to promote the transcription of the target genes. We picked up 20 HSP genes from an expressed sequence tag database (http://www.dna.affrc.go.jp/bank/index.html) and analyzed the mRNA level of each HSP gene by RT-PCR. We could not identify the candidate for the Spl7 target (data not shown). Spl7 may control other HSP genes or have a more specific role for maintenance of cell survival.
The function of HSFs in plants, especially their effects on plant phenotype, is not clear. In this study, we demonstrated that a lesion-mimic phenotype in rice was caused by the loss of function of an HSF. However, the target gene of Spl7 remains to be identified. Factors regulating the transcription of Spl7 itself are also uncertain. Further investigation is required to clarify these genes and their transcription factors, to understand environmental stress tolerance and the cell death defense mechanism of plants.
Acknowledgments
We thank Dr. Yoshimura for providing the spl7 mutant. We also thank Dr. Fujimoto for his assistance in the production of the tertiary pictures and his useful suggestions. We thank Dr. Sasaki and Dr. Eguchi for their critical reading of the manuscript and their advice. This work was supported by funding from the Ministry of Agriculture, Forestry and Fisheries of Japan.
Abbreviations
- HSP
heat shock protein
- Spl
spotted leaf
- HSF
heat stress transcription factor
- RFLP
restriction fragment-length polymorphism
- YAC
yeast artificial chromosome
- STS
sequence-tagged sites
- PAC
P1-derived artificial chromosome
- CAPS
cleaved amplified polymorphic sequence
- RACE
rapid amplification of cDNA ends
- DBD
DNA-binding domain
- HR
hydrophobic heptad repeats
Footnotes
References
- 1.Vierling E, Kimpel J A. Curr Opin Biotech. 1992;3:164–170. doi: 10.1016/0958-1669(92)90147-b. [DOI] [PubMed] [Google Scholar]
- 2.Johal G S, Hulbert S H, Briggs S P. BioEssays. 1995;17:685–692. [Google Scholar]
- 3.Iwata N, Omura T, Satoh H. J Fac Agr Kyushu Univ. 1978;22:243–251. [Google Scholar]
- 4.Hoisington D A, Newffer M G, Walbot V. Dev Biol. 1982;93:381–388. doi: 10.1016/0012-1606(82)90125-7. [DOI] [PubMed] [Google Scholar]
- 5.Dietrich R A, Richberg M H, Schmidt R, Dean C, Dangl J L. Cell. 1997;88:685–694. doi: 10.1016/s0092-8674(00)81911-x. [DOI] [PubMed] [Google Scholar]
- 6.Jabs T, Dietrich R A, Dangl J L. Science. 1996;273:1853–1856. doi: 10.1126/science.273.5283.1853. [DOI] [PubMed] [Google Scholar]
- 7.Büschges R, Hollricher K, Panstruga R, Simons G, Wolter M, Frijters A, van Daelen R, van der Lee T, Diergaarde P, Groenendijk J, et al. Cell. 1997;88:695–705. doi: 10.1016/s0092-8674(00)81912-1. [DOI] [PubMed] [Google Scholar]
- 8.Devoto A, Piffanelli P, Nilsson I, Wallin E, Panstruga R, von Heijne G, Schulze-Lefert P. J Biol Chem. 1999;274:34993–35004. doi: 10.1074/jbc.274.49.34993. [DOI] [PubMed] [Google Scholar]
- 9.Gray J, Close P S, Briggs S P, Johal G S. Cell. 1997;89:25–31. doi: 10.1016/s0092-8674(00)80179-8. [DOI] [PubMed] [Google Scholar]
- 10.Collins N, Drake J, Ayliffe M, Sun Q, Ellis J, Hulbert S, Pryor T. Plant Cell. 1999;11:1365–1376. doi: 10.1105/tpc.11.7.1365. [DOI] [PMC free article] [PubMed] [Google Scholar]
- 11.Wolter M, Hollricher K, Salamini F, Schulze-Lefert P. Mol Gen Genet. 1993;239:122–128. doi: 10.1007/BF00281610. [DOI] [PubMed] [Google Scholar]
- 12.Simmons C, Hantke S, Grant S, Johal G S, Briggs S P. Mol Plant–Microbe Interact. 1998;11:1110–1118. [Google Scholar]
- 13.Hu G, Richter T E, Hulbert S H, Pryor T. Plant Cell. 1996;8:1367–1376. doi: 10.1105/tpc.8.8.1367. [DOI] [PMC free article] [PubMed] [Google Scholar]
- 14.Takahashi A, Kawasaki T, Henmi K, Shii K, Kodama O, Satoh H, Shimamoto K. Plant J. 1999;17:535–545. doi: 10.1046/j.1365-313x.1999.00405.x. [DOI] [PubMed] [Google Scholar]
- 15.Greenberg J T, Ausubel F M. Plant J. 1993;4:327–341. doi: 10.1046/j.1365-313x.1993.04020327.x. [DOI] [PubMed] [Google Scholar]
- 16.Hu G, Yalpani N, Briggs S P, Johal G S. Plant Cell. 1998;10:1095–1105. doi: 10.1105/tpc.10.7.1095. [DOI] [PMC free article] [PubMed] [Google Scholar]
- 17.Singh K, Multani D S, Khush G S. Rice Genet Newsl. 1995;12:192–193. [Google Scholar]
- 18.Nagato Y, Yoshimura A. Rice Genet Newsl. 1998;15:13–74. [Google Scholar]
- 19.Fuse T, Iba K, Satoh H, Nishimura M. Physiol Plant. 1993;89:799–804. [Google Scholar]
- 20.Yin Z, Chen J, Zeng L, Goh M, Leung H, Khush G S, Wang G L. Mol Plant–Microbe Interact. 2000;13:869–876. doi: 10.1094/MPMI.2000.13.8.869. [DOI] [PubMed] [Google Scholar]
- 21.Murray M G, Thompson W F. Nucleic Acids Res. 1980;8:4321–4325. doi: 10.1093/nar/8.19.4321. [DOI] [PMC free article] [PubMed] [Google Scholar]
- 22.Kurata N, Nagamura Y, Yamamoto K, Harushima Y, Sue N, Wu J, Antonio B A, Shomura A, Shimizu T, Lin S Y, et al. Nat Genet. 1994;8:365–372. doi: 10.1038/ng1294-365. [DOI] [PubMed] [Google Scholar]
- 23.Baba T, Katagiri S, Tanoue H, Tanaka R, Chiden Y, Saji S, Hamada M, Nakashima M, Okamoto M, Hayashi M, et al. Bull Nat Inst Agrobiol Resour. 2000;14:41–49. [Google Scholar]
- 24.Isegawa Y, Sheng J, Sokawa Y, Yamagishi K, Nakagomi O, Ueda S. Mol Cell Probes. 1992;6:467–475. doi: 10.1016/0890-8508(92)90043-w. [DOI] [PubMed] [Google Scholar]
- 25.Burge C, Karlin S. J Mol Biol. 1997;268:78–94. doi: 10.1006/jmbi.1997.0951. [DOI] [PubMed] [Google Scholar]
- 26.Altschul S F, Gish W, Miller W, Myers E W, Lipman D J. J Mol Biol. 1990;215:403–410. doi: 10.1016/S0022-2836(05)80360-2. [DOI] [PubMed] [Google Scholar]
- 27.Fuse T, Sasaki T, Yano M. Plant Biotech. 2001;18:219–222. [Google Scholar]
- 28.Toki S. Plant Mol Biol Rep. 1997;15:16–21. [Google Scholar]
- 29.Chomcznski P, Sacchi N. Anal Biochem. 1987;162:156–159. doi: 10.1006/abio.1987.9999. [DOI] [PubMed] [Google Scholar]
- 30.Nover L, Scharf K D, Gagliardi D, Vergne P, Czarnecka-Verner E, Gurley W B. Cell Stress Chaperones. 1996;1:215–223. doi: 10.1379/1466-1268(1996)001<0215:thwcap>2.3.co;2. [DOI] [PMC free article] [PubMed] [Google Scholar]
- 31.Nover L, Bharti K, Döring P, Mishra S K, Ganguli A, Scharf K D. Cell Stress Chaperones. 2001;6:177–189. doi: 10.1379/1466-1268(2001)006<0177:aathst>2.0.co;2. [DOI] [PMC free article] [PubMed] [Google Scholar]
- 32.Lyck R, Harmening U, Höhfeld I, Treuter E, Scharf K D, Nover L. Planta. 1997;202:117–125. doi: 10.1007/s004250050110. [DOI] [PubMed] [Google Scholar]
- 33.Bharti K, Schmidt E, Lyck R, Heerklotz D, Bublak D, Scharf K D. Plant J. 2000;22:355–365. doi: 10.1046/j.1365-313x.2000.00746.x. [DOI] [PubMed] [Google Scholar]
- 34.Döring P, Treuter E, Kistner C, Lyck L, Chen A, Nover L. Plant Cell. 2000;12:265–278. [PMC free article] [PubMed] [Google Scholar]
- 35.Gagliardi D, Breton C, Chaboud A, Vergne P, Dumas C. Plant Mol Biol. 1995;29:841–856. doi: 10.1007/BF00041173. [DOI] [PubMed] [Google Scholar]
- 36.Hübel A, Schöffl F. Plant Mol Biol. 1994;26:353–362. doi: 10.1007/BF00039545. [DOI] [PubMed] [Google Scholar]
- 37.Scharf K D, Rose S, Zott W, Schöffl F, Nover L. EMBO J. 1990;9:4495–4501. doi: 10.1002/j.1460-2075.1990.tb07900.x. [DOI] [PMC free article] [PubMed] [Google Scholar]
- 38.Czarnecka-Verner E, Yuan C X, Scharf K D, Englich G, Gurley W B. Plant Mol Biol. 2000;43:459–471. doi: 10.1023/a:1006448607740. [DOI] [PubMed] [Google Scholar]
- 39.Lichtenthaler H K. Ann NY Acad Sci. 1998;851:187–198. doi: 10.1111/j.1749-6632.1998.tb08993.x. [DOI] [PubMed] [Google Scholar]
- 40.De Maio A. Shock. 1999;11:1–12. doi: 10.1097/00024382-199901000-00001. [DOI] [PubMed] [Google Scholar]
- 41.Wu C. Annu Rev Cell Dev Biol. 1995;11:441–469. doi: 10.1146/annurev.cb.11.110195.002301. [DOI] [PubMed] [Google Scholar]
- 42.Wiederrecht G, Seto D, Parker C S. Cell. 1988;54:841–853. doi: 10.1016/s0092-8674(88)91197-x. [DOI] [PubMed] [Google Scholar]
- 43.Jakobsen B K, Pelham H R B. EMBO J. 1991;10:369–375. doi: 10.1002/j.1460-2075.1991.tb07958.x. [DOI] [PMC free article] [PubMed] [Google Scholar]
- 44.Clos J, Westwood J T, Beckere P B, Wilson S, Lambert K, Wu C. Cell. 1990;63:1085–1097. doi: 10.1016/0092-8674(90)90511-c. [DOI] [PubMed] [Google Scholar]
- 45.Scharf K D, Rose S, Thierfelder J, Nover L. Plant Physiol. 1993;102:1355–1356. doi: 10.1104/pp.102.4.1355. [DOI] [PMC free article] [PubMed] [Google Scholar]
- 46.Prändl R, Hinderhofer K, Eggers-Schumacher G, Schöffl F. Mol Gen Genet. 1998;258:269–278. doi: 10.1007/s004380050731. [DOI] [PubMed] [Google Scholar]
- 47.Czarnecka-Verner E, Yuan C X, Fox P C, Gurley W B. Plant Mol Biol. 1995;29:37–51. doi: 10.1007/BF00019117. [DOI] [PubMed] [Google Scholar]
- 48.Vuister G W, Kim S, Orosz A, Marquardt J, Wu C, Bax A. Struct Biol. 1994;1:605–614. [PubMed] [Google Scholar]
- 49.Damberger F F, Pelton J G, Harrison C J, Nelson H C M, Wemmer D E. Protein Sci. 1994;3:1806–1821. doi: 10.1002/pro.5560031020. [DOI] [PMC free article] [PubMed] [Google Scholar]
- 50.Hubl S T, Owens J C, Nelson H C M. Struct Biol. 1994;1:615–620. doi: 10.1038/nsb0994-615. [DOI] [PubMed] [Google Scholar]
- 51.Schultheiss J, Kunert O, Gase U, Scharf K-D, Nover L, Rüterjans H. Eur J Biochem. 1996;236:911–921. doi: 10.1111/j.1432-1033.1996.00911.x. [DOI] [PubMed] [Google Scholar]
- 52.Thompson J D, Gibson T J, Plewniak F, Jeanmougin F, Higgins D G. Nucleic Acids Res. 1997;24:4876–4882. doi: 10.1093/nar/25.24.4876. [DOI] [PMC free article] [PubMed] [Google Scholar]
- 53.Page R D. Comput Appl Biosci. 1996;12:357–358. doi: 10.1093/bioinformatics/12.4.357. [DOI] [PubMed] [Google Scholar]


