Abstract
We show that in solutions of human hemoglobin (Hb)—oxy- and deoxy-Hb A or S—of near-physiological pH, ionic strength, and Hb concentration, liquid–liquid phase separation occurs reversibly and reproducibly at temperatures between 35 and 40°C. In solutions of deoxy-HbS, we demonstrate that the dense liquid droplets facilitate the nucleation of HbS polymers, whose formation is the primary pathogenic event for sickle cell anemia. In view of recent results that shifts of the liquid–liquid separation phase boundary can be achieved by nontoxic additives at molar concentrations up to 30 times lower than the protein concentrations, these findings open new avenues for the inhibition of the HbS polymerization.
The primary pathogenic event in sickle cell anemia (1) is the polymerization of the mutated hemoglobin (Hb) S into linear fibers (2), mostly in the postcapillary venules (3–5), forming spherulitic domains, sheaves of parallel polymers (6–8), and other secondary structures, which stretch the erythrocytes and increase the intracellular viscosity leading to vasoclussion (9). In the absence of a curative treatment (2, 10), the main impetus for research has been on slowing and preventing the polymerization of deoxy-HbS (11). Recent experiments (12), simulations (13), and theory (14) suggest that the kinetics of formation of protein solid phases can be controlled by shifting the phase boundary for liquid–liquid (L–L) separation, occurring with some proteins (15–17). In this article, we discuss the tests of the first prerequisite for the action of this control mechanism—the existence of a dense liquid phase in the solutions of normal and sickle cell Hb at near-physiological conditions.
Methods
Procedures for Direct Monitoring of L–L Separation and Nucleation of Polymers.
Samples of Hb solutions (A or S) with concentration in the range 9.6–35 g/dl, in oxygenated or deoxygenated state, in 0.15 M potassium phosphate buffer at pH 7.35, with 0.1–1% (wt/vol) polyethylene glycol (PEG) of molecular mass 8,000 g/mol (PEG 8000) were held between two microscope slides. The solution layer thickness, determined by focusing on imperfections on the bottom and top inside glass surfaces, was 10–40 μm and the sample volume was a few microliters. The slides were sealed with Maunt-Quick (Daido Sangyo, Japan) sealant, and mounted on a custom-made temperature control stage. The latter consists of an aluminum block attached to thermoelectric (Peltier, Sterling, MA) coolers and has an opening that allows the approach of the microscope condenser from the slide bottom for differential interference contrast (DIC) imaging. The controller ensures temperature stability and control within ±0.05°C between −5 and 70°C. For the detection of the HbS polymers, polymer bundle domains, and gels, we used a DIC-equipped microscope (Leitz Orthoplan, magnification ×1,000) as in refs. 6, 7, and 18. To avoid heat loss through the microscope lens or the condenser, they were both inserted in brass coolers through which we flowed water coming from a temperature-controlled circulator. Polymerization or L–L phase separation was induced by the fast (within 10 s) temperature jump as in refs. 19–21.
Preparation and Deoxygenation of Hb.
Blood from homozygous sickle cell patients or from donors with normal Hb was drawn following National Institutes of Health-established regulations at the Bronx Sickle Cell Center at Albert Einstein College of Medicine, Bronx, NY, and shipped overnight on ice to Huntsville, AL. Upon arrival, it was washed 3 times with a 0.9-wt % saline solution and centrifuged at 3,000 rpm to remove the plasma. The cells were lysed with water and the Hb was separated from the membranes by centrifugation at 5,000 rpm and filtered through a 0.45-μm filter. For purification, we used anion exchange FPLC system with an Amersham Pharmacia Biotech Hiload 26/10 Q Sepharose High Performance column. The mobile phase was 25 mM Tris⋅HCl flowing at 6 ml/min; an ionic strength gradient was used. Gel electrophoresis with Amersham Pharmacia Biotech Phastgel native buffer strips and gradient 8–25 gels was applied to test the purity of the fractions of Hb solution coming from the FPLC column. The fractions deemed pure were mixed and concentrated. Then Hb was dialyzed to 0.15 M or higher potassium phosphate buffer in a dialysis cassette of 10,000 Mw cutoff and concentrated. Hb concentrations were determined with Drabkin's reagent (Sigma) and spectrophotometry at 540 nm. Deoxygenation was carried out in a plastic glove chamber with humidified He and sodium dithionate (Na2S2O4). Completeness of deoxygenation was confirmed spectrophotometrically. The solution was introduced in a sealed spectrophotometer cuvette. The spectrum of the Hb thus processed showed a single peak at ∼555 nm, while the spectrum of the original Hb in the oxygenated form has 2 peaks of different intensities at about 575 and 541 nm.
Results and Discussion
In a first series of experiments, we studied solutions of oxy- and deoxy-Hbs A and S in 0.15 M phosphate buffer in the presence of 0.1–1% (wt/vol) PEG 8000. With all four Hb forms, immediately after the temperature was raised to a value around 41–42°C, motion in the solution was observed; for a complete list of all tested conditions, see Table 1. In a few seconds, droplets of a few tenths of a micrometer were visible that in a mater of seconds grew to sizes of about 1–5 μm; see Fig. 1 (30 g/dl HbA in initial solution, 1% PEG 8000, 42°C). With deoxy-HbS, the observation of direct L–L separation, without passing through polymer formation between ∼20 and 30°C (see below), was only possible at concentrations <18 g/dl, at the edge of the solubility curve.
Table 1.
Summary of conditions at which separation of solutions of the four investigated Hb forms were found to exist as two separate liquid phases
| Hb type | Hb concentrations, g/dl | PEG concentrations, % (wt/vol) | Temperature interval, °C |
|---|---|---|---|
| Deoxy-HbA | 9.6, 20, 30 | 0.25, 0.5, 1.0 | 35–45* |
| Deoxy-HbS | 17.6, 22, 35 | 0.1, 1.0 | 38–45† |
| Oxy-HbS | 18.4, 20 | 1 | 35–45 |
| Oxy-HbA | 19 | 0.1, 0.25, 0.5, 1.0 | 35–45 |
The upper limits represent the scope of the probed temperatures, rather than the temperatures at which the dense liquid droplets disappear.
Upon cooling below the lower limit of this interval, polymers fibers of deoxy-HbS are always seen.
Figure 1.
The liquid nature of the second phase in Hb solutions. The sequence shows the coalescence of droplets of the dense liquid of deoxy-HbA suspended in a normal deoxy-HbA solution at 42°C. HbA concentration in starting solution is 30 g/dl. First and last frames are separated by 55 s.
The following sets of observations convinced us that (i) these are liquid droplets, (ii) containing native Hb in a concentration higher than the surrounding solution, and that (iii) this is a true, reversible phase transition, and (iv) with deoxy-HbS, the existence of liquid droplets facilitates the polymerization.
The droplets partook in Brownian motion and gradually sedimented downward as they grew (gravity effect) or were carried over distances of a few tens of micrometers by solution convection driven by temperature gradients (Fig. 1). As Fig. 1 and Movie 1, which is published as supporting information on the PNAS web site, www.pnas.org, illustrate, if two droplets collide, they coalesce and form a new, larger droplet.
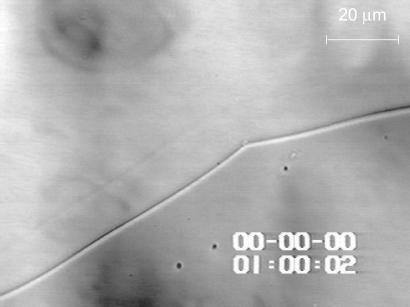
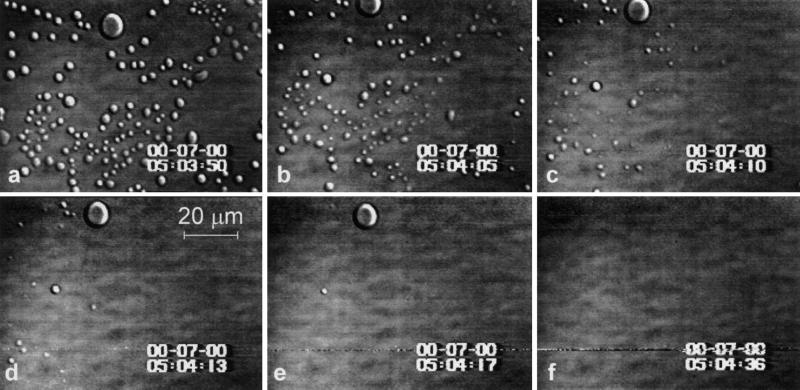
With time, the droplets of the high-density phase merge, and the low- and high- density phases occupy well separated areas (Fig. 2). We spectroscopically characterized the two phases and found that the concentration of Hb in the high-density phase is ∼12 times higher than in the low-density solution. No evidence of met-Hb was detected, and the recorded spectra were identical to those characteristic of the respective Hb form. To test the reversibility of the L–L phase separation, again we used solutions of oxy and deoxy forms of Hb A and S. Fig. 3 and Movie 2, which is published as supporting information on the PNAS web site, www.pnas.org, depict that with deoxy-HbA, as temperature is lowered to below the value at which two liquid phases coexist (this temperature depends on the total concentration of Hb), the dense phase begins to disappear and in 46 s, it is completely dissolved. If temperature is raised to above 40°C, the liquid droplets appear again. We cycled through these two temperatures several times, without any changes in the apparent kinetics of the formation or disappearance of the dense-liquid droplets that would indicate denaturation. Spectroscopic characterizations of the two phases in the solutions confirmed the integrity of the respective Hb form after the cycling.
Figure 2.
The dense phase consists of deoxy-HbA at a concentration 12 times higher than that of the dilute phase. The two liquid phases occupy well defined areas after equilibrium is reached, allowing spectrophotometric characterization of Hb and determination of the relative concentrations in the two phases. Conditions are identical to those in Fig. 1.
Figure 3.
Reversibility of the L–L separation with deoxy-HbA. After temperature is lowered from 42 to 35°C, the dense liquid droplets disappear. The times at which each frame was captured are shown. Solution composition is identical to those in Figs. 1 and 2.
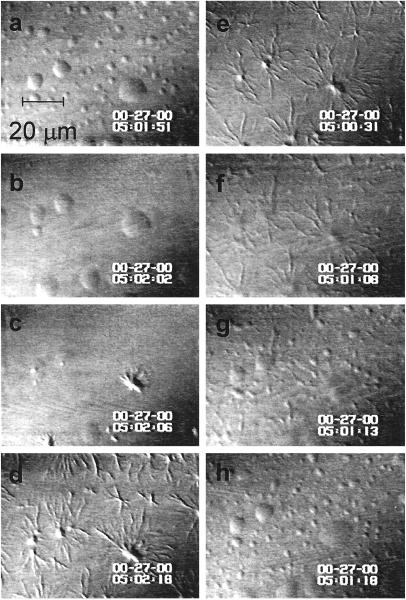
When deoxy-HbS samples at concentrations above ∼18 g/dl are cooled to ∼30°C after L–L separation has occurred at T = 42°C, the smaller droplets disappear within several seconds indistinguishable from the droplets of the other Hb forms. The larger droplets, which have not disappeared, serve as initiators for the formation of deoxy-HbS polymers (see Fig. 4 and Movie 3, which is published as supporting information on the PNAS web site, www.pnas.org, for an experiment with CHbS = 22 g/dl; for further experimental details, see figure legend). Additional spherulites emerge at the locations where the smaller droplets have been, most likely due to high deoxy-HbS concentrations undissipated within the short times for the onset of polymerization.
Figure 4.
Link between L–L separation and polymer formation in deoxy-HbS solutions. Concentration of HbS is 22 g/dl, with 1% (wt/vol) PEG 8000. (a–d) When temperature is lowered from 42 to 35°C, the smaller of the dense liquid droplets disappear, while the larger ones serve as nucleation centers for HbS spherulites. Spherulites also appear at the locations where smaller droplets have been, apparently because of the undissipated locally higher concentration. (e–h) Upon raising the temperature to 42°C, the spherulites melt into droplets. The whole sequence a–h can be repeated more than 10 times by varying the temperature between these two settings. The reproducibility of the locations of droplets and spherulites emphasizes the link between them.
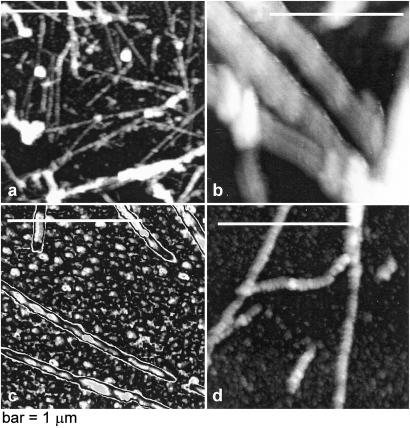
After cross-linking with glutaraldehyde, the observed fibers were characterized by ex situ atomic force microscopy (AFM) (for experimental details, see ref. 22). The AFM images in Fig. 5 reveal polymer fibers and sheaths of various thickness; the thickness of the individual fibers was ∼22 nm and they were twisted with a pitch of ∼150 nm. These features are close to the characteristics of the deoxy-HbS polymer fibers as seen by electron microscopy (23, 24).
Figure 5.
Atomic force microscopy images of the deoxy-HbS polymers formed at 35°C in a 22-g/dl solution of deoxy-HbS. (a) Low-resolution image showing a variety of polymeric structures. (b–d) High resolution images showing thicker fibers consist of thinner polymers of 22 nm diameter (b). (c) The chosen color scheme highlights the pitch of the thin polymer fibers of ∼150 nm. (d) Branched and twisted polymer fibers. Under these conditions, observations of such structures were relatively rare.
Cooling to temperatures around 5°C dissolves the deoxy-HbS polymers into a low-density solution. In contrast, heating to 35–40°C transforms them into droplets of the dense liquid, with each spherulite forming one droplet (Fig. 4 and Movie 4, which is published as supporting information on the PNAS web site, www.pnas.org). We have cycled up to 10 times through these 3 temperature settings, without any changes in the apparent kinetics of the phase transformations and without the formation of clumps of denatured protein.
The observations illustrated in Fig. 4 strongly suggest that the existence of the liquid droplets facilitates the formation of the deoxy-HbS polymers, in analogy to the enhancement of lysozyme nucleation kinetics (12) and in agreement with the theoretical predictions (13, 14, 25, 26).
In solutions of same Hb concentration, the L–L separation with all four Hb forms tested occurred at similar temperatures. On the other hand, only deoxy-HbS generates polymers. As demonstrated by binary mixtures of HbS with Hb mutants (27), the deoxy-HbS fiber has as assembly unit, the Wishner–Love double strand (5, 28). This structure requires strong up and down and lateral contacts between tetramers and also between double strands. In contrast, we conclude that the L–L separation is not induced by the direct intertetramer contacts but rather by long-range attraction, whose nature has not yet been elucidated.
While 2,3-bisphosphoglycerate (DPG) and other allosteric effectors of oxygen binding enhance the polymerization of deoxy-HbS (29), we found that the addition of DPG in molar ratios with respect to the Hb ranging from 1:10 to 10:1 does not induce L–L separation with any Hb form in the absence of PEG and does not change the temperature of L–L separation in the presence of PEG.
We also tested higher (0.5 and 1.0 M) concentrations of the phosphate buffer at the same pH 7.35 with oxy- and deoxy-HbA and S—the solubility of the deoxy-HbS polymers is significantly reduced at such buffer concentrations (5). We found that the L–L separation occurs at temperatures lower by ∼5–10°C and at Hb concentrations as low as 1 g/dl. Higher concentrations of inorganic ions have been shown to enhance the hydrophobic attraction between the protein molecules (30–32). If hydrophobic attraction is the main long-range force underlying the L–L separation (33), such attraction is a candidate mechanism underlying the observed buffer concentration effect.
No L–L separation occurs with any of the Hb forms tested if the solutions do not contain PEG, even if the Hb concentration is raised to 45 g/dl. With deoxy-HbS at concentrations lower than ∼30 g/dl and in the absence of PEG, the polymer domains, present at T >10°C, disappear at ∼40°C after crossing of the upper branch of the solubility curve (5, 34) and homogeneous solution obtains. Higher temperatures were not tested because of the danger of protein denaturation.
The lack of L–L separation in pure Hb solutions is attributable to the slight repulsion between the Hb molecules as evidenced by the dimensionless value of the second virial coefficient of 6–8 [higher than the 4, the value for noninteracting hard spheres (35, 36)]. In analogy to other studied proteins, we assume that PEG suppresses this repulsion and enhances the attraction between the protein molecules through a combination of depletion and specific forces, including enhancement of hydrophobicity (12, 37).
The red cell cytosol contains a long list of compounds with a variety of polar functional groups and in concentrations of the order of 1% (wt/vol) (38). Although the effects of these compounds on the interactions and the phase transitions in Hb solutions have not been studied, it is possible that many of these compounds have significant effects on these transitions. Thus, one can argue that the use of 1% (wt/vol) PEG in the experiments discussed here, in a sense, simulates the intraerythrocytic environment. Parallel experiments with lower PEG concentrations showed that L–L separation occurs and proceeds very similarly to that above even in the presence of 0.1% PEG (see Table 1).
Conclusions and Perspectives for Further Work
The existence of a dense liquid phase in the solutions of normal and sickle cell Hb at near-physiological conditions suggests a strategy for the search of a means to suppress the polymerization of sickle cell Hb. A positive outcome of this search could serve as a basis for the development of a treatment for sickle cell anemia. A first task is to investigate the thermodynamics of the L–L phase separation. This task includes determinations of the L–L coexistence curves in the plane (temperature, Hb concentration) and evaluations of the thermodynamic potentials associated with this phase transition.
A crucial next step is data and insight into the effects of additives on the phase diagram. Such insight would require investigations of the effects of the additives on the intermolecular interactions using, for instance, scattering and spectroscopic techniques, analytical centrifugation, etc. In contrast to protein crystallization, where virial expansions limited to the second-order terms in concentration seem to adequately characterize the interactions and nonideality, the high concentration of Hb demands the use of higher-order virial terms (35, 39). There exist at least two possible strategies for screening of the additives to be tested for their effects: start with the polyols, polyelectrolytes, and other polar organics used by protein crystallographers (40–42) or alternatively, test the compounds present in the red cell cytosol (38) that may be contributing to the physiological variability of the HbS polymerization in vivo (43).
To test if the additives that shift the L–L coexistence line affect the rate of nucleation of the HbS polymers, determinations of the nucleation rate will have to be performed in the presence and absence of an additive. These tests will require the development of a new method to measure the homogeneous nucleation rates of deoxy-HbS polymers. The existing methods extract the nucleation rates from the delay time for the onset of turbidity in polymerizing samples and rely on assumptions needed to separate the nucleation from the growth and replication of the polymers fibers (44–47).
Supplementary Material
Acknowledgments
We thank J. Hofrichter and W. Eaton for discussions of aspects of this work, and B. R. Thomas, M. D. Serrano, A. R. Feeling-Taylor, L. Adhock-Downey, and S. Bohannon for help with purification of the Hb and solutions preparation. This work was supported by grants from the National Heart, Lung, and Blood Institute, the National Institutes of Health (RO1 HL58038), and by the Office of Physical and Biological Sciences, National Aeronautics and Space Administration (NAG8-1354 and NAG8-1790).
Abbreviations
- L–L
liquid–liquid (phase separation)
- PEG
polyethylene glycol
Footnotes
This paper was submitted directly (Track II) to the PNAS office.
References
- 1.Steinberg M H, Forget B G, Higgs D R, Nagel R L. Disorders of Hemoglobin: Genetics, Pathology, Clinical Management. Cambridge, U.K.: Cambridge Univ. Press; 2000. [Google Scholar]
- 2.Cole-Strauss A, Yoon K, Xiang Y, Byrne B C, Rice M C, Crynn J, Holloman W K, Kmiec E B. Science. 1996;273:1386–1389. doi: 10.1126/science.273.5280.1386. [DOI] [PubMed] [Google Scholar]
- 3.Hahn E V, Gillespie E B. Arch Int Med. 1927;39:233–254. [Google Scholar]
- 4.Sunshine H R, Hofrichter J, Ferrone F A, Eaton W A. J Mol Biol. 1982;158:251–273. doi: 10.1016/0022-2836(82)90432-6. [DOI] [PubMed] [Google Scholar]
- 5.Eaton W A, Hofrichter J. In: Advances in Protein Chemistry. Anfinsen C B, Edsal J T, Richards F M, Eisenberg D S, editors. Vol. 40. San Diego: Academic; 1990. pp. 63–279. [DOI] [PubMed] [Google Scholar]
- 6.Samuel R E, Salmon E D, Briehl R W. Nature (London) 1990;345:833–835. doi: 10.1038/345833a0. [DOI] [PubMed] [Google Scholar]
- 7.Briehl R W. J Mol Biol. 1995;245:710–723. doi: 10.1006/jmbi.1994.0057. [DOI] [PubMed] [Google Scholar]
- 8.Corbett J D, Mickols W E, Maestre M F. J Biol Chem. 1995;270:2708–2715. doi: 10.1074/jbc.270.6.2708. [DOI] [PubMed] [Google Scholar]
- 9.Kaul D, Fabry M, Nagel R. Proc Natl Acad Sci USA. 1989;86:3356–3360. doi: 10.1073/pnas.86.9.3356. [DOI] [PMC free article] [PubMed] [Google Scholar]
- 10.Weatherall D J. Curr Biol. 1998;8:R696–R698. doi: 10.1016/s0960-9822(98)70439-7. [DOI] [PubMed] [Google Scholar]
- 11.Ohnishi S T. In: Membrane Abnormalities in Sickle Cell Disease. Ohnishi S T, Ohnishi T, editors. Boca Raton, FL: CRC Press; 1994. [Google Scholar]
- 12.Galkin O, Vekilov P G. Proc Natl Acad Sci USA. 2000;97:6277–6281. doi: 10.1073/pnas.110000497. [DOI] [PMC free article] [PubMed] [Google Scholar]
- 13.ten Wolde P R, Frenkel D. Science. 1997;277:1975–1978. doi: 10.1126/science.277.5334.1975. [DOI] [PubMed] [Google Scholar]
- 14.Talanquer V, Oxtoby D W. J Chem Phys. 1998;109:223–227. [Google Scholar]
- 15.Thomson J A, Schurtenberger P, Thurston G M, Benedek G B. Proc Natl Acad Sci USA. 1987;84:7079–7083. doi: 10.1073/pnas.84.20.7079. [DOI] [PMC free article] [PubMed] [Google Scholar]
- 16.Broide M L, Berland C R, Pande J, Ogun O O, Benedek G B. Proc Natl Acad Sci USA. 1991;88:5660–5664. doi: 10.1073/pnas.88.13.5660. [DOI] [PMC free article] [PubMed] [Google Scholar]
- 17.Asherie N, Lomakin A, Benedek G B. Phys Rev Lett. 1996;77:4832–4835. doi: 10.1103/PhysRevLett.77.4832. [DOI] [PubMed] [Google Scholar]
- 18.Samuel R E, Guzman A E, Briehl R W. Blood. 1993;82:3474–3481. [PubMed] [Google Scholar]
- 19.Ferrone F A, Hofrichter H, Sunshine H R, Eaton W A. Biophys J. 1980;32:361–380. doi: 10.1016/S0006-3495(80)84962-9. [DOI] [PMC free article] [PubMed] [Google Scholar]
- 20.Hofrichter H, Ross P D, Eaton W A. Proc Natl Acad Sci USA. 1974;71:4864–4868. doi: 10.1073/pnas.71.12.4864. [DOI] [PMC free article] [PubMed] [Google Scholar]
- 21.Ferrone F A, Hofrichter H, Eaton W A. J Mol Biol. 1985;183:591–610. doi: 10.1016/0022-2836(85)90174-3. [DOI] [PubMed] [Google Scholar]
- 22.Yau S-T, Petsev D N, Thomas B R, Vekilov P G. J Mol Biol. 2000;303:667–678. doi: 10.1006/jmbi.2000.4171. [DOI] [PubMed] [Google Scholar]
- 23.Bookchin R M, Balazs T, Wang Z, Josephs R, Lew V L. J Biol Chem. 1999;274:6689–6697. doi: 10.1074/jbc.274.10.6689. [DOI] [PubMed] [Google Scholar]
- 24.Makinen M W, Sigountos C W. J Mol Biol. 1984;178:439–476. doi: 10.1016/0022-2836(84)90152-9. [DOI] [PubMed] [Google Scholar]
- 25.ten Wolde P R, Oxtoby D W, Frenkel D. Phys Rev Lett. 1998;81:3695–3698. [Google Scholar]
- 26.Soga K G, Melrose J M, Ball R C. J Chem Phys. 1999;110:2280–2288. [Google Scholar]
- 27.Nagel R, Johnson J, Bookchin R, Garel M, Rosa J, Schiliro G, Wajcman H, Labie D, Moo-Penn W, Castro O. Nature (London) 1980;283:832–834. doi: 10.1038/283832a0. [DOI] [PubMed] [Google Scholar]
- 28.Wishner B, Ward K, Lattman E, Love W. J Mol Biol. 1975;98:179–194. doi: 10.1016/s0022-2836(75)80108-2. [DOI] [PubMed] [Google Scholar]
- 29.Poillon W N, Robinson M D, Kim B C. J Biol Chem. 1985;260:13897–13900. [PubMed] [Google Scholar]
- 30.Tanford C. Physical Chemistry of Macromolecules. New York: Wiley; 1961. [Google Scholar]
- 31.Tanford C. The Hydrophobic Effect: Formation of Micelles and Biological Membranes. New York: Wiley; 1980. [Google Scholar]
- 32.Eisenberg D, Kauzmann W. The Structure and Properties of Water. Oxford: Oxford Univ. Press; 1969. [Google Scholar]
- 33.Israelachvili J, Pashley R. Nature (London) 1982;300:341–342. doi: 10.1038/300341a0. [DOI] [PubMed] [Google Scholar]
- 34.Ross P D, Hofrichter J, Eaton W A. J Mol Biol. 1977;115:111–134. doi: 10.1016/0022-2836(77)90093-6. [DOI] [PubMed] [Google Scholar]
- 35.Minton A P. J Mol Biol. 1975;95:289–307. doi: 10.1016/0022-2836(75)90396-4. [DOI] [PubMed] [Google Scholar]
- 36.Hill T L. Thermodynamics of Small Systems. New York: Benjamin; 1963. [Google Scholar]
- 37.Kulkarni A M, Chatterjee A P, Schweitzer K S, Zukoski C F. Phys Rev Lett. 1999;83:4554–4557. [Google Scholar]
- 38.Pennell R B. In: The Red Blood Cell. Surgenor D M, editor. Vol. 1. New York: Academic; 1974. pp. 93–146. [Google Scholar]
- 39.Minton A P. J Mol Biol. 1977;110:89–103. doi: 10.1016/s0022-2836(77)80100-9. [DOI] [PubMed] [Google Scholar]
- 40.McPherson A. In: Methods in Enzymology. Wyckoff H W, Hirs C H W, Timasheff S N, editors. Vol. 114. Orlando, FL: Academic; 1985. pp. 120–125. [Google Scholar]
- 41.McPherson A. In: Crystallization of Membrane Proteins. Michel H, editor. Boca Raton, FL: CRC; 1990. pp. 1–51. [Google Scholar]
- 42.McPherson A. Crystallization of Biological Macromolecules. Plainview, NY: Cold Spring Harbor Lab. Press; 1999. [Google Scholar]
- 43.Koduri P R, Leon M, Honig G R, Lu S J. Am J Hematol. 1999;62:62. doi: 10.1002/(sici)1096-8652(199909)62:1<62::aid-ajh13>3.0.co;2-y. [DOI] [PubMed] [Google Scholar]
- 44.Ferrone F A, Hofrichter H, Eaton W A. J Mol Biol. 1985;183:611–631. doi: 10.1016/0022-2836(85)90175-5. [DOI] [PubMed] [Google Scholar]
- 45.Cao Z, Ferrone F A. Biophys J. 1997;72:343–352. doi: 10.1016/S0006-3495(97)78673-9. [DOI] [PMC free article] [PubMed] [Google Scholar]
- 46.Cao Z, Liao D, Mirchev R, Martin de Llano J J, Himanen J P, Manning J M, Ferrone F A. J Mol Biol. 1997;265:580–589. doi: 10.1006/jmbi.1996.0749. [DOI] [PubMed] [Google Scholar]
- 47.Ivanova M, Jasuja R, Kwong S, Briehl R W, Ferrone F A. Biophys J. 2000;79:1016–1022. doi: 10.1016/S0006-3495(00)76355-7. [DOI] [PMC free article] [PubMed] [Google Scholar]
Associated Data
This section collects any data citations, data availability statements, or supplementary materials included in this article.


