

Abstract
Loss of function of BRCA1 caused by inherited mutation and tissue-specific somatic mutation leads to breast and ovarian cancer. Nearly all BRCA1 germ-line mutations involve truncation or loss of the C-terminal BRCT transcriptional activation domain, suggesting that transcriptional regulation is a critical function of the wild-type gene. The purpose of this project was to determine whether there is a link between the role of BRCA1 in transcriptional regulation and its role in tumor suppression. We developed a cell line (in which BRCA1 can be induced) and used microarray analysis to compare transcription profiles of epithelial cells with low endogenous levels of BRCA1 vs. transcription profiles of cells with 2–4-fold higher induced levels of expression of BRCA1. At these levels of expression, BRCA1 did not induce apoptosis. Undirected cluster analysis of six paired experiments revealed 373 genes, the expression of which was altered significantly and consistently by BRCA1 induction. Expression of 62 genes was altered more than 2-fold. BRCA1-regulated genes associated with breast tumorigenesis included the estrogen-responsive genes MYC and cyclin D1, which are overexpressed in many breast tumors; STAT1 and JAK1, key components of the cytokine signal transduction pathway; the extracellular matrix protein laminin 3A; ID4, an inhibitor of DNA-binding transcriptional activators, which in turn negatively regulates BRCA1 expression; and the prohormone stanniocalcin, expression of which is lost in breast tumor cells. Coordinated expression of BRCA1 with ID4 and with stanniocalcin was confirmed in primary breast and ovarian tumors.
BRCA1 is a tumor-suppressor gene in which germ-line mutations predispose to breast and ovarian cancer (1, 2). Tumorigenesis in individuals with germ-line BRCA1 mutations requires somatic inactivation of the remaining wild-type allele (3). In breast and ovarian tumors of patients with no BRCA1 germ-line mutation, expression of BRCA1 is reduced also (4–6). BRCA1 null cells are severely aneuploid with unstable karyotypes (7). BRCA1 regulates multiple nuclear processes including DNA repair and recombination, checkpoint control of the cell cycle, and transcription (reviewed in ref. 8). Much of the evidence for involvement of BRCA1 in these processes is based on identification of multiprotein complexes in which BRCA1 is found. BRCA1 associates with RAD51 and BRCA2 in nuclear foci induced by ionizing radiation (9, 10). RAD 51 catalyzes strand exchange during homology-directed repair of DNA double-strand breaks by gene conversion, suggesting a role for BRCA1 in DNA repair by homologous recombination. BRCA1 also associates directly with the MRE11–RAD50–NBS1 complex, which is responsible for end-processing of double-strand breaks (11, 12). In addition, BRCA1 is involved in the repair of oxidative DNA damage by transcription-coupled repair (13, 14). BRCA1 is found in two large complexes involved in DNA repair and chromatin remodeling. BRCA1 is a component of BASC, a BRCA1-associated genome surveillance complex that contains proteins implicated in both DNA-damage sensing and repair (15), and of a large SWI/SNF-related complex that has chromatin remodeling capacity (16). BRCA1 is known to be involved in transcriptional regulation in that it acts in concert with the RNA Pol II holoenzyme, transcription factors, acetylases, and deacetylases and their associated proteins CBP/p300 and CtIP (reviewed in ref. 17). Overexpression of BRCA1 induces genes in the apoptotic pathway (18, 19). Increased expression of BRCA1 leads to repression of estrogen receptor (ER)-mediated transcription (20–22).
Our purpose in this project was to determine whether there is a link between the role of BRCA1 in transcriptional regulation and its role in tumor suppression by identifying transcriptional targets of BRCA1 that are involved in breast tumorigenesis. We developed an epithelial cell line in which BRCA1 could be induced at modest levels and then used microarray technology to investigate changes in the cellular transcription profile in response to induction of BRCA1. In six replicate experiments, after induction of BRCA1 expression levels of 373 genes were altered consistently, 62 of them at least 2-fold. Among those implicated in breast tumorigenesis are cyclin D1, JAK1 and STAT1, MYC, and ID4. These experiments also revealed that BRCA1 induction was highly correlated with expression of the extracellular matrix protein laminin A3 (LAMA3) and with stanniocalcin (STC1), a prohormone whose loss may serve as a marker of breast and ovarian cancer.
Materials and Methods
Generation of Cell Lines with Inducible BRCA1 Expression.
A full-length BRCA1 cDNA was assembled from partial cDNA clones kindly provided by I. M. Verma (The Salk Institute, La Jolla, CA). Sequence-verified, full-length wild-type BRCA1 was cloned downstream of the ecdysone-inducible promoter in pIND (Invitrogen).
EcR-293 (Invitrogen) is a human embryonal kidney epithelial cell line that stably expresses pVgRXR, which encodes a heterodimer of the ecdysone receptor and the retinoid X receptor. EcR-293 was used to generate stably transfected clonal cell lines EcR-293 pIND-BRCA1. The EcR-293 cell line was chosen to evaluate BRCA1 effects on expression in noncancerous epithelial cells, in particular to evaluate the effect of BRCA1 in cells with modest endogenous levels of BRCA1 expression (Fig. 1). ER status of EcR-293 cells was tested with an ERα monoclonal antibody (Immunotech, Westbrook, ME). EcR-293 cells are positive for ERα (see Fig. 4, which is published as supporting information on the PNAS web site, www.pnas.org) and hence may provide results similar to breast epithelial cells in these expression experiments. Ideally, experiments would have been carried out in a BRCA1-null breast or ovarian cell line, but from HCC1937 (7), the only such cell line currently available, we were unable to isolate stable clones expressing pVgRXR. Noncancerous breast and ovarian cell lines have high endogenous expression of BRCA1 and thus were not suited for this project.
Figure 1.

Inducible expression of BRCA1 in kidney epithelial cell line EcR-293. (A) Western analysis of total cell lysates showing induction of BRCA1 protein by increasing concentrations of ponasterone A. BRCA1 was detected by using BRCA1 polyclonal antibody Ab-1 (PharMingen) to residues 768–793 of exon 11. To control for loading, samples were probed also with an actin antibody (I-19, Santa Cruz Biotechnology). Cells were induced with increasing concentrations of ponasterone A in 100% ethanol, and levels of BRCA1 protein were compared. Cells represented in the first lane were mock-induced with ethanol alone. (B) Expression of BRCA1 protein at 0, 4, 8, 12, 24, and 48 h after induction by 10 μM ponasterone A. Maximal induction of BRCA1 was seen at 12 h. (C) Modest increase of BRCA1 protein expression in three pIND-BRCA1 clones (+) induced with 10 μM ponasterone A and harvested at 12 h. Control (−) cells contain pIND vector alone.
In EcR-293 cells with the pIND-BRCA1 vector, BRCA1 expression was induced by addition of varying concentrations of ponasterone A in 100% ethanol. Control lines were generated by transfecting EcR-293 cells with pIND lacking BRCA1. These control lines were developed to control for the possibility of leaky expression of BRCA1 in pIND-BRCA1-transfected but uninduced cell lines. Control lines were mock-induced by treating with ethanol alone. Growth rates of EcR-293 cells were not affected by induction of BRCA1 by 10 μM ponasterone A (see Table 3, which is published as supporting information on the PNAS web site)
Oligonucleotide Array-Based Expression Profiling.
Hybridization was to HuGeneFL probe arrays (Affymetrix, Santa Clara, CA) containing probe sets representing ≈6,800 genes (http://www.netaffx.com/index2.jsp). The arrays were synthesized by using light-directed combinatorial chemistry as described (23, 24). The target was labeled and hybridized to probe arrays, washed, stained, and scanned as described (25). GENECHIP 3.2 software (Affymetrix) was used to scan and quantitatively analyze image data (26).
Statistical Analyses.
To compare signal intensities of cRNA samples from BRCA1-induced lines vs. control lines, a Student's paired t statistic and corresponding two-tailed P value were calculated for each probe set. The t test had a value of P < 0.01 for 549 of the 6,800 probe sets. To evaluate robustness of the observed differences, a simulation was carried out for each gene. A random number drawn from a normal distribution with the observed mean intensity of the gene of interest and an SD of 29 was added or subtracted to each expression level for all experiments involving that gene. [An SD of 29 was chosen because this was the SD of background intensity for the HuGeneFL probe arrays (Stefan Bekiranov, personal communication).] A t statistic was calculated for each of 10,000 simulated sets of values. Probe sets with >80% of simulated t statistics with significance levels of P < 0.01 were retained in the analysis. The result of this approach was to exclude probe sets with inconsistent differences in expression and/or very low expression levels. A total of 373 probe sets remained (see Table 4, which is published as supporting information on the PNAS web site). For 62 of these probe sets, expression was altered at least 2-fold after induction of BRCA1 (Table 1).
Table 1.
Genes with expression altered ≥2-fold by induction of BRCA1
| FC | P | ||
|---|---|---|---|
| Genes up-regulated at least 2-fold | |||
| PBP | Progesterone-binding protein | 2.1 | 0.000000001 |
| XIST | X inactivation-specific transcript | 2.0 | 0.000000021 |
| JAK1 | Janus kinase 1 | 2.4 | 0.000000120 |
| H1F0 | H1 histone family member 0 | 4.6 | 0.000000143 |
| SEPP1 | Selenoprotein plasma protein 1 | 3.2 | 0.000000167 |
| TSNAX | Translin-associated factor X | 2.2 | 0.000000169 |
| MGAT2 | UDP-N-acetylglucosamine | 2.3 | 0.000000207 |
| STC1 | Stanniocalcin 1 | * | 0.000000335 |
| CALD1 | Caldesmon 1 | 2.6 | 0.000000878 |
| ID4 | Inhibitor of DNA binding 4 | 2.1 | 0.000001982 |
| SEC23A | Yeast coat protein complex homolog | 4.6 | 0.000003792 |
| HSEC10L1 | Saccharomyces cerevisiae Sec10 homolog | 2.0 | 0.000006669 |
| STAT1 | Signal transducer/activator of transcription 1 | 2.5 | 0.000006687 |
| VAMP3 | Vesicle-associated membrane protein 3 | 2.3 | 0.000006743 |
| FSTL1 | Follistatin-like 1 | 2.6 | 0.000007804 |
| EXTL2 | ER-localized transmembrane glycoprotein | 3.6 | 0.000009654 |
| CCNG2 | Cyclin G2 | 2.8 | 0.000022558 |
| CITED2 | CBP/p300 transactivator 2 | 2.1 | 0.000030661 |
| ZNF138 | Zinc-finger protein 138 | 2.2 | 0.000034285 |
| IDH1 | Isocitrate dehydrogenase 1 | 2.7 | 0.000044311 |
| RDX | Radixin | 3.1 | 0.000049391 |
| LIPA | Lipase A | 2.0 | 0.000077373 |
| TFPI2 | Placental tissue factor pathway inhibitor 2 | 2.6 | 0.000085673 |
| GALNT3 | N-acetylgalactosaminyltransferase 3 | 4.2 | 0.000104696 |
| ZNF148 | Zinc-finger protein 148 | 2.0 | 0.000162264 |
| IL16 | Interleukin 16 | 3.5 | 0.000164512 |
| Clone 23654 | 2.7 | 0.000206851 | |
| ADD1 | Adducin 1 | 2.3 | 0.000214371 |
| COP9 | COP9 subunit 3 | 2.0 | 0.000303657 |
| NFYC | Nuclear transcription factor Y, γ | 2.1 | 0.000324739 |
| RRM2 | Ribonucleotide reductase subunit 2 | 3.0 | 0.000330498 |
| WRB | Tryptophan-rich basic protein | 2.0 | 0.000497318 |
| PPP1R1A | Protein phosphatase 1, regulatory subunit 1A | 3.2 | 0.000555381 |
| CLTB | Clathrin, light polypeptide B | 2.1 | 0.000636264 |
| KCNK1 | Inward rectifier potassium channel | 4.6 | 0.000859100 |
| MAP2K1 | Mitogen-activated protein kinase kinase 1 | 2.0 | 0.000927703 |
| KIF2 | Kinesin heavy chain 2 | 2.4 | 0.001087503 |
| LIMS1 | LIM and senescent cell antigen-like domain 1 | 2.5 | 0.001222557 |
| ENPP2 | Ectonucleotide phosphodiesterase 2 | 2.2 | 0.001490592 |
| P2RX1 | Ligand-gated ion channel receptor P2X | * | 0.001500864 |
| LAMA3 | Laminin, α-3 | 2.5 | 0.001766256 |
| TITF1 | Thyroid transcription factor 1 | 2.2 | 0.001914450 |
| ELANH2 | Protease inhibitor 2 | 2.0 | 0.001961468 |
| HTATIP | HIV tat-interacting protein | 2.0 | 0.002684862 |
| MICA1 | MHC complex, class I-related gene A | 2.3 | 0.002696680 |
| APP | Amyloid β-A4 precursor protein | 2.3 | 0.002849816 |
| TCRA | T-cell antigen receptor, α-subunit | 2.3 | 0.003462359 |
| Genes down-regulated at least 2-fold | |||
| HRC1 | HRAS-related cluster 1 | 2.7 | 0.000003770 |
| NDRG1 | NMYC downstream-regulated gene 1 | 2.1 | 0.000005786 |
| CCND1 | Cyclin D1 | 3.2 | 0.000006137 |
| RCD8 | Autoantigen RCD8 | 2.7 | 0.000045533 |
| BOP1 | Block of proliferation 1 | 2.0 | 0.000065637 |
| SLC19A1 | Folate transporter | 3.1 | 0.000078335 |
| NUP214 | Nucleoporin 214 KD | 2.1 | 0.000120736 |
| HSF1 | Heat-shock transcription factor 1 | 3.5 | 0.000226709 |
| MYC | MYC oncogene | 4.2 | 0.000284874 |
| RXRA | Retinoid X receptor-α | 2.0 | 0.000422080 |
| SLC6A10 | Solute carrier family 6, member 10 | 2.4 | 0.000709731 |
| CHD4 | Chromatin helicase DNA-binding protein 4 | 2.3 | 0.002507142 |
| GCN5L2 | Control of amino acid synthesis homolog 2 | 2.0 | 0.002548543 |
| SKIV2L | Superkiller viralicidic activity 2 | 3.0 | 0.005094432 |
| EIF4G1 | Eukaryotic translation initiation factor 4γ | 2.4 | 0.007209999 |
FC, fold change in expression caused by induction of BRCA1.
Expression was not detectable in any control lines but was significantly above background in BRCA1+ lines. Details are shown in Table 4.
Immunohistochemical Analysis.
Tissues from 168 sporadic breast and ovarian cancers were obtained from the University of Washington and the Women's Health Hospital in Baton Rouge, LA. Of the 104 breast tumors, 83 were infiltrating ductal carcinoma, 12 were lobular carcinoma, 7 were ductal carcinoma in situ (DCIS), and 2 were cancers of unknown pathology. Of the 64 ovarian tumors, 54 were papillary serous adenocarcinoma, and 10 were other adenocarcinomas. Sections were deparaffinized and heated to induce epitope retrieval, and endogenous peroxidases were inactivated by using the Dako LSAB+ kit as directed by the manufacturer. Specimens stained with the BRCA1 and ID4 antibodies were washed in three changes of PBS and blocked in 2%BSA/PBS for 3 h while those stained with the STC1 antibody were blocked in 2%BSA/10% goat serum (Vector Laboratories)/PBS for 3 h. Specimens were exposed to BRCA1 and ID4 antibodies for 16 h at 4°C and to STC1 antibody for 2 h at room temperature and then washed again in several changes of PBS. Secondary antibody incubation and signal amplification were performed by using the Dako LSAB+ kit. Samples were counter-stained with methyl green.
Results and Discussion
Inducible Expression of BRCA1.
Induction of BRCA1 protein expression in the experimental system was characterized by Western blot (Fig. 1). Ponasterone A (10 μM) induced BRCA1 protein ≈2–4-fold over endogenous levels (Fig. 1A). At this level of induction, maximal BRCA1 protein expression occurred ≈12 h after the addition of ponasterone A (Fig. 1B). Using the conditions described above, we assayed induced BRCA1 protein in three Ecr-293 lines and found BRCA1 protein to be induced ≈2–4-fold in each (Fig. 1C). BRCA1 induction at this level did not stimulate apoptosis (Table 3). Total RNA was isolated from each clone 16–18 h after the addition of ponasterone A. This window was chosen to follow maximal BRCA1 protein induction and before induced BRCA1 protein levels decreased, thereby capturing a large proportion of the genes regulated by BRCA1. RNA from three induced and three control cell lines was labeled, and each preparation was hybridized to two microarrays for a total of six parallel experiments. To identify those genes with expression consistently altered by BRCA1, we carried out the tiered statistical analysis described above.
The profile of genes transcriptionally responsive to BRCA1 is shown in Fig. 2. The profile comprises 373 genes that met our statistical criteria for significance and consistency. The impact of BRCA1 on expression differed by gene function. Hormones and receptors and genes encoding structural proteins were more likely to be transcriptionally activated by BRCA1, and those involved in DNA replication and translation were more likely to be repressed after BRCA1 induction (see Table 5, which is published as supporting information on the PNAS web site). Genes with expression levels that were altered at least 2-fold are listed in Table 1; all 373 BRCA1-responsive genes are listed in Table 4.
Figure 2.
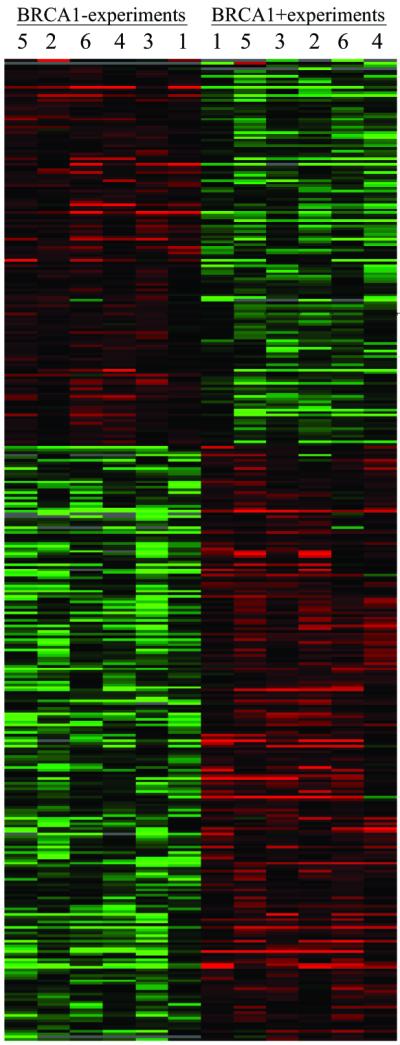
Profile of genes with altered expression in response to induction of BRCA1. Matrices were constructed by using the programs CLUSTER and TREEVIEW (62, 63). Each row represents a single probe set; each column represents cRNA from a control cell line (left-hand six columns of each matrix) or after induction of BRCA1 (right-hand six columns of each matrix). BRCA1− cell lines and BRCA1+ cell lines were clearly distinguished by undirected CLUSTER analysis. The color of each cell in the matrix is determined by the ratio of expression in that cell compared with expression of the same probe set in other experiments in the same row. Red represents higher expression levels, green represents lower expression levels, and black represents expression near the median for that probe set. Genes with the most similar expression profiles across experiments are clustered, as are experiments with the most similar expression profiles across genes. Clustering of experiments with different clones reflects parallel response to induction in the three clones. Fold change in expression level and P values (all P < 0.01) for the 373 genes altered in response to BRCA1 induction are listed in Table 4.
BRCA1 and Estrogen-Regulated Genes.
Induction of BRCA1 led to more than 3-fold reduction in expression of cyclin D1 (CCND1; Table 1). CCND1 is a component of the core cell-cycle machinery that is expressed in all proliferating cell types (27). Transcriptional activation of cyclin D1 involves cis-acting promoter elements that bind ERα (28). Several lines of evidence suggest that CCND1 plays an important role in breast cancer development. CCND1 is genomically amplified in ≈20% of breast cancers, and the protein is overexpressed in more than 50% of breast tumors (29–31). Transgenic mice engineered to overexpress cyclin D1 in mammary glands succumb to breast cancer (32). Mammary tumors in mice carrying a conditional disruption of Brca1 overexpress cyclin D1 (33). However, cyclin D1 is not genomically amplified in tumors of patients with BRCA1 mutations (34). Hence, overexpression of CCND1 in inherited or sporadic breast cancer may be caused by loss of transcriptional repression of CCND1 by BRCA1.
Induction of BRCA1 led to 4.2-fold reduction in expression of MYC. MYC affects normal and neoplastic cell proliferation by altering gene expression. Approximately 20% of breast tumors overexpress MYC (35). Constitutively high levels of MYC expression result in reduced growth-factor requirements and increased growth rates that may circumvent cell-cycle arrest. BRCA1 interacts with MYC to repress MYC-mediated transcription (36). MYC expression is known to be stimulated by estrogen in human breast cancer cell lines, noncancerous estrogen-dependent tissues, and normal human breast epithelial cells in culture (37–40). However, it is not clear how estrogen regulates MYC expression, because the MYC promoter does not contain a canonical estrogen-responsive element (41). It is possible that estrogen stimulation of MYC is mediated by BRG1, a component of the SWI/SNF chromatin-remodeling complex, which directly interacts with BRCA1 (16). It has been shown that ER-mediated transcriptional activation requires functional BRG1 (42). When complexed with BRG1, BRCA1 may prevent ERα from associating with BRG1, thereby inhibiting ERα-mediated transcriptional activation of MYC. Hence, loss of BRCA1 might enable BRG1 to interact with ERα, activating MYC transcription.
Given that DNA-damage response pathways are conserved between cell types, it is paradoxical that germ-line inactivation of BRCA1 leads predominantly to breast and ovarian cancer. There is increasing evidence that this specificity may be related to the capacity of BRCA1 to modulate transcriptional activity of steroid receptors and hence expression of hormone-responsive genes (20, 22, 43, 44). One model for the tissue specificity of tumor suppression by BRCA1 invokes a role for BRCA1 in the modulation of estrogen-signaling pathways. BRCA1 inhibits the transcriptional activation function of ERα through direct interaction with promoter-bound ERα (20, 22). In addition, BRCA1 functions as a barrier to transcriptional activation by unliganded ERα (21). In ER-positive cell lines, transcription of cyclin D1 and MYC were stimulated by estrogen (37, 38, 40, 45). In the cell lines used in our studies, which also are ER-positive (Fig. 4), cyclin D1 and MYC are transcriptionally repressed in response to BRCA1. It is possible tha BRCA1 represses transcription of these estrogen-responsive genes by blocking transcriptional activation by ERα. In estrogen-responsive tissues, it is possible that loss of BRCA1 promotes ERα-mediated activation of MYC and CCND1 and hence increased production of these proteins. BRCA1 may function as a tissue-specific tumor suppressor by regulating expression of estrogen-responsive genes in breast and ovarian epithelial cells. Interestingly, MYC represses transcription of CCND1 (46). Therefore, BRCA1 may repress CCND1 by interacting with MYC. Inversely, loss of BRCA1 could result in increased MYC expression and subsequently increased CCND1 activity.
It is well documented that overexpression of BRCA1 induces the DNA damage-responsive gene GADD45 and initiates apoptosis (18, 19). In our microarray experiments, GADD45 was up-regulated on average 1.3-fold in response to induction of BRCA1, but the response was not consistent across experiments. The difference between our results and those previously reported are likely caused by differences in induced levels of BRCA1 expression. Induction of GADD45 followed 60-fold overexpression of BRCA1 message and 10-fold overexpression of BRCA1 protein (18). In our experiments, the BRCA1 message was overexpressed 8-fold and BRCA1 protein 2–4-fold. No growth inhibition caused by these modest levels of BRCA1 induction was detected over 7 days of continuous induction (Table 3).
Correlated Expression of BRCA1 and ID4.
BRCA1 regulates expression of numerous genes involved in transcription (Tables 1 and 4). Among these, ID4 is especially intriguing because ID4 has been shown already to regulate transcription of BRCA1 (47). ID4 is a member of the ubiquitiously expressed family of ID helix–loop–helix proteins that function as dominant negative regulators of basic helix–loop–helix transcription factors (reviewed in ref. 48). The reciprocal regulation of ID4 by BRCA1 may establish a regulatory loop to enable appropriately cycling levels of expression of both genes during normal cell division. To determine whether coordinated expression of BRCA1 and ID4 on the microarrays would be reflected in correlated expression of BRCA1 and ID4 proteins in primary breast and ovarian cancer, we evaluated expression by immunohistochemistry of BRCA1 and ID4 proteins in primary infiltrating ductal breast tumors and primary ovarian adenocarcinomas (Fig. 3, Table 2). The staining intensities of BRCA1 and ID4 were highly correlated for breast tumors (r2 = 0.72, P < 0.0001) and modestly correlated for ovarian tumors (r2 = 0.28, P = 0.03). The BRCA1–ID4 regulatory loop may be a molecular pathway disrupted in many breast and ovarian cancers.
Figure 3.

Expression of BRCA1, ID4, and STC1 proteins in normal breast ductal epithelium, primary breast cancer, normal ovarian epithelium, and primary ovarian cancer. Adjacent 4-μm tissue sections were stained with hematoxylin/eosin to reveal cellular structure, with BRCA1 monoclonal antibody MS 110 (Oncogene Science) to amino acid 1–304, diluted 1:250, with ID4 polyclonal antibody L-20 (Santa Cruz Biotechnology), which recognizes the C terminus of ID4, diluted 1:200, and with STC1 polyclonal antibody (Human Genome Sciences, Rockville, MD). BRCA1 is expressed strongly in the nuclei of epithelial cells surrounding the normal breast duct and in the nuclei of the single layer of epithelial cells lining the normal ovary. In contrast, in the primary breast tumor, BRCA1 expression is absent; a few darkly stained stromal cells are present. In the primary ovarian cancer, most cells have no BRCA1 expression; a few tumor cells have low levels of staining. ID4 is expressed in normal breast and ovarian epithelial cells but is reduced greatly in these breast and ovarian cancers. STC1 is expressed in normal breast and ovarian epithelial cells but not in these breast or ovarian tumor cells; a cluster of darkly stained stromal cells are present in the ovarian cancer specimen stained for STC1.
Table 2.
Expression of BRCA1 and ID4 and of BRCA1 and STC1 in breast and ovarian cancers
| Breast cancers: BRCA1
|
Ovarian cancers: BRCA1
|
Breast cancers: BRCA1
|
Ovarian cancers: BRCA1
|
||||||||||||||||||||
|---|---|---|---|---|---|---|---|---|---|---|---|---|---|---|---|---|---|---|---|---|---|---|---|
| ID4 | 0 | 1 | 2 | 3 | 4 | ID4 | 0 | 1 | 2 | 3 | 4 | STC1 | 0 | 1 | 2 | 3 | 4 | STC1 | 0 | 1 | 2 | 3 | 4 |
| 0 | 3 | 1 | 0 | 0 | 0 | 0 | 1 | 1 | 1 | 0 | 0 | 0 | 5 | 1 | 2 | 0 | 0 | 0 | 1 | 0 | 1 | 0 | 1 |
| 1 | 1 | 7 | 1 | 1 | 0 | 1 | 1 | 2 | 4 | 2 | 2 | 1 | 3 | 4 | 2 | 3 | 0 | 1 | 1 | 6 | 2 | 2 | 4 |
| 2 | 2 | 3 | 14 | 4 | 0 | 2 | 2 | 3 | 8 | 0 | 3 | 2 | 2 | 5 | 16 | 8 | 1 | 2 | 3 | 4 | 10 | 1 | 1 |
| 3 | 1 | 1 | 2 | 8 | 4 | 3 | 1 | 5 | 4 | 3 | 1 | 3 | 0 | 0 | 3 | 8 | 1 | 3 | 1 | 2 | 6 | 6 | 2 |
| 4 | 2 | 1 | 2 | 9 | 13 | 4 | 1 | 1 | 5 | 4 | 7 | 4 | 0 | 1 | 0 | 2 | 10 | 4 | 0 | 0 | 2 | 1 | 3 |
Staining intensity was scored on a five-point scale from no visible expression (0) to intensity equal to that in normal epithelial cells (4).
BRCA1 and Growth Inhibition.
Induction of BRCA1 up-regulates expression of STAT1 (2.5-fold) and JAK1 (2.4-fold). JAK and STAT proteins mediate cytokine and growth-factor signal transduction pathways that govern cellular proliferation, differentiation, apoptosis, and transformation. In response to extracellular ligands, STAT proteins, a family of latent transcription factors, become activated through phosphorylation by their associated kinases (JAKs). Activated STATs dimerize and accumulate in the nucleus where they recognize specific DNA elements in promoters of genes to activate transcription. BRCA1 directly interacts with STAT1 dimers to activate a family of IFNγ-regulated genes involved in growth inhibition (49). Together IFNγ and BRCA1 induce expression of the cyclin-dependent kinase inhibitor p21. In BRCA1-null cells, IFNγ induction of p21 was impaired, suggesting involvement of BRCA1 in the IFNγ-dependent antiproliferative response. [In our experiments, BRCA1 induction was associated with a consistent significant increase in p21 expression (P = 0.005), but this increase was only 1.4-fold (Table 4).]
The importance of STAT1 activation to growth control is supported by observations in Stat1-null mice and STAT1-deficient cells in culture. Over time, Stat1-deficient mice develop spontaneous and chemically induced tumors more readily than do normal animals (50). Stat 1−/− p53−/− mice undergo greatly enhanced tumor formation. In cell culture systems, STAT1-deficient cells exhibit a defective response to INFγ, suggesting that STAT1 plays an important role in ligand-mediated growth arrest and apoptosis (51, 52). The slower growth of cultured cells after treatment with INFγ depends on fully transcriptionally activated STAT1 (53). The observation that STAT1 is known to promote growth inhibition and apoptosis in breast epithelial cells suggests that loss of STAT1 may lead to increased breast tumor formation (reviewed in ref. 54). Loss of this important cellular signaling pathway in breast epithelial cells may be caused in part by loss of BRCA1 if transcriptional activation of STAT1 and JAK1 were reduced in breast epithelial cells lacking BRCA1. Together, these observations suggest that STAT1 activation plays an important role in suppressing proliferation and promoting apoptosis. Our observation that BRCA1 up-regulates STAT1 expression suggests that loss of BRCA1 may contribute to reduction of STAT1, which in turn would promote cellular proliferation and suppress apoptosis, ultimately leading to increased tumor formation.
BRCA1 regulates expression of a wide variety of genes involved in maintenance of cell structure and extracellular matrix. BRCA1 increases expression of laminin-5 subunit-α3A (LAMA3). Laminin-5, a heterotrimeric protein consisting of three subunits (α3A, β3, and γ2), is the major extracellular matrix protein produced in mammary epithelial cells. Laminin-5 is found in the basement membrane, a dense sheet of proteins that separates the breast epithelium from connective tissue. Laminin-5, in conjunction with many other pathways, mediates the differentiation of mammary epithelial cells. Laminin-5 is down-regulated markedly in breast cancer cells (55, 56). Loss of laminin-5 likely contributes to the undifferentiated phenotype of breast cancer cells. Little is known about how laminin expression is regulated in normal breast epithelial cells or about the mechanism responsible for loss of laminin expression in breast cancer cells. LAMA3 is not expressed in breast cancer cells (57). Hence, loss of BRCA1 in primary breast tumors may contribute in part to down-regulation of laminin-5, ultimately facilitating migration and invasion during breast cancer progression.
A Possible Indicator of Breast or Ovarian Cancer.
Loss of BRCA1 expression occurs in all inherited and many sporadic breast and ovarian cancers. Hence genes regulated by BRCA1 also may undergo altered expression in these tumors. Ideally, such genes would include some that encode proteins that are secreted or found on the surface of mammary or ovarian epithelium such that fluctuations in their expression would serve to indicate the presence of tumor cells. One promising gene with these features is STC1. Of all of the genes evaluated, expression of STC1 was associated most strongly with BRCA1 induction (Table 1). No expression of STC1 was detectable in control lines without exogenous BRCA1, whereas all BRCA1-induced cells revealed levels of expression of STC1 substantially above the background intensity on the microarrays (Table 1). STC1 is a secreted polypeptide hormone that first was discovered to play an integral role in maintaining calcium and phosphate homeostasis in fish (58). Independently, in a study designed to identify genes differentially expressed in human breast tumor cells vs. normal cells, a then-anonymous transcript was identified that was detectable only in normal mammary epithelial cells and not in breast tumor cells (59). This transcript is STC1. STC1 also is expressed differentially in normal ovarian epithelial cells compared with ovarian cancer cell lines (60).
The mammalian STC1 hormone probably functions as a local mediator. STC1 is most highly expressed in ovary with expression dramatically increased during pregnancy and lactation (61). During pregnancy, STC1 expression is up-regulated 15-fold and becomes detectable in the serum, suggesting an endocrine role during gestation. Ovarian STC1 expression is induced also during lactation. Developing oocytes lack STC1 message; however, they stain strongly for STC1 protein, implicating STC1 in oocyte maturation. Together, these observations suggest that regulation of STC1 expression is critical to normal breast and ovarian physiology.
We screened primary breast and ovarian cancers for altered expression of STC1 protein. Fig. 3 illustrates normal BRCA1 and STC1 expression in a breast duct and ovarian epithelium and reduced expression of both BRCA1 and STC1 in primary sporadic breast and ovarian cancers. Levels of BRCA1 and STC1 protein expression in each of 141 breast and ovarian tumors are indicated in Table 2. BRCA1 and STC1 expression were highly correlated in breast tumors (r2 = 0.71, P < 0.0001) but not in ovarian tumors (r2 = 0.22, P = 0.09). The observations that STC1 is a secreted hormone, BRCA1 regulates STC1 expression, and loss of BRCA1 and STC1 protein expression are correlated in primary breast tumors suggest that loss of STC1 expression and protein may be a marker of early breast tumorigenesis.
Supplementary Material
Acknowledgments
We thank Nila A. Shah for technical assistance, Denise Montell for helpful discussion, and the Women's Hospital of Baton Rouge for providing breast tumor samples. This work was supported by National Institutes of Health Grant RO1 CA27632 (to M.-C.K.) and a Komen Foundation award (to P.L.W.). M.-C.K. is an American Cancer Society research professor.
Abbreviations
- ER
estrogen receptor
- STC1
stanniocalcin
References
- 1.Hall J M, Lee M K, Newman B, Morrow J E, Anderson L A, Huey B, King M-C. Science. 1990;250:1684–1689. doi: 10.1126/science.2270482. [DOI] [PubMed] [Google Scholar]
- 2.Miki Y, Swensen J, Shattuck-Eidens D, Futreal P A, Harshman K, Tavtigian S, Liu Q, Cochran C, Bennett L M, Ding W, et al. Science. 1994;266:66–71. doi: 10.1126/science.7545954. [DOI] [PubMed] [Google Scholar]
- 3.Smith S A, Easton D F, Evans D G, Ponder B A. Nat Genet. 1992;2:128–131. doi: 10.1038/ng1092-128. [DOI] [PubMed] [Google Scholar]
- 4.Thompson M E, Jensen R A, Obermiller P S, Page D L, Holt J T. Nat Genet. 1995;9:444–450. doi: 10.1038/ng0495-444. [DOI] [PubMed] [Google Scholar]
- 5.Wilson C A, Ramos L, Villasenor M R, Anders K H, Press M F, Clarke K, Karlan B, Chen J J, Scully R, Livingston D, et al. Nat Genet. 1999;21:236–240. doi: 10.1038/6029. [DOI] [PubMed] [Google Scholar]
- 6.Russell P A, Pharoah P D, De Foy K, Ramus S J, Symmonds I, Wilson A, Scott I, Ponder B A, Gayther S A. Int J Cancer. 2000;87:317–321. doi: 10.1002/1097-0215(20000801)87:3<317::aid-ijc2>3.0.co;2-b. [DOI] [PubMed] [Google Scholar]
- 7.Tomlinson G E, Chen T T, Stastny V A, Virmani A K, Spillman M A, Tonk V, Blum J L, Schneider N R, Wistuba I I, Shay J W, et al. Cancer Res. 1998;58:3237–3242. [PubMed] [Google Scholar]
- 8.Venkitaraman A R. Cell. 2002;108:171–182. doi: 10.1016/s0092-8674(02)00615-3. [DOI] [PubMed] [Google Scholar]
- 9.Scully R, Chen J, Plug A, Xiao Y, Weaver D, Feunteun J, Ashley T, Livingston D M. Cell. 1997;88:265–275. doi: 10.1016/s0092-8674(00)81847-4. [DOI] [PubMed] [Google Scholar]
- 10.Chen P L, Chen C F, Chen Y, Xiao J, Sharp Z D, Lee W H. Proc Natl Acad Sci USA. 1998;95:5287–5292. doi: 10.1073/pnas.95.9.5287. [DOI] [PMC free article] [PubMed] [Google Scholar]
- 11.Zhong Q, Chen C F, Li S, Chen Y, Wang C C, Xiao J, Chen P L, Sharp Z D, Lee W H. Science. 1999;285:747–750. doi: 10.1126/science.285.5428.747. [DOI] [PubMed] [Google Scholar]
- 12.Tsubouchi H, Ogawa H. Mol Cell Biol. 1998;18:260–268. doi: 10.1128/mcb.18.1.260. [DOI] [PMC free article] [PubMed] [Google Scholar]
- 13.Scully R, Livingston D M. Nature (London) 2000;408:429–432. doi: 10.1038/35044000. [DOI] [PMC free article] [PubMed] [Google Scholar]
- 14.Gowen L C, Avrutskaya A V, Latour A M, Koller B H, Leadon S A. Science. 1998;281:1009–1012. doi: 10.1126/science.281.5379.1009. [DOI] [PubMed] [Google Scholar]
- 15.Wang Y, Cortez D, Yazdi P, Neff N, Elledge S J, Qin J. Genes Dev. 2000;14:927–939. [PMC free article] [PubMed] [Google Scholar]
- 16.Bochar D A, Wang L, Beniya H, Kinev A, Xue Y, Lane W S, Wang W, Kashanchi F, Shiekhattar R. Cell. 2000;102:257–265. doi: 10.1016/s0092-8674(00)00030-1. [DOI] [PubMed] [Google Scholar]
- 17.Monteiro A N. Trends Biochem Sci. 2000;25:469–474. doi: 10.1016/s0968-0004(00)01632-7. [DOI] [PubMed] [Google Scholar]
- 18.Harkin D P, Bean J M, Miklos D, Song Y H, Truong V B, Englert C, Christians F C, Ellisen L W, Maheswaran S, Oliner J D, et al. Cell. 1999;97:575–586. doi: 10.1016/s0092-8674(00)80769-2. [DOI] [PubMed] [Google Scholar]
- 19.MacLachlan T K, Somasundaram K, Sgagias M, Shifman Y, Muschel R J, Cowan K H, El-Deiry W S. J Biol Chem. 2000;275:2777–2785. doi: 10.1074/jbc.275.4.2777. [DOI] [PubMed] [Google Scholar]
- 20.Fan S, Wang J, Yuan R, Ma Y, Meng Q, Erdos M R, Pestell R G, Yuan F, Auborn K J, Goldberg I D, et al. Science. 1999;284:1354–1356. doi: 10.1126/science.284.5418.1354. [DOI] [PubMed] [Google Scholar]
- 21.Zheng L, Annab L A, Afshari C A, Lee W H, Boyer T G. Proc Natl Acad Sci USA. 2001;98:9587–9592. doi: 10.1073/pnas.171174298. [DOI] [PMC free article] [PubMed] [Google Scholar]
- 22.Fan S, Ma Y X, Wang C, Yuan R Q, Meng Q, Wang J A, Erdos M, Goldberg I D, Webb P, Kushner P J, et al. Oncogene. 2001;20:77–87. doi: 10.1038/sj.onc.1204073. [DOI] [PubMed] [Google Scholar]
- 23.Fodor S P, Read J L, Pirrung M C, Stryer L, Lu A T, Solas D. Science. 1991;251:767–773. doi: 10.1126/science.1990438. [DOI] [PubMed] [Google Scholar]
- 24.Fodor S P, Rava R P, Huang X C, Pease A C, Holmes C P, Adams C L. Nature (London) 1993;364:555–556. doi: 10.1038/364555a0. [DOI] [PubMed] [Google Scholar]
- 25.Warrington J A, Nair A, Mahadevappa M, Tsyganskaya M. Physiol Genomics. 2000;2:143–147. doi: 10.1152/physiolgenomics.2000.2.3.143. [DOI] [PubMed] [Google Scholar]
- 26.Lockhart D J, Dong H, Byrne M C, Follettie M T, Gallo M V, Chee M S, Mittmann M, Wang C, Kobayashi M, Horton, et al. Nat Biotechnol. 1996;14:1675–1680. doi: 10.1038/nbt1296-1675. [DOI] [PubMed] [Google Scholar]
- 27.Sherr C J, Roberts J M. Genes Dev. 1999;13:1501–1512. doi: 10.1101/gad.13.12.1501. [DOI] [PubMed] [Google Scholar]
- 28.Castro-Rivera E, Samudio I, Safe S. J Biol Chem. 2001;276:30853–30861. doi: 10.1074/jbc.M103339200. [DOI] [PubMed] [Google Scholar]
- 29.Bartkova J, Lukas J, Muller H, Lutzhoft D, Strauss M, Bartek J. Int J Cancer. 1994;57:353–361. doi: 10.1002/ijc.2910570311. [DOI] [PubMed] [Google Scholar]
- 30.Gillett C, Fantl V, Smith R, Fisher C, Bartek J, Dickson C, Barnes D, Peters G. Cancer Res. 1994;54:1812–1817. [PubMed] [Google Scholar]
- 31.McIntosh G G, Anderson J J, Milton I, Steward M, Parr A H, Thomas M D, Henry J A, Angus B, Lennard T W, Horne C H. Oncogene. 1995;11:885–891. [PubMed] [Google Scholar]
- 32.Wang T C, Cardiff R D, Zukerberg L, Lees E, Arnold A, Schmidt E V. Nature (London) 1994;369:669–671. doi: 10.1038/369669a0. [DOI] [PubMed] [Google Scholar]
- 33.Brodie S G, Xu X, Qiao W, Li W M, Cao L, Deng C X. Oncogene. 2001;20:7514–7523. doi: 10.1038/sj.onc.1204929. [DOI] [PubMed] [Google Scholar]
- 34.Vaziri S A, Tubbs R R, Darlington G, Casey G. Mol Pathol. 2001;54:259–263. doi: 10.1136/mp.54.4.259. [DOI] [PMC free article] [PubMed] [Google Scholar]
- 35.Bieche I, Laurendeau I, Tozlu S, Olivi M, Vidaud D, Lidereau R, Vidaud M. Cancer Res. 1999;59:2759–2765. [PubMed] [Google Scholar]
- 36.Deng C X, Brodie S G. BioEssays. 2000;22:728–737. doi: 10.1002/1521-1878(200008)22:8<728::AID-BIES6>3.0.CO;2-B. [DOI] [PubMed] [Google Scholar]
- 37.Dubik D, Shiu R P. J Biol Chem. 1988;263:12705–12708. [PubMed] [Google Scholar]
- 38.van der Burg B, van Selm-Miltenburg A J, de Laat S W, van Zoelen E J. Mol Cell Endocrinol. 1989;64:223–228. doi: 10.1016/0303-7207(89)90149-4. [DOI] [PubMed] [Google Scholar]
- 39.Murphy L J, Murphy L C, Friesen H G. Endocrinology. 1987;120:1882–1888. doi: 10.1210/endo-120-5-1882. [DOI] [PubMed] [Google Scholar]
- 40.Leygue E, Gol-Winkler R, Gompel A, Louis-Sylvestre C, Soquet L, Staub S, Kuttenn F, Mauvais-Jarvis P. J Steroid Biochem Mol Biol. 1995;52:299–305. doi: 10.1016/0960-0760(94)00180-t. [DOI] [PubMed] [Google Scholar]
- 41.Dubik D, Shiu R P. Oncogene. 1992;7:1587–1594. [PubMed] [Google Scholar]
- 42.DiRenzo J, Shang Y, Phelan M, Sif S, Myers M, Kingston R, Brown M. Mol Cell Biol. 2000;20:7541–7549. doi: 10.1128/mcb.20.20.7541-7549.2000. [DOI] [PMC free article] [PubMed] [Google Scholar]
- 43.Yeh S, Hu Y C, Rahman M, Lin H K, Hsu C L, Ting H J, Kang H Y, Chang C. Proc Natl Acad Sci USA. 2000;97:11256–11261. doi: 10.1073/pnas.190353897. [DOI] [PMC free article] [PubMed] [Google Scholar]
- 44.Park J J, Irvine R A, Buchanan G, Koh S S, Park J M, Tilley W D, Stallcup M R, Press M F, Coetzee G A. Cancer Res. 2000;60:5946–5949. [PubMed] [Google Scholar]
- 45.Prall O W, Sarcevic B, Musgrove E A, Watts C K, Sutherland R L. J Biol Chem. 1997;272:10882–10894. doi: 10.1074/jbc.272.16.10882. [DOI] [PubMed] [Google Scholar]
- 46.Guo Q M, Malek R L, Kim S, Chiao C, He M, Ruffy M, Sanka K, Lee N H, Dang C V, Liu E T. Cancer Res. 2000;60:5922–5928. [PubMed] [Google Scholar]
- 47.Beger C, Pierce L N, Kruger M, Marcusson E G, Robbins J M, Welcsh P, Welch P J, Welte K, King M-C, Barber J R, et al. Proc Natl Acad Sci USA. 2001;98:130–135. doi: 10.1073/pnas.98.1.130. [DOI] [PMC free article] [PubMed] [Google Scholar]
- 48.Yokota Y, Mori S. J Cell Physiol. 2002;190:21–28. doi: 10.1002/jcp.10042. [DOI] [PubMed] [Google Scholar]
- 49.Ouchi T, Lee S W, Ouchi M, Aaronson S A, Horvath C M. Proc Natl Acad Sci USA. 2000;97:5208–5213. doi: 10.1073/pnas.080469697. [DOI] [PMC free article] [PubMed] [Google Scholar]
- 50.Kaplan D H, Shankaran V, Dighe A S, Stockert E, Aguet M, Old L J, Schreiber R D. Proc Natl Acad Sci USA. 1998;95:7556–7561. doi: 10.1073/pnas.95.13.7556. [DOI] [PMC free article] [PubMed] [Google Scholar]
- 51.Chin Y E, Kitagawa M, Kuida K, Flavell R A, Fu X Y. Mol Cell Biol. 1997;17:5328–5337. doi: 10.1128/mcb.17.9.5328. [DOI] [PMC free article] [PubMed] [Google Scholar]
- 52.Kumar A, Commane M, Flickinger T W, Horvath C M, Stark G R. Science. 1997;278:1630–1632. doi: 10.1126/science.278.5343.1630. [DOI] [PubMed] [Google Scholar]
- 53.Bromberg J F, Horvath C M, Wen Z, Schreiber R D, Darnell J E., Jr Proc Natl Acad Sci USA. 1996;93:7673–7678. doi: 10.1073/pnas.93.15.7673. [DOI] [PMC free article] [PubMed] [Google Scholar]
- 54.Bromberg J. Breast Cancer Res. 2000;2:86–90. doi: 10.1186/bcr38. [DOI] [PMC free article] [PubMed] [Google Scholar]
- 55.Martin K J, Kwan C P, Nagasaki K, Zhang X, O'Hare M J, Kaelin C M, Burgeson R E, Pardee A B, Sager R. Mol Med. 1998;4:602–613. [PMC free article] [PubMed] [Google Scholar]
- 56.Henning K, Berndt A, Katenkamp D, Kosmehl H. Histopathology. 1999;34:305–309. doi: 10.1046/j.1365-2559.1999.00634.x. [DOI] [PubMed] [Google Scholar]
- 57.Miller K A, Eklund E A, Peddinghaus M L, Cao Z, Fernandes N, Turk P W, Thimmapaya B, Weitzman S A. J Biol Chem. 2001;276:42863–42868. doi: 10.1074/jbc.M108130200. [DOI] [PubMed] [Google Scholar]
- 58.Wagner G F, Hampong M, Park C M, Copp D H. Gen Comp Endocrinol. 1986;63:481–491. doi: 10.1016/0016-6480(86)90149-8. [DOI] [PubMed] [Google Scholar]
- 59.Liang P, Averboukh L, Keyomarsi K, Sager R, Pardee A B. Cancer Res. 1992;52:6966–6968. [PubMed] [Google Scholar]
- 60.Ismail R S, Baldwin R L, Fang J, Browning D, Karlan B Y, Gasson J C, Chang D D. Cancer Res. 2000;60:6744–6749. [PubMed] [Google Scholar]
- 61.Deol H K, Varghese R, Wagner G F, Dimattia G E. Endocrinology. 2000;141:3412–3421. doi: 10.1210/endo.141.9.7658. [DOI] [PubMed] [Google Scholar]
- 62.Eisen M B, Spellman P T, Brown P O, Botstein D. Proc Natl Acad Sci USA. 1998;95:14863–14868. doi: 10.1073/pnas.95.25.14863. [DOI] [PMC free article] [PubMed] [Google Scholar]
- 63.Perou C M, Sorlie T, Eisen M B, van de Rijn M, Jeffrey S S, Rees C A, Pollack J R, Ross D T, Johnsen H, Akslen L A, et al. Nature (London) 2000;406:747–752. doi: 10.1038/35021093. [DOI] [PubMed] [Google Scholar]
Associated Data
This section collects any data citations, data availability statements, or supplementary materials included in this article.