Abstract
The cloning of novel G protein-coupled receptors and the search for their natural ligands, a process called reverse pharmacology, is an excellent opportunity to discover novel hormones and neurotransmitters. Based on a degenerate primer approach we have cloned a G protein-coupled receptor whose mRNA expression profile indicates highest expression in the dorsal root ganglia, specifically in the subset of small neurons, suggesting a role in nociception. In addition, moderate expression was found in lung, hypothalamus, peripheral blood leukocytes, and ovaries. Guided by a receptor-activation bioassay, we identified adenine as the endogenous ligand, which activated the receptor potently and with high structural stringency. Therefore, we propose to name this receptor as the adenine receptor. Hormonal functions have already been demonstrated for adenine derivatives like 6-benzylaminopurine in plants and 1-methyladenine in lower animals. Here, we demonstrate that adenine functions as a signaling molecule in mammals. This finding adds a third family besides P1 and P2 receptors to the class of purinergic receptors.
G protein-coupled receptors (GPCRs) have a superior success record as drug targets, which fueled the interest in the identification of novel GPCRs. As a consequence, reverse pharmacology (1), the process that leads from an orphan receptor to the identification of its endogenous ligand, already has yielded approximately 40 novel receptor/ligand pairs (for a recent review see ref. 2). In some cases, completely unknown hormones or neurotransmitters, such as nociceptin (3), prolactin-releasing peptide (4), apelin (5), and the orexins (6), were discovered.
While cloning novel GPCRs by degenerate primer (PCR) we found a unique GPCR in a rat cortex cDNA preparation. Analysis of its sequence analysis by blast revealed that this receptor did not group within any of the GPCR families activated by a known ligand. The most closely related sequences—the sensory neuron-specific receptors (7) and the MAS-related gene (Mrg) receptors (8)—belong to families that contain only orphan receptors themselves. To characterize this additional receptor we mapped its tissue distribution and tried to identify its natural ligand.
Materials and Methods
Cloning and Expression of the Rat Adenine Receptor.
The FastTrack 2.0 kit (Invitrogen) was used to isolate mRNA from rat brain cortex, which was then reverse-transcribed into cDNA with the SMART RACE (rapid amplification of cDNA ends) cDNA amplification kit (CLONTECH). The initial rat adenine receptor cDNA fragment was derived from a degenerate primer PCR containing primers complementary to the TM2 region (5′-AATCTGTTCCTGATGACGCTGGCGT-3′) and TM7 region (5′-GGTGGTTGAGGCAGCAATAGATGATGGGGTT-3′) (9). For the elongation of the PCR fragment to the full-length reading frame, the SMART RACE cDNA amplification kit was used. The full-length coding sequence (GenBank accession no. AJ311952) was subcloned into pcDNA3, and the resulting expression construct was used for transient and stable expression in mammalian cells (10).
Preparation of Tissue Extracts and Fractionation.
Ten kilograms of porcine brain cortex was homogenized and extracted in methanol/water/acetic acid (90:9:1, vol/vol/vol). After centrifugation, the supernatant was delipidated by n-hexane extraction, and the aqueous layer was used for C18 solid-phase extraction. The material eluted by 0–50% acetonitrile/H2O was further fractionated on two Delta-Pak C18 columns (15 μm, 100 Å, Waters). These fractions were tested for activation of our rat GPCR in a fluorometric image plate reader (FLIPR) assay. Subsequent purification steps in chronological order were performed on a preparative Hypersil HS C18 column, (5 μm, 250 × 20 mm, Shandon, Cheshire, U.K.), an analytical Symmetry C8 column (4.6 × 250 mm, Waters), a Biosep-Sec-S-2000 column run in normal-phase mode (300 × 7.8 mm, Phenomenex, Belmont, CA), and finally a Symmetry C18 column (4.6 × 250 mm, Waters). The selection of active fractions was guided throughout the purification by the FLIPR assay described below. The fraction that contained the activity after the final purification step was analyzed by MS (Q-TOF, Micromass, Manchester, U.K.).
Fluorometric Image Plate Reader (FLIPR) Assay.
HEK293 cells were stably transfected with pLEC/Gαqi (Molecular Devices). Using FuGENE 6 (Roche Molecular Biochemicals), these cells were transfected transiently with the GPCR/pcDNA3 expression construct. Three days after transient transfection, the cells were loaded with Fluo-4 (Molecular Probes) before assaying in the FLIPR instrument (Molecular Devices) for Ca2+ transients, according to the recommendations of the supplier.
Receptor Binding Assay.
Assays were done as described (10) with the following modifications. Membranes were resuspended in 50 mM Hepes buffer, pH 7.4, supplemented with 10 mM MgCl2 and 1 mM EGTA. Saturation binding analysis of [3H]adenine binding (30.4 Ci/mmol, Amersham Pharmacia, TRK311) was carried out by using 18 concentrations ranging from 0.2 to 90 nM. Competitive inhibition of [3H]adenine by various compounds was performed with 15 nM [3H]adenine. Nonspecific binding was defined in the presence of 1 μM adenine.
[35S]GTPγS (Guanosine 5′-[γ-Thio]Triphosphate) Binding Assay and cAMP Measurements.
The [35S]GTPγS binding assay was carried out according to a modified procedure (11), using an incubation buffer of 20 mM Hepes, pH 7.4 containing 100 mM NaCl, 10 μM GDP, 10 mM MgCl2, and 10 μg/ml saponin. After a 20-min preincubation period with the compounds tested, [35S]GTPγS was added to a final concentration of 0.25 nM. After a further incubation period of 20 min, bound and free [35S]GTPγS were separated by filtration through a UniFilter GF/B (Packard). Data were analyzed by nonlinear regression by using the prism program (GraphPad, San Diego).
cAMP measurements were done as described (10).
Quantitative Reverse Transcriptase–PCR Analysis.
Analyses were performed by using a Prism 7700 sequence detector (Perkin–Elmer Biosystems) according to the recommendations of the manufacturer. Primers and fluorescently-labeled probes were: 5′-GGCTCTGCTGGTCAGATCGT-3′, 5′-TCGCGTACAATCTGGTGAGCT-3′, and 5′-Fam-TGTGGCGCTGGGCGGATG-Tamra-3′.
Laser Capture Microdissection (LCM).
Tissue preparation was based on three adult Sprague–Dawley rats; the animals were anesthetized and decapitated. Subsequently, L5 dorsal root ganglia (DRG) were removed, placed in cryomolds, covered with Tissue-Tek tissue embedding medium (OCT), and snap-frozen in dry ice-cooled 2-methylbutane. Ten-micrometer-thick sections were cut by using a cryostat, mounted on noncoated, clean microscope slides, and immediately frozen on a block of dry ice. The sections were stored at −70°C. A quick Nissl (cresyl violet acetate) staining was used to identify the large (>50 μm) and small (<30 μm) DRG neurons. The PixCell II system from Arcturus Engineering (Mountain View, CA) was used for LCM. One hundred large and 100 small neurons were captured from each rat under the same conditions.
The method for RNA extraction from LCM samples (12) was adopted with modifications specified below. The LCM samples were incubated in 20 μl of denaturing buffer (Micro RNA isolation kit, Stratagene) containing 10 μl/ml 2-mercaptoethanol (Sigma) and 300 ng polyinosine (Sigma) at 42°C for 15 min. Then the samples were loaded onto prerinsed Microcon-100 columns (Millipore). After two rinses with 500 μl RNase-free water, the columns were inverted and the samples were collected by brief centrifugation. The samples were then processed for one-round amplification as described (13) with modifications for the DNA and RNA purification steps in which the QiaQuick PCR purification kit (Qiagen, Chatsworth, CA) and RNeasy kit (Qiagen) were used. Polyinosine (100 ng) was added to each sample before purification of DNA or amplified RNA (aRNA). After first-round RNA amplification, the aRNAs were purified and primed with random hexamers (Amersham Pharmacia) to make cDNA used for subsequent experiments.
Localization by in Situ Hybridization.
In situ hybridization was performed on 20-μm freshly frozen sections of adult rat Wistar DRG. Sense and antisense 33P-UTP labeled riboprobes were generated from the full-length coding sequence and hybridized on adjacent sections according to standard procedures (14).
Results
Cloning and Sequence Analysis of the Rat Adenine Receptor cDNA.
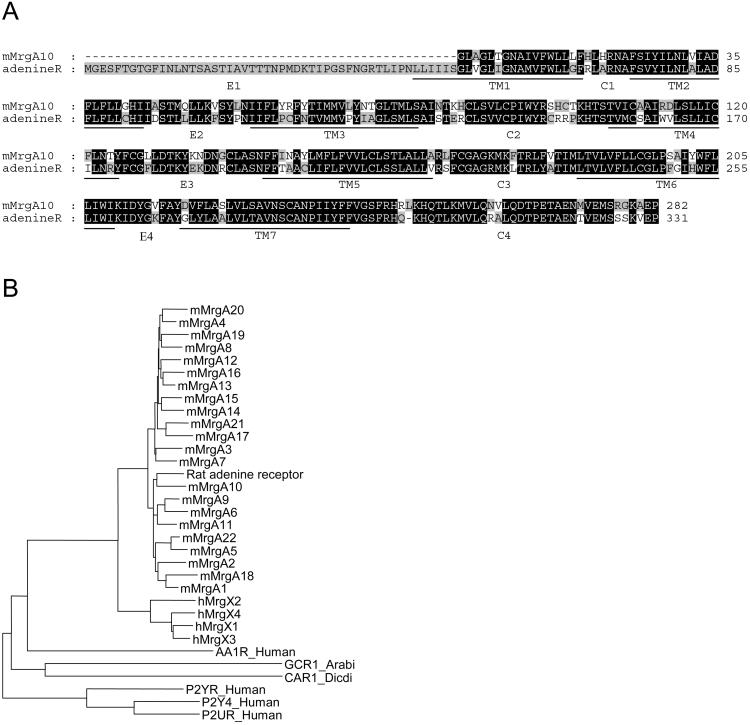
While trying to identify novel GPCRs by degenerate primer PCR as described in Materials and Methods, we obtained a fragment of the coding region from a GPCR in a rat cortex cDNA preparation. After extension by rapid amplification of cDNA ends to the full-length coding region (Fig. 1A), a blast search revealed that this receptor is a member of the recently described family of Mrg genes (8) (Fig. 1B). Most likely it is the rat orthologue of the genomic DNA fragment of mouse MrgA10 (ref. 8, Fig. 1A), whose natural ligand remains unknown.
Figure 1.
Rat adenine receptor primary structure. (A) Amino acid sequence of the rat adenine receptor aligned to the partial amino acid sequence of mouse MrgA10. Underlined are the seven transmembrane domains (TM1–TM7) predicted by the tmhmm software (version 2.0). (B) Radial dendrogram showing the relationship of the rat adenine receptor with other GPCRs from the Mrg family and GPCRs known to be activated by adenine derivatives. The names of the GPCRs used in this picture are the Swissprot identifiers or the designations suggested by Dong et al. (8).
mRNA Localization Study.
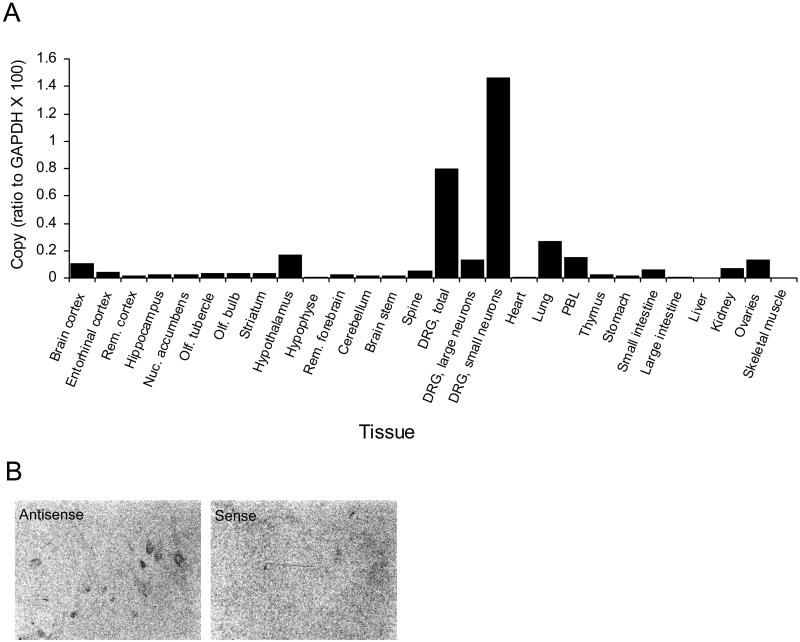
A detailed mRNA expression analysis based on quantitative PCR across 26 rat tissues (Fig. 2A) was performed. It demonstrated highest relative mRNA levels in the DRG, followed by moderate expression levels in lung, hypothalamus, peripheral blood leukocytes, and ovaries. The expression in the DRG could be confirmed by in situ hybridization (Fig. 2B) and was further analyzed in more detail by LCM of small and large rat DRG neurons. Quantitative PCR on cDNA derived from this material revealed a very clear localization of the rat adenine receptor mRNA to the subset of small DRG neurons (Fig. 2A).
Figure 2.
Rat adenine receptor mRNA localization. (A) Quantitative reverse transcriptase–PCR analyses of rat adenine receptor transcripts in RNA samples derived from various rat tissues. Small and large neurons were prepared by LCM as described in Materials and Methods. GAPDH, glyceraldehyde-3-phosphate dehydrogenase; PBL, peripheral blood leukocytes. (B) In situ hybridization of rat adenine receptor antisense and sense probes on adjacent DRG sections (1 cm × 0.75 cm). Rem., Remaining; Nuc., nucleus; Olf., olfactory.
Identification of the Endogenous Ligand.
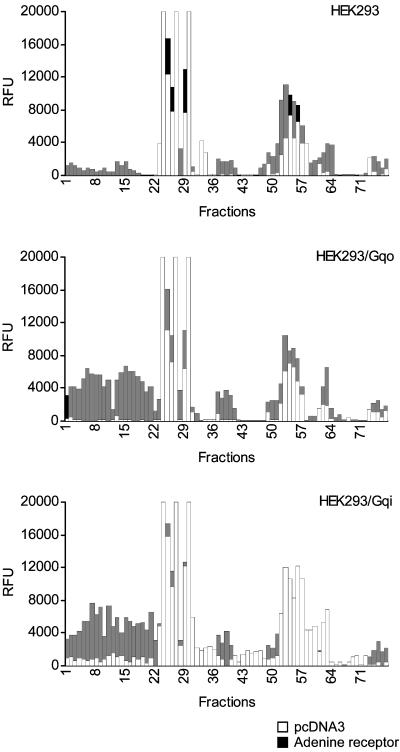
To identify the natural agonist of this receptor, we tested a porcine cortex brain extract for its activation of cells transfected with an expression construct for our rat GPCR. Porcine rather than rat cortex was used because of the quantities of starting material required (10 kg). The cellular assay used was based on the measurement of intracellular calcium ion release by a fluorometric imaging plate reader (Molecular Devices). Depending on the coexpression of the chimeric G protein Gαqi or Gαqo (15), activation of the receptor could be measured after addition of brain cortex extract aliquots or specific HPLC fractions derived thereof (Fig. 3). Activation of the receptor was seen by a broad range of fractions in the beginning of the elution profile (fractions 1–22) and by fractions toward the middle part of the gradient (fractions 37–40). Fractions 7, 11, 15, and 19 from the early activating region and fractions 39 and 40 were chosen as representative fractions and purified by several successive rounds of reverse-phase and normal-phase HPLC. A pure fraction containing a single ion at m/z 136 was obtained for fractions 7, 11, 15, and 19. Determination of the accurate mass yielded a value of 136.0623 Da, which perfectly matched with adenine + H+, as demonstrated by elemental composition analysis. The comparison of collision-induced dissociation spectra from the purified active substance and commercially obtained adenine as measured by tandem MS revealed identical fragments, confirming the identification of the single ion as adenine. For fractions 39 and 40 the activity could not be purified to homogeneity, but the final fractions in the purification that still contained activity also contained an ion at m/z 136.
Figure 3.
Activation of rat adenine receptor in transiently transfected cells by porcine brain cortex extracts fractionated on Delta-Pak C18 in comparison to activation of pcDNA3-transfected cells. Shown are the results obtained with wild-type HEK293 cells (Top) and HEK293 cell lines stably expressing Gαqo (Middle) or Gαqi (Bottom). RFU, relative fluorescence units.
Pharmacological Characterization of the Receptor Ligand Pair.
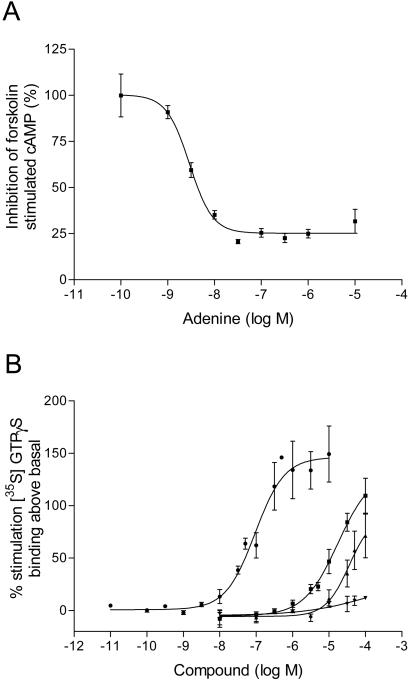
To analyze further whether adenine is indeed the natural ligand of our receptor, a biochemical and pharmacological analysis of the receptor/ligand interaction was undertaken. Based on a stable Chinese hamster ovary (CHO) cell line overexpressing our GPCR, the signal transduction pathway triggered by adenine was established. As expected from the functional coupling of the receptor to the Gαqi chimera in the calcium ion release assay, adenine dose-dependently inhibited forskolin-stimulated cAMP formation in permanently transfected cells (Fig. 4A) with a pEC50 value (negative logarithm of the dose needed to elicit 50% of the maximum response) of 8.54 ± 0.005 (n = 2, mean ± SD). Adenine also stimulated GTPγS binding (Fig. 4B) in membranes derived from four independent permanent clones with a pEC50 value of 7.21 ± 0.08 (n = 4, mean ± SD), demonstrating the high potency of the ligand in both functional assays. Wild-type CHO cells did not show any functional response in the two functional assays.
Figure 4.
Rat adenine receptor signal transduction. (A) Inhibition by adenine of forskolin stimulated cAMP formation on a Chinese hamster ovary (CHO) cell line stably transfected with a rat adenine receptor expression construct. (B) Stimulation of [35S]GTPγS binding on membranes prepared from the same stably transfected CHO cell line. ●, adenine; ■, 1-methyladenine; ▴, AMP; ▾, 6-benzyladenine.
Using membranes prepared from Chinese hamster ovary cells transiently transfected with the adenine receptor expression construct, [3H]adenine saturation binding and [3H]adenine competition binding (Table 1) were performed to characterize the receptor/ligand interaction on a pharmacological level. The saturation binding revealed a single binding site with a Kd (dissociation constant) of 24 nM, demonstrating that the interaction between receptor and ligand is of high affinity. The [3H]adenine competition binding experiments were performed with a collection of compounds known to interact with other purinergic receptors and compounds structurally related to adenine. Within this group of compounds any deviation from the structure of adenine led to a striking drop in affinity (Table 1). The Ki (inhibition constant) for adenine itself is 18 nM, which is close to the Kd value measured by saturation binding. The introduction of a methyl group at position 1 of the purine ring in 1-methyladenine leads to an almost 250-fold reduction in affinity, and the addition of a benzyl ring to the amino group in position 6 in 6-benzylaminopurine reduces the affinity more than 3,000-fold. Adenosine, which is formed by the addition of a furanose ring at position 9 of adenine, has no measurable affinity for the rat adenine receptor. The three phosphorylated derivatives of adenosine (AMP, ADP, and ATP) also have a low or undetectable affinity for the receptor. Furthermore, replacement of the amino group at position 6 of adenine by a keto group as in hypoxanthine or guanine also abolishes measurable affinity for the receptor.
Table 1.
[3H] adenine competition binding on the rat adenine receptor
| Compound | Ki, nM | n |
|---|---|---|
| Adenine | 18 | 4 |
| 1-Methyladenine | 4,391 | 3 |
| 6-Benzylaminopurine | 58,328 | 2 |
| Hypoxanthine | n.d. | 2 |
| Guanine | n.d. | 2 |
| Adenosine | n.d. | 2 |
| AMP | 24,503 | 3 |
| ADP | n.d. | 2 |
| ATP | 52,789 | 3 |
n.d., Not detectable under the conditions used.
Some of the compounds that showed weak affinity for the receptor were tested in a [35S]GTPγS binding assay (Fig. 4B) for their functional effect. AMP and 1-methyladenine both acted as partial agonists with a pEC50 of 4.35 and 4.82 respectively, but 6-benzylaminopurine did not demonstrate measurable agonistic activity in this functional assay.
Discussion
We identified an orphan GPCR expressed predominantly in the small neurons of the DRG, suggesting a role in nociception. Using a reverse pharmacology approach, we discovered adenine as the endogenous ligand for this receptor, revealing a signaling function for this molecule.
The original activation profile of the receptor in cells transfected with our GPCR by the eluate of the C18 column showed two separate regions of activity, with the first spread over a larger number of fractions. Nevertheless, after purification we found adenine as the single activating substance in all fractions examined from both regions. Under the conditions used, however, pure adenine is not retained on the reverse-phase columns used to fractionate the porcine brain cortex extract. The biological activity was retained on the first three columns, but eluted isocratically, before the start of the gradient, from the two final columns. This finding implies that adenine is bound to the first columns (Delta-Pak C18, Hypersil C18, and Symmetry C8) indirectly, presumably by interactions with a large number of other different compounds that are retained in the stationary phase. Once purified, adenine is not retained anymore on these columns.
Despite the broad region of activity in the elution profile, we conclude therefore that adenine itself is the only endogenous ligand of the rat adenine receptor. The conclusion is supported by the high binding affinity demonstrated for adenine in receptor binding assays (Table 1) and the high potency of adenine found in functional assays (Fig. 4). Moreover, every tested modification of the adenine structure leads to a striking loss of affinity (Table 1) or agonistic activity (Fig. 4B), which demonstrates the specificity of receptor-ligand interaction.
Based on sequence comparisons (Fig. 1B) and pharmacological properties, the rat adenine receptor does not belong to one of the known three families of purinergic GPCRs: the P2Y2 receptors stimulated by ATP, the P2Y1 receptors activated by ADP as well as ATP, or the P1 receptors stimulated by adenosine (16). The rat adenine receptor is, however, clearly a member of the MrgA receptor family. In a detailed localization study (8) MrgA mRNA was found in small DRG neurons of the Griffonia simplicifolia isolectin B4 (IB4)+/vanilloid receptor 1 (VR1)− type, involved in the sensation of painful thermal, mechanical, or chemical as well as neuropathic pain (8). Strikingly, the mRNA for our rat adenine receptor also localizes predominantly to small DRG neurons.
It is not clear yet whether adenine may be able to activate other receptors of the MrgA gene family. So far we have tested only mMrgA2 but found no activation by adenine (data not shown). For two other members, mMrgA1 and mMrgA4, activation by RFamide peptides has been shown (8). However, these ligands are not necessarily claimed as the endogenous ligands for these receptors, especially because these peptides are promiscuous in their receptor activation (8). At least for now, it cannot be excluded that adenine is the agonist for a broader range of receptors of the Mrg family.
Up to now no signaling function could be demonstrated convincingly for adenine in mammals. However, hormonal functions have been shown for adenine derivatives in nonmammalian organisms. Starfish oocyte maturation is induced by the follicle cell-derived hormone 1-methyladenine (17), an effect mediated by receptors on the oocyte cell surface membrane (18). Moreover, 6-benzylaminopurine acts as a cytokinin in Arabidopsis thaliana, where indirect evidence indicates that this effect may also be mediated by a GPCR (19), GCR1 (Fig. 1B). However, the evolutionary distance between these different genes may be too large to indicate a related function. The best starting point for elucidating the function of the adenine receptor may be the localization of its mRNA to small neurons of the DRG, known to be involved in pain perception. Preliminary results from a rat tail withdrawal test did not reveal changes in pain perception when adenine was injected intrathecally (data not shown). Interestingly, based on the currently available sequence information (8), many members of the MrgA gene family appear to be species specific, because no human orthologues of the MrgA gene family, including the rat adenine receptor, have been reported to date. In addition, for the human MrgX gene family (8) that is most closely related to the MrgA family (Fig. 1B) no rodent orthologues have been found. Similarly, for the two other related larger gene families in mice MrgB and MrgC, no human orthologues can be assigned. In conclusion, there seems to be a lack of orthologues between humans and rodents and the number of Mrg-related genes is, in general, higher in rodents than in humans. The human MrgX receptors tested so far (MrgX1, MrgX2, MrgX3, and MrgX4) did not respond to adenine in our assay (data not shown). It is therefore possible that the signaling activity of adenine is not conserved between rodents and humans. Because a fragment of the mouse orthologue of the rat adenine receptor is known (8), a corresponding knockout mouse may be the most obvious model to explore the physiological role of the rat adenine receptor.
Abbreviations
- DRG
dorsal root ganglia
- GPCR
G protein-coupled receptor
- GTPγS
guanosine 5′-[γ-thio]triphosphate
- LCM
laser capture microdissection
- Mrg
MAS-related gene
Footnotes
This paper was submitted directly (Track II) to the PNAS office.
Data deposition: The sequence reported in this paper has been deposited in the GenBank database (accession no. AJ311952).
References
- 1.Civelli O. FEBS Lett. 1998;430:55–58. doi: 10.1016/s0014-5793(98)00524-9. [DOI] [PubMed] [Google Scholar]
- 2.Howard A D, McAllister G, Feighner S D, Liu Q, Norgund R P, Van der Ploeg L H T, Patchett A A. Trends Pharmacol Sci. 2001;22:132–140. doi: 10.1016/s0165-6147(00)01636-9. [DOI] [PubMed] [Google Scholar]
- 3.Reinscheid R K, Nothacker H-P, Bourson A, Ardati A, Henningsen R A, Bunzow J R, Grandy D K, Langen H, Monsma F J, Jr, Civelli O. Science. 1995;270:792–794. doi: 10.1126/science.270.5237.792. [DOI] [PubMed] [Google Scholar]
- 4.Hinuma S, Habata Y, Fujii R, Kawamata Y, Hosoya M, Fukusumi S, Kitada C, Masuo Y, Asano T, Matsumoto H, et al. Nature (London) 1998;393:272–276. doi: 10.1038/30515. [DOI] [PubMed] [Google Scholar]
- 5.Tatemoto K, Hosoya M, Habata Y, Fujii R, Kakegawa T, Zou M-Z, Kawamata Y, Fukusumi S, Hinuma S, Kitada C, et al. Biochem Biophys Res Commun. 1998;251:471–476. doi: 10.1006/bbrc.1998.9489. [DOI] [PubMed] [Google Scholar]
- 6.Sakurai T, Amemiya A, Ishii M, Matsuzaki I, Chemelli R M, Tanaka H, Wiliams S C, Richardson J A, Kozlowski G P, Wilson S, et al. Cell. 1998;92:573–585. doi: 10.1016/s0092-8674(00)80949-6. [DOI] [PubMed] [Google Scholar]
- 7.Lembo P M, Grazzini E, Groblewski T, O'Donnell D, Roy M O, Zhang J, Hoffert C, Cao J, Schmidt R, Pelletier M, et al. Nat Neurosci. 2002;5:201–209. doi: 10.1038/nn815. [DOI] [PubMed] [Google Scholar]
- 8.Dong X, Han S-K, Zylka M J, Simon M I, Anderson D J. Cell. 2001;106:619–632. doi: 10.1016/s0092-8674(01)00483-4. [DOI] [PubMed] [Google Scholar]
- 9.Buck L, Axel R. Cell. 1991;65:175–187. doi: 10.1016/0092-8674(91)90418-x. [DOI] [PubMed] [Google Scholar]
- 10.Bender E, Pindon A, van Oers I, Zhang Y-B, Gommeren W, Verhasselt P, Jurzak M, Leysen J, Luyten W. J Neurochem. 2000;74:478–489. doi: 10.1046/j.1471-4159.2000.740478.x. [DOI] [PubMed] [Google Scholar]
- 11.Lazareno S, Gharagozloo P, Kuonen D, Popham A, Birdsall N J M. Mol Pharmacol. 1998;53:573–589. doi: 10.1124/mol.53.3.573. [DOI] [PubMed] [Google Scholar]
- 12.Luo L, Salunga R C, Guo H-Q, Bittner A, Joy K C, Galindo J E, Xiao H, Rogers K E, Wan J S, Jackson M R, Erlander M G. Nat Med. 1999;5:117–122. doi: 10.1038/4806. [DOI] [PubMed] [Google Scholar]
- 13.Salunga R C, Guo H, Luo L, Bittner A, Joy K C, Chambers J, Wan J, Jackson M R, Erlander M G. In: DNA Microarrays: A Practical Approach. Schena M, editor. Oxford: Oxford Univ. Press; 1999. pp. 102–142. [Google Scholar]
- 14.Bonaventure P, Voorn P, Luyten W H M L, Jurzak M, Schotte A, Leysen J E. Neuroscience. 1998;82:469–484. doi: 10.1016/s0306-4522(97)00302-3. [DOI] [PubMed] [Google Scholar]
- 15.Conklin B R, Farfel Z, Lustig K D, Julius D, Bourne H R. Nature (London) 1993;363:274–276. doi: 10.1038/363274a0. [DOI] [PubMed] [Google Scholar]
- 16.Burnstock G. Neuropharmacology. 1997;36:1127–1139. doi: 10.1016/s0028-3908(97)00125-1. [DOI] [PubMed] [Google Scholar]
- 17.Kanatani H, Shirai H, Nakanishi K, Kurokawa T. Nature (London) 1969;221:273–274. doi: 10.1038/221273a0. [DOI] [PubMed] [Google Scholar]
- 18.Dorée M, Guerrier P, Leonard N J. Proc Natl Acad Sci USA. 1976;73:1669–1673. doi: 10.1073/pnas.73.5.1669. [DOI] [PMC free article] [PubMed] [Google Scholar]
- 19.Plakidou-Dymock S, Dymock D, Hooley R. Curr Biol. 1998;8:315–324. doi: 10.1016/s0960-9822(98)70131-9. [DOI] [PubMed] [Google Scholar]


