Abstract
Endogenous metals may contribute to the accumulation of amyloid plaques in Alzheimer's disease. To specifically examine the role of synaptic zinc in the plaque accumulation, Tg2576 (also called APP2576) transgenic mice (hAPP+) expressing cerebral amyloid plaque pathology were crossed with mice lacking zinc transporter 3 (ZnT3−/−), which is required for zinc transport into synaptic vesicles. With aging, female hAPP+:ZnT3+/+ mice manifested higher levels of synaptic zinc, insoluble amyloid β, and plaques than males; these sex differences disappeared in hAPP+:ZnT3−/− mice. Both sexes of hAPP+:ZnT3−/− mice had markedly reduced plaque load and less insoluble amyloid β compared with hAPP+:ZnT3+/+ mice. Hence, of endogenous metals, synaptic zinc contributes predominantly to amyloid deposition in hAPP+ mice.
Alzheimer's disease (AD) is characterized by deposition of amyloid plaques and neurofibrillary tangles in the brain (1, 2). The main component of the plaque is a 39–43-aa peptide named amyloid β peptide (Aβ), derived from a proteolytic cleavage of the β-amyloid precursor protein (APP) of 695–770 amino acids (3, 4). Under physiological conditions, Aβ aggregates to form insoluble amyloid fibrils, whose deposition may cause physiologic abnormality and neuronal cell death (2).
A growing body of evidence suggests that endogenous metal ions such as zinc, copper, or iron may contribute to aggregation of Aβ and accumulation of plaques. First, zinc or copper induces the rapid aggregation of synthetic Aβ in an aqueous environment (5, 6), likely by binding to histidine residues within Aβ (7, 8). Second, concentrations of the transition metals including zinc and copper are elevated in AD brains, more so around plaques (9–11). Finally, the treatment with metal chelators resulted in the dissolution of aggregated Aβ from AD brain extracts (12) and inhibited accumulation of amyloid plaques in human Swedish mutant APP695 (Tg2576, also called APP2576) transgenic mice (13).
Of endogenous metals, zinc has been found at high levels in all of the congophilic amyloid plaques of human AD brain (14) as well as Tg2576 mice (15). Whereas potential sources of zinc in plaques are diverse, histochemically reactive zinc in synaptic vesicles in particular has several interesting characteristics. First, its abundance in olfactory bulb, cerebral cortex and the limbic area, and its scarcity in cerebellum (10, 16–18) correlate with the regional distribution of plaques (19–21). For example, although the cerebellum contains widespread diffuse Aβ deposits (22), this structure lacks amyloid plaques (15, 23). Second, thus far, synaptic zinc is the only zinc that has been demonstrated to be released with neuronal activity into the extracellular space (17, 24), where Aβ mainly accumulates. Although extracellular zinc concentrations are normally low (<1 μM), at the peak of neuronal activity, they may exceed 100 μM (24), a concentration sufficient to promote aggregation of Aβ (7, 12).
Zinc transport into synaptic vesicles is coincident with the expression of zinc transporter 3 (ZnT3) and is completely abrogated in ZnT3-null (ZnT3−/−) mice (25, 26). To explore the possibility that synaptic zinc has a disproportionately critical role for Aβ accumulation in Tg2576 transgenic (hAPP+) mice (15, 21), we produced three mouse genotypes (hAPP+:ZnT3+/+, hAPP+:ZnT3+/−, and hAPP+:ZnT3−/−) by breeding hAPP+ mice with the ZnT3−/− mice (26). In the present study, we demonstrate that synaptic zinc, which constitutes only 20–30% of the total zinc, contributes predominantly to gender-disparate accumulation of congophilic plaques in AD brain.
Materials and Methods
Generation of hAPP+:ZnT3−/− Mice.
Three different genotypes (hAPP+:ZnT3+/+, hAPP+:ZnT3+/−, and hAPP+:ZnT3−/−) of mice were produced by first crossing female Tg2576 transgenic hAPP+/− mice (C57BL/SJL hybrid background) with male ZnT3−/− mice (C57BL/129sv hybrid background), and then interbreeding the offspring (hAPP+/−:ZnT3+/−). Therefore, all mice used for the present study are of the identical strain backgrounds. Genotypes of littermates were determined by PCR, using the recommended primers both for ZnT3 (26) and hAPP (27). Because homozygous hAPP+/+ mice died prematurely, only hemizygous hAPP+ mice were used for this study.
Determination of Synaptic Zinc by N-(6-Methoxy-8-quinolyl)-p-carboxybenzoylsulfonamide (TFL-Zn) Histofluorescence.
We measured zinc fluorescence in hippocampi of non-Tg2576 littermates (hAPP−/−), because the dense zinc fluorescence in the plaques might falsely increase the signal in presynaptic terminals. Without fixation, brain sections (10-μm thick) were stained with the zinc-specific fluorescent dye TFL-Zn (0.1 mM; Calbiochem) dissolved in Tris buffer (pH 8.0), and photographed with a digital camera (Camedia C2000; Olympus, Tokyo) linked to a fluorescence microscope (Olympus BX60; excitation, 355–375 nm; dichroic, 380 nm; barrier, 420 nm). Fluorescence intensity in the mossy fiber region of the hippocampus was measured with an image analysis program (image-pro, Media Cybernetics, Silver Spring, MD). All values, after subtraction of background fluorescence in thalamus that lacks synaptic zinc (26), were normalized to the mean fluorescence of the corresponding area in 6-month-old, male, wild-type mice as 100%.
Measurement of Total Metal Content.
Removed brains were immediately placed on ice. Left cerebral hemispheres were weighed, digested in ultrapure nitric acid, air-dried, and suspended in 2% nitric acid. Right cerebral hemispheres were quickly frozen in liquid nitrogen and stored for later Aβ analysis. Metal contents containing zinc, iron, and copper were measured by inductively coupled plasma atomic emission spectrophotometer (ICP-AES; model 138 Ultrace; Jobin Yvon, North London, U.K.) and expressed as parts per million of wet weight. Additionally, total zinc content in the cerebellum was also measured.
Tissue Preparation and Congo Red Staining.
Brains were harvested and immediately frozen in liquid nitrogen. Coronal brain sections of 10-μm thickness were obtained with a cryostat (Leica, Nussloch, Germany) and mounted on poly-l-lysine-coated glass slides.
Plaques were identified with Congo red staining. After staining in Gill's hematoxylin solution (Sigma) for 10 min, brain sections were rinsed in tap water for 5 min, and incubated in alkaline sodium chloride solution for 20 min. Brain sections were then stained with alkaline Congo red solution (0.2% in 80% ethanol saturated with sodium chloride; Sigma) and washed in absolute ethanol.
Quantification of Congophilic Plaque Loads in the Brain.
The total number of congophilic plaques was manually counted under light microscope (magnification ×400; Olympus) in 10 coronal sections taken every 650 μm from bregma + 3.0 mm. The percent area loaded with plaques was measured from the hippocampi and cerebral cortices of 15- or 18-month-old mice with an image analysis program (image-pro).
Sandwich ELISA to Measure the Soluble or Insoluble Aβ40/42.
Levels of soluble or insoluble Aβ40/42 in the whole brain of hAPP-transgenic mice were measured by the sandwich ELISA method (BioSource International, Camarillo, CA). After right cerebral hemispheres were homogenized and centrifuged in Tris⋅HCl buffer (20 mM, pH 7.6) containing EDTA (10 mM) and protease inhibitor mixture (Roche Diagnostics), the supernatants (soluble fraction) were taken. The pellets were resuspended and homogenized in 70% formic acid (insoluble fraction). Following the appropriate dilution, levels of soluble or insoluble Aβ40/42 were measured by the sandwich ELISA method, using a mAb specific for the NH2 terminus of human Aβ as capture Ab and biotinylated rabbit polyclonal Ab specific for the 1–40 or 1–42 sequence of human Aβ as detection Ab.
Statistical Analysis.
All values were presented as mean ± SEM. Differences between groups were assessed by one-way ANOVA followed by post hoc Student–Newman–Keuls test. A P value less than 0.05 was considered significant.
Results
General Characteristics of hAPP+:ZnT3−/− Mice.
Because homozygous hAPP+/+ mice died prematurely, we used only hemizygous hAPP+ mice for this study. hAPP+ mice lacking ZnT3 exhibited no differences from wild-type mice with respect to body size, gross morphology, fertility, longevity, or behavior. Moreover, brain regions that normally have abundant synaptic zinc appear normal by light and electron microscopies (26), although there is an increased susceptibility of these mice to kainate-induced seizures (28).
Attenuation of Synaptic or Total Zinc in hAPP+:ZnT3−/− Mice.
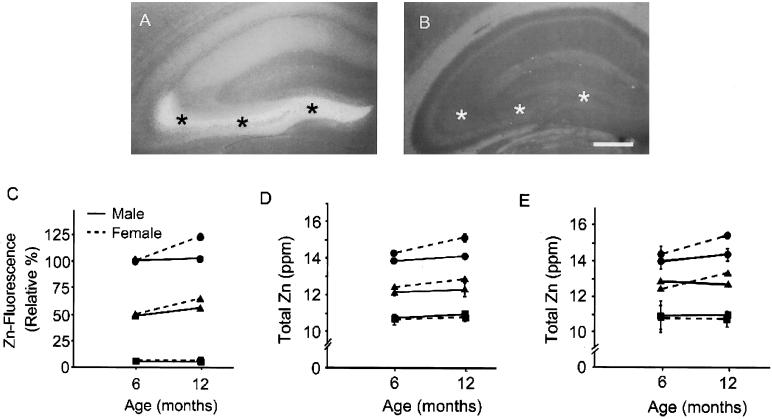
Staining of brains with the zinc-specific fluorescent dye, TFL-Zn, which detects the zinc in synaptic vesicles (29, 30), showed ZnT3 copy number-dependent decrease of fluorescence intensity in hippocampus and cerebral cortex at 6–12 months of age (P < 0.001, one-way ANOVA with post hoc Student–Newman–Keuls test) (Fig. 1 A–C). In ZnT3+/+ mice, dense zinc fluorescence was seen in the hippocampal mossy fibers (asterisks in Fig. 1A). In contrast, no zinc fluorescence was seen in ZnT3−/− mice, even in the normally zinc-rich mossy fibers (asterisks in Fig. 1B) (26). Zinc fluorescence of hippocampi increased significantly between 6 and 12 months of age in ZnT3+/+ and ZnT3+/− females, but not in ZnT3−/− females and all genotypes of male (Fig. 1C). In contrast to zinc fluorescence, total zinc content of cerebrum of ZnT3−/− or ZnT3+/− mice was reduced by only about 30% or 15%, respectively, in both nontransgenic (Fig. 1D) and hAPP+ mice (Fig. 1E). Hence, synaptic zinc may constitute about 30% of total brain zinc, which is close to the previous estimate (26). As seen with synaptic zinc above, age-related increases in total zinc were seen in a ZnT3 copy number-dependent manner only in ZnT3+/+ and ZnT3+/− female mice. In contrast, levels of iron or copper were not different among male and female ZnT3+/+, ZnT3+/−, and ZnT3−/− mice at two different ages (Table 1).
Figure 1.
Gender-disparate increases of synaptic zinc in mice with aging. (A and B) Fluorescence photomicrographs of coronal brain sections of non-Tg2576 (hAPP−/−), ZnT3+/+ (A), and ZnT3−/− (B) mice stained with TFL-Zn. Whereas dense zinc fluorescence was seen in the hippocampal mossy fiber area of ZnT3+/+ mice (A, asterisks), virtually no zinc fluorescence was seen in the same area of ZnT3−/− mice (B, asterisks). (Bar = 100 μm.) (C) Data denote TFL-Zn fluorescence (mean ± SEM, n = 6) in the hippocampal mossy fiber area (asterisks in A and B) of hAPP−/− mice with different ZnT3 genotypes. Differences in zinc fluorescence among ZnT3+/+, ZnT3+/−, and ZnT3−/− at 6 and 12 months were all significant (P < 0.001). Differences between male and female were significant only at 12 months in ZnT3+/+ and ZnT3−/− (P < 0.001). (D) Total zinc content (mean ± SEM, n = 3) in brains of non-Tg2576 mice (hAPP−/−) with different ZnT3 genotypes. (E) Total zinc content (mean ± SEM, n = 3) in brains of hAPP+ mice with different ZnT3 genotypes. Circles, triangles, and squares denote ZnT3+/+, ZnT3+/−, and ZnT3−/−, respectively.
Table 1.
Levels of brain iron and copper in various groups
| Genotype for ZnT3 | Sex | Age, months | Level, ppm
|
|
|---|---|---|---|---|
| Fe2+ | Cu2+ | |||
| +/+ | F | 6 | 20.7 ± 0.22 | 2.4 ± 0.02 |
| 12 | 22.2 ± 0.21 | 2.6 ± 0.05 | ||
| M | 6 | 19.8 ± 0.14 | 2.2 ± 0.05 | |
| 12 | 21.9 ± 0.24 | 2.5 ± 0.03 | ||
| +/− | F | 6 | 20.9 ± 0.17 | 2.4 ± 0.05 |
| 12 | 21.4 ± 0.24 | 2.6 ± 0.08 | ||
| M | 6 | 21.4 ± 0.27 | 2.6 ± 0.03 | |
| 12 | 21.2 ± 0.08 | 2.4 ± 0.09 | ||
| −/− | F | 6 | 20.7 ± 0.21 | 2.4 ± 0.09 |
| 12 | 21.1 ± 0.36 | 2.3 ± 0.06 | ||
| M | 6 | 19.9 ± 0.24 | 2.0 ± 0.12 | |
| 12 | 20.7 ± 0.04 | 2.5 ± 0.08 | ||
All values are represented as mean ± SEM (n = 3 for each). There was no difference among groups by one-way ANOVA.
Diminished Plaque Load in hAPP+:ZnT3−/− Mice.
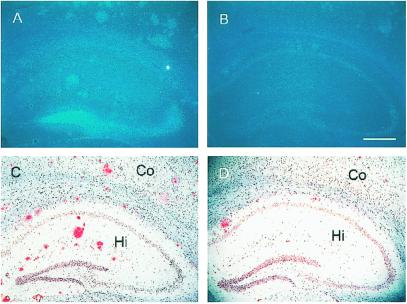
After 12 months of age, number and size of congophilic plaques increased markedly. Staining of hippocampal sections of 24-month-old hAPP+:ZnT3+/+ mice with TFL-Zn and Congo red revealed numerous congophilic plaques (Fig. 2C), all of which also exhibited dense zinc fluorescence (Fig. 2A). By contrast, hAPP+:ZnT3−/− mice that lacked synaptic zinc (Fig. 2B) showed markedly decreased plaque load at the same age (Fig. 2D).
Figure 2.
Reduced deposition of amyloid plaques in hAPP+:ZnT3−/− mouse brains. (A–D) Coronal sections of 24-month-old female hAPP+ mouse brains with ZnT3+/+ (A and C) or ZnT3−/− (B and D) genotype, stained with TFL-Zn (A and B) or Congo red (C and D). Compared with ZnT3+/+ mice that had numerous TFL-Zn- and Congo red-stained plaques in cerebral cortex (Co) and hippocampus (Hi), ZnT3−/− mice had markedly reduced number of plaques. (Bar = 100 μm.)
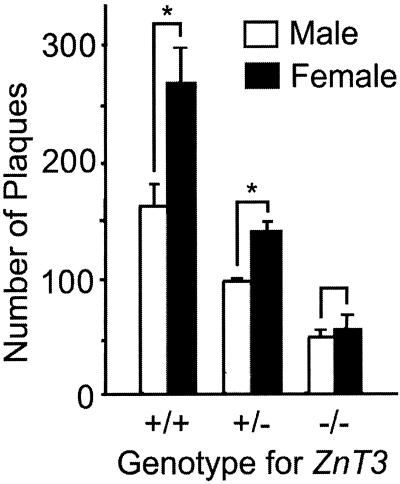
Accumulation of Aβ plaques was quantitated by counting plaques in brain sections stained with Congo red. The number of plaques at 12 months of age was substantially reduced in hAPP+:ZnT3−/− mice as compared with that in hAPP+:ZnT3+/+ mice, with the number of plaques found in hAPP+:ZnT3+/− mice falling in between (Fig. 3). In agreement with previous reports (31), there were more plaques in the brains of female hAPP+:ZnT3+/+ mice than in the brains of male mice. This gender difference was reduced in hAPP+:ZnT3+/− mice (P < 0.05) and disappeared in hAPP+:ZnT3−/− mice (P = 0.535) (Fig. 3).
Figure 3.
The effect of synaptic zinc deficiency on gender-disparate deposition of amyloid plaques. Data denote number (mean + SEM, n = 5 each) of congophilic plaques in 10 coronal brain sections of 12-month-old male and female hAPP+ mice with indicated ZnT3 genotypes. Asterisks represent significant difference between male and female (P < 0.05).
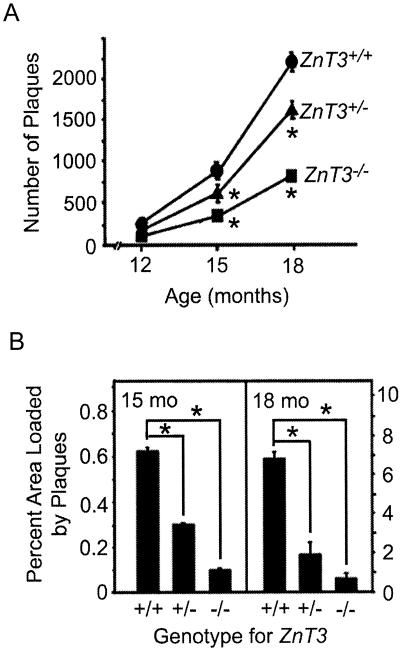
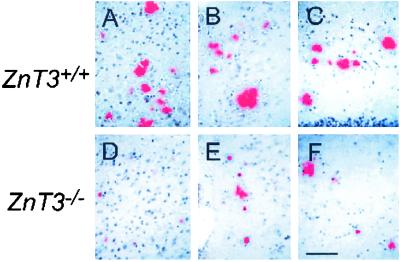
The number of plaques increased with age in all three genotypes; however, the increase was greatest in ZnT3+/+ mice (Fig. 4A). The extent of plaque deposition, estimated as the percent of the area that is loaded with plaques, was greatly reduced at 15 and 18 months of age in ZnT3−/− compared with ZnT3+/+ mice (Fig. 4B). The more conspicuous reduction of total plaque area than plaque numbers in ZnT3−/− mice is attributable to the smaller average size of plaques in ZnT3−/− mice (Fig. 5 and Table 2).
Figure 4.
Reduction of the plaque load in ZnT3−/− mice. (A) Age-dependent increases in the number of amyloid plaques (mean ± SEM, n = 3–5 each) in hAPP+ female mice with indicated ZnT3 genotypes. Asterisks denote difference from ZnT3+/+ (P < 0.01). (B) Percent area occupied by congophilic amyloid plaques in coronal brain sections of 15- or 18-month-old female hAPP+ mice with indicated ZnT3 genotypes. Asterisks represent significant difference (P < 0.05).
Figure 5.
Reduced plaque sizes in hAPP+:ZnT3−/− mice. Photomicrographs of frontal cortex (A and D), parietal cortex (B and E), and hippocampi (C and F) of 18 month-old female ZnT3+/+ (A–C) and ZnT3−/− (D–F) hAPP+ mice stained with Congo red. Note that plaques in ZnT3−/− brains are much smaller than those in ZnT3+/+ (also see Table 1). (Bar = 100 μm.)
Table 2.
Variations of plaque sizes in different ZnT3 genotypes
| Genotype for ZnT3 | +/+ | +/− | −/− |
|---|---|---|---|
| Maximum, μm2 | 8,020 | 4,520 | 1,410 |
| Minimum, μm2 | 11.01 | 2.14 | 0.56 |
| Mean ± SEM, μm2 (n = 5) | 572 ± 34.3 | 259 ± 13.6* | 188 ± 7.1** |
and
denote differences from ZnT3+/+ mice at P < 0.005 and P < 0.001, respectively (one-way ANOVA followed by post hoc Student–Newman–Keuls test).
It is possible that differences in background strains affect the phenotype of transgenic mice expressing hAPP. In fact, we have found that the hAPP+/−:ZnT3+/+ F1 mice had higher plaque burden than the original Tg2576 transgenic mice at 12 months of age (213.7 ± 25.7 vs.121.1 ± 17.9 plaques per 10 coronal sections, respectively). However, for data analysis, we used only F1 animals derived from crossing hAPP+/−:ZnT3+/− mice with the identical strain backgrounds.
Increased Ratio of Soluble/Insoluble Aβ in hAPP+:ZnT3−/− Mice.
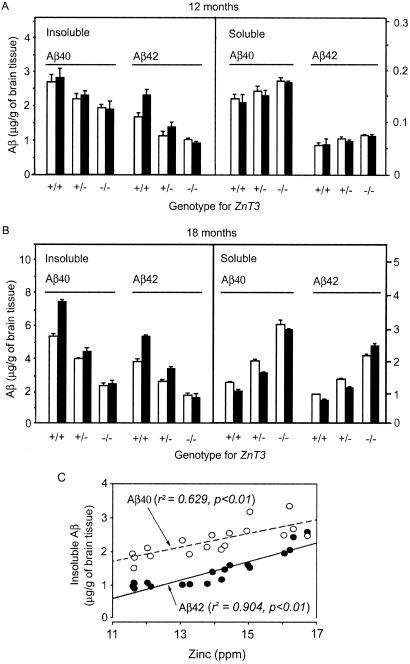
Next, we examined the effect of synaptic zinc on levels of soluble and insoluble Aβ. The levels of insoluble Aβ40 and Aβ42 were reduced substantially in hAPP+:ZnT3−/− mice at 12 and 18 months of age as compared with those in hAPP+:ZnT3+/+ mice (Fig. 6). Whereas the gender difference was observed in hAPP+:ZnT3+/+ mice only for insoluble Aβ42 at 12 months of age, at 18 months of age the gender difference became more conspicuous for both insoluble and soluble Aβ40 and Aβ42. Interestingly, changes in the levels of soluble Aβ40 and Aβ42 were just the opposite of those of insoluble Aβ; hAPP+:ZnT3−/− mice had more soluble Aβ than hAPP+:ZnT3+/+ mice. As results, at 18 months of age, ZnT3−/− mice showed much higher soluble/insoluble ratios of Aβ40 and Aβ42 (1.3–1.5) as compared with ZnT3+/+ mice (0.1–0.3). Interestingly, whereas the levels of insoluble Aβ in hAPP+:ZnT3+/+ mice were greater in female, the levels of soluble Aβ tended to be greater in male. These gender differences disappeared in hAPP+:ZnT3−/− mice. Finally, we examined correlations between levels of insoluble Aβ and total zinc at 12 months of age (Fig. 6C). Levels of total zinc were positively correlated with levels of insoluble Aβ42 and Aβ40 (both P < 0.01) (Fig. 6C). On the other hand, there were inverse correlations between total zinc and soluble Aβ40 and Aβ42 levels (P < 0.05, not shown).
Figure 6.
The absence of synaptic zinc alters levels of soluble and insoluble Aβ. (A) Bars denote concentrations of insoluble and soluble Aβ40 and Aβ42 (μg/g of brain tissue; mean + SEM, n = 3 each) in 12-month-old male (empty bars) and female (filled bars) hAPP+ mice with indicated ZnT3 genotypes. (B) Concentrations of insoluble and soluble Aβ40 and Aβ42 (μg/g of brain tissue) in 18-month-old male (empty bars) and female (filled bars) hAPP+ mice with indicated ZnT3 genotypes (n = 2). (C) Correlations between levels of insoluble Aβ42/Aβ40 and total zinc. Regression analysis showed positive correlations in both cases (P < 0.01).
Discussion
Evidences obtained in vitro suggest that zinc may contribute to Aβ aggregation and thus plaque formation (5–8). The recent demonstration that metal chelation ameliorates Aβ plaque formation in hAPP+ mice strongly supports this hypothesis (13). However, sources of zinc in the plaques have not been known. Our results have demonstrated that, specifically, zinc in synaptic vesicles, which is under the control of ZnT3 (25, 26), plays a major role in Aβ formation.
Synaptic zinc in the forebrain is stored in the vesicles as glutamatergic terminals and is released into the extracellular environment during normal neuronal activity (17, 24, 32). During periods of intense neuronal activity, e.g., during seizures, extracellular zinc concentrations can rise dramatically. Although zinc uptake transporters undoubtedly recycle zinc that is released into the synaptic cleft, the released zinc could contribute to Aβ aggregation and plaque formation. This releasable pool of zinc represents about 20–30% of total zinc in regions where ZnT3 is expressed (Fig. 1) (26). Because the absence of synaptic zinc by deleting ZnT3 in Tg2576 mice markedly reduced the plaque load and increased the ratio of soluble/insoluble Aβ, it is likely that synaptic zinc plays a disproportionately larger role in shifting the equilibrium toward the Aβ aggregation and plaque accumulation.
It is well known that the age-adjusted incidence for AD is substantially higher in females than males (33). Consistently, the plaque load in Tg2576 mice showed the same intersexual disparity (31). Although causes for this are unknown, our studies suggest that female-restricted increases of synaptic vesicle zinc may play a crucial role in the sexually disparate accumulation of amyloid plaques in Tg2576 mice. The increase in synaptic zinc with aging exclusively in female correlated well with higher levels of insoluble Aβ and plaque loads in female. These gender differences completely disappeared in ZnT3−/− mice, further suggesting the role for synaptic zinc in these gender differences. It would be intriguing to see whether levels of ZnT3 are under the control of sex hormones.
That some small plaques still form in ZnT3−/− mice may be attributable to the requirement for zinc of numerous diverse functions in the brain and elsewhere. This finding is little surprising because every cell contains a large number of zinc-binding proteins (34, 35). Thus, it is likely that to meet metabolic requirements for zinc in the brain, a significant amount of zinc may come in and out of the brain. Some of such dynamic zinc, although normally less in amounts than synaptic zinc, may bind in the extracellular space to Aβ and transform it to insoluble forms. These residual pools of zinc, as well as copper and iron, may contribute to basal Aβ deposition in ZnT3-null mice (5, 6, 36). Alternatively, neuronal death or neurite degeneration around Aβ deposition may release zinc from breakdown of zinc-binding proteins.
Currently, diverse strategies to prevent AD or reverse its pathology are under consideration. Of these, the main efforts are directed toward the idea that Aβ accumulation is the central pathogenic event (37). The β- and γ-secretases are the main targets for the development of drugs to reduce the generation of Aβ (38, 39). Abs against Aβ also seem promising for reducing or even preventing the plaque load (40–42). Our results support the idea that zinc chelation therapy (13), which preferentially reduces insoluble forms of Aβ, may be an alternative therapeutic strategy to slow or prevent the onset of AD.
Acknowledgments
We thank Dr. Karen Hsiao (University of Minnesota) for generously donating the Tg2576 mice. This study was supported by Creative Research Initiatives of the Korean Ministry of Science and Technology (J.Y.K.) and National Institutes of Health grant DK-53013 (to R.D.P.).
Abbreviations
- AD
Alzheimer's disease
- APP
β-amyloid precursor protein
- hAPP
human APP
- Aβ
amyloid β
- ZnT3
zinc transporter 3
- TFL-Zn
N-(6-methoxy-8-quinolyl)-p-carboxybenzoylsulfonamide
Footnotes
This paper was submitted directly (Track II) to the PNAS office.
See commentary on page 7317.
References
- 1.Price D L, Sisoda S S. Annu Rev Neurosci. 1998;21:479–505. doi: 10.1146/annurev.neuro.21.1.479. [DOI] [PubMed] [Google Scholar]
- 2.Selkoe D J. Nature (London) 1999;399:A23–A31. doi: 10.1038/399a023. [DOI] [PubMed] [Google Scholar]
- 3.Masters C L, Simms G, Weinman N A, Multhaup G, McDonald B L, Beyreuther K. Proc Natl Acad Sci USA. 1985;82:4245–4249. doi: 10.1073/pnas.82.12.4245. [DOI] [PMC free article] [PubMed] [Google Scholar]
- 4.Kang J, Lemaire H G, Unterbeck A, Salbaum J M, Masters C L, Grzeschik K H, Multhaup G, Beyreuther K, Muller-Hill B. Nature (London) 1987;325:733–736. doi: 10.1038/325733a0. [DOI] [PubMed] [Google Scholar]
- 5.Bush A I, Pettingell W H, Multhaup G, de Paradis M, Vonsattel J P, Gusella J F, Beyreuther K, Masters C L, Tanzi R E. Science. 1994;265:1464–1467. doi: 10.1126/science.8073293. [DOI] [PubMed] [Google Scholar]
- 6.Miura T, Suzuki K, Kohata N, Takeuchi H. Biochemistry. 2000;39:7024–7031. doi: 10.1021/bi0002479. [DOI] [PubMed] [Google Scholar]
- 7.Huang X, Atwood C S, Moir R D, Hartshorn M A, Vonsattel J P, Tanzi R E, Bush A I. J Biol Chem. 1997;272:26464–26470. doi: 10.1074/jbc.272.42.26464. [DOI] [PubMed] [Google Scholar]
- 8.Yang D S, McLaurin J, Qin K, Westaway D, Fraser P E. Eur J Biochem. 2000;267:6692–6698. doi: 10.1046/j.1432-1327.2000.01767.x. [DOI] [PubMed] [Google Scholar]
- 9.Deibel M A, Ehmann W D, Markesbery W R. J Neurol Sci. 1996;143:137–142. doi: 10.1016/s0022-510x(96)00203-1. [DOI] [PubMed] [Google Scholar]
- 10.Danscher G, Jensen K B, Frederickson C J, Kemp K, Andreasen A, Juhl S, Stoltenberg M, Ravid R. J Neurosci Methods. 1997;76:53–59. doi: 10.1016/s0165-0270(97)00079-4. [DOI] [PubMed] [Google Scholar]
- 11.Lovell M A, Robertson J D, Teesdale W J, Campbell J L, Markesbery W R. J Neurol Sci. 1998;158:47–52. doi: 10.1016/s0022-510x(98)00092-6. [DOI] [PubMed] [Google Scholar]
- 12.Cherny R A, Legg J T, McLean C A, Fairlie D P, Huang X, Atwood C S, Beyreuther K, Tanzi R E, Masters C L, Bush A I. J Biol Chem. 1999;274:23223–23228. doi: 10.1074/jbc.274.33.23223. [DOI] [PubMed] [Google Scholar]
- 13.Cherny R A, Atwood C S, Xilinas M E, Gray D N, Jones W D, McLean C A, Barnham K J, Volitakis I, Fraser F W, Kim Y, et al. Neuron. 2001;30:665–676. doi: 10.1016/s0896-6273(01)00317-8. [DOI] [PubMed] [Google Scholar]
- 14.Suh S W, Jensen K B, Jensen M S, Silva D S, Kesslak P J, Danscher G, Frederickson C J. Brain Res. 2000;852:274–278. doi: 10.1016/s0006-8993(99)02096-x. [DOI] [PubMed] [Google Scholar]
- 15.Lee J Y, Mook-Jung I, Koh J Y. J Neurosci. 1999;19:RC10. doi: 10.1523/JNEUROSCI.19-11-j0002.1999. (1–5). [DOI] [PMC free article] [PubMed] [Google Scholar]
- 16.Perez-Clausell J. J Chem Neuroanat. 1996;11:99–111. doi: 10.1016/0891-0618(96)00131-7. [DOI] [PubMed] [Google Scholar]
- 17.Frederickson C J, Suh S W, Silva D, Frederickson C J, Thompson R B. J Nutr. 2000;130:1471S–1483S. doi: 10.1093/jn/130.5.1471S. [DOI] [PubMed] [Google Scholar]
- 18.Jo S M, Won M H, Cole T B, Jensen M S, Palmiter R D, Danscher G. Brain Res. 2000;865:227–236. doi: 10.1016/s0006-8993(00)02227-7. [DOI] [PubMed] [Google Scholar]
- 19.Games D, Adams D, Alessandrini R, Barbour R, Berthelette P, Blackwell C, Carr T, Clemens J, Donaldson T, Gillespie F, et al. Nature (London) 1995;373:523–527. doi: 10.1038/373523a0. [DOI] [PubMed] [Google Scholar]
- 20.Zhan S S, Veerhuis R, Kamphorst W, Eikelenboom P. Neurodegeneration. 1995;4:291–297. doi: 10.1016/1055-8330(95)90018-7. [DOI] [PubMed] [Google Scholar]
- 21.Hsiao K, Chapman P, Nilsen S, Eckman C, Harigaya Y, Younkin S, Yang F, Cole G. Science. 1996;274:99–102. doi: 10.1126/science.274.5284.99. [DOI] [PubMed] [Google Scholar]
- 22.Joachim C L, Morris J H, Selkoe D J. Am J Pathol. 1989;135:309–319. [PMC free article] [PubMed] [Google Scholar]
- 23.Styren S D, Kamboh M I, DeKosky S T. J Comp Neurol. 1998;396:511–520. [PubMed] [Google Scholar]
- 24.Assaf S Y, Chung S H. Nature (London) 1984;308:734–736. doi: 10.1038/308734a0. [DOI] [PubMed] [Google Scholar]
- 25.Wenzel H J, Cole T B, Born D E, Schwartzkroin P A, Palmiter R D. Proc Natl Acad Sci USA. 1997;94:12676–12681. doi: 10.1073/pnas.94.23.12676. [DOI] [PMC free article] [PubMed] [Google Scholar]
- 26.Cole T B, Wenzel H J, Kafer K E, Schwartzkroin P A, Palmiter R D. Proc Natl Acad Sci USA. 1999;96:1716–1721. doi: 10.1073/pnas.96.4.1716. [DOI] [PMC free article] [PubMed] [Google Scholar]
- 27.Hsiao K K, Borchelt D R, Olson K, Johannsdottir R, Kitt C, Yunis W, Xu S, Eckman C, Younkin S, Price D. Neuron. 1995;15:1203–1218. doi: 10.1016/0896-6273(95)90107-8. [DOI] [PubMed] [Google Scholar]
- 28.Cole T B, Robbins C A, Wenzel H J, Schwartzkroin P A, Palmiter R D. Epilepsy Res. 2000;39:153–169. doi: 10.1016/s0920-1211(99)00121-7. [DOI] [PubMed] [Google Scholar]
- 29.Budde T, Minta A, White J A, Kay A R. Neuroscience. 1997;79:347–358. doi: 10.1016/s0306-4522(96)00695-1. [DOI] [PubMed] [Google Scholar]
- 30.Lee J Y, Cole T B, Palmiter R D, Koh J Y. J Neurosci. 2000;20:RC79. doi: 10.1523/JNEUROSCI.20-11-j0003.2000. (1–5). [DOI] [PMC free article] [PubMed] [Google Scholar]
- 31.Callahan M J, Lipinski W J, Bian F, Durham R A, Pack A, Walker L C. Am J Pathol. 2001;158:1173–1177. doi: 10.1016/s0002-9440(10)64064-3. [DOI] [PMC free article] [PubMed] [Google Scholar]
- 32.Howell G A, Welch M G, Frederickson C J. Nature (London) 1984;308:736–738. doi: 10.1038/308736a0. [DOI] [PubMed] [Google Scholar]
- 33.Katzman R, Aronson M, Fuld P, Kawas C, Brown T, Morgenstern H, Frishman W, Gidez L, Eder H, Ooi W L. Ann Neurol. 1989;25:317–324. doi: 10.1002/ana.410250402. [DOI] [PubMed] [Google Scholar]
- 34.Vallee B L, Coleman J E, Auld D S. Proc Natl Acad Sci USA. 1991;88:999–1003. doi: 10.1073/pnas.88.3.999. [DOI] [PMC free article] [PubMed] [Google Scholar]
- 35.Vallee B L, Falchuk K H. Physiol Rev. 1993;73:79–118. doi: 10.1152/physrev.1993.73.1.79. [DOI] [PubMed] [Google Scholar]
- 36.Atwood C S, Moir R D, Huang X, Scarpa R C, Bacarra N M E, Romano D M, Hartshorn M A, Tanzi R E, Bush A I. J Biol Chem. 1998;273:12817–12826. doi: 10.1074/jbc.273.21.12817. [DOI] [PubMed] [Google Scholar]
- 37.Soto C. Mol Med Today. 1999;5:343–350. doi: 10.1016/s1357-4310(99)01508-7. [DOI] [PubMed] [Google Scholar]
- 38.Vassar R, Citron M. Neuron. 2000;27:419–422. doi: 10.1016/s0896-6273(00)00051-9. [DOI] [PubMed] [Google Scholar]
- 39.Walter J, Kaether C, Steiner H, Haass C. Curr Opin Neurobiol. 2001;11:585–590. doi: 10.1016/s0959-4388(00)00253-1. [DOI] [PubMed] [Google Scholar]
- 40.Schenk D, Barbour R, Dunn W, Gordon G, Grajeda H, Guido T, Hu K, Huang J, Johnson-Wood K, Khan K, et al. Nature (London) 1999;400:173–177. doi: 10.1038/22124. [DOI] [PubMed] [Google Scholar]
- 41.Janus C, Pearson J, McLaurin J, Mathews P M, Jiang Y, Schmidt S D, Chishti M A, Horne P, Heslin D, French J, et al. Nature (London) 2000;408:979–982. doi: 10.1038/35050110. [DOI] [PubMed] [Google Scholar]
- 42.Morgan D, Diamond D M, Gottschall P E, Ugen K E, Dickey C, Hardy J, Duff K, Jantzen P, DiCarlo G, Wilcock D, et al. Nature (London) 2000;408:982–985. doi: 10.1038/35050116. [DOI] [PubMed] [Google Scholar]


