

Abstract
Background
Aniridia patients have poor visual acuity and iris malformation. The fovea in these patients is underdeveloped, but the relationship between structure and electrophysiologic function remains incompletely understood. This study correlates electrophysiology, visual acuity and optical coherence tomography (OCT) in patients with aniridia secondary to mutations in the PAX6 gene and compares with age-similar controls.
Methods
Patients were recruited from clinical practice. The mfERG protocol was a 4-min 103-hexagon protocol covering approximately 40° in diameter of central retina. Diagnosys full field ERG (ffERG) and VERIS multifocal ERG (mfERG) were obtained using standard International Society for Clinical Electrophysiology of Vision protocols. OCT central thickness was recorded, and an OCT foveal score was calculated. Nonparametric permutation testing was utilized to determine the statistical significance.
Results
A total of 6 aniridia patients and 25 control patients were recruited. On mfERG, aniridia patients had significantly lower amplitudes in rings 1–3 (p = 0.0006, 0.0013, 0.0132), shorter latencies in ring 1 (p = 0.0312), and longer latencies in rings 5 and 6 (p = 0.0026, p = 0.0042) than controls. There was a significantly positive relationship in aniridia patients between logMAR visual acuity and mfERG amplitude in ring 4 (p = 0.0392) and ring 5 (p = 0.0489). On ffERG, there was no difference in amplitudes, though photopic 3.0 a- and b- wave latency, 30 Hz flicker latency, and scotopic 0.01 b-wave latency were significantly longer in aniridia patients versus control (p = 0.0018, 0.0.0005, 1.00 × 10⁻⁴, 0.0198). Thicker central macula on OCT correlated with lower mfERG amplitudes in rings 4–6 (p = 0.0369, 0.0292, 0.0255). There was no correlation between visual acuity and central macular thickness or foveal hypoplasia score as determined by OCT.
Conclusions
Higher amplitude on mfERG correlated with poorer visual acuity in rings 4 and 5 in patients with PAX6 mutations. The slope of the change in amplitude from central to peripheral rings on the mfERG is significantly different in aniridia patients compared to controls, with a slower drop-off of amplitude from center to periphery. Additionally, mfERG in aniridia showed lower amplitudes than controls in rings 1–3. These changes, along with the lack of correlation between visual acuity and central macular thickness/OCT score suggest that changes in electrical topography may be important to visual deficits in patients with PAX6 gene mutations.
Introduction
Aniridia and its associated spectrum of disorders are panocular syndromes resulting from mutations in the PAX6 gene. Patients with aniridia often experience profound vision loss, with clinical signs including malformation or absence of the iris, malformation of the macula and fovea, early development of cataracts, corneal opacity, nystagmus and glaucoma [1].
The PAX6 gene plays a crucial role as a controller for normal fetal development of numerous structures, including the eye. The wild type (normal) PAX6 gene codes for PAX6 protein, a transcription factor implicated in the control of not only ocular development, but cellular proliferation, differentiation, migration and adhesion [2]. In addition, expression of the gene continues through adulthood and is thought to play a role in the maintenance of the retina, lens and cornea throughout life [3]. Most pathogenic PAX6 mutations lead to loss of protein function, commonly decreasing protein stability or ability to bind DNA [4]. 334 mutations in PAX6 have been reported as of this writing, resulting in phenotypes ranging from complete aniridia and foveal hypoplasia to milder variants with irregular pupils or cataract only on the PAX6 disorder spectrum. PAX6 mutations act in an autosomal dominant fashion however a significant number of cases are spontaneous new mutations [5].
A defining characteristic of aniridia is the presence of an iris or pupillary abnormality. However, the part of the syndrome that is associated with the most significant vision loss is maldevelopment of the fovea or macula in the center of the retina. Most aniridia patients present with foveal hypoplasia, a condition in which the normal foveal depression is poorly defined or absent [6]. This structure is the only place in the eye where 20/20 detailed vision is possible, therefore patients suffer from decreased vision and nystagmus and are often legally blind. They may also develop cataracts, glaucoma and corneal opacity, further threatening visual acuity [5].
Little work has been done to characterize the structure and electrophysiology of the macula and optic pathways in these patients to determine the exact mechanism of vision loss, an important step in developing guided treatment. One isolated case study at the University of Tennessee Health Science Center found that full field electroretinogram (ffERG) testing in a father and daughter with aniridia from a p.X423Lfs mutation of the PAX6 gene revealed retinal photoreceptor dysfunction. Specifically, light-adapted cone-driven responses were both significantly reduced and delayed in these patients [7]. Another study of 11 aniridia patients found that ffERG alterations were observed in the majority of patients studied. An overall depression in amplitude was noted, though varied results indicated a heterogeneity in retinal function [8]. Another study of aniridia patients reported visual evoked potential (VEP) testing in two patients which showed a reverse polarity reading, indicative of misrouting of the retino-striate fibers similar to that reported in albinism [9].
The ffERG measures the mass electrical activity of the retina. As such, the electrical activity of areas such as the fovea are hidden within the larger electrical response of the eye as a whole. The multifocal electroretinogram (mfERG) simultaneously measures individual electrical responses from numerous adjacent locations on the retina. As such, mfERG is able to detect more localized abnormalities in electrical activity, such as in the macula and fovea [10]. This more localized data may be of interest in patients with PAX6 mutations as it is known that that the macula and fovea are especially affected from an anatomic standpoint. It has been shown in patients with albinism, another population which exhibits foveal hypoplasia, that abnormalities in the distribution of electrical activity in the macula can be detected on multifocal ERG [11, 12].
This study aims to further characterize the anatomy and electrophysiology of the macula in patients with aniridia by obtaining and analyzing optical coherence tomography (OCT), multifocal electroretinogram (mfERG), and full-field electroretinogram (ffERG) from aniridia patients and age matched controls. It is hypothesized that the multifocal electroretinogram (mfERG), which measures electrical activity of the center of the retina [10], will be abnormal in patients with aniridia compared to normal age matched controls. This may correlate with the degree of abnormality on ffERG, OCT, and visual acuity.
Methods
IRB Approval was obtained for a prospective study (IRB# 201408782). Patients were recruited from the University of Iowa Department of Ophthalmology and Visual Sciences, and controls were recruited with in-hospital notices and invitations to family members and patients without aniridia in the clinic. Inclusion criteria were single fold: a molecular diagnosis of PAX6 disorder through genetic blood testing. Controls were patients without PAX6-associated disorder or any other ocular disorder. Both retrospective chart review and prospective electroretinogram (ERG) and optical coherence tomography (OCT) studies were performed. Full field ERG (ffERG) (Diagnosys, LLC, Lowell, MA, USA) was obtained using standard 2008 ISCEV protocols [13, 14].
Multifocal ERGs (VERIS System, EDI Inc., Milpitas, CA, USA, Version 6.0) were recorded to map central retinal function. The stimulus array used consisted of 103 hexagons which modulated between black and white in a pseudo-random sequence called an m-sequence. Each frame lasted 13.3 ms with 75 Hz frame rate. Cross-correlation of the m-sequence with the recorded signal from the eye was mathematically extracted to produce local responses. The m-sequence was divided into 8 equal segments and recording time for each was 27.31 sec. The stimulus pattern was present on a FIMI Philips 21” monochrome CRT monitor (model no: MDO 0709BRM, Italy) and an Apple Macintosh was used to run the mfERG program. The working distance from the screen to the subject was 40 cm with a screen height of 29 cm and screen width of 38 cm. The subject viewed a fixation cross of 3.5 diameters in degrees with a pen size in % of diameter of 25 through a refractive camera for optimum visual acuity.
The multifocal signal was recorded using International Society of Clinical Electrophysiology of Vision (ISCEV) standards by trained operators using the same device in the same room with the same lighting conditions [14]. Pupils were fully dilated and topical application of 0.5% proparacaine was instilled prior to electrode placement. Dawson-Trick and Litzkow electrodes (DTL, Diagnosys LLC. Lowell, MA, USA) were placed just above the lower edge of the limbus on the cornea of each eye so as not to interfere with the visual axis. Each eye was tested one eye at a time, right eye tested first with the non-tested eye being occluded. Subjects viewed a central fixation target and were monitored by video camera. All subjects were required to maintain fixation during each of the 8 approximately 30 second segments. The total recording time was approximately 4 min. Artifact removal and reduction filters were used, as well as a low pass filter setting of 100. The waveforms recorded were amplified and automatically band pass filtered. When a stimulus produced a response outside of the filter range, for example blinks and large eye movements, it was automatically detected by the system as an artifact and rejected. Segments with large eye movements, losses of fixation, or blinks were discarded and re-recorded. Subjects could adopt small head turns if it resulted in decreased nystagmus amplitudes. A Silver clip reference electrode was placed on the ipsilateral earlobe of the recording eye. A snap electrode with EKG adhesive patch was used for the ground electrode and was placed on the forehead above and between the superciliary arches. Each local response was isolated by a cross correlation between the m-sequence and response cycle according to the VERIS algorithm[15]. Spatial averaging of 1 was used to further reduce noise and smooth the waveform with averaging of 17% of the neighboring elements to ensure equal influence by each of the 6 neighbors for a given hexagon. The amplitude and latency values subsequently obtained were analyzed for each of the six concentric rings on mfERG, and again by pooling the amplitudes of all six rings, the middle three rings (rings 1–3) and the outer three rings (rings 4–6).
OCT was obtained using the Heidelberg OCT (Franklin, MA) or the Zeiss Cirrus OCT. Central thickness was recorded from the OCT thickness map and foveal score was calculated based on the scoring algorithm reported by Thomas et al [16]. Genetic testing was performed by Gene Dx (Gaithersburg, MD) and the John and Marcia Carver Nonprofit Genetic Testing Laboratory (Iowa City, IA). Visual acuity and nystagmus data were obtained by clinical chart review. Nonparametric permutation testing was utilized to determine the statistical significance of differences between the aniridia patients and control group. This was done using the “coin” package in R, a language and environment for statistical computing and graphics. Additionally, linear regression analysis was performed using GraphPad Prism 8.4.2 to assess correlation between electrophysiology, foveal anatomy, and visual acuity among aniridia patients. Bonferroni correction for multiple comparisons was subsequently applied. Analysis of mfERG waveforms was completed using data from a singular eye from each subject. For this analysis, the eye with subjective evidence of better fixation was used in order to limit the effect of nystagmus-induced artifact. If both eyes demonstrated equal fixation, the right eye was used for analysis. All other analyses were done using averaged values from the patients’ bilateral eyes.
Results
Subjects
The aniridia group consisted of 6 patients, 3 males and 3 females, two from each of three families. The mean age of aniridia patients was 16.2 years (SD = 8.2; range 9–31 years). The control group consisted of 25 patients, 16 females and 9 males. The mean age of the control group was 21.8 (SD = 12.6; range 8–56 years). Aniridia patients averaged best-corrected visual acuity (BCVA) 20/82 (logMAR 0.58) with a range of 20/40 to 20/125 (0.3 to 0.8 logMAR). All 6 aniridia patients had nystagmus. Controls included 23 patients with no ocular disorder other than refractive error, and 2 patients with infantile motor nystagmus. 23 controls had 20/20 BCVA, while two did not; one control with infantile nystagmus due to FRMD7 mutation had 20/25 BCVA and another with infantile motor nystagmus had 20/100 BCVA. Both controls with nystagmus had normal macula OCT, no iris transillumination defects and normal ffERG. All 6 patients had a clinical diagnosis of aniridia and all had one confirmed disease causing mutation in the PAX6 gene that segregated with disease in the family. A chart containing patients’ age, visual acuity, nystagmus status, genetic variations, OCT and mfERG ring 1 waveforms compared to age-similar controls is shown in Figure 1.
Fig. 1.
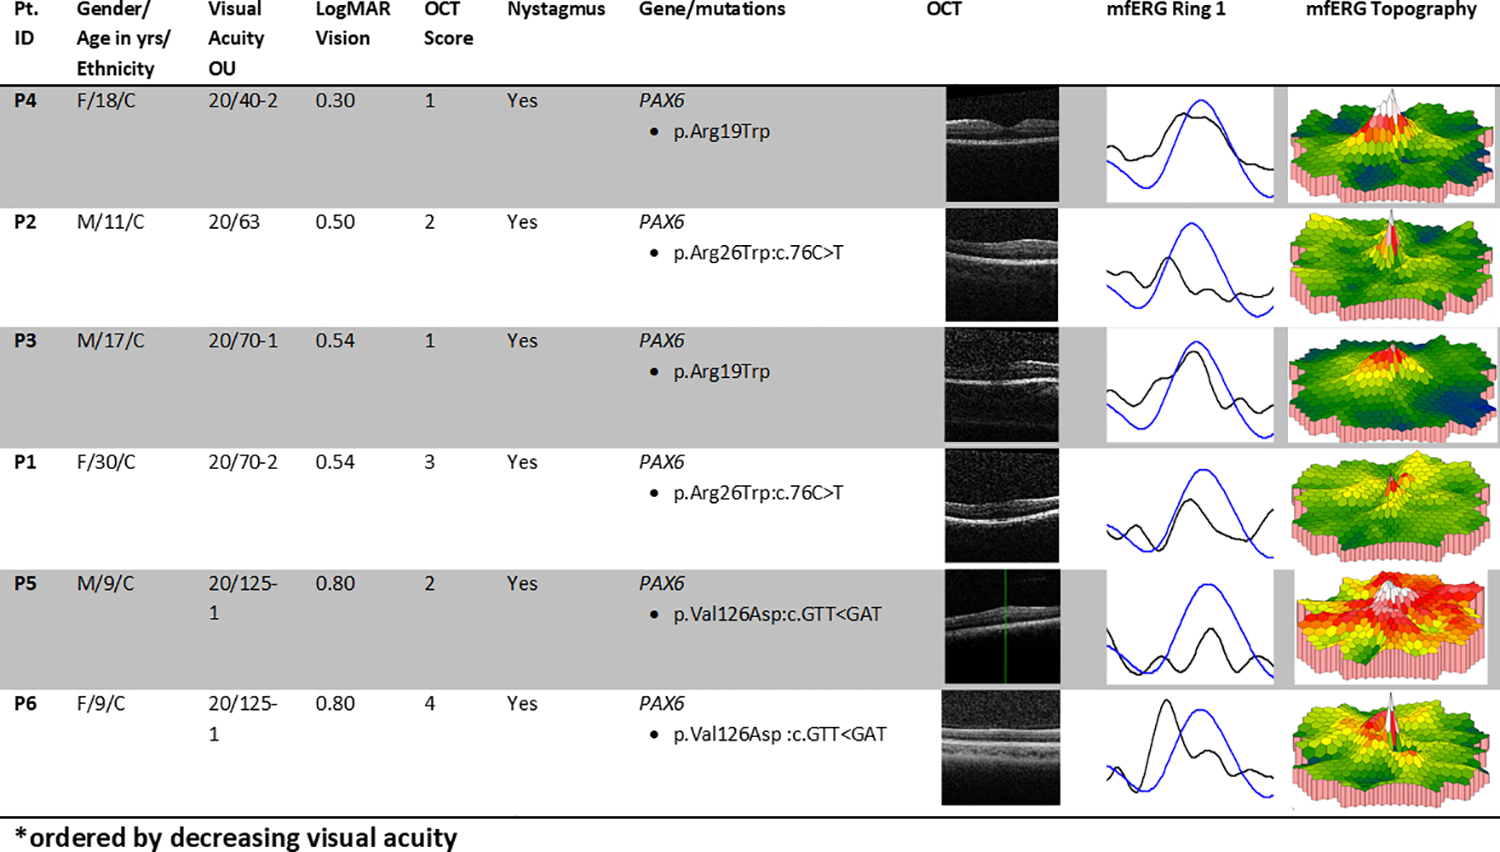
Summary of aniridia patients’ clinical data. Pt. ID = study identification number for each patient. Yrs = years. M = male, F = female; C = Caucasian. OU = both eyes. Best-corrected visual acuity was tested using Snellen letters. Column “LogMAR Vision (OU)”shows the visual acuity after conversion using the formula , where X = number of letters missed on the line, Y = number of letters discerned correctly on the following line. The column “Nystagmus” indicates presence of nystagmus or lack thereof. Column “Gene/mutations” contains aniridia genes and mutations. Column “OCT” contains optical coherence tomography scans of retinal anatomy demonstrating the range of foveal development in aniridia study participants. Column “mfERG Ring 1” shows the mfERG waveform for the centermost ring for patients as compared to age-similar controls in this study. Each normal waveform is therefore from a different controls subject, age similar to the patient whose waveform is shown. Black = patient, blue = control.
In order to account for the effect of nystagmus artifact on mfERG waveforms, mfERG amplitudes and latencies were compared, by ring, between control patients without nystagmus (n=17) and with nystagmus (n=2) as reported previously [11]. This analysis demonstrated no differences in amplitude (p-values range from 0.6772 to 1.000) or latency (p-values range from 0.0663 to 1.000). Additionally, waveforms of individual hexagonal mfERG elements were plotted against one another to determine how well they overlapped or co-vary, as determined by a set of methods outlined in the VERIS mfERG handbook [17]. Significant variance is thought to be evidence of artifact from poor fixation. Since the more peripheral rings are derived from a larger number of traces, they are generally more accurate than trying to examine the single central ring. Thus, co-variance of the 19 central waveforms combined from rings 1,2 and 3 as well as the co-variance in the 42 waveforms in ring 6 was analyzed on all PAX6 patients and 3 control patients (2 non nystagmus controls and 1 idiopathic nystagmus control). This analysis revealed remarkable overlap in ring 6 for both controls and PAX6 patients, such that no subjective difference could be noted in the quality of fixation in this ring. Analysis of rings 1–3 did show some mild increase in variation among patients with nystagmus, including aniridia patients and controls with nystagmus. However, what variation did exist was subjectively mild and did not distract from the overall pattern of the cumulative waveform. Co-variant tracings from one aniridia patient with nystagmus, one control patient with idiopathic nystagmus, and one control patient without nystagmus are shown in Figure 2.
Fig. 2.

Multifocal ERG tracings from an aniridia patient (a-c), a control with idiopathic nystagmus, (d-f) and a control without nystagmus (g-i) across different rings: rings 1–3 (a, d, and g), ring 3 (b, e, and h) and rings 6 (c, f, and i). These tracings are overlaid upon one another to demonstrate the degree of covariance between electrical signals received from individual hexagonal units. As demonstrate, there is only mild difference in the degree to which the tracings vary between patients with aniridia and normal controls, particularly in the outer rings. While there is an increase in variance in patients with nystagmus in the middle 3 rings, this does not distract from the overall pattern of the waveform, indicating adequate fixation on mfERG.
mfERG
Aniridia patients demonstrated significantly lower amplitudes in rings 1–3 compared to controls (p = 0.0006, p = 0.0013, p = 0.0132). There was no significant difference in outer ring amplitudes. After applying Bonferroni correction, only rings 1 and 2 remain significant. This relationship is demonstrated in Figure 3. The rate of change in amplitude from ring 1 to ring 6 was steeper in controls (rate of decline – 0.3246) than in aniridia patients (unilateral rate of decline – 0.1816) (p = 4.624 × 10−61) as shown in Figure 4.
Fig. 3.
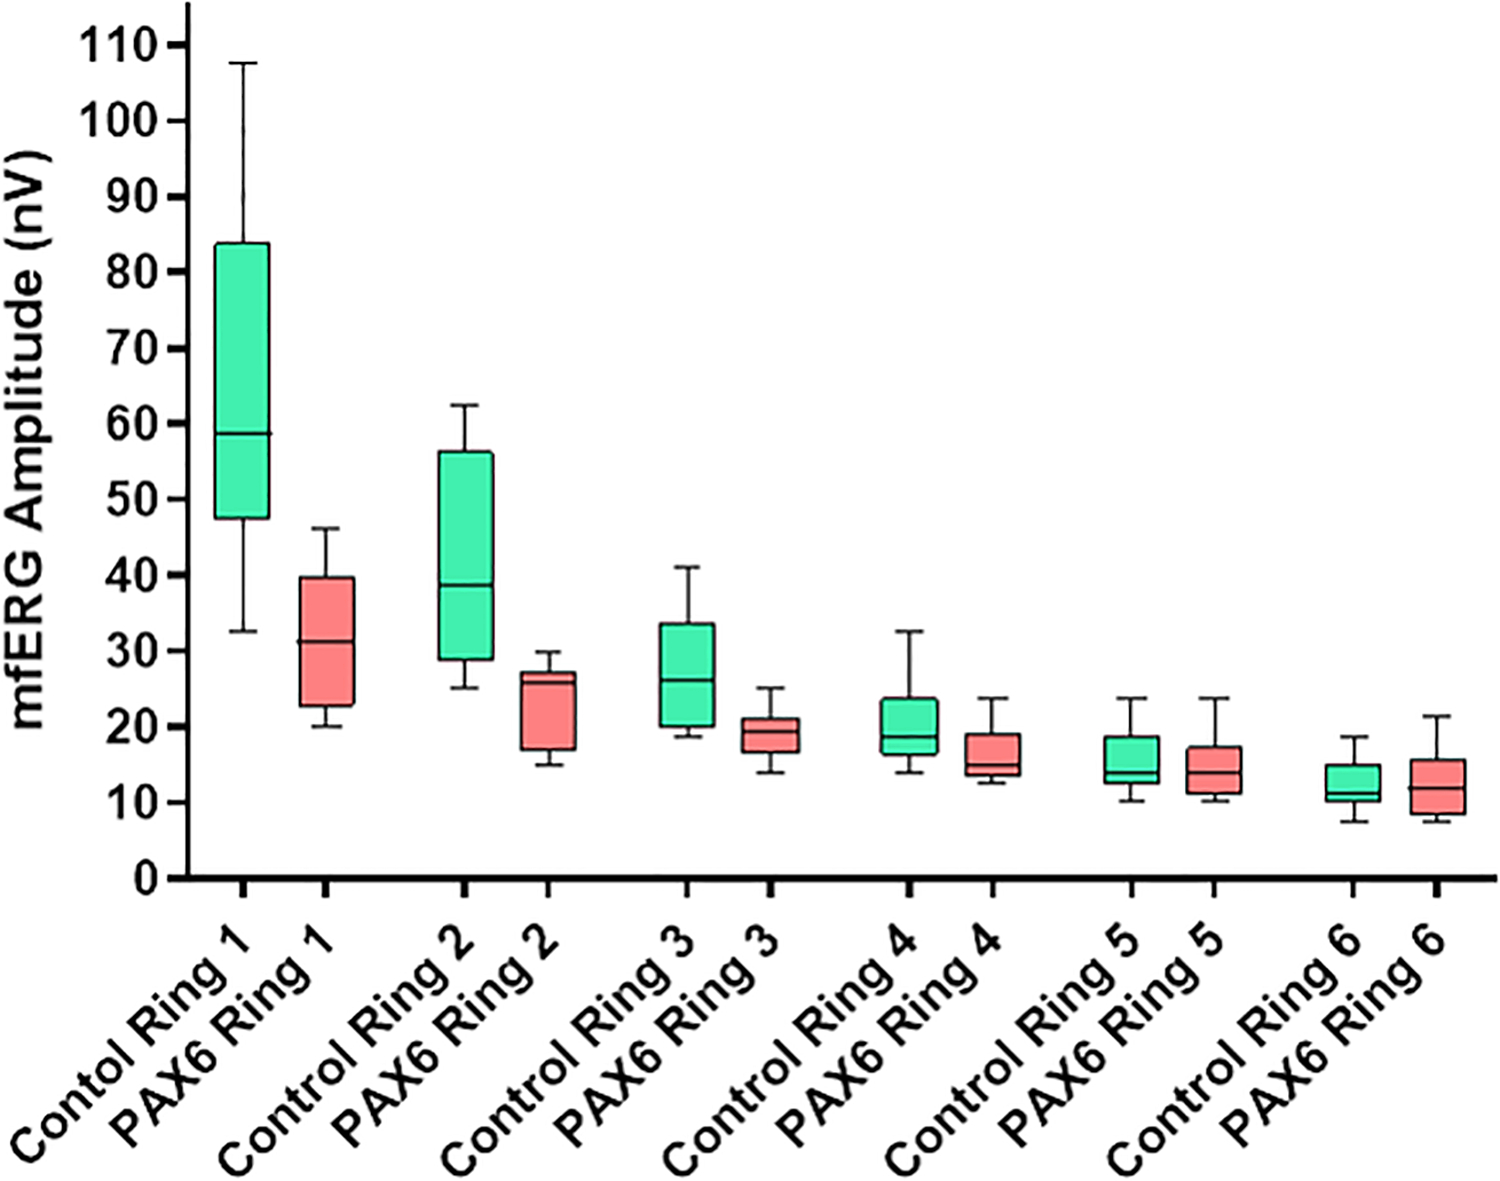
Multifocal ERG amplitudes for rings 1 – 6 in aniridia patients versus controls. This scatterplot depicts the amplitudes for patients (n = 6) and controls (n = 19 for mfERG) in nV/deg2. Aniridia patients averaged significantly lower mfERG amplitudes than controls in rings 1–3 (p = 0.0006, p = 0.0013, p = 0.0132).
Fig. 4.
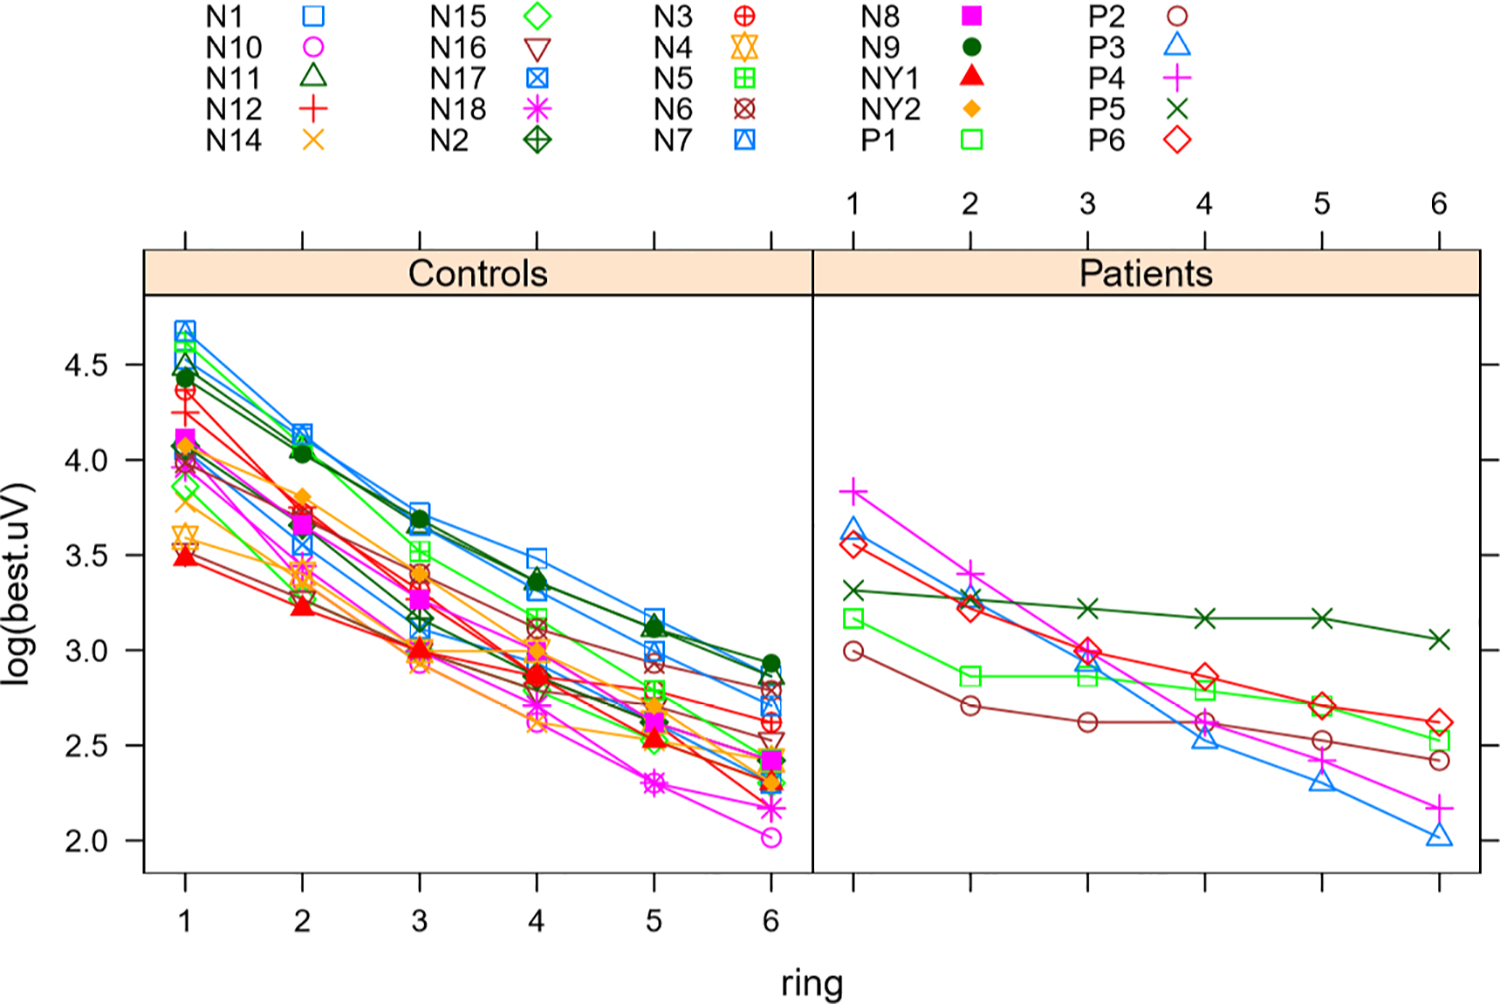
Multifocal ERG change in amplitude from ring 1 through 6 in patients and controls. This figure was produced in R. It juxtaposes decrease in amplitudes from the centermost ring (ring 1) to the most peripheral ring (ring 6) in aniridia patients compared to controls. X-axis shows the rings in ascending order. Y-axis is the amplitude for each ring on the logarithmic scale. Difference between rate of decrease for patients (right) and controls (left) was statistically significant with the controls having a steeper decrease toward the periphery (p = 4.6237943 × 10−67). Color coded symbols correspond to individual patients and controls as listed.
In order to bolster the analysis and minimize the possible signal-to-noise effect of nystagmus, this analysis was repeated by pooling the amplitudes of all six rings, the middle three rings (rings 1–3) and the outer three rings (rings 4–6). There was no significant difference in amplitudes between aniridia patients and controls for pooled rings 1–6 (p-value = 0.8356). Comparison of pooled rings 1–3 with pooled rings 4–6 in the control population revealed significantly higher amplitudes in the central macula compared to the periphery (p-value = 3.395e-10). There was no significant difference in amplitudes between the central and peripheral macula among aniridia patients (p-value = 0.07359). Comparison of the pooled amplitudes in controls versus aniridia patients revealed significantly lower amplitudes in the central rings of those with aniridia (p-value = 0.0007849). Meanwhile, there was no significant difference between the two populations in outer rings amplitudes (p-value = 0.8475). All pooled differences maintained their significance after Bonferroni correction.
Aniridia patients averaged shorter latencies than controls in ring 1 (p = 0.0312), and longer latencies in rings 5 and 6 (p = 0.0026, p = 0.0042). After Bonferroni correction, only rings 5 and 6 maintained significance. There was a significantly positive correlation in aniridia patients between logMAR visual acuity and mfERG amplitude in ring 4 (R-square = 0.6951, p-value = 0.0392) and ring 5 (R-square = 0.6619, p-value = 0.0489). This relationship between visual acuity and mfERG amplitude also nears significance in ring 6 (R-square = 0.5788, p-value = 0.0790). As such, higher amplitude of mfERG in the outer rings was associated with poorer vision. Mean and standard deviation of amplitudes and latencies for all rings in subsets of patients and controls can be found in Table 1.
Table 1.
Mean amplitudes/latencies and standard deviations for mfERG, ffERG, OCT and VA between groups
| Test | Test category | Aniridia patients Mean Amp. | Aniridia patients SD Amp. | Control patients Mean Amp. | Control patients SD Amp. | Aniridia patients Mean Lat. | Aniridia patients SD Lat. | Control patients Mean Lat. | Control patients SD Lat. |
|---|---|---|---|---|---|---|---|---|---|
| mfERG | Ring 1 | 31.67 | 9.74 | 64.01 | 22.47 | 25.51 | 1.52 | 26.95 | 1.11 |
| Ring 2 | 23.33 | 5.79 | 40.72 | 12.83 | 25.83 | 1.18 | 26.80 | 1.05 | |
| Ring 3 | 19.17 | 3.68 | 27.17 | 7.91 | 25.56 | 1.01 | 25.57 | 0.84 | |
| Ring 4 | 16.25 | 4.11 | 20.39 | 5.48 | 25.97 | 1.11 | 25.13 | 0.70 | |
| Ring 5 | 14.58 | 4.92 | 15.59 | 4.09 | 26.53 | 0.63 | 25.31 | 0.75 | |
| Ring 6 | 12.5 | 4.87 | 12.23 | 3.30 | 26.67 | 0.92 | 25.39 | 0.85 | |
| ffERG | Photopic 3.0 (b-wave) | 120.45 | 61.78 | 131.80 | 34.95 | 32.66 | 12.42 | 29.88 | 1.43 |
| Photopic 3.0 (a-wave) | 35.09 | 27.57 | 29.43 | 8.16 | 13.43 | 6.01 | 14.18 | 0.71 | |
| 30 Hz flicker | 83.68 | 45.06 | 100.27 | 25.85 | 29.75 | 11.28 | 26.06 | 1.40 | |
| Scotopic 0.01 (b-wave) | 249.27 | 104.94 | 217.90 | 73.69 | 89.25 | 34.93 | 79.74 | 6.22 | |
| Scotopic 0.01 (a-wave) | 15.38 | 16.17 | 6.07 | 3.06 | 27.71 | 12.39 | 32.76 | 4.07 | |
| Scotopic 3.0 (b-wave) | 335.95 | 150.73 | 292.62 | 59.54 | 48.91 | 20.86 | 45.56 | 3.60 | |
| Scotopic 3.0 (a-wave) | 128.06 | 78.16 | 144.11 | 33.75 | 14.28 | 6.34 | 15.97 | 0.74 | |
| Aniridia patients Mean | Aniridia patients SD | Control patients Mean | Control patients SD | ||||||
| OCT | Central macular thickness | 322.08 | 31.76 | 277.61 | 15.94 | ||||
| VA | LogMAR | 0.57 | 0.19 | 0.00 | 0.11 |
ffERG
There was no significant difference in amplitudes on ffERG between aniridia patients and controls. Photopic 3.0 a- and b- wave latency were significantly longer in aniridia patients versus control (p = 0.0018, p = 0.0005). 30 Hz flicker latency was significantly longer in aniridia patients than in controls (p = 1.00 × −4). Scotopic 0.01 b-wave latency was also significantly longer in aniridia patients versus control (p = 0.0198). There was no significant difference in latencies for scotopic 0.01 a-wave or scotopic 3.0 a- and b-waves. Following Bonferroni correction, Photopic 3.0 a- and b- wave latency and 30 Hz flicker latency remained statistically significant. There was a significantly negative relationship in aniridia patients between logMAR visual acuity and scotopic 3.0 b-wave amplitude (R-square = 0.9194, p-value = 0.0025), such that higher amplitudes were associated with better vision. No other relationship between visual acuity and ffERG amplitude was noted. Mean and standard deviation of amplitudes and latencies for all rings in subsets of patients and controls can be found in Table 1.
OCT
In aniridia patients, thicker central macula on OCT correlated with lower mfERG amplitudes in rings 4, 5 and 6 (R-square = 0.8116, p-value = 0.0369; R-Square = 0.8380, p – value = 0.0292; R-square = 0.8514, p-value = 0.0255). There was no correlation between central macular thickness and ffERG amplitudes. Additionally, there was no correlation between visual acuity and central macular thickness of OCT. The foveal hypoplasia score also did not correlate with visual acuity, though there was a significantly positive relationship between degree of foveal development and mfERG amplitude in ring 6 (R-square = 0.7849, p-value = 0.0454). Mean and standard deviation of central macular thickness and visual acuity in subsets of patients and controls can be found in Table 1.
Discussion
This is the first study, to our knowledge, to correlate mfERG, ffERG, visual acuity and OCT thickness values for a cohort of patients with aniridia secondary to PAX6 mutations.
The most striking difference noted between aniridia patients and controls is the significant difference in mfERG amplitudes at the center of the macula. Aniridia patients had significantly lower amplitudes in rings 1, 2, and 3 with no difference in rings 4,5, and 6 compared to controls. Additional analysis was done which pooled the waveforms of all hexagonal display areas in rings 1–6 to produce a single waveform, a technique intended to minimize the effect of nystagmus on the waveforms produced. The amplitudes were then compared between our normal controls and aniridia patients. The pooled 6 ring analysis, unsurprisingly, showed no difference between amplitudes of normal controls and patients with aniridia. This is likely due the fact that the changes in amplitude noted on comparison of individual rings were restricted to rings 1–3. The inner 3 rings cover significantly less surface area than the outer 3 rings (19 waveforms vs 84 waveforms, respectively), giving the outer rings, which had no difference between the two groups, a much heavier influence in a pooled analysis. This analysis was repeated by pooling the waveforms in rings 1–3 and again in rings 4–6, generating two new “rings.” Comparison of amplitudes from pooled rings 1–3 with pooled rings 4–6 in the control population predictably revealed significantly higher amplitudes in the central macula compared to the periphery in controls, as expected by the normal topography of electrical activity in healthy eyes. Interestingly, there was no significant difference in amplitudes between the central and peripheral macula among aniridia patients. This lack of difference would either imply that amplitudes in the central rings were depressed, outer rings were elevated, or a combined effect of both. However, subsequent analysis comparing the amplitudes in the pooled rings 1–3 in controls versus aniridia patients revealed significantly lower amplitudes in the central rings of aniridia patients. Meanwhile, there was no significant difference in amplitudes in the outer rings between the two groups, consistent with findings of the 6 ring analysis. These depressed central amplitudes in patients with PAX6 mutations result in an overall flattened slope of amplitudes from the central ring to peripheral ring on mfERG, different from the steep drop-off in amplitudes outside ring 1 which was seen in controls. This profound flattening of the slope was particularly evident for patients P5 & P6, siblings with p.Val126Asp :c.GTT<GAT mutation in PAX6, who also have the lowest visual acuities in this study. This finding suggests the presence of an altered electrical topography in the macula of aniridia patients compared to controls, as demonstrated by the density plot in Figure 5. There are several possible explanations for this difference, including aberrant photoreceptor packing in the macula. This is supported by a 2019 study in which 5 family members with congenital aniridia were found to have lower than normal cone density at the central 10 degrees of the fovea on adaptive optics scanning light ophthalmoscopy images [18].
Fig. 5.
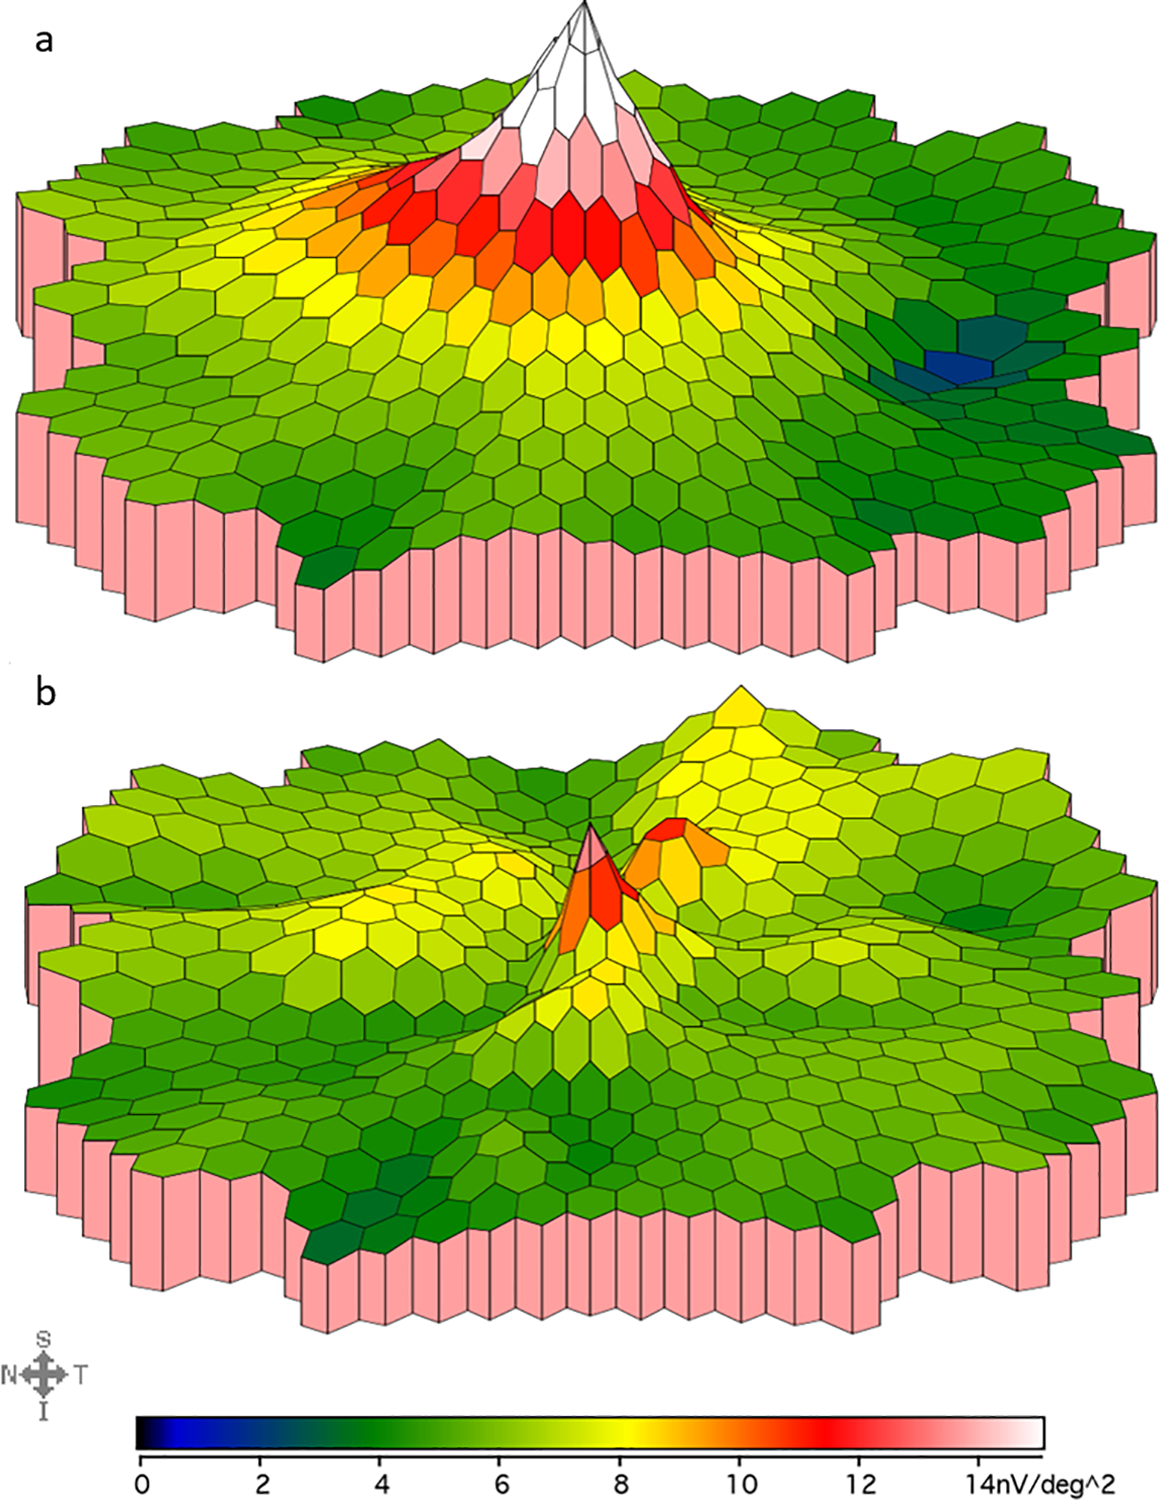
mfERG density plot in a control (a) and an aniridia patient (b). This figure compares the mfERG responses recorded from the macula in a control subject (top, age 29 years) vs an aniridia patient (bottom, age 30 years). Color gradient corresponds to different mfERG amplitudes as shown below each density plot. This aniridia patient demonstrates a slower drop-off of amplitude from center to periphery and lower amplitudes than controls in the innermost rings, which is representative of the patient group.
Additionally, this study found that patients with aniridia averaged shorter latencies on mfERG than controls in ring 1, and longer latencies in rings 5 and 6. It is important to note that only the longer latencies found in rings 5 and 6 of aniridia patients remained statistically significant following Bonferroni correction, while the shorter latencies in ring 1 of aniridia patients did not. As such, it may be inferred that the relatively small sample size in this study allowed some noise artifact or other factor to skew the latency measurements in ring 1. However, the persistence of the differences in the outer two rings between aniridia patients and control patients indicates abnormal electrical activity in the outer maculae of patients with aniridia despite normal peripheral amplitudes on mfERG.
There was a correlation between logMAR visual acuity and multifocal ERG amplitudes in the outer rings (significant in rings 4–5, nearing significance in ring 6), such that higher amplitudes in rings 4–6 correlated with worse visual acuity. These findings suggest that the degree of vision loss among these patients may rely in part on the degree of electrical activity in the more peripheral parts of the fovea, with higher amplitudes leading to decreased vision. This is interesting, however, because it was the inner rings (rings 1–3) of the fovea which displayed significantly lower amplitude waveforms on mfERG in aniridia patients compared to controls, while no significant difference was found between normal controls and patients with aniridia in the outermost rings. It may be the case that vision in these patients is more dependent on the topography of electrical activity than amplitude itself, such that those with a greater difference in amplitude between central and peripheral rings of the macula have better vision. This may be explained by a center-surround effect, in which the typical baseline of activity in the outer photoreceptors suppresses activity of the altered central receptors and nerves which are most responsible for detailed 20/20 vision. We have noted previously that higher than normal amplitudes are present in rings 4–6 in albinism patients [11].
There are multiple reports demonstrating a spectrum of abnormality in ffERG associated with different mutations in the PAX6 gene [7, 8, 23–25]. One cases series reported abnormal ERGs in 14 of 19 patients with aniridia, including abnormal dark adapted responses [25]. Another case series of 16 patients with aniridia from a single family reported variable degrees of ffERG amplitude reduction [23]. A case study of a father and daughter with p.X423Lfs mutations in the PAX6 gene showed both a reduction in amplitude and delay of the light-adapted cone driven ERG responses [7]. The small eye mouse semi-dominant model of PAX6-linked eye disease (Pax6 Sey+/mouse) exhibits abnormally thick retinas and diminished ffERG responses under both scotopic and photopic conditions [26]. Findings in our study are consistent with this overall variability in ffERG among aniridia patients. While we found that there was no significant difference in amplitudes between aniridia patients and controls on ffERG, latencies were significantly delayed for photopic 3.0 a- and b- wave and 30 Hz flicker. These findings suggest aberrant signal firing within the cone system, specifically in the cone photoreceptors and on- and off-cone bipolar cells. There were also delayed latencies in the scotopic 0.01 b-wave, suggestive of some degree of aberrant firing in the rod system as well.
There was no correlation between visual acuity and central macular thickness or foveal hypoplasia score. Foveal hypoplasia scoring is used as a quantitative measure for the degree of underdevelopment in foveal anatomy commonly seen in aniridia. This score assesses whether there is outer segment lengthening in the fovea, with central thickness primarily determined by the amount of foveal pit formation and extent to which inner retina is extruded in the fovea. The lack of correlation between foveal anatomy and visual acuity evidenced in this study suggests that thickening of the fovea with lack of extrusion of the inner retinal layers may be a secondary effect of the disease process. While easily recognizable on OCT, foveal hypoplasia is not a main driver of vision loss in aniridia. Instead, it is the functional abnormalities in electrical topography seen on electroretinography which are a major cause of decreased vision.
A previous study which investigated the electrophysiologic topography of the retina in albinism patients found a similar flattened slope of amplitudes on mfERG. While in aniridia it was the central rings which showcased lower amplitudes, it was the macular periphery which was altered in the albinism population, with significantly higher amplitudes in rings 4, 5, and 6, while rings 1–3 had similar amplitudes to controls. Additionally, aniridia patients had longer latencies in rings 4–6 while those with albinism were no different than controls, though both groups had shorter latencies at the central ring (ring 1). Meanwhile, albinism patients showed numerous variations in ffERG amplitudes while patients with aniridia displayed normal ffERG amplitudes.[11]. These stark differences in electrophysiologic findings indicate that these two vision-impairing diseases, while sharing similar foveal anatomy on examination and OCT, are likely the result of different pathophysiologic mechanisms.
One area of concern with the design on this study was the validity of mfERG in patient populations with nystagmus. Chu et al., in their study characterizing the mfERG waveforms of normal subjects instructed to make frequent voluntary eye movements during testing, suggest that unsteady fixation may suppress the amplitude of central mfERG responses. As such, the authors propose that the maintenance of adequate fixation on a central target is important for reducing artifact. This was particularly true when the degree of deviation in fixation was greater than the visual angle subtended by the central hexagon in mfERG [27]. As recommended in that study, a fixation monitoring system was utilized in our study to ensure adequate fixation for all patients. Additionally, as noted in the results above, an analysis of control patients with and without nystagmus revealed that there was no significant difference in ring-level mfERG amplitudes or latencies between the two groups. A similar analysis was completed by Hu et al., which compared amplitudes and latencies among albinism patients with (n = 12) and without (n=4) nystagmus. That study found “no difference in amplitude in any ring (p values from 0.68 to 1.0 going from ring 1 to ring 6). There was no difference in latency (p values from 0.90 to 0.54 going from rings 1 to ring 6). Controls without nystagmus (n = 17) were also compared to controls with nystagmus (n = 2) and also demonstrated no differences in amplitude (p value from 0.65 to 0.84) or latency (p value from 0.07 to 0.45)” [11]. The analysis of co-variance completed in this study also revealed only mild fixation deficits among patients and controls with nystagmus, with waveform distribution appearing subjectively similar between individuals with nystagmus and normal controls. However, this data may be limited by a relatively low signal-to-noise ratio seen across study participants both with and without nystagmus, as shown in Figure 2. This low signal-to-noise ratio is an area of potential weakness in this study as it may represent some level of intrusive nystagmus artifact. Despite this, overall the findings of the other analyses described above suggest that proper fixation monitoring was adequate to control nystagmus-related artifact such that it was not significant enough to drive the electrophysiologic changes noted in this study. The depressed amplitudes in the central rings of aniridia patients are instead likely to represent actual functional differences in the fovea.
Though not directly assessed as a part of this study, it is interesting to consider the impact of changes in the posterior visual pathways on the retina of aniridia patients. Evidence of such alterations has been suggested by abnormal routing of the retinostriate fibers found in one study which demonstrated reverse polarity signals on pattern VEP among several aniridia patients [9]. Another study showed altered white matter structure in the posterior visual tracts of patients with aniridia, including the optic tract and optic radiation [19]. These neural anomalies in the aniridia eye may serve to further alter development of the macular cones. The latter hypothesis, while compelling, is complicated by findings in two previous studies which showed normal chiasmatic pathways in both mouse and human models of aniridia [20, 21]. Given the apparent unreliability of abnormal cortical decussation as a defining feature of the disease, other factors may be at play. One study which analyzed the anatomy of the calcarine fissure, the location of the primary visual cortex, revealed marked shortening in patients with albinism and aniridia, both populations which lack normal foveal development [22]. This finding suggests that altered macular input to striate cortex, as a result of foveal hypoplasia, may subsequently impact cortical organization at a developmental level. Given the positive relationship between logMAR visual acuity and multifocal ERG amplitude in the outer rings, visual cortex may thus be adapted to the lower spatial frequencies seen in the disease. Further studies of the posterior pathways and possible correlation with ERG findings, visual acuity and macular anatomy may be an important area for further investigation.
In conclusion, this study demonstrates that topography of mfERG responses in the macula was aberrant in aniridia patients compared to controls, with a slower drop-off of amplitude from center to periphery and lower amplitudes than controls in the innermost central rings. Higher amplitudes in the peripheral rings on multifocal ERG were associated with poorer vision in patients with aniridia. Multifocal amplitudes were inversely correlated with central macular thickness on OCT. Full field ERG in aniridia patients revealed normal amplitudes but delayed latencies, suggesting aberrant signal firing, primarily within the cone system. A localized anomaly of electrical response in the fovea is the likely cause of poor visual acuity in aniridia. This is in contradisctinction to patients with albinism who also exhibit foveal hypoplasia, but who have normal electrical activity in rings 1–3 on mfERG. Further studies to correlate foveal mfERG responses with cone packing and morphology are needed.
Funding:
Vision of Children Foundation, Ronald Keech Professorship
Footnotes
Conflicts of interest/Competing interests: Arlene Drack, MD is on the Advisory Board of ProQr. No other author has any conflicts of interest to report.
Ethics approval: Approval was obtained from the institutional review board of the University of Iowa. The procedures used in this study adhere to the tenets of the Declaration of Helsinki. (IRB # 201408782)
Consent to participate: Informed consent was obtained from all individual participants included in the study or their guardians.
Consent for publication: Patients or their guardians signed informed consent regarding publishing their data and photographs.
Contributor Information
Tucker Dangremond, University of Iowa Institute for Vision Research, University of Iowa, 200 Hawkins Drive, Iowa City, IA 52242, USA; Carver College of Medicine, University of Iowa, Iowa City, USA; Department of Ophthalmology and Visual Sciences, University of Iowa, Iowa City, USA.
Kai Wang, University of Iowa Institute for Vision Research, University of Iowa, 200 Hawkins Drive, Iowa City, IA 52242, USA; College of Public Health, Department of Biostatistics, University of Iowa, Iowa City, USA.
Megan Helms, University of Iowa Institute for Vision Research, University of Iowa, 200 Hawkins Drive, Iowa City, IA 52242, USA; Department of Ophthalmology and Visual Sciences, University of Iowa, Iowa City, USA; University of Illinois, Chicago, USA.
Sajag Bhattarai, University of Iowa Institute for Vision Research, University of Iowa, 200 Hawkins Drive, Iowa City, IA 52242, USA; Department of Ophthalmology and Visual Sciences, University of Iowa, Iowa City, USA.
Wanda Pfeifer, University of Iowa Institute for Vision Research, University of Iowa, 200 Hawkins Drive, Iowa City, IA 52242, USA; Department of Ophthalmology and Visual Sciences, University of Iowa, Iowa City, USA.
Arlene V. Drack, University of Iowa Institute for Vision Research, University of Iowa, 200 Hawkins Drive, Iowa City, IA 52242, USA Carver College of Medicine, University of Iowa, Iowa City, USA; Department of Ophthalmology and Visual Sciences, University of Iowa, Iowa City, USA; Department of Pediatrics, University of Iowa, Iowa City, USA.
Availability of data and material:
The datasets generated during and/or analyzed during the current study are available from the corresponding author on reasonable request.
References
- 1.Mariya Moosajee M, BSc, PhD, FRCOphth, Hingorani M. Melanie, MBBS, MD, FRCOphth, and Anthony M Moore T, BM BCh, FRCS, FRCOphth, Fmed Sci. PAX-Related Aniridia. May 20, 2003. Octover 18, 2018 [cited 2020 April 28]; Available from: https://www.ncbi.nlm.nih.gov/books/NBK1360/.
- 2.van Heyningen V and Williamson KA, PAX6 in sensory development. Human Molecular Genetics, 2002. 11(10): p. 1161–1167. [DOI] [PubMed] [Google Scholar]
- 3.Zhang W, et al. , Quantitation of PAX6 and PAX6(5a) transcript levels in adult human lens, cornea, and monkey retina. Molecular vision, 2001. 7: p. 1–5. [PMC free article] [PubMed] [Google Scholar]
- 4.Prosser J and van Heyningen V, PAX6 mutations reviewed. Human Mutation, 1998. 11(2): p. 93–108. [DOI] [PubMed] [Google Scholar]
- 5.Nelson LB, et al. , Aniridia. A review. Survey of Ophthalmology, 1984. 28(6): p. 621–642. [DOI] [PubMed] [Google Scholar]
- 6.Perez Y, et al. , Isolated foveal hypoplasia with secondary nystagmus and low vision is associated with a homozygous SLC38A8 mutation. European journal of human genetics : EJHG, 2014. 22(5): p. 703–706. [DOI] [PMC free article] [PubMed] [Google Scholar]
- 7.Hood MP, et al. , Abnormal cone ERGs in a family with congenital nystagmus and photophobia harboring a p.X423Lfs mutation in the PAX6 gene. Doc Ophthalmol, 2015. 130(2): p. 157–64. [DOI] [PubMed] [Google Scholar]
- 8.Tremblay F, et al. , Effects of PAX6 mutations on retinal function: an electroretinographic study. Am J Ophthalmol, 1998. 126(2): p. 211–8. [DOI] [PubMed] [Google Scholar]
- 9.Merrill KS and Summers CG, Positive Angle Kappa: A Possible Sign of Aniridia. American Orthoptic Journal, 2012. 62(1): p. 70–76. [DOI] [PubMed] [Google Scholar]
- 10.Azarmina M, Full-Field versus Multifocal Electroretinography. Journal of ophthalmic & vision research, 2013. 8(3): p. 191–192. [PMC free article] [PubMed] [Google Scholar]
- 11.Hu Z, et al. , Correlation between electroretinography, foveal anatomy and visual acuity in albinism. Documenta Ophthalmologica, 2019. 139(1): p. 21–32. [DOI] [PMC free article] [PubMed] [Google Scholar]
- 12.Nusinowitz S and Sarraf D, Retinal function in X-linked ocular albinism (OA1). Curr Eye Res, 2008. 33(9): p. 789–803. [DOI] [PubMed] [Google Scholar]
- 13.McCulloch DL, et al. , ISCEV Standard for full-field clinical electroretinography (2015 update). Doc Ophthalmol, 2015. 130(1): p. 1–12. [DOI] [PubMed] [Google Scholar]
- 14.Hood DC, et al. , ISCEV standard for clinical multifocal electroretinography (mfERG) (2011 edition). Documenta Ophthalmologica, 2012. 124(1): p. 1–13. [DOI] [PMC free article] [PubMed] [Google Scholar]
- 15.Sutter EE and Tran D, The field topography of ERG components in man--I. The photopic luminance response. Vision Res, 1992. 32(3): p. 433–46. [DOI] [PubMed] [Google Scholar]
- 16.Thomas MG, et al. , Structural grading of foveal hypoplasia using spectral-domain optical coherence tomography a predictor of visual acuity? Ophthalmology, 2011. 118(8): p. 1653–60. [DOI] [PMC free article] [PubMed] [Google Scholar]
- 17.Portnoy R and Sutter E, VERIS ™ Science 5.1 Visual Evoked Response Imaging System Reference Guide. 2005, VERIS: Online. p. 104–105. [Google Scholar]
- 18.Pedersen HR, et al. , The Cone Photoreceptor Mosaic in Aniridia: Within-Family Phenotype-Genotype Discordance. Ophthalmol Retina, 2019. 3(6): p. 523–534. [DOI] [PMC free article] [PubMed] [Google Scholar]
- 19.Burton CR, et al. , Microstructural differences in visual white matter tracts in people with aniridia. Neuroreport, 2018. 29(17): p. 1473–1478. [DOI] [PubMed] [Google Scholar]
- 20.Neveu MM, et al. , Optic chiasm formation in humans is independent of foveal development. Eur J Neurosci, 2005. 22(7): p. 1825–9. [DOI] [PubMed] [Google Scholar]
- 21.Deiner MS and Sretavan DW, Altered midline axon pathways and ectopic neurons in the developing hypothalamus of netrin-1- and DCC-deficient mice. J Neurosci, 1999. 19(22): p. 9900–12. [DOI] [PMC free article] [PubMed] [Google Scholar]
- 22.Neveu MM, et al. , The fovea regulates symmetrical development of the visual cortex. J Comp Neurol, 2008. 506(5): p. 791–800. [DOI] [PubMed] [Google Scholar]
- 23.Hittner HM, et al. , Variable Expressivity in Autosomal Dominant Aniridia by Clinical, Electrophysiologic, and Angiographic Criteria. American Journal of Ophthalmology, 1980. 89(4): p. 531–539. [DOI] [PubMed] [Google Scholar]
- 24.Jia X, et al. , A novel mutation of PAX6 in Chinese patients with new clinical features of Peters’ anomaly. Mol Vis, 2010. 16: p. 676–81. [PMC free article] [PubMed] [Google Scholar]
- 25.Wu L, et al. , Abnormalities of ERG in congenital aniridia. Yan Ke Xue Bao, 1991. 7(3): p. 151–2, 119. [PubMed] [Google Scholar]
- 26.Hill RE, et al. , Mouse small eye results from mutations in a paired-like homeobox-containing gene. Nature, 1991. 354(6354): p. 522–5. [DOI] [PubMed] [Google Scholar]
- 27.Chu PH, Chan HH, and Leat SJ, Effects of unsteady fixation on multifocal electroretinogram (mfERG). Graefes Arch Clin Exp Ophthalmol, 2006. 244(10): p. 1273–82. [DOI] [PubMed] [Google Scholar]
Associated Data
This section collects any data citations, data availability statements, or supplementary materials included in this article.
Data Availability Statement
The datasets generated during and/or analyzed during the current study are available from the corresponding author on reasonable request.