Abstract
This paper reports a computational method, the quantized elastic deformational model, that can reliably describe the conformational flexibility of a protein in the absence of the amino acid sequence and atomic coordinates. The essence of this method lies in the fact that, in modeling the functionally important conformational changes such as domain movements, it is possible to abandon the traditional concepts of protein structure (bonds, angles, dihedrals, etc.) and treat the protein as an elastic object. The shape and mass distribution of the object are described by the electron density maps, at various resolutions, from methods such as x-ray diffraction or cryo-electron microscopy. The amplitudes and directionality of the elastic deformational modes of a protein, whose patterns match the biologically relevant conformational changes, can then be derived solely based on the electron density map. The method yields an accurate description of protein dynamics over a wide range of resolutions even as low as 15–20 Å at which there is nearly no visually distinguishable internal structures. Therefore, this method dramatically enhances the capability of studying protein motions in structural biology. It is also expected to have ample applications in related fields such as bioinformatics, structural genomics, and proteomics, in which one's ability to extract functional information from the not-so-well-defined structural models is vitally important.
Keywords: conformational flexibility|elastic deformation|large conformational change|elastic network|normal mode analysis
Computational simulations of protein dynamics (1, 2) play an important role in deciphering protein functions in modern structural biology. To date, all the procedures for describing the motions of a protein require the knowledge of the atomic coordinates—i.e., the precise locations of the atoms. However, as the field of structural biology moves into an era of supermolecular complexes and membrane-bound proteins, there have been an increasing number of cases in which one can only obtain fuzzy images of the molecules by means of, for example, cryo-electron microscopy (cryo-EM). The knowledge of structures in these cases is not much more than the rough shapes of the molecules. Therefore, a challenging question is whether one can describe the motions of a protein, at least the gross features, based on its fuzzy image. The success of such a method would not only advance one's ability to model protein motions to a completely new level in structure biology, but it will also profoundly influence broader fields such as bioinformatics, structural genomics, and proteomics, in which one's ability to extract functional information from the not-so-well-defined structural models is vitally important.
In the light of such a challenge, we developed a computational method, the quantized elastic deformational model (QEDM), by combining and extending several existing methods that were developed for related, but different, purposes. The results clearly demonstrate that, without the knowledge of the amino acid sequence and atomic coordinates, it is indeed feasible to efficiently extract the information of protein motions, to a reasonable degree of accuracy, solely from the rough shape and mass distribution of a protein. The fundamental assumption is that a folded protein can be treated as an elastic object and the mass density distribution of the object is equivalent to the electron density distribution of the protein. The thermal fluctuations of the structure are then treated as elastic deformations. This is a valid assumption especially for supermolecular complexes, in which the functionally important conformational changes, such as domain movements (3), are mediated by collective global deformational motions of the structure. As shown in numerous studies of the standard normal mode analysis (NMA) (4–12), the pathways of the functionally important conformational changes can be matched by the intrinsic low-energy deformational modes. Moreover, these collective global motions are not sensitive to the local connectivity of the molecular structure, instead, they are primarily influenced by the global shape and mass distribution of the molecule (13).
In this paper, we first outline the procedure of QEDM and then report the validation of QEDM by using proteins with known high-resolution structures.
Methods
Vector Quantization Method.
Vector quantization (VQ) algorithm (14, 15) is a method originally developed for digital signal compression and image processing. It has been recently introduced to the docking of a flexible protein structure into a cryo-EM density map (16). This method essentially allows the discretization of an irregularly shaped three-dimensional (3D) object, in this case the electron density map of a biological molecule, into a set of finite Voronoi cells, whose centroids are represented by a set of vectors vi ∈ ℛ3, i = 1, …, N. The positions of these centroids are determined by minimizing the distortion error E of the discrete data representation
 |
1 |
where rj ∈ ℛ3 is the data point with the grid index j, ρ(rj) is the corresponding electron density on the grid point, and v is the centroid vector closest to rj in space. Therefore, E is the mean-square deviation of the centroid vectors of Voronoi cells from the encoded 3D data. The topology-representing neural networks (17, 18) are used to find the global minimum of E and the resulting set of Voronoi cells are expected to characterize the shape and density of the object. In treating a protein, the number of Voronoi cells N can be chosen to be either the same as the number of amino acid residues in the protein or not.
Elastic Network Models.
There are two relevant methods that operate under a fundamental assumption that a folded protein can be viewed as an elastic network. They are the Gaussian network model (GNM) (19, 20) and the anisotropic network model (ANM) (21, 22). GNM was initially developed to determine the isotropic thermal fluctuations of amino acid residues based on Cα positions. It employs a highly simplified, but efficient, potential function (19),
 |
2 |
Here, γ is the single parameter of force constant, Δr is positional fluctuation vector, and Γ is a symmetric matrix known as Kirchhoff matrix in graph theory (23) that describes the geometric connectivity. The elements of Γ are given by
 |
3 |
Here, rc is the cutoff distance defining the range of interaction, rij is the distance between the ith and the jth Cα atoms. A good value of cutoff used in literature is about 7.0 Å, which takes into account the first coordination shell (20). The equilibrium correlation between fluctuations Δri and Δrj of two Cα atoms in GNM is given by
 |
4 |
where kB is the Boltzmann constant, T is the absolute temperature. For i = j, Eq. 4 gives the mean-square positional fluctuation of the ith atom, 〈(Δri)2〉 = 8/3π2 Bi, where Bi is the isotropic Debye-Waller temperature factor, or thermal B-factor, of the ith atom in x-ray crystallography (1).
The GNM only determines the magnitudes of isotropic fluctuations. In describing the patterns of functionally important deformational motions in proteins, the directionality of the fluctuations is even more important. This can be achieved by ANM (21), which is essentially the standard NMA (24) based on the simplified harmonic potential function (22),
 |
5 |
where |rij| and |r | are the instantaneous and equilibrium values (or initial values from the coordinates) of pairwise distance between the ith and the jth Cα atoms, respectively. The value of σij is the Heaviside step function that accounts for the cut-off effect of the interaction. This form of potential function is identical to what Tirion used (equation 3 in refs. 22 and 16 in ref. 21). Its functional form resembles that of the common molecular mechanics potential function for chemical bond (25)—i.e., the harmonic potential is proportional to the square of the scalar difference of the instantaneous and the equilibrium lengths of the pair distance. A distinct advantage of ANM is that it treats the initial coordinates as the equilibrium coordinates, therefore it does not require energy minimization as in NMA that could significantly distort structures in some cases.
As in the standard NMA (24), the direction of motion in each deformational mode is provided by a 3N-dimensional eigenvector obtained by diagonalizing the second derivative matrix, H, of the total potential function (Eq. 5; 24) with a matrix transformation,
 |
6 |
where U is an orthogonal matrix whose columns represent the eigenvectors of H and Λ is a diagonal matrix that contains the eigenvalues of H, or force constants of the normal modes. In total, there are 3N-6 intrinsic modes. The correlation between fluctuations has the form
 |
7 |
where λk and Uik are the eigenvalue and the ith component of the eigenvector of the kth mode, respectively. Eq. 7 can also be used to compute the thermal B-factors, and the results are very similar to those computed by Eq. 4. The cut-off distance in ANM, as also shown in the literature (21), is about 12–15 Å, which includes the effects of the first and second coordination shells.
Determining the Motions from a Low-Resolution Electron-Density Map by QEDM.
The original GNM (19, 20) and ANM (21, 22) determine the protein flexibility based on the positions of Cα atoms, or a portion of them (26). Therefore, they still reply on the knowledge of atomic coordinates. In this study, QEDM is developed by extending these two existing methods, together with the VQ method, to compute the protein dynamics from the low-resolution electron density map of a protein with no atomic coordinates available. The VQ method simply provides a means to numerically discretize the 3D continuous object, in this case the electron-density map of a biological molecule, into a set of Voronoi cells that rationally approximate the shape and density distribution of the original object. The number of Voronoi cells can be chosen at will for a proper characterization of the density map. For a pure protein system, a number larger than the number of amino acids permits a better representation of the density map—e.g., to discern the relative mass of the main chains and side chains; for a system containing other components such as nucleic acids, the method provides a rational means for representing the density of the nonprotein components.
The general procedure of QEDM for determining the conformational flexibility of a protein based on a low-resolution electron-density map is first to use the VQ method to compute the positions of the centroids of N Voronoi cells, then the amplitudes and directionality of the deformational motions can be determined by the GNM and ANM, respectively. In this study, QEDM is validated by applying it to computing the thermal B-factors and patterns of thermal deformational motions of known protein structures. The results are compared with those obtained based on high-resolution atomic models. For generating low-resolution density maps, the Gaussian kernel convolution technique was employed to blur the density maps (27).
Results
Thermal B-Factors.
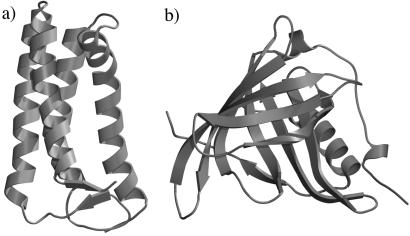
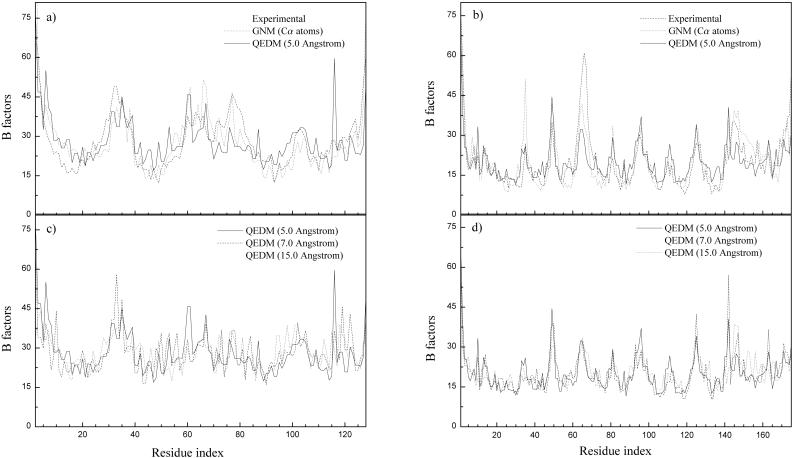
The intrinsic flexibility of a structure is manifested in the thermal B-factors of the atomic coordinates. Therefore, the first validation of QEDM is to use it to compute the thermal B-factors of known protein structures that are then compared with the experimental data. Two proteins are used, an all α-helical protein [cytochrome c′, PDB ID 2CCY (28)] and a predominantly β-sheet protein [retinal-binding protein, PDB ID 1AQB (29); Fig. 1]. They are of medium size and were also used in the original GNM (20) and ANM (21). In Fig. 2 a and b, the crystallographically determined B-factors are plotted together with those computed by GNM based on the known Cα positions (20), and those with QEDM by using the electron-density maps at 5.0 Å resolution. The matching of the peaks and valleys are strikingly good for both proteins. This remarkable result demonstrates that one can indeed determine the amplitudes of thermal motions of a protein without detailed knowledge of amino acid sequence and atomic coordinates. Instead, the thermal amplitudes of conformational motions are mainly determined by the shape, or the mass distribution, of the protein.
Figure 1.
Schematic illustration of the A subunit of 2CCY (a) and 1AQB (b). The figures were made by graphic software Molscript (31) and rendered by RASTER3D (32).
Figure 2.
Comparison of computed and experimental B-factor curves for 2CCY (a and c) for 1AQB (b and d). In a and b, GNM uses the Cα positions, and QEDM uses a 5-Å electron-density map. In c and d, QEDM is applied to electron-density maps of 5 Å, 7 Å, and 15 Å resolution. B-factors on the centroids of Voronoi cells computed at low resolutions by QEDM were mapped onto the Cα atoms based on a distance averaging method—i.e., the average B-factors on the centroids within 1.9 Å (half of the nearest Cα–Cα distance along the polypeptide chain) from a particular Cα atom is assigned to that Cα atom. Every B-factor curve is normalized against the experimental curve by matching the areas underneath the two curves. The cutoff distance was 6.8 Å.
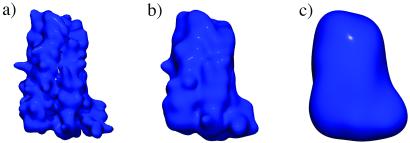
Another important aspect is the resolution insensitivity of the calculated B-factors by QEDM. For illustrative purpose, we calculated the B-factors at three representative resolutions: 5 Å, 7 Å, and 15 Å. The 5-Å resolution is just beyond the limit at which crystallographers can trace the atomic model based on conventional methods. The 7-Å resolution is right below the upper limit of the state-of-the-art cryo-EM technique. Finally, the 15-Å resolution is about the average resolution of most cryo-EM measurements (30). Fig. 2 c and d show the B-factors of the two proteins computed at these resolutions by QEDM. Strikingly, the variations of the peaks and valleys are relatively small—i.e., the B-factors present a high-level insensitivity of the resolution. This result strongly suggests that QEDM is capable of detecting the main features of thermal fluctuations of a protein even at a resolution that there is nearly no visually distinguishable internal structure, other than the gross outline of the molecule (Fig. 3). In fact, the main features of the curve of the thermal B-factors are still identifiable even at resolutions beyond 20 Å (data not shown).
Figure 3.
The electron-density maps of 2CCY at 5 Å, 7 Å, and 15 Å resolution. The maps were generated by the Gaussian kernel convolution method (27). At 15 Å resolution, there is essentially no visually distinguishable internal structural features other than the overall shape of the molecule.
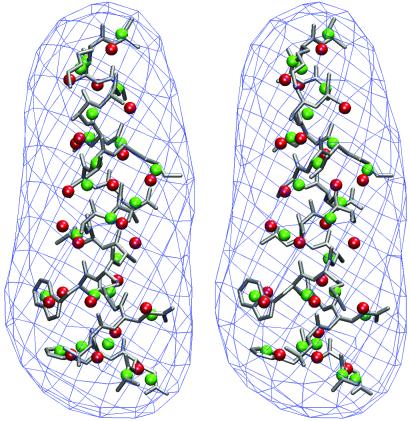
It is important to point out that there is no apparent one-to-one correlation between the positions of the centroids of Voronoi cells and the positions of any particular atoms such as the Cα atoms. The positions of those centroids at different resolutions vary significantly (Fig. 4). However, these variations apparently do not dramatically affect the overall accuracy of the calculated B-factors. The success of QEDM reinforces the fundamental assumption that the native protein structure is densely packed and can be approximated as an elastic object whose patterns of gross deformational motions only depend on the overall shape and mass distribution. Therefore, as long as the distribution of the centroids of the Vonoroi cells reasonably reflects the shape and mass distribution of the protein, one can use them to characterize the thermal motions (see more later).
Figure 4.
Stereo pair for the relative layout between the density map (shown in 15 Å resolution), protein structure (silver), centroids of Voronoi cells at 5 Å resolution (green), and 15 Å resolution (red). For clarity, only the results of one helix on 2CCY are shown. It is evident that the positions of the Voronoi centroids vary with different resolutions.
Although the ability of QEDM to reveal the amplitudes of thermal motions from low-resolution maps is demonstrated in capturing the essential features of the thermal B-factors at various resolutions, for a new protein, there will usually be no apparent ways of mapping the thermal B-factors onto the positions of the Cα atoms. In these cases, however, the concept of structural flexibility can still be approximately conveyed in terms of the regions in the electron density map.
Directionality of the Motions.
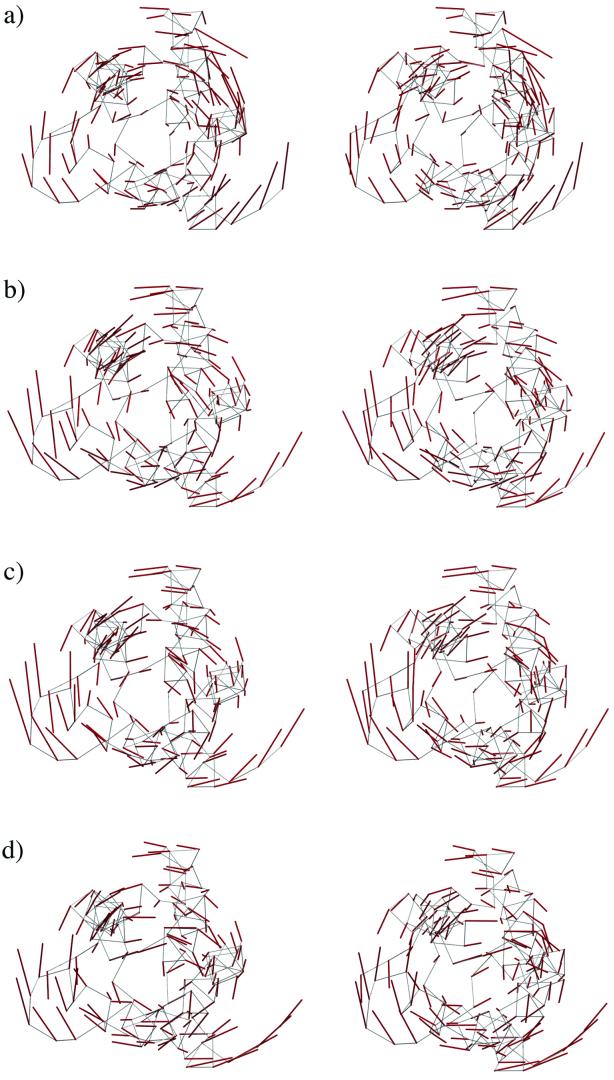
Another important aspect in describing biologically relevant protein motions is the directionality. To demonstrate that QEDM can also reveal the directionality of the thermal deformational motions, we compare the patterns of the lowest-frequency modes determined by the standard NMA (Fig. 5a) with those by QEDM (Fig. 5 b–d) for 2CCY. Again, there is no direct correlation between the centroids of Voronoi cells and the positions of Cα atoms. For illustrative purposes, the components of the displacement vectors on the centroids of Voronoi cells are translated to their nearest Cα atoms. It is very clear that the overall directionality of the lowest-frequency mode, which describes the axial twisting motions around the longest axis of the molecule, is very similar among that from the standard NMA and those from QEDM. A high level of resolution insensitivity is also evident. Similar features were observed in other nearby low-frequency modes (data not shown). These results indicate that the directionality of the deformational motions can indeed be reliably determined by QEDM.
Figure 5.
Stereo pairs for the motional patterns of the lowest-frequency deformational mode determined for 2CCY, by the standard NMA (a) by QEDM at 5 Å resolution (b) by QEDM at 7 Å resolution (c), and by QEDM at 15 Å resolution (d). The calculation was done with a cut-off distance of 13 Å. The thin gray lines are the trace of the Cα atoms and the red thicker lines represent the displacement vectors of the deformational mode. For illustrative purpose, the components of the displacement vectors on the centroids of Voronoi cells are translated to their nearest Cα atoms. The slight distortion of the trace of the Cα atom in a is the result of energy minimization, which is a weakness of the standard NMA.
Again, when dealing with an electron-density map of a new protein structure with no atomic model available, even though it is impossible to map the displacement vectors onto the Cα atoms as in Fig. 5, the displacement vector field representation on the centroids of Voronoi cells can still clearly illustrate the sense of the directionality.
The slight distortion of the trace of the Cα atom in Fig. 5a is the result of the initial energy minimization, which is a weakness of the standard NMA. The current method treats the initial coordinates as the equilibrium configuration and does not require the energy minimization. This feature is particularly advantageous when dealing with systems containing a large number of ionic groups, such as titratable residues in proteins or phosphate backbone in nucleic acids, for which vacuum energy minimization often leads to severe distortion of the structures.
The Number of Voronoi Cells.
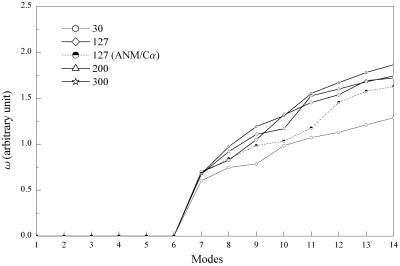
An important issue in QEDM is the selection of the number of Voronoi cells N. In all the cases discussed so far, N was chosen to be the number of amino acids, which is the most natural way of selection, and QEDM worked remarkably well. However, the number of the Voronoi cells does not have to be the same as the amino acids. The ANM study (26) showed that significant features of motion can still be captured when a smaller portion of Cα positions in the system is used in the calculation. The effect of the value of N was investigated by calculating the values of frequency of several lowest-frequency modes with N chosen to be nearly a quarter, twice, and three times as large as the number of amino acids (Fig. 6). There is essentially no qualitative variation when N is the same as, or larger than, the number of amino acids, but significant deviation occurs when N is smaller. Therefore, the number should be large enough to represent the shape and mass distribution of the protein. Also interesting is the difference between the ANM results based on the Cα atoms and the QEDM results when using an equal number of cells (127 in this case; Fig. 6). The deviation of the frequencies might be explained by the fact that the position of Cα is not the center of mass of an amino acid; therefore, QEDM gives somewhat more converged results.
Figure 6.
The sensitivity of the frequencies of the lowest-frequency deformational modes with respect to the number of Voronoi cells (indicated at the upper-left corner). The calculations of QEDM were done with a 5-Å-resolution map of 2CCY. The protein contains 127 amino acids. The cut-off distance was 13 Å for the 127 cases and others were scaled by relation Rcut ∝ N−γ3 so as to keep the coordination number the same. Correspondingly, the values of the force constant γ in Eq. 5 were determined by fitting the B–factor curves against the experimental data. The harmonic frequencies were determined by relation ω ∝ (λN) , here the factor accounting for the total mass of the protein is omitted so that the frequencies are in arbitrary unit. The frequencies are highly invariable in the cases that the numbers of Voronoi cells are larger than that of the amino acids, but significant deviation occurs for a smaller number (30 cells). Some discrepancy is also observed between the results of QEDM with 127 cells and ANM based on the Cα positions. The deviations of the frequencies in higher–frequency modes are much larger.
The relative insensitivity of QEDM calculations to the number of Voronoi cells is an extremely important advantage in handling new protein structures with only low-resolution electron-density maps available. In many cases, the boundaries of different protein segments in a complex are not well defined, or even worse, the correct locations of the polypeptide chains are not identified. Therefore, no primary sequence information can be utilized to assign the number of Voronoi cells. Moreover, the insensitivity also provides a reliable means for handling macromolecular complexes that carry nonprotein components—e.g., nucleic acids or sizable substrates.
Concluding Discussion
This paper reports a computational method, QEDM, that can determine the amplitudes and directionality of protein thermal fluctuations, or elastic deformations, without the knowledge of amino acid sequence and atomic coordinates. The essence of QEDM lies in the fact that, in determining the functionally important deformations, it is possible to abandon the traditional concepts of protein structure (bonds, angles, dihedrals, etc.) and treat the protein as an elastic object whose shape and mass distributions are described by the electron-density map at various resolutions. Then, the vector quantization technique can be used to rationally discretize the density map into a set of Voronoi cells, the number of which should be large enough to effectively represent the shape and mass distribution of the protein. With the positions of the centroids of Voronoi cells in hand, GNM and ANM can be employed to determine the amplitudes and directionality of the elastic deformational motions of the molecule. The gross motional features obtained by QEDM using low-resolution maps are fairly consistent with those determined by other methods based on high-resolution atomic models.
QEDM is fast and relatively not computer-resource demanding compared with the standard NMA so that it allows the study of the motional patterns of supermolecular complexes. It can deliver reliable description of protein dynamics in a wide range of resolutions even as low as 15–20 Å. This result also suggests that a significant portion of motional information of a protein structure is already contained in the electron density map of 15–20 Å resolution and QEDM provides a means to effectively extract that information.
In short, QEDM dramatically enhances the capability of studying the dynamics of proteins in structural biology. It is also expected to have wide applications in the fields of bioinformatics, structural genomics, and proteomics, in which one's ability to extract functional information from not-so-well-defined structural models is vitally important.
Acknowledgments
J.M. acknowledges support from the American Heart Association, the Robert A. Welch Foundation, the American Cancer Society, and the National Science Foundation.
Abbreviations
- QEDM
quantized elastic deformational model
- VQ
vector quantization
- GNM
Gaussian network model
- ANM
anisotropic network model
- NMA
normal mode analysis
- cryo-EM
cryo-electron microscopy
Note Added in Proof.
After the submission of this manuscript, the authors learned that a group of scientists at the Scripps Research Institutes was developing a similar approach (Charles L. Brooks III, personal communication).
Footnotes
This paper was submitted directly (Track II) to the PNAS office.
References
- 1.Brooks C L, III, Karplus M, Pettitt B M. Adv Chem Phys. 1988;71:1–249. [Google Scholar]
- 2.McCammon J A, Harvey S. Dynamics of Proteins and Nucleic Acids. Cambridge, U.K.: Cambridge University Press; 1987. [Google Scholar]
- 3.Gerstein M, Lesk A M, Chothia C. Biochemistry. 1994;33:6739–6749. doi: 10.1021/bi00188a001. [DOI] [PubMed] [Google Scholar]
- 4.Ma J, Sigler P B, Xu Z, Karplus M. J Mol Biol. 2000;302:303–313. doi: 10.1006/jmbi.2000.4014. [DOI] [PubMed] [Google Scholar]
- 5.Ma J, Karplus M. Proc Natl Acad Sci USA. 1998;95:8502–8507. doi: 10.1073/pnas.95.15.8502. [DOI] [PMC free article] [PubMed] [Google Scholar]
- 6.Ma J, Karplus M. J Mol Biol. 1997;274:114–131. doi: 10.1006/jmbi.1997.1313. [DOI] [PubMed] [Google Scholar]
- 7.Thomas A, Field M J, Perahia D. J Mol Biol. 1996;261:490–506. doi: 10.1006/jmbi.1996.0478. [DOI] [PubMed] [Google Scholar]
- 8.Thomas A, Field M J, Mouawad L, Perahia D. J Mol Biol. 1996;257:1070–1087. doi: 10.1006/jmbi.1996.0224. [DOI] [PubMed] [Google Scholar]
- 9.Thomas A, Hinsen K, Field M J, Perahia D. Proteins. 1999;34:96–112. doi: 10.1002/(sici)1097-0134(19990101)34:1<96::aid-prot8>3.0.co;2-0. [DOI] [PubMed] [Google Scholar]
- 10.Shen Y, Kong Y, Ma J. Proc Natl Acad Sci USA. 2002;99:1949–1953. doi: 10.1073/pnas.042650399. [DOI] [PMC free article] [PubMed] [Google Scholar]
- 11.Tama F, Sanejouand Y H. Protein Eng. 2001;14:1–6. doi: 10.1093/protein/14.1.1. [DOI] [PubMed] [Google Scholar]
- 12.Marques O, Sanejouand Y H. Proteins. 1995;23:557–560. doi: 10.1002/prot.340230410. [DOI] [PubMed] [Google Scholar]
- 13.Halle B. Proc Natl Acad Sci USA. 2002;99:1274–1279. doi: 10.1073/pnas.032522499. [DOI] [PMC free article] [PubMed] [Google Scholar]
- 14.Gray R M. IEEE ASSP Mag. 1984;1:4–29. [Google Scholar]
- 15.Makhoul J, Roucos S, Gish H. Proc IEEE. 1985;73:1551–1588. [Google Scholar]
- 16.Wriggers W, Agrawal R K, Drew D L, McCammon A, Frank J. Biophys J. 2000;79:1670–1678. doi: 10.1016/S0006-3495(00)76416-2. [DOI] [PMC free article] [PubMed] [Google Scholar]
- 17.Martinetz T M, Berkovich S G, Schulten K J. IEEE Trans Neural Networks. 1993;4:558–569. doi: 10.1109/72.238311. [DOI] [PubMed] [Google Scholar]
- 18.Wriggers W, Milligan R A, Schulten K, McCammon J A. J Mol Biol. 1998;284:1247–1254. doi: 10.1006/jmbi.1998.2232. [DOI] [PubMed] [Google Scholar]
- 19.Haliloglu T, Bahar I, Erman B. Phys Rev Lett. 1997;79:3090–3093. [Google Scholar]
- 20.Bahar I, Atilgan A R, Erman B. Fold Des. 1997;2:173–181. doi: 10.1016/S1359-0278(97)00024-2. [DOI] [PubMed] [Google Scholar]
- 21.Atilgan A R, Durell S R, Jernigan R L, Demirel M C, Keskin O, Bahar I. Biophys J. 2001;80:505–515. doi: 10.1016/S0006-3495(01)76033-X. [DOI] [PMC free article] [PubMed] [Google Scholar]
- 22.Tirion M M. Phys Rev Lett. 1996;77:1905–1908. doi: 10.1103/PhysRevLett.77.1905. [DOI] [PubMed] [Google Scholar]
- 23.Harary F. Graph Theory. Reading, MA: Addison–Wesley; 1971. [Google Scholar]
- 24.Brooks B R, Janezic D, Karplus M. J Comput Chem. 1995;16:1522–1542. [Google Scholar]
- 25.MacKerell A D, Bashford D, Jr, Bellott M, Dunbrack R L, Jr, Evanseck J D, Field M J, Fischer S, Gao J, Guo H, Ha S, et al. J Phys Chem. 1998;B102:3586–3616. doi: 10.1021/jp973084f. [DOI] [PubMed] [Google Scholar]
- 26.Doruker P, Jernigan R L, Bahar I. J Comput Chem. 2002;23:119–127. doi: 10.1002/jcc.1160. [DOI] [PubMed] [Google Scholar]
- 27.Wriggers W, Milligan R A, McCammon J A. J Struct Biol. 1999;125:185–195. doi: 10.1006/jsbi.1998.4080. [DOI] [PubMed] [Google Scholar]
- 28.Finzel B C, Weber P C, Hardman K D, Salemme F R. J Mol Biol. 1985;186:627–643. doi: 10.1016/0022-2836(85)90135-4. [DOI] [PubMed] [Google Scholar]
- 29.Zanotti G, Panzalorto M, Marcato A, Malpeli G, Folli C, Berni R. Acta Crystallogr D. 1998;54:1049–1052. doi: 10.1107/s0907444998002303. [DOI] [PubMed] [Google Scholar]
- 30.Zhou Z H, Baker M L, Jiang W, Dougherty M, Jakana J, Dong G, Lu G, Chiu W. Nat Struct Biol. 2001;8:868–73. doi: 10.1038/nsb1001-868. [DOI] [PubMed] [Google Scholar]
- 31.Kraulis P J. J Appl Crystallogr. 1991;24:946–950. [Google Scholar]
- 32.Bacon D J, Anderson W F. J Mol Graphics. 1988;6:219–220. [Google Scholar]


