

Abstract
PF-5190457 is a selective and potent ghrelin receptor inverse agonist presently undergoing clinical trials to treat alcohol use disorder (AUD). We describe the development and validation of a selective and sensitive liquid chromatography-tandem mass spectrometry-based method for quantification of PF-5190457 and its recently discovered hydroxy metabolite PF-6870961 in human plasma. Analytes were extracted after simple protein precipitation using methanol (2.5 ng mL−1 tacrine as an internal standard). A gradient liquid chromatography method was used to separate the analytes on an Acquity UPLC BEH C18 analytical column. The separation was achieved at a flow rate of 0.25 mL min−1 and the total chromatographic runtime was 11.30 min. Positive electrospray ionization and multiple reaction monitoring mode were used for the quantification of all the analytes. The calibration curves from six validation runs were linear with a correlation coefficient of ≥0.996 for the concentration range of 1–1000 ng mL−1 and 2–250 ng mL−1 for PF-5190457 and PF-6870961, respectively. The retention time for PF-5190457, PF-6870961 and tacrine were 4.4, 3.8, and 4.6 min, respectively. The lower limit of quantification for PF-5190457 and PF-6870961 was 1 and 2 ng mL−1, respectively. The inter-assay precision and accuracy results obtained were within the Food and Drug Administration recommended ± 15% limit of nominal values. All the analytes were found to be stable under varied stability conditions. The recovery of PF-5190457 and PF-6870961 ranged from 95 to 103%. Further, the application of the method was demonstrated by measuring the concentration of PF-5190457 and its hydroxy metabolite in patient plasma samples from 100 mg dose.
Keywords: PF-5190457, Alcoholism, Ghrelin, Hydroxy metabolite, LC-MS/MS, Pharmacokinetics
1. Introduction
Alcohol consumption is frequent in the United States with a significant increase in the prevalence of alcohol use in the last 10 years [1]. From a clinical standpoint, AUD is characterized by distress, compulsive alcohol intake, and inability to control alcohol use [2]. The US economic burden of alcohol misuse and associated diseases is estimated to be around $250 billion [3]. Heavy alcohol consumption may also accelerate the progression of scarring and fibrosis in patients with NAFLD leading to the risk of hepatocellular carcinoma [4]. Patients with alcoholic and non-alcoholic fatty liver have also been associated with alteration of drug metabolizing enzymes in human liver [5,6]. Recent decade has seen a continuous research effort for discovery and development of therapeutic agents with the potential to ameliorate AUD [7,8].
PF-5190457, a novel peripherally acting inverse agonist of the growth hormone secretagogue receptor 1a (GHS-R1a), also known as ghrelin receptor, and a member of spiro-azetidine-piperidine series, was discovered by Pfizer Inc. [9,10]. Ghrelin, a peptide released by endocrine cells localized primarily in the stomach, is the endogenous ligand for GHS-R1a and regulates appetite, meal initiation, and food intake [11–13]. Antagonists of the ghrelin receptor have been explored for their therapeutic potential in the treatment of type 2 diabetes mellitus, eating disorders, obesity, and alcohol use disorder. Such antagonists have the potential to stimulate glucose-dependent insulin secretion, reduce food intake, and reduce the craving for alcohol consumption [14–20]. PF-5190457 is currently undergoing clinical trials for the treatment for alcohol use disorder [16,21,22].
Our lab has previously reported the validation of a UPLC-MS/MS method for PF-5190457 [21]. However, a primary metabolite, PF-6870961 of the drug was recently discovered in human plasma [23]. Here, we describe an ultra-performance liquid chromatography-tandem mass spectroscopy (UPLC-MS/MS) assay for simultaneous determination of PF-5190457 and its hydroxy metabolite (PF-6870961) in human plasma using tacrine as an internal standard (IS).
2. Materials and methods
2.1. Chemicals and reagents
PF-5190457 and tacrine were obtained from Sigma-Aldrich (St. Louis, MO). PF-6870961 (hydroxy metabolite) was provided by Pfizer Inc. under a confidentiality agreement with The University of Rhode Island (Pfizer Inc., Groton, CT). LC-MS grade methanol and formic acid were obtained from Fisher Scientific (Fair Lawn, NJ). Blank K2EDTA human plasma from six subjects (three males, three females) was obtained from Bioreclamation IVT (Westbury, NY).
2.2. LC-MS/MS analysis
LC-MS/MS analysis was performed on an Acquity UPLC® system coupled with Xevo® TQ MS detector (Waters Corp, Milford, MA, USA). MassLynx™ Software (V 4.1) and TargetLynx™ (V 4.1) were used for data processing. Chromatography separation of analytes and IS was accomplished with a run time of 11.30 min using a gradient elution method. Analytes were resolved on an Acquity UPLC BEH C18 (2.1 × 50 mm, 1.7 μm particle size, 130Å pore size) analytical column equipped with an Acquity UPLC BEH C18 VanGuard pre-column (2.1 × 5 mm, 130 Å). Mobile phase consisted of water: methanol 95:5% (v/v) with 0.1% formic acid (A) and 100% methanol with 0.1% formic acid (B). The column and autosampler temperature were kept at 40 °C and 10 °C, respectively. The mobile phase was delivered at 0.25 mL min−1 flow rate, and the injection volume was 5 μL. The initial conditions of the mobile phase (98% A, 2% B) were maintained for 2 min, B was increased from 2% to 80% over 8.30 min, and held till 9.30 min before being returned to initial conditions, followed by a 2 min equilibration for a total run time of 11.30 min.
Mass spectral analysis and quantification were carried out using multiple reaction monitoring (MRM) in positive electrospray ionization mode with the following parameters: desolvation temperature 350 °C, desolvation gas flow 650 L h−1, capillary voltage 3.50 kV and cone voltage 20 V. The fragmentation pattern for PF-5190457 and IS were similar to previously reported methods [21,24,25]. The optimized settings of mass spectrometer voltage, precursor and fragment m/z and the retention time for analytes and internal standard are summarized in Table 1.
Table 1.
Mass spectrometry parameters for analytes and internal standard.
| Compounds | Precursor (m/z) | Fragment (m/z) | Dwell time (s) | Cone voltage (V) | Collision energy (V) | Retention time (min) |
|---|---|---|---|---|---|---|
|
| ||||||
| PF-5190457 | 513 | 209, 335 | 0.025 | 30, 30 | 44, 16 | 4.4 |
| Hydroxy metabolite (PF-6870961) | 529 | 225, 351 | 0.025 | 34, 32 | 40, 20 | 3.8 |
| Tacrine | 199 | 170, 143 | 0.025 | 46, 42 | 30, 36 | 4.6 |
2.3. Preparation of solutions
Sub-stock solutions of PF-5190457 and PF-6870961 were separately prepared in 50% methanol to obtain a final concentration of 10 μg/mL and were stored at 4 °C. Working stock solutions for calibration and quality controls were prepared from the stock solution by adequate dilution using diluent (methanol: water, 50:50, v/v). The calibration standards and quality control samples were prepared by spiking an appropriate amount of the standard working solutions into pooled K2EDTA human plasma with an organic solvent concentration < 5% of the final volume. An eight-point calibration curve with concentrations ranging from 1–1000 ng mL−1 and 2–250 ng mL−1 for PF-5190457 and PF-6870961 were prepared respectively. Low, middle, and high-level QC samples were prepared for PF-5190457 (3, 200 and 750 ng/ml) and PF-6870961 (5, 25 and 200 ng/ml). A final working solution of 2.5 ng/mL tacrine (IS) in methanol was used as a precipitating solution.
2.4. Extraction of analytes from plasma
Samples were prepared by a simple protein precipitation method. Two-hundred μL of precipitating solution containing IS was added to 50 μL of plasma. Samples spiked with analytes were extracted with methanol containing IS whereas, the double blank was extracted in 100% methanol without any IS. The mixture was vortex mixed for 15 s and further centrifuged at 10,000 rpm for 5 min at 10 °C. The supernatant was collected and used for further analysis using LC-MS/MS method as described above.
2.5. Method validation
The validation of this assay was performed according to the requirements as outlined in guidelines established by the United States Food and Drug Administration (US FDA). The method was evaluated for selectivity, sensitivity, linearity, accuracy, precision, recovery, matrix effect, recovery, and stability of analytes [26].
2.5.1. Specificity and sensitivity
The method specificity was evaluated before the main validation batches for the presence of interference from endogenous compounds by screening blank plasma of six donors. The sensitivity of the assay was evaluated by analyzing blank plasma samples from six different donors and spiked plasma samples at the lower limit of quantification (LLOQ) levels of the analytes.
2.5.2. Linearity, accuracy, and precision
The linearity of the method was determined by analysis of standard plots associated with an eight-point calibration curve. Inter-assay precision and accuracy were calculated from the replicates in six different analytical runs. Peak area ratios of analytes to IS obtained from MRM were utilized for the construction of calibration curves, using least squares weighted (1/x) linear regression. Autosampler carry-over test was assessed to demonstrate any carryover of analytes and IS.
2.5.3. Matrix effect and recovery
The components present in the matrix (i.e., extracted from plasma) can interfere with ionization efficiency by coeluting with analytes of interest [27]. Matrix effect for ion suppression and enhancement was assessed using blank and spiked human plasma using post-column infusion experiment as described previously [21,28]. The chromatograms were visually evaluated to verify for any interfering peaks at the elution time of analytes and IS. Likewise, the interference of phospholipids was determined since these are highly abundant endogenous compounds in biological membranes and can interfere with the elution of analytes [29,30]. Phospholipids were monitored by measuring the precursor ion (Q1) m/z 496, 522, 524, 758 and 782 and their product ion (Q3) m/z 184 [31,32]. Recovery was determined at two concentration levels (LQC and HQC) by comparing the peak area of the analytes from the pre-extracted plasma standard with that obtained from the post-extracted standard at the same concentration for the QC samples.
2.5.4. Stability
Stability of analytes was evaluated at two concentrations (LQC and HQC). Freeze-thaw stability (three cycles), benchtop stability (6 h on lab-bench), and short-term stability (1-week at −80 °C) were assessed as a part of method validation. The autosampler storage stability was determined by storing the QC samples for ~48 h under autosampler condition (10 °C) before being analyzed.
2.5.5. Method application
The results from the previously validated UPLC-MS/MS method for the determination of PF-5190457 in patient plasma samples (n = 45) were correlated with the current method to test the assay quality of current method [21]. We used plasma samples collected at 0, 0.25, 0.5, 0.75, 1, 1.5, 2, 2.5, 3, 3.5, 4, 6, 8, 22.5 and 24 h after oral administration of 100 mg PF-5190457 from a phase 1b clinical study with heavy drinkers who also had a diagnosis (except one) of alcohol dependence. The study was conducted at the National Institutes of Health Clinical Center (Bethesda, MD, USA). All required regulatory approvals were obtained, and all participants signed a written consent document before research procedures began (NCT02039349). The main results of this clinical study have been reported elsewhere; please see Lee et al. [22]. Incurred sample reanalysis (ISR) was performed to corroborate the results utilizing clinical samples. Samples (10% of the study size) around Cmax and terminal elimination phase were selected, reanalyzed, and compared to the initial results obtained from clinical samples (described below). Samples were extracted as described above. The results of the repeated analysis were compared with original data, according to the following formula: (repeated sample − original sample) × 100/mean value. Two-thirds of the samples reanalyzed should be within ± 20% between the two analyses [33].
3. Results and discussion
3.1. LC-MS/MS assay performance
The goal of this work was to develop and validate a sensitive and straightforward assay method for the simultaneous determination of PF-5190457 and its hydroxy metabolite (PF-6870961) in human plasma. The MS optimization was performed by direct infusion of solutions of PF-5190457, PF-6870961, and IS into the ESI source of the mass spectrometer. The best signal for both the analytes and IS was achieved using a positive ion mode. Protonated adducts for PF-5190457 (m/z 513) and PF-6870961 (m/z 529) and their respective high-intensity fragments (m/z 209 and m/z 225, respectively) were selected for quantification.
Several iterations of chromatographic conditions were performed to select an optimal mobile phase and analytical C18 columns. As the metabolite was found to be unstable in acetonitrile, we used methanol as an organic additive to separate the metabolites in this method. While the previously published method for quantification of parent had a run time of 2.2 min, we found difficulties in adequate separation of metabolites using a shorter method. During subsequent trials, we found that a longer method provided good separation of major metabolite from the minor metabolites observed in human plasma. These trials determined that the present method achieve an optimal degree of chromatographic separation for simultaneous separation of the major metabolite as well as the parent drug.
3.2. Sample preparation optimization
A simple protein precipitation technique was utilized for the extraction of analytes from the plasma samples. Acetonitrile and methanol were investigated for the extraction of analytes from plasma. We found that the PF-5190457 metabolites were unstable in acetonitrile. Therefore, methanol was chosen as the organic solvent for the preparation of the stock solution for the analytes and IS as well as only methanol was used in the mobile phase.
3.3. Selection of internal standard
The stable isotopic labeled IS was not available for the hydroxy metabolite, and therefore we have demonstrated the suitability of readily available, cost-effective compounds with no evidence of crosstalk with the analytes of interest in the current assay. Various compounds with similar logP and pKa to that of analytes including indoprofen, chlorzoxazone, naproxen, tacrine, and rifampicin were tested for selection of suitable IS for the assay (data not shown). We used tacrine after initial experiments where we found suppression of the parent and deuterated IS as the concentration of metabolite increased. We found that tacrine gave a stable signal which was not suppressed by any of the analytes and used it for subsequent method validation. Additionally, tacrine ionizes in the positive electrospray and elutes in the vicinity of the analytes.
3.4. Method validation
3.4.1. Specificity and selectivity
The determination of PF-5190457, PF-6870961, and IS at their respective retention time were not affected by interference from co-extracted matrix components under the present LC-MS/MS conditions. There was no interference observed from endogenous compounds in blank plasma obtained from six different donors. The representative extracted ion chromatograms of the analytes and the IS in human plasma are given in Fig. 1(a–c).
Fig. 1.
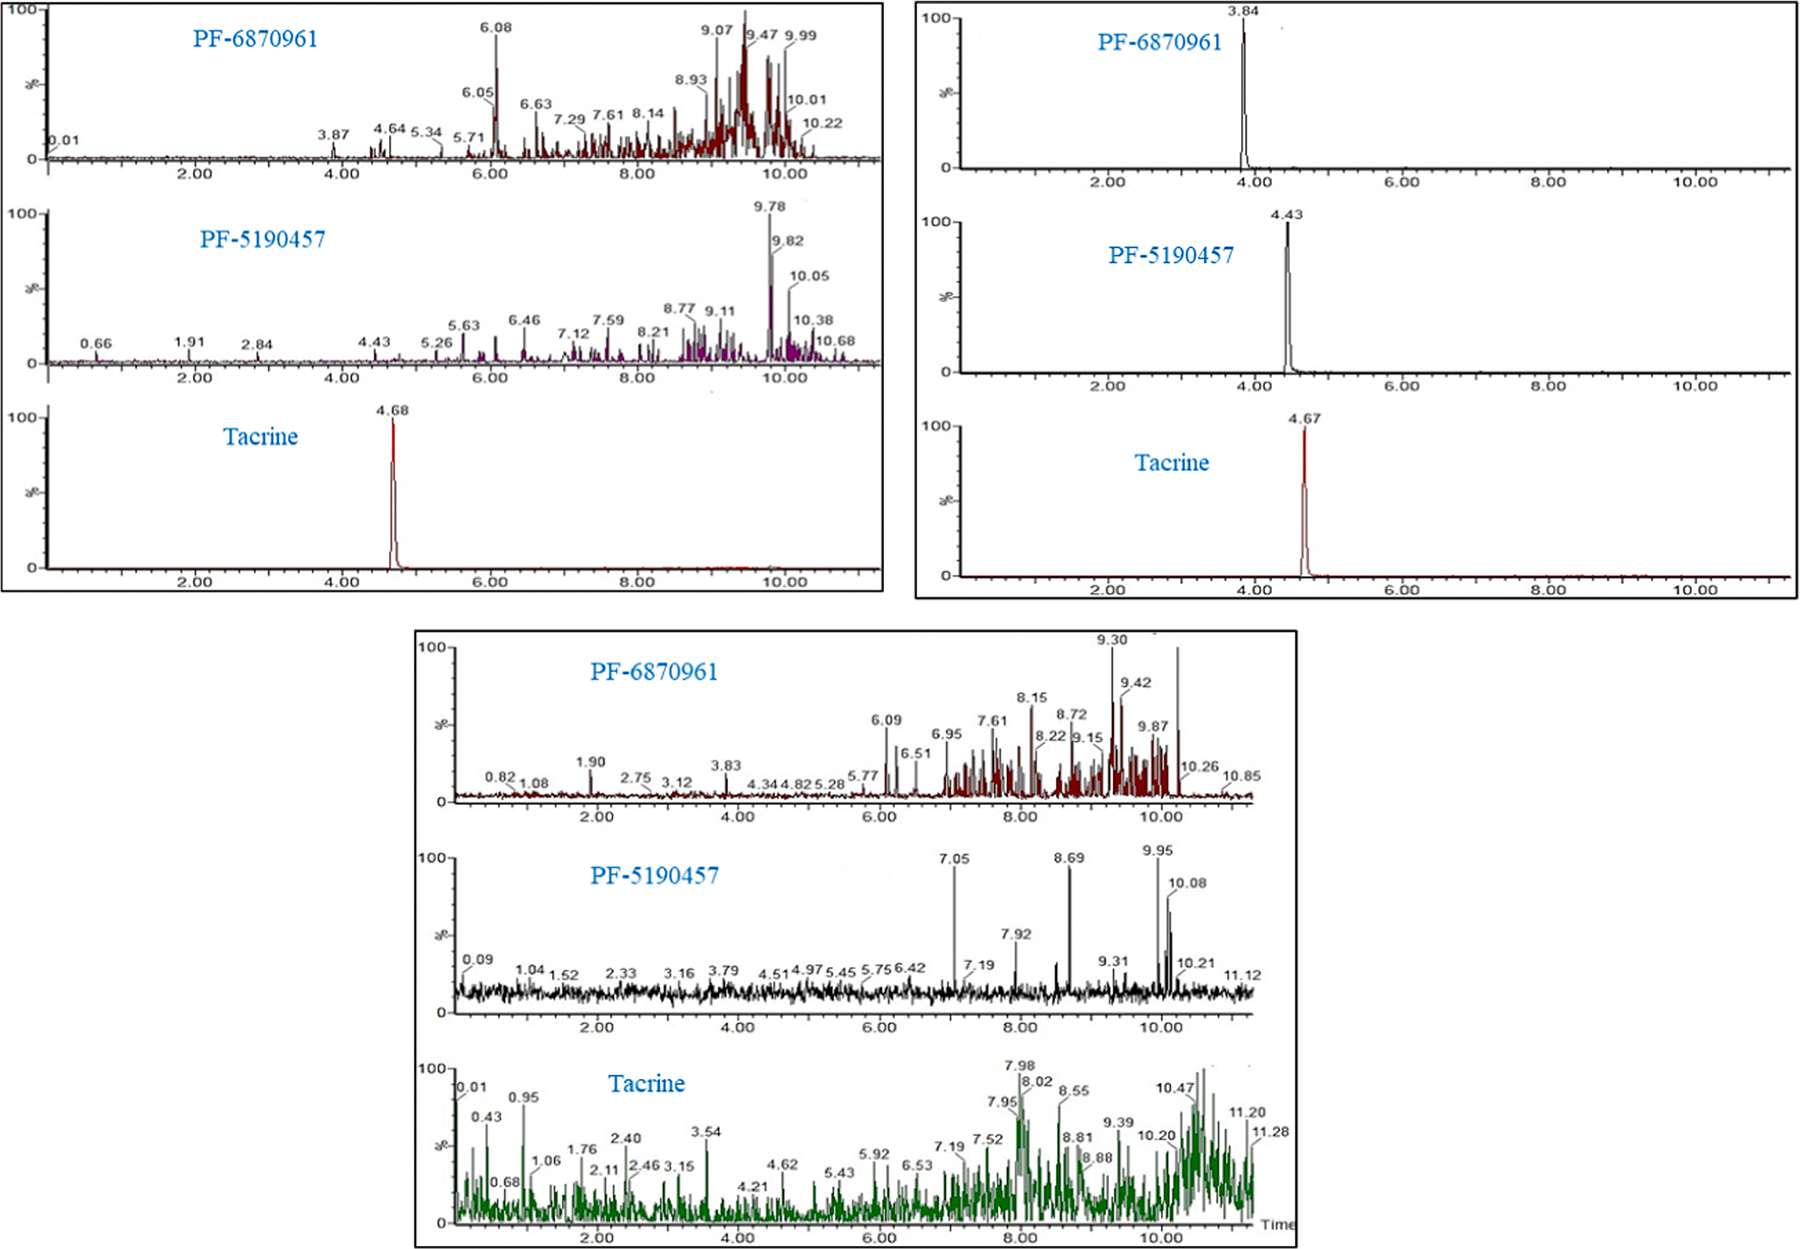
Representative chromatograms of (a) plasma sample extracted with IS (b) plasma sample spiked at the lower limit of quantification for PF-5190457 and its hydroxy metabolite and extracted with 2.5 ng/mL of tacrine and (c) drug-free plasma sample.
3.4.2. Linearity, precision, and accuracy
Calibration was found to be linear over the concentration range of 1–1000 ng mL−1 for PF-5190457 and 2–250 ng ml−1 for PF-6870961. The curve was fitted with linear regression using 1/x weighing function (Table 2). The correlation coefficients (r2) based on linear regression for both the analytes was > 0.996. Precision and accuracy for this method were controlled by calculating the inter-batch variations of LLOQ and QC samples at four concentrations for PF-5190457 (1, 3, 200 and 750 ng/mL) and PF-6870961 (2, 5, 25 and 200 ng/mL) as shown in Table 3. The inter-day precision of 2.4–7.4% for PF-5190457 and 3.6–6% for PF-6870961. This method demonstrated inter-day accuracy 88.0–104.2% for PF-5190457 and 97.2–109.7% for PF-6870961. There was no between-sample carryover detected following the double blank injections.
Table 2.
Summary of calibration standards from six validation runs.
| Analyte | STD 1 | STD 2 | STD 3 | STD 4 | STD 5 | STD 6 | STD 7 | STD 8 | r2 | |
|---|---|---|---|---|---|---|---|---|---|---|
|
| ||||||||||
| PF-5190457 | Nominal conc. (ng mL−1) | 1 | 2 | 10 | 100 | 250 | 500 | 800 | 1000 | |
| Mean conc. (ng mL−1) | 1.0 | 1.9 | 11.2 | 108.8 | 266.8 | 521.2 | 822.3 | 936.4 | 0.99 | |
| SD | 0.0 | 0.2 | 0.4 | 3.8 | 8.4 | 10.2 | 20.5 | 20.3 | ||
| %Bias | 0.9 | −4.8 | 12.0 | 8.8 | 6.7 | 4.2 | 2.8 | −6.4 | ||
| CV | 3.9 | 8.2 | 3.7 | 3.5 | 3.2 | 2.0 | 2.5 | 2.2 | ||
| %Accuracy | 99.1 | 104.8 | 88.0 | 91.2 | 93.3 | 95.8 | 97.2 | 106.4 | ||
| Analyte | STD 1 | STD 2 | STD 3 | STD 4 | STD 5 | STD 6 | STD 7 | STD 8 | r2 | |
|
| ||||||||||
| Hydroxy metabolite (PF-6870961) | Nominal conc. (ng mL−1) | 2.0 | 3.9 | 7.8 | 15.6 | 31.5 | 62.5 | 125.0 | 250.0 | |
| Mean conc. (ng mL−1) | 2.1 | 3.4 | 6.9 | 13.5 | 28.3 | 58.4 | 127.6 | 256.7 | 0.99 | |
| SD | 0.1 | 0.1 | 0.8 | 0.8 | 0.9 | 3.4 | 1.6 | 2.4 | ||
| %Bias | 3.4 | −12.9 | −11.7 | −13.2 | −10.1 | −6.6 | 2.1 | 2.7 | ||
| %CV | 5.8 | 2.5 | 12.2 | 5.8 | 3.0 | 5.7 | 1.2 | 0.9 | ||
| %Accuracy | 96.6 | 112.9 | 111.7 | 111.6 | 110.1 | 106.6 | 97.9 | 97.3 | ||
n = 6 (one replicate for each of the six validation runs), %Accuracy = 100 − [(mean − nominal)/nominal] * 100, %CV calculated as (SD/mean) * 100, % bias = 100 × (mean − nominal)/nominal.
Table 3.
Precision and accuracy analysis from six validation runs.
| LLOQ | LQC | MQC | HQC | ||
|---|---|---|---|---|---|
|
| |||||
| PF-5190457 | Nominal conc. (ng/mL−1) | 1.0 | 3.0 | 200.0 | 750.0 |
| Inter-run mean | 1.0 | 2.9 | 224.0 | 776.6 | |
| Inter-run SD | 0.1 | 0.2 | 5.3 | 28.3 | |
| Inter-run %bias | 4.9 | −4.2 | 12.0 | 3.5 | |
| Inter-run CV | 11.4 | 7.6 | 2.4 | 3.6 | |
| % Accuracy | 95.1 | 104.2 | 88.0 | 96.5 | |
| LLOQ | LQC | MQC | HQC | ||
|
| |||||
| Hydroxy metabolite (PF-6870961) | Nominal conc. (ng/mL−1) | 2.0 | 5.0 | 25.0 | 200.0 |
| Inter-run mean | 2.0 | 4.9 | 22.6 | 205.5 | |
| Inter-run SD | 0.1 | 0.2 | 0.8 | 9.8 | |
| Inter-run %bias | 2.1 | −2.6 | −9.7 | 2.8 | |
| Inter-run CV | 6.0 | 4.7 | 3.6 | 4.8 | |
| % Accuracy | 97.9 | 102.6 | 109.7 | 97.2 | |
n = 18 (three replicates for each of the six validation runs), %Accuracy = 100 − [(mean − nominal)/nominal] * 100, %CV calculated as (SD/mean) * 100, %bias = 100 × (mean − nominal)/nominal.
3.4.3. Matrix effect and recovery
The determination of PF-5190457 and PF-6870961 was not affected by any co-extracted matrix components under the LC-MS/MS conditions used (Supplementary Fig. 1). There was no interference from the phospholipids at a retention time of elution of analytes (Supplementary Fig. 2). The percent mean recovery for PF-5190457 and PF-6870961 ranged from 95 to 103%.
3.4.4. Stability
The data representing the stability of analytes in plasma at two concentration levels (LQC and HQC) is given in Table 4. These results indicate that the analytes are stable in human plasma as the mean of the results of the tested samples were within the acceptance criteria of ± 15% of the nominal concentrations. These findings suggest no stability-related problems would be expected during usual circumstances of a pharmacokinetic sample collection and quantification of drug or metabolite concentrations.
Table 4.
Summary of stability studies.
| Bench top (6 h) | Freeze thaw (3 cycles) | Autosampler (48 h) | Short-term (1 week) | ||||||
|---|---|---|---|---|---|---|---|---|---|
|
|
|
|
|
||||||
| LQC | HQC | LQC | HQC | LQC | HQC | LQC | HQC | ||
|
| |||||||||
| PF-5190457 | Nominal conc. (ng/mL−1) | 3.0 | 750 | 3.0 | 750 | 3.0 | 750 | 3.0 | 750 |
| Mean conc. (ng/mL−1) | 3.0 | 795.0 | 2.7 | 782.2 | 2.8 | 759.1 | 3.0 | 759.3 | |
| % Bias | 0.3 | 6.0 | −9.4 | 4.3 | −5.3 | 1.2 | −0.8 | 1.2 | |
| % CV | 9.6 | 3.7 | 6.4 | 4.2 | 2.2 | 3.1 | 2.1 | 3.1 | |
| Hydroxy Metabolite (PF-6870961) | Nominal conc. (ng/mL−1) | 5.0 | 200 | 5.0 | 200 | 5.0 | 200 | 5.0 | 200 |
| Mean conc. (ng/mL−1) | 5.0 | 215.2 | 4.8 | 222.3 | −1.5 | 211.0 | 4.2 | 220.0 | |
| % Bias | −3.9 | 7.6 | −5.9 | 11.1 | −3.3 | 5.5 | 1.0 | 10.0 | |
| % CV | 7.7 | 2.8 | 7.0 | 0.9 | 8.2 | 3.8 | 4.6 | 0.8 | |
%CV calculated as (SD/mean) * 100, %bias = 100 × (mean − nominal)/nominal.
LQC and HQC for PF-5190547 and hydroxy metabolite (PF-6870961) are 3 and 750 ng/mL, 5 and 200 ng/mL respectively.
3.4.5. Analysis of clinical samples
Clinical samples (n = 45) previously analyzed by UPLC-MS/MS method and subsequently analyzed by the current method were within ± 15.2% for PF-5190457 (Fig. 2a , and band ). The data generated by this method is reproducible despite differing the LC-MS/MS and sample preparation conditions. Method robustness and reproducibility was also determined by ISR (n = 45) following the FDA Guidance for Industry for parent and metabolite. More than two-thirds of the samples were within ± 20%. The incurred sample analysis also indicated that both parent and its metabolite were stable within human plasma from subjects during storage. Bland-Altman plot is recommended over Pearson’s or Spearman’s correlation coefficient for correlation analysis for ISA as the range of data can influence the correlation [33]. The correlation between both the LC-MS/MS methods for PF-5190457 and PF-6870961 are depicted via Bland–Altman plots in Supplementary Fig. 3.
Fig. 2.
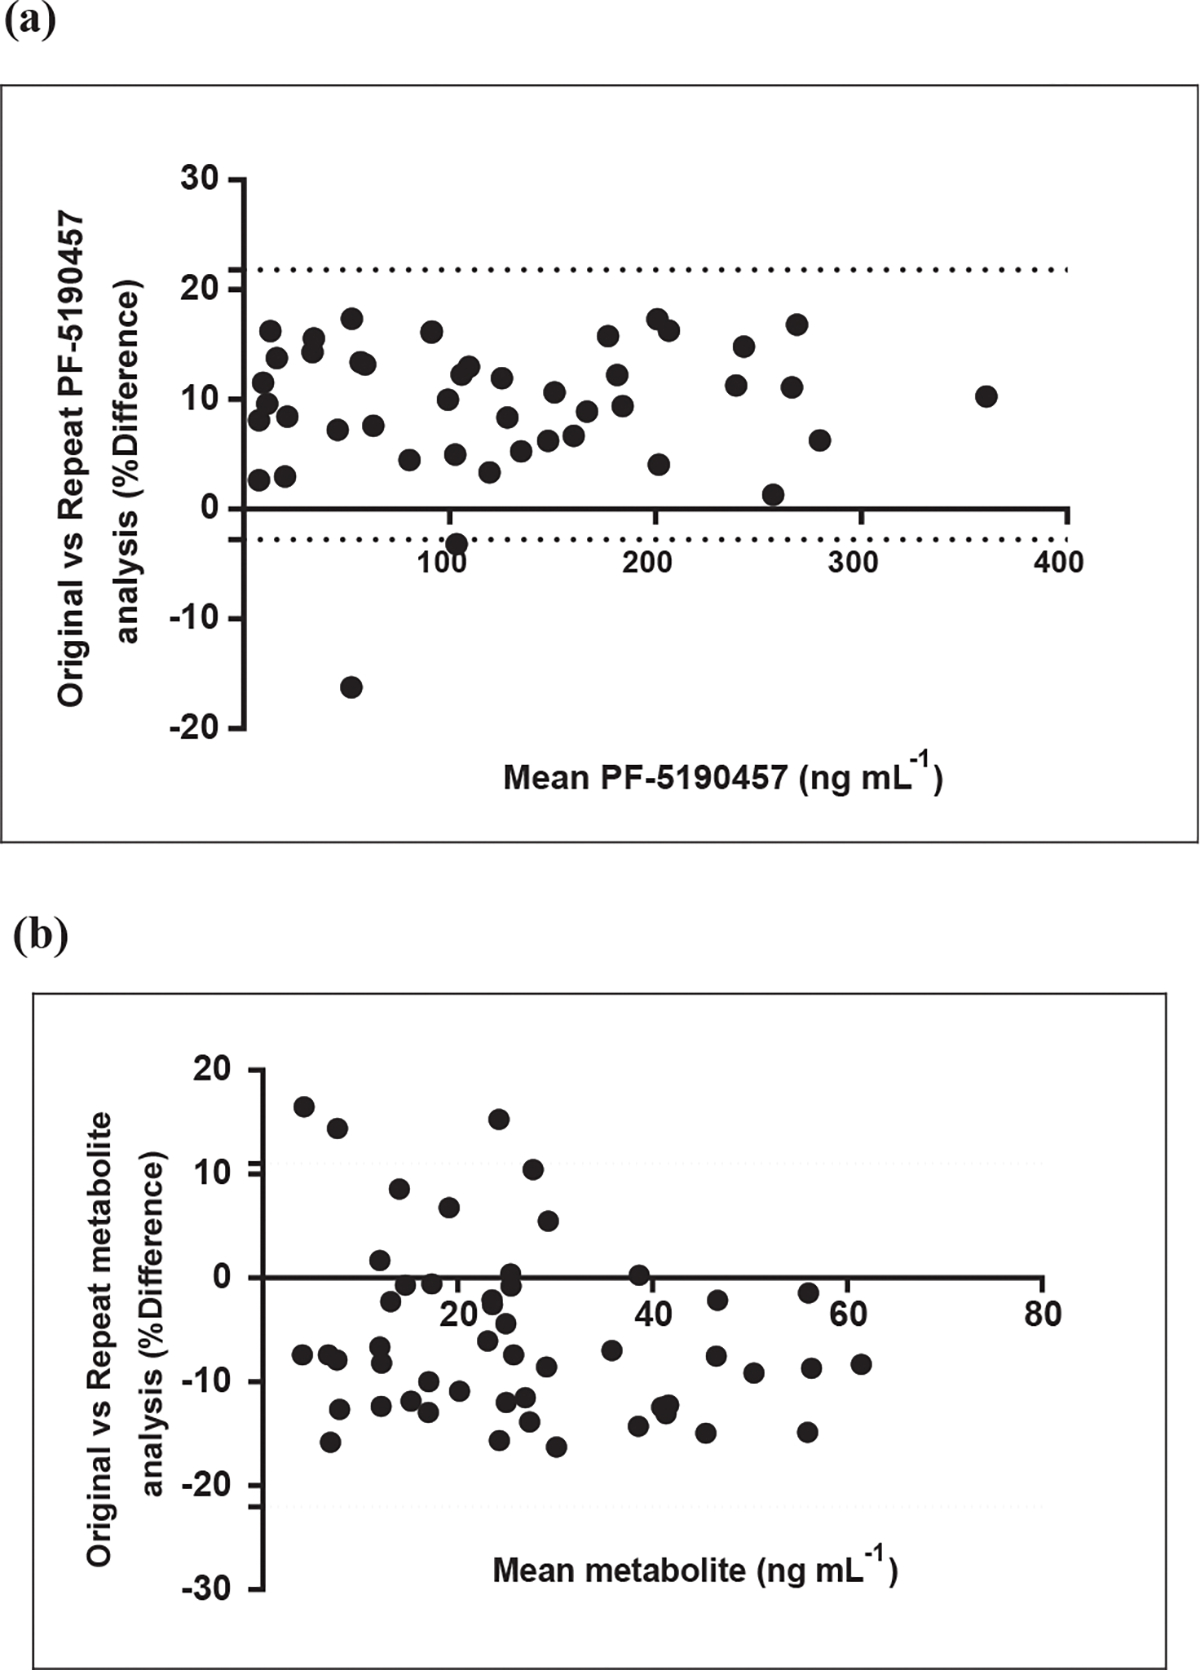
Bland–Altman plots for ISR (Incurred sample reanalysis) showing the correlation for original vs. repeat analysis for (a) PF-5190457 (lower = −2.7%, upper = 22.7%) and (b) PF-687hydroxy metabolite (lower = −22%, upper = 11%) respectively.
3.5. Method application
The suitability of the developed method was evaluated by quantifying the analyte concentration in the plasma from a previously conducted study [22]. The plasma concentration ranges of PF-5190457 and PF-6870961 were measurable within their calibration curves. Fig. 3 represents the plasma concentration-time profile of PF-5190457 and PF-6870961 in a representative study subject after 100 mg oral dose. It was interesting to find that a significant amount of parent (PF-5190457) was metabolized to its hydroxy metabolite (PF-6870961). We recently reported the role of molybdenum containing enzymes in the generation of major hydroxy-metabolite of PF-5190457. While these findings are preliminary, further investigation on pharmacological effect of the metabolite is warranted. Future clinical pharmacokinetic studies would benefit from this validated method for quantification of both the parent and major metabolite in a single LC-MS/MS method.
Fig. 3.

Plasma concentration-time profile of PF-5190457 and its major hydroxy metabolite after an oral dose of 100 mg dose in adult human subject.
4. Conclusion
To conclude, we describe the development of a sensitive LC-MS/MS method for the accurate, precise, and reliable measurement of PF-5190457 and its hydroxy metabolite, PF-6870961 in human plasma. The method also demonstrated the suitability of tacrine as IS for accurate quantification of PF-5190457 and PF-6870961. This method demonstrated adequate reliability and reproducibility of the results within the tested analytical range. This assay was successfully employed for determining the concentration of PF-5190457 and its major metabolite PF-6870961 in plasma sample collected during a phase 1b clinical trial. Given the potential role of PF-5190457 as a novel treatment for alcohol use disorder and more, in general, the potential role of the ghrelin system as a novel target towards the development of novel treatments for alcohol and substance use disorders, the method can be used for quantification of metabolites and drug in future clinical studies [34–37].
Supplementary Material
Appendix A. Supplementary material
Supplementary data to this article can be found online at https://doi.org/10.1016/j.jchromb.2019.121820.
Acknowledgments
This work was funded by the National Center for Advancing Translational Sciences (NCATS) grant UH2/UH3-TR000963 (PIs: Drs Lorenzo Leggio and Fatemeh Akhlaghi). This work was also supported by NIH intramural funding ZIA-AA000218 (Section on Clinical Psychoneuroendocrinology and Neuropsychopharmacology; PI: Dr. Lorenzo Leggio), jointly funded by the Division of Intramural Clinical and Biological Research of the National Institute on Alcohol Abuse and Alcoholism (NIAAA) and the Intramural Research Program of the National Institute on Drug Abuse (NIDA). The content of this article is solely the responsibility of the authors and does not necessarily represent the official views of the National Institutes of Health.
Authors acknowledge the immense guidance provided by Scott R. Obach from Pfizer, Inc., Groton, CT, USA. The authors would like to thank the research staff of the Clinical Pharmacokinetics Research Laboratory at the University of Rhode Island. The authors would also like to thank the clinical and research staff involved in data collection and support at the National Institute on Alcohol Abuse and Alcoholism (NIAAA) Division of Intramural Clinical and Biological Research, i.e., in the NIAAA/NIDA Section on Clinical Psychoneuroendocrinology and Neuropsychopharmacology and the NIAAA clinical intramural program. The authors would also like to thank the clinical and research staff involved in data collection and patient care at the NIH Clinical Center, i.e. in the Department of Nursing (in particular the nurses of the 1SE Inpatient Unit and of the 1-HALC 1SE Outpatient Clinic), in the Department of Nutrition and in the Department of Pharmacy. Furthermore, the authors would like to express their gratitude to the participants who took part in this study. Finally, the authors would like to thank the Steering Committee of the UH2/UH3-TR000963 grant (PIs: Drs Lorenzo Leggio and Fatemeh Akhlaghi) whose members included members from the NIAAA Division of Medication Development (in particular Dr. Joanne Fertig), the Drug Development Partnership Programs of the National Center for Advancing Translational Sciences (NCATS) and Pfizer, which kindly provided the study drug under the NCATS grant UH2/UH3-TR000963.
Abbreviations:
- CV
coefficient of variation
- ESI
electrospray ionization
- FA
formic acid
- IS
internal standard
- LLOQ
lower limit of quantification
- LQC
lower quality control
- ME
matrix effect
- MeOH
methanol
- MQC
middle quality control
- MRM
multiple reaction monitoring
- MS
mass spectrometry
- MW
molecular weight
- PLs
phospholipids
- QCs
quality controls
- SD
standard deviation
- UPLC-MS/MS
ultra-performance liquid chromatography-tandem mass spectrometry
Footnotes
Declaration of Competing Interest
Other authors declare no potential conflict of interest with any commercial entity whose products were used in the study.
References
- [1].Grucza RA, Sher KJ, Kerr WC, Krauss MJ, Lui CK, McDowell YE, Hartz S, Virdi G, Bierut LJ, Trends in adult alcohol use and binge drinking in the early 21st-Century United States: a meta-analysis of 6 national survey series, Alcohol. Clin. Exp. Res. 42 (2018) 1939–1950. [DOI] [PMC free article] [PubMed] [Google Scholar]
- [2].Wackernah RC, Minnick MJ, Clapp P, Alcohol use disorder: pathophysiology, effects, and pharmacologic options for treatment, Subst. Abuse Rehabil. 5 (2014) 1–12. [DOI] [PMC free article] [PubMed] [Google Scholar]
- [3].Sacks JJ, Gonzales KR, Bouchery EE, Tomedi LE, Brewer RD, National and State costs of excessive alcohol consumption, Am. J. Prev. Med. 49 (2015) (2010) e73–e79. [DOI] [PubMed] [Google Scholar]
- [4].Ajmera VH, Terrault NA, Harrison SA, Is moderate alcohol use in nonalcoholic fatty liver disease good or bad? A critical review, Hepatology 65 (2017) 2090–2099. [DOI] [PMC free article] [PubMed] [Google Scholar]
- [5].Teschke R, Alcoholic liver disease: alcohol metabolism, cascade of molecular mechanisms, cellular targets, and clinical aspects, Biomedicines 6 (2018). [DOI] [PMC free article] [PubMed] [Google Scholar]
- [6].Jamwal R, de la Monte SM, Ogasawara K, Adusumalli S, Barlock BB, Akhlaghi F, Nonalcoholic fatty liver disease and diabetes are associated with decreased CYP3A4 protein expression and activity in human liver, Mol. Pharm. 15 (2018) 2621–2632. [DOI] [PMC free article] [PubMed] [Google Scholar]
- [7].Leggio L, Lee MR, Treatment of alcohol use disorder in patients with alcoholic liver disease, Am. J. Med. 130 (2017) 124–134. [DOI] [PMC free article] [PubMed] [Google Scholar]
- [8].Mason BJ, Emerging pharmacotherapies for alcohol use disorder, Neuropharmacology 122 (2017) 244–253. [DOI] [PMC free article] [PubMed] [Google Scholar]
- [9].Bhattacharya SK, Andrews K, Beveridge R, Cameron KO, Chen C, Dunn M, Fernando D, Gao H, Hepworth D, Jackson VM, Khot V, Kong J, Kosa RE, Lapham K, Loria PM, Londregan AT, McClure KF, Orr ST, Patel J, Rose C, Saenz J, Stock IA, Storer G, VanVolkenburg M, Vrieze D, Wang G, Xiao J, Zhang Y, Discovery of PF-5190457, a potent selective, and orally bioavailable ghrelin receptor inverse agonist clinical candidate, ACS Med. Chem. Lett. 5 (2014) 474–479. [DOI] [PMC free article] [PubMed] [Google Scholar]
- [10].Orr ST, Beveridge R, Bhattacharya SK, Cameron KO, Coffey S, Fernando D, Hepworth D, Jackson MV, Khot V, Kosa R, Lapham K, Loria PM, McClure KF, Patel J, Rose C, Saenz J, Stock IA, Storer G, von Volkenburg M, Vrieze D, Wang G, Xiao J, Zhang Y, Evaluation and synthesis of polar aryl- and heteroaryl spiroazetidine-piperidine acetamides as ghrelin inverse agonists, ACS Med. Chem. Lett. 6 (2015) 156–161. [DOI] [PMC free article] [PubMed] [Google Scholar]
- [11].Asakawa A, Inui A, Kaga T, Yuzuriha H, Nagata T, Ueno N, Makino S, Fujimiya M, Niijima A, Fujino MA, Kasuga M, Ghrelin is an appetite-stimulatory signal from stomach with structural resemblance to motilin, Gastroenterology 120 (2001) 337–345. [DOI] [PubMed] [Google Scholar]
- [12].Inui A, Asakawa A, Bowers CY, Mantovani G, Laviano A, Meguid MM, Fujimiya M, Ghrelin, appetite, and gastric motility: the emerging role of the stomach as an endocrine organ, FASEB J. 18 (2004) 439–456. [DOI] [PubMed] [Google Scholar]
- [13].Kojima M, Hosoda H, Date Y, Nakazato M, Matsuo H, Kangawa K, Ghrelin is a growth-hormone-releasing acylated peptide from stomach, Nature 402 (1999) 656–660. [DOI] [PubMed] [Google Scholar]
- [14].Rudolph J, Esler WP, O’Connor S, Coish PD, Wickens PL, Brands M, Bierer DE, Bloomquist BT, Bondar G, Chen L, Chuang CY, Claus TH, Fathi Z, Fu W, Khire UR, Kristie JA, Liu XG, Lowe DB, McClure AC, Michels M, Ortiz AA, Ramsden PD, Schoenleber RW, Shelekhin TE, Vakalopoulos A, Tang W, Wang L, Yi L, Gardell SJ, Livingston JN, Sweet LJ, Bullock WH, Quinazolinone derivatives as orally available ghrelin receptor antagonists for the treatment of diabetes and obesity, J. Med. Chem. 50 (2007) 5202–5216. [DOI] [PubMed] [Google Scholar]
- [15].Hanrahan P, Bell J, Bottomley G, Bradley S, Clarke P, Curtis E, Davis S, Dawson G, Horswill J, Keily J, Moore G, Rasamison C, Bloxham J, Substituted azaquinazolinones as modulators of GHSr-1a for the treatment of type II diabetes and obesity, Bioorg. Med. Chem. Lett. 22 (2012) 2271–2278. [DOI] [PubMed] [Google Scholar]
- [16].Kong J, Chuddy J, Stock IA, Loria PM, Straub SV, Vage C, Cameron KO, Bhattacharya SK, Lapham K, McClure KF, Zhang Y, Jackson VM, Pharmacological characterization of the first in class clinical candidate PF-05190457: a selective ghrelin receptor competitive antagonist with inverse agonism that increases vagal afferent firing and glucose-dependent insulin secretion ex vivo, Br. J. Pharmacol. 173 (2016) 1452–1464. [DOI] [PMC free article] [PubMed] [Google Scholar]
- [17].Kaur S, Ryabinin AE, Ghrelin receptor antagonism decreases alcohol consumption and activation of perioculomotor urocortin-containing neurons, Alcohol. Clin. Exp. Res. 34 (2010) 1525–1534. [DOI] [PMC free article] [PubMed] [Google Scholar]
- [18].Leggio L, Zywiak WH, Fricchione SR, Edwards SM, de la Monte SM, Swift RM, Kenna GA, Intravenous ghrelin administration increases alcohol craving in alcohol-dependent heavy drinkers: a preliminary investigation, Biol. Psychiatry 76 (2014) 734–741. [DOI] [PMC free article] [PubMed] [Google Scholar]
- [19].Yu M, Lizarzaburu M, Beckmann H, Connors R, Dai K, Haller K, Li C, Liang L, Lindstrom M, Ma J, Motani A, Wanska M, Zhang A, Li L, Medina JC, Identification of piperazine-bisamide GHSR antagonists for the treatment of obesity, Bioorg. Med. Chem. Lett. 20 (2010) 1758–1762. [DOI] [PubMed] [Google Scholar]
- [20].Suchankova P, Steensland P, Fredriksson I, Engel JA, Jerlhag E, Ghrelin receptor (GHS-R1A) antagonism suppresses both alcohol consumption and the alcohol deprivation effect in rats following long-term voluntary alcohol consumption, PLoS ONE 8 (2013) e71284. [DOI] [PMC free article] [PubMed] [Google Scholar]
- [21].Ghareeb M, Leggio L, El-Kattan A, Akhlaghi F, Development and validation of an UPLC-MS/MS assay for quantitative analysis of the ghrelin receptor inverse agonist PF-5190457 in human or rat plasma and rat brain, Anal. Bioanal. Chem. 407 (2015) 5603–5613. [DOI] [PMC free article] [PubMed] [Google Scholar]
- [22].Lee MR, Tapocik JD, Ghareeb M, Schwandt ML, Dias AA, Le AN, Cobbina E, Farinelli LA, Bouhlal S, Farokhnia M, Heilig M, Akhlaghi F, Leggio L, The novel ghrelin receptor inverse agonist PF-5190457 administered with alcohol: preclinical safety experiments and a phase 1b human laboratory study, Mol. Psychiatry (2018), 10.1038/s41380-018-0064-y. [DOI] [PMC free article] [PubMed] [Google Scholar]
- [23].Adusumalli S, Jamwal R, Obach RS, Ryder TF, Leggio L, Akhlaghi F, Role of molybdenum-containing enzymes in the biotransformation of the novel ghrelin receptor inverse agonist PF-5190457: a reverse translational bed-to-bench approach, Drug Metab. Dispos. 47 (2019) 874–882. [DOI] [PMC free article] [PubMed] [Google Scholar]
- [24].Camacho-Munoz D, Kasprzyk-Hordern B, Multi-residue enantiomeric analysis of human and veterinary pharmaceuticals and their metabolites in environmental samples by chiral liquid chromatography coupled with tandem mass spectrometry detection, Anal. Bioanal. Chem. 407 (2015) 9085–9104. [DOI] [PubMed] [Google Scholar]
- [25].Ponnayyan Sulochana S, Ravichandiran V, Mullangi R, Sukumaran SK, Highly sensitive LC-MS-MS method for the determination of tacrine in rat plasma: application to pharmacokinetic studies in rats, J. Chromatogr. Sci. 54 (2016) 397–404. [DOI] [PubMed] [Google Scholar]
- [26].U.S. FDA, Bioanalytical Method Validation, Guidance for Industry, U.S. FDA, 2018. [Google Scholar]
- [27].Taylor PJ, Matrix effects: the Achilles heel of quantitative high-performance liquid chromatography-electrospray-tandem mass spectrometry, Clin. Biochem. 38 (2005) 328–334. [DOI] [PubMed] [Google Scholar]
- [28].Bonfiglio R, King RC, Olah TV, Merkle K, The effects of sample preparation methods on the variability of the electrospray ionization response for model drug compounds, Rapid Commun. Mass Spectrom. 13 (1999) 1175–1185. [DOI] [PubMed] [Google Scholar]
- [29].Carmical J, Brown S, The impact of phospholipids and phospholipid removal on bioanalytical method performance, Biomed. Chromatogr. 30 (2016) 710–720. [DOI] [PubMed] [Google Scholar]
- [30].Little JL, Wempe MF, Buchanan CM, Liquid chromatography-mass spectrometry/mass spectrometry method development for drug metabolism studies: Examining lipid matrix ionization effects in plasma, J. Chromatogr. B Analyt. Technol. Biomed. Life Sci. 833 (2006) 219–230. [DOI] [PubMed] [Google Scholar]
- [31].Macwan JS, Ionita IA, Dostalek M, Akhlaghi F, Development and validation of a sensitive, simple, and rapid method for simultaneous quantitation of atorvastatin and its acid and lactone metabolites by liquid chromatography-tandem mass spectrometry (LC-MS/MS), Anal. Bioanal. Chem. 400 (2011) 423–433. [DOI] [PubMed] [Google Scholar]
- [32].Jamwal R, Topletz AR, Ramratnam B, Akhlaghi F, Ultra-high performance liquid chromatography tandem mass-spectrometry for simple and simultaneous quantification of cannabinoids, J. Chromatogr. B Analyt. Technol. Biomed. Life Sci. 1048 (2017) 10–18. [DOI] [PMC free article] [PubMed] [Google Scholar]
- [33].Rocci ML Jr., Devanarayan V, Haughey DB, Jardieu P, Confirmatory reanalysis of incurred bioanalytical samples, AAPS J. 9 (2007) E336–343. [DOI] [PMC free article] [PubMed] [Google Scholar]
- [34].Wenthur CJ, Gautam R, Zhou B, Vendruscolo LF, Leggio L, Janda KD, Ghrelin receptor influence on cocaine reward is not directly dependent on peripheral acylghrelin, Sci. Rep. 9 (2019) 1841. [DOI] [PMC free article] [PubMed] [Google Scholar]
- [35].Farokhnia M, Faulkner ML, Piacentino D, Lee MR, Leggio L, Ghrelin: from a gut hormone to a potential therapeutic target for alcohol use disorder, Physiol. Behav. 204 (2019) 49–57. [DOI] [PubMed] [Google Scholar]
- [36].Morris LS, Voon V, Leggio L, Stress, motivation, and the gut-brain axis: a focus on the ghrelin system and alcohol use disorder, Alcohol Clin. Exp. Res. (2018), 10.1111/acer.13781. [DOI] [PMC free article] [PubMed] [Google Scholar]
- [37].Zallar LJ, Farokhnia M, Tunstall BJ, Vendruscolo LF, Leggio L, The role of the ghrelin system in drug addiction, Int. Rev. Neurobiol. 136 (2017) 89–119. [DOI] [PubMed] [Google Scholar]
Associated Data
This section collects any data citations, data availability statements, or supplementary materials included in this article.