

ABSTRACT
The aging of the world population gave rise to an increased prevalence of many lung diseases, with chronic obstructive pulmonary disease now ranking as the third‐leading cause of death according to the World Health Organization. To diagnose lung disease, a thorough assessment of lung function is essential since it may reveal unique signatures in terms of disease pathophysiology. Yet, clinically established lung function tests are global measurements, which may compromise their sensitivity to early, regional changes in lung function compared to spatially resolved imaging tests. From a scientific perspective, the lung is a highly complex organ, and newly developed functional imaging methods may elucidate previously unknown aspects of its physiology. Functional pulmonary imaging is and will thus be of great value for both clinical and research applications. The goal of this review is to shed light on the field of functional pulmonary imaging in all its varieties, with a particular focus on the numerous tools MRI has to offer. This includes 1H MRI methods with or without exogenous contrast agents like oxygen‐ or gadolinium‐based contrast agents and MRI of hyperpolarized and inert gases like 129Xe or perfluoropropane. However, thinking outside the box, a glance is also taken at what other modalities like single‐photon emission computed tomography, computed tomography, or X‐ray dark‐field imaging have to offer. Following a physiological perspective, methods are described in terms of their ability to assess the key parameters of lung physiology in humans—ventilation, perfusion, and alveolar membrane function, as well as microstructure—and promising clinical and research applications are discussed. An outlook into possible future paths the field might take is given.
Evidence Level: 5.
Technical Efficacy: 2.
Keywords: alveolar membrane function, imaging, lung function, microstructure, perfusion, ventilation
1. Introduction
Lung diseases pose a significant burden on the world population, with chronic obstructive pulmonary disease (COPD) being the third leading cause of death worldwide, according to figures of the World Health Organization from 2019 [1].
Lung function assessment has been of high relevance for diagnosis, monitoring, and prognostication of patients with lung disease. Compared to the use of conventional lung function testing, pulmonary functional imaging seems a young and rapidly developing field. Pulmonary functional imaging as a toolbox of noninvasive imaging methods may still elucidate novel and clinically relevant knowledge of the normal function of the lung.
The purpose of this article is to provide an overview with a focus on MRI methods but with the intention to span all modalities. This overview should be considered non‐complete given the broadness and rapidly evolving nature of the field. The article is structured according to a physiological perspective, following the different aspects of lung function.
1.1. Lung Physiology
Basic knowledge of lung physiology and structure has historically been obtained in great part by microscopic imaging [2] given the past and partly still present limitations of noninvasive imaging methods in terms of, for example, image resolution.
Gas exchange may be considered the primary function of the lung. To achieve this, air needs to be transported to and from the gas exchange surface efficiently. The human lung possesses an intriguing compact tree‐like structure of airways separating further and further in approximately 23 generations from the trachea to the level of the gas exchange area in alveolar ducts and sacs. Air is moved through this structure in and out, leading to lung ventilation. Given the increase of the sum of cross‐sectional areas of airways with increasing splitting, movement of fresh and used air within the distal individual airways becomes very slow and is ultimately dominated by passive diffusion.
The heart pumps oxygen‐depleted blood through the capillary network in the gas exchange region—the parenchyma. The volume of this network is only around ~200 mL [2]—the same order of magnitude as cardiac stroke volume, meaning that the lung parenchyma is continuously perfused with blood, spending a time in the range of seconds within capillaries, depending on heart rate and cardiac function. After uptake of oxygen and removal of carbon dioxide in the gas exchange area, the blood returns to the heart to enter the systemic circulation and to deliver oxygen to the organs in order to generate adenosine triphosphate (ATP), a readily available form of energy in the cells through oxidative decarboxylation.
Assuming a uniform spread of the capillary blood volume over the enormous alveolar surface area of ~102 m2 available for gas exchange, the blood is seen to form a sheet‐like structure with a mean thickness in the range of micrometers. This is less than the length scale corresponding to the root‐mean‐square displacement in Brownian diffusion of order √Dt for small molecules like oxygen within solution during a time scale of the capillary transit time of ~1 s and with a diffusion coefficient ~103 μm2/s [3]. The alveolar membrane separating airspaces and blood also has a thickness in the micrometer range to allow for efficient gas exchange by passive transport processes.
To achieve all this within a limited volume of the thoracic cavity and with sufficient structural stability, the lung possesses a complex, optimized (micro‐)structure, which is only touched upon in this article.
This article describes pulmonary functional imaging in the four aspects of ventilation, perfusion, alveolar membrane function, and microstructure with dedicated sections. Figure 1 shows an overview of the individual imaging modalities and methods available for assessing aspects of lung function. Table 1 summarizes the relative strengths and weaknesses of the methods.
FIGURE 1.

Overview of the methods available for functional lung imaging and described in this article. The methods for assessment of structure/membrane function are roughly sorted according to the length scales probed. CT, computed tomography; hp, hyperpolarized; OE, oxygen‐enhanced; SPECT, single‐photon emission computed tomography; UTE, ultra‐short echo time.
TABLE 1.
Comparison of imaging methods.
| Physiological aspect | Method | Technique | Relative strengths | Relative weaknesses |
|---|---|---|---|---|
| Ventilation | Hyperpolarized gas MRI (129Xe, 3He) | Single‐breath imaging | High‐resolution, sensitivity for disease | No quantification of ventilation in physiological units |
| Multibreath imaging | Absolute quantification | Low‐resolution, technical complexity, less established | ||
| 19F MRI | Multibreath imaging | Absolute quantification, no need for hyperpolarization hardware, no anesthetic effects | Lower resolution/SNR compared to hyperpolarized gases, potent greenhouse gases | |
| 1H MRI | 2D PREFUL | Technical simplicity, no additional hardware, patient‐friendly examination, simultaneous perfusion information | Computationally intensive post‐processing, indirect ventilation assessment | |
| 3D PREFUL | Fast acquisition for whole‐lung coverage | Comparatively long scan times (~8 min), typically no perfusion information, computationally intensive post‐processing | ||
| Oxygen‐enhanced MRI | Multibreath | Ready availability, quantitative measurement in dynamic protocols | May be technically complex, long scan times, weak signals | |
| SPECT | 99mTc‐labeled aerosol | Clinically established gold standard | Limited resolution, ionizing radiation, cost | |
| CT | Xenon CT | Technical simplicity | Ionizing radiation, anesthetic effect | |
| Acquisition in in‐/exhalation | High resolution, no tracer gas required | Increased radiation dose, indirect measurement | ||
| Perfusion | DCE MRI | First‐pass imaging after bolus injection | Established method, quantification in physiological units, high resolution, fast acquisition | Risks of gadolinium‐based contrast agents |
| ASL MRI | Pseudo‐continuous ASL | Quantification in physiological units, no contrast agent required | Long acquisition times, limited lung coverage | |
| Fourier decomposition‐based MRI | 2D PREFUL | No contrast agent required | Long acquisition times, computationally intensive post‐processing, quantification difficult | |
| 129Xe MRI | Can be specific to capillary blood | Quantification in physiological units difficult, validation pending | ||
| Contrast‐enhanced CT | Helical scanning | Fast, high resolution | No quantification in physiological units, ionizing radiation | |
| Dynamic axial scanning | Quantification in physiological units | High radiation dose, limited lung coverage | ||
| SPECT | Gold standard method, low radiation dose compared to CT, simultaneous ventilation assessment | Low resolution | ||
| Alveolar membrane function | 129Xe MRI | Dissolved‐phase imaging | Comparatively low resolution achievable | Signals may be hard to interpret, large dose associated with anesthetic effects required |
| Chemical shift saturation recovery | Quantification of morphometric quantities, additional dynamic information | Typically, only global measurement, difficult to perform imaging in one breathhold | ||
| Microstructure | Diffusion‐weighted MRI of inhaled tracers (129Xe, 3He, 19F) | ADC mapping | High sensitivity for disease, fast measurement | Results dependent on sequence parameters |
| Microstructure quantification using multiple b‐value experiments | Accurate quantification using established models | Models may not be representative of diseased lung tissue | ||
| Microstructure quantification using multiple diffusion time experiments | Simple theoretical, model‐free relationship | Short enough diffusion times may be difficult to achieve | ||
| UTE MRI | No additional hardware required | Lower resolution compared to CT, results may be hard to interpret | ||
| CT | High resolution, ready availability | Microstructure quantification only possible in special cases | ||
| Dark‐field X‐ray/CT imaging | Relative technical simplicity | Results may be challenging to interpret in terms of morphometry, development/validation ongoing |
Abbreviations: ADC, apparent diffusion coefficient; ASL, arterial spin labeling; CT, computed tomography; DCE, dynamic contrast‐enhanced; PREFUL, phase‐resolved functional lung; SPECT, single‐photon emission computed tomography; UTE, ultra‐short echo time.
2. Ventilation
Adequate ventilation (abbreviated V) of the lungs is of key importance for efficient gas exchange. Ventilation is usually impaired regionally in obstructive as well as restrictive lung diseases.
In spite of their presumed high sensitivity, imaging tests typically do not play a role in the diagnosis of obstructive lung disease, which is based on simple methods like spirometry. Clinical applications where ventilation imaging can be most beneficial include treatment monitoring and assessment of disease severity, and identification of target regions for interventions like lung volume reduction surgery, endobronchial valve placement, or radiotherapy of lung cancer.
2.1. Hyperpolarized Gas MRI
Images of the distribution of hyperpolarized gases after single inhalation were found to be very useful in obstructive lung disease soon after the introduction of MRI of the spin 1/2 nuclei 3He and 129Xe in their hyperpolarized state to biomedical imaging [4, 5, 6]. These images show signals directly proportional to ventilation. Figure 2 shows representative imaging results in a patient with COPD.
FIGURE 2.

Ventilation imaging with hyperpolarized 129Xe in (a) a healthy volunteer (24‐year‐old male, FEV1 102.2% of predicted value) and (b) a patient with chronic obstructive pulmonary disease (73‐year‐old male, FEV1 55.4% of predicted value). 129Xe images (color) are overlaid over conventional anatomic 1H images (gray) within the thoracic cavity. Marked heterogeneity of ventilation is observed throughout the lung in the patient, whereas ventilation is very homogeneous in the healthy volunteer. FEV1, forced expiratory volume in 1 s.
Sequences are generally of the fast low‐angle shot (FLASH) or true fast imaging with steady‐state precession (TrueFISP) type [7] and high spatial resolution with isotropic voxel sizes in the range of a few millimeters can be obtained in one breathhold, even for the isotope 129Xe which typically provides lower SNR than 3He due to differences in achievable polarization levels and gyromagnetic ratios [8].
The primary parameter obtained from these images is typically the percentage of ventilation defects within the lung. Difficulties in the quantification may arise through variable and hard to determine bias fields as well as inaccurately known lung boundaries in non‐ventilated areas despite recent progress [9, 10]. The problem of misalignment between signals in gas and anatomical 1H images may be addressed by sequential [11] or potentially truly simultaneous acquisition at the two Larmor frequencies [12].
Numerous studies have been conducted showing the sensitivity of hyperpolarized gas ventilation MRI to diseases like COPD [13], asthma [14], or cystic fibrosis [15] and also to changes due to treatment [16, 17]. Albeit this is the most mature and only clinically applied MRI method of directly assessing ventilation using hyperpolarized gases, a limitation is that ventilation is not quantitatively assessed.
Alternatively, ventilation may be studied using an image time series. Buildup of signal during the wash‐in phase of the tracer gas may be used to calculate fractional ventilation as the relative amount of gas exchanged per breath [18]. Similar methods are applicable to the wash‐out of the gas during inhalation of, for example, room air not containing the tracer gas [19]. After initial work in preclinical settings, multiple‐breath ventilation imaging has also been applied in human studies [20]. The quantitative assessment of ventilation compared to images showing signal intensities proportional to ventilation may be considered an advantage. Disadvantages are the increased complexity of the imaging protocol, reduced spatial resolution, and more elaborate post‐processing to compensate for the effects of polarization decay. Further, given present polarization technology and the high cost of the isotopes 3He and 129Xe, the amount of gas that can be used is limited such that a complete wash‐in of gas may be difficult to achieve in slowly filling regions.
While clinical translation of hyperpolarized gas MRI has been predicted early [21], it has—so far—mostly been limited to clinical research. The recent approval of hyperpolarized 129Xe MRI for ventilation imaging in the United States could change this. One of the reasons for the slow translation may be the expensive equipment, with the scope of applicability limited mostly to lung imaging, thus likely restricting dissemination to specialized centers. Another reason may have been the initial focus on 3He due to technically easier polarization and better relaxation characteristics allowing for remote production, while this isotope is not abundant on earth in sufficient amounts. 129Xe naturally occurs in the atmosphere, which makes it more promising in terms of clinical translation combined with improvements in polarization technology in recent years. The large natural isotopic fraction of 26.4% of 129Xe facilitates clinical application without the need for costly isotopic enrichment, as is typically done for research studies [22]. Use of a lower isotopic ratio may require a higher volume of xenon to compensate for the loss in signal‐to‐noise ratio, however, which may lead to increased anesthetic side effects observed at higher volumes around 1 L [23] and patient discomfort.
2.2. 19F MRI
The idea of using the spin 1/2 isotope 19F with its high gyromagnetic ratio of ~2π × 40 MHz/T and 100% natural abundance for lung imaging is relatively old [24]. Compared to 129Xe and 3He which are almost MR‐invisible in the thermally polarized state due to long spin–lattice relaxation times, fluorinated gases like perfluoropropane can be used for imaging at thermal polarization due to the very short spin–lattice relaxation times enabling rapid signal averaging. The use of fluorinated gases is associated with reduced regulatory hurdles compared to hyperpolarized gases since there is no need for local gas production. Images also do not suffer from the detrimental effects of polarization decay, which are not always easy to quantify. Another advantage is the ability to use large volumes of gas.
The later aspect has proven to be very beneficial for studying wash‐in and wash‐out dynamics in multiple‐breath protocols. The delayed wash‐out of fluorinated gases has been shown to be sensitive to COPD and to correlate with the severity of airway obstruction as seen in spirometry [25, 26]. Monitoring of cystic fibrosis patients may be an application where MRI can play a key role in general due to lack of ionizing radiation, and it was demonstrated that multiple‐breath wash‐out MRI using fluorinated gases is sensitive to cystic fibrosis in patients with normal forced expiratory volume in 1 s [27].
Despite these promising results, the method has so far been adopted by only a few research sites worldwide. Images after single inhalation may be sensitive to mild obstruction but suffer from low SNR. Also, the need for dedicated RF hardware may still hinder widespread clinical dissemination. Further, the imaging properties of fluorinated gases reduce versatility compared to imaging of hyperpolarized gases and limit achievable spatial resolution despite recent improvements through advanced reconstruction [28]. There may also still be room for improvement in terms of the optimal choice of the imaging agent [29].
2.3. 1H MRI
A promising MRI method for indirect ventilation assessment utilizing conventional 1H imaging is to continuously acquire a 2D slice during free breathing without contrast agent application. Ventilation information is obtained after image registration from the respiration‐induced variation of the lung parenchyma's signal intensity in the image stack [30]. Ventilation is quantified using a sponge model, assuming a linear relationship between signal intensity and tissue density [31].
Different post‐processing approaches may be used to extract the ventilation‐weighted information from the signal time series, including spectral analysis with Fourier decomposition, low‐pass filtering with subsequent ventilation phase sorting (phase‐resolved functional lung MRI (PREFUL) [32]) or sorting prior to reconstruction (self‐gated noncontrast‐enhanced functional lung MRI (SENCEFUL) [33]). Phase sorting offers the advantage of facilitating the calculation of regional ventilation flow volume loops, comparable to spirometric measurements. Several studies suggest that this dynamic information may offer increased sensitivity over simply comparing end‐inspiratory and end‐expiratory states. This is particularly evident in applications such as predicting graft loss following lung transplantation [34] or monitoring treatment outcomes in COPD [35]. See Figure 3 for representative PREFUL ventilation maps applied for monitoring treatment in cystic fibrosis. Despite the indirect assessment of ventilation, relatively good agreement of ventilation defect percentages with results from, for example, 129Xe MRI was found in several diseases [36, 37].
FIGURE 3.

2D PREFUL ventilation maps (first row), perfusion maps (second row), and ventilation/perfusion match classification (third row) in an 18‐year‐old male cystic fibrosis patient before and 13 weeks after beginning treatment with triple combination therapy elexacaftor/tezacaftor/ivacaftor (ETI). PREFUL, phase‐resolved functional lung; QDP, perfusion defect percentage; QQuant, quantified perfusion; RVent, regional ventilation; VDP, ventilation defect percentage; VQM, ventilation/perfusion match.
While the technical simplicity during image acquisition has proven to be highly beneficial for clinical dissemination, the complex image post‐processing and associated computational requirements remain challenging. Most time‐consuming is non‐rigid registration of the images. Probably due to low signal‐to‐noise ratio in the lung region, averaging images of comparable respiration states was shown to be beneficial [38]. However, great improvements in registration speed have recently been achieved [39] and more improvements in the coming years are likely, for example, by the use of artificial intelligence‐based methods or GPU‐accelerated registration strategies.
A potential clinical application of signal‐based 1H ventilation MRI is monitoring of, for example, cystic fibrosis patients in treatment for pulmonary exacerbations [40]. In addition, infants and neonates and potentially preterm babies may be imaged [41]. Other patient groups requiring dense follow‐up imaging, like lung transplant recipients, could benefit from this method, too [42]. Signal‐based 1H ventilation MRI methods have also been applied and compared to hyperpolarized gas imaging in COPD, asthma, and bronchiectasis, and it was suggested that agreement may vary between diseases [43, 44].
Another method proposed for obtaining ventilation information from dynamic 1H MRI is to use the Jacobian determinant describing the local volume changes of lung tissue [45]. One of the advantages may be the fact that changes in transverse relaxation with lung inflation level do not negatively affect the results [46]. Due to constraints on the deformation field imposed by image registration algorithms, the ventilation images obtained may have reduced effective spatial resolution compared to signal‐based methods. Studies of lung physiology with respect to, for example, gravitational gradients may be an application for which the method could be well suited. Results of such Jacobian determinants have been reported in healthy volunteers and patients with lung fibrosis [47]. Yet, a recent validation study using a synthetic lung model showed impaired reliability compared to signal‐based methods [48].
Among the general technical limitations of 2D acquisitions in 1H MRI for ventilation assessment are the relatively long scan times necessary for obtaining ventilation maps with whole‐lung coverage. Through‐plane motion of lung tissue may negatively affect the results and impose restrictions on slice orientations. A possible solution is a 3D acquisition. Ventilation information may be obtained similarly as in the 2D case with a subsequent analysis of signal variation after registration or of deformation fields in the lung parenchyma within about 8 min [33, 49, 50]. The 3D PREFUL technique has been demonstrated to be feasible for ventilation assessment in patients with obstructive lung disease, and good global agreement with results from fluorinated gas and hyperpolarized 129Xe MRI has been found [51, 52, 53]; see Figure 4. Among the disadvantages of this method is the loss of perfusion information readily obtainable in 2D 1H MRI acquisitions, as will be described in more detail below.
FIGURE 4.

3D PREFUL MRI regional ventilation maps (on the left), respective ventilation defect maps (in the middle), and 19F (on the right) ventilation defect maps for a 60‐year‐old male with chronic obstructive pulmonary disease (FEV1 53% of predicted value). Defect regions are color‐coded in red, gold arrows show the regional ventilation defect agreement, and blue arrows point out the regional differences. Sørensen–Dice coefficient was 61.8% and 48.2% for healthy and defect areas, respectively. FEV1, forced expiratory volume in 1 s; PREFUL, phase‐resolved functional lung.
2.4. Oxygen‐Enhanced MRI
By virtue of its paramagnetic properties, molecular oxygen dissolved in lung tissue and blood may influence the MR signal in 1H MRI through the increase in spin–lattice relaxation rate R1. It thereby acts as a natural contrast agent. Measurement of R1 rates/T1 times under inhalation of gases with varying fractions of oxygen may be used to study oxygen uptake through the oxygen transfer function defined as the slope of R1 as a function of oxygen fraction [54]. In addition, oxygen inhalation may influence the blood oxygenation level, leading to changes in apparent transverse relaxation times (BOLD effect). Both T1 and T2* weighted imaging may thus be sensitive to signal changes upon oxygen inhalation.
Previous studies have shown, for example, the potential of oxygen‐enhanced MRI to detect pulmonary functional loss in patients with COPD and to discriminate patients with varying disease severity [55]. A great advantage of oxygen‐enhanced MRI is the fact that both technical and regulatory hurdles are low since it relies on 1H MRI contrasts and medical oxygen is readily available, which could make it interesting for clinical application. The depiction of the uptake of oxygen may be particularly physiologically relevant as its extraction is one of the primary functions of the lung. However, a limitation of static oxygen‐enhanced MRI is the fact that the biomarkers obtained are likely reflective of a combination of ventilation, perfusion, and diffusion through the blood–air barrier, and for this reason, they are not always easy to interpret in terms of physiology, which may hamper clinical interpretation.
This limitation may be addressed by dynamic oxygen‐enhanced MRI protocols. By assuming a linear relationship between oxygen concentration in lung tissue and R1 relaxation rates, quantification of the correlation delay time between MRI signals and switching inspired oxygen fraction over a multitude of breaths may be used to accurately quantify specific ventilation, for example, to elucidate aspects of normal lung physiology [56]. The long scan times necessary for quantification in 2D slices seem problematic with respect to clinical implementation, which could potentially be addressed by use of 3D imaging methods [57].
2.5. SPECT
Ventilation imaging using single‐photon emission computed tomography (SPECT) may be achieved by inhalation of a radioactive gas or a labeled radioactive aerosol emitting gamma rays. In the case of an aerosol, the distribution of inhaled particles within the lung, in particular penetration to the lung periphery, is dependent on particle size. The results obtained hence depend on the radioactive aerosol used and differences appear to be particularly pronounced in obstructive lung disease, for which Technegas is recommended [58]. Regional ventilation deficits, for example, in COPD, can be detected [59]. Disadvantages are the comparatively low spatial and temporal resolution, use of ionizing radiation limiting use for follow‐up imaging, and expensive radioactive isotopes with limited availability.
2.6. CT
Computed tomography (CT) may be used to obtain information on regional ventilation, and a wide variety of methods exist. For example, dual‐energy CT after inhalation of a gas with a high atomic number like xenon may be used to estimate the component of attenuation caused by xenon and consequently local ventilation [60]. While the ventilation images produced are of high quality, one downside for the clinical application, for example, in treatment monitoring, is the exposure to ionizing radiation. Protocols with prolonged inhalation of xenon may also be associated with increased anesthetic effects [60].
Other methods are based on acquiring images at inspiration or expiration, at multiple lung inflation levels, or even dynamically with subsequent deformable image registration. Ventilation may then be derived from the change in CT density in Hounsfield units or from the Jacobian determinant of the deformation field [61]. A somewhat different approach is taken by parametric response mapping, which classifies density changes with inflation level into normal lung, functional small airways disease, and emphysema to study obstructive lung disease [62]. Similar to 1H MRI methods, while technically simple during the image acquisition phase, more work is required on the post‐processing side. Repeated or prolonged measurements may further lead to a high radiation dose. However, recent advances with very promising clinical potential have been made using photon‐counting CT technology, which allowed for a dose‐efficient and robust simultaneous evaluation of pulmonary morphologic structure, ventilation, vasculature, and parenchymal perfusion in a procedure requiring advanced software but no additional hardware [63], see Figure 5.
FIGURE 5.

Photon‐counting CT images of a patient with chronic thromboembolic hypertension (CTEPH). Photon‐counting CT allows a comprehensive assessment of the lung structure and vasculature (a, b) and function (ventilation and perfusion: c, d) with high spatial resolution. CT ventilation and perfusion (c, d) show high agreement with VQ‐SPECT (e, f). VQ‐SPECT, ventilation/perfusion single‐photon emission computed tomography.
3. Perfusion
Pulmonary perfusion (abbreviated Q) is altered in a wide range of lung diseases, for example, by the Euler–Liljestrand mechanism or other factors like pulmonary embolism. Although contrast‐enhanced CT and nuclear medicine methods like SPECT are more established for the clinical assessment of pulmonary perfusion defects [59, 64], several MRI methods exist for the assessment of different aspects of pulmonary perfusion from macro‐ to microscopic scale.
3.1. Dynamic Contrast‐Enhanced MRI
Dynamic contrast‐enhanced (DCE) MRI is the most established MRI technique for assessment of lung perfusion. The most established method is to image the first pass of a single bolus of gadolinium‐based contrast agent after intravenous injection. Besides perfusion defect percentage at maximum enhancement, quantitative information on perfusion like pulmonary blood flow may be obtained from the signal evolution in T1‐weighted sequences using established methods [65]. This requires knowledge about the arterial inflow of contrast agent in time and making some assumptions, among them being a linear relationship between concentration of the contrast agent and signal intensity. This is frequently a relatively crude approximation for the doses necessary to achieve sufficient SNR, however. Deviations from linearity lead to a distortion of the estimated arterial input function and consequently biased results. A prior injection of contrast agent at reduced dose for estimation of the arterial input function may be used for mitigating this problem [66] but increases the complexity of the acquisition.
Among the advantages of DCE MRI for lung perfusion assessment are the comparatively high spatial resolution with full lung coverage in a single breathhold and the relatively simple acquisition and analysis. Reports of retention of contrast agents containing gadolinium in brain tissue have raised health concerns in the past [67]. However, with the introduction of more stable cyclic gadolinium‐based contrast agents, gadolinium deposition in the body and related nephrogenic systemic fibrosis has been less frequent [68]. There are also environmental concerns associated with the use of gadolinium during MRI examinations due to its accumulation in rivers and drinking water [69]. Other compounds, for example, hyperpolarized MRI tracers, are possible alternatives for first‐pass lung perfusion imaging [70].
In COPD, DCE‐MRI‐derived pulmonary microvascular blood flow (PMBF) was shown to be reduced in mild COPD, including in regions of lung without frank emphysema [71]. Also, pharmacologic intervention with inhalers improved DCE‐MRI‐derived PMBF in COPD patients with hyperinflated lungs [72]. Therefore, PMBF may provide an imaging biomarker for therapeutic strategies targeting the pulmonary microvasculature [73].
The monitoring of cystic fibrosis lung disease is an example where MRI—and DCE lung MRI in particular—may play a role in clinical practice due to the lack of ionizing radiation and the inherent information on ventilation through the Euler–Liljestrand mechanism [74]. Figure 6 shows imaging results in a pediatric CF patient. It was further demonstrated that DCE MRI has very high sensitivity for the detection of chronic thromboembolic pulmonary hypertension [75]. DCE MRI could also be of interest in the detection of acute pulmonary embolism, although a previous study showed a large number of scans with inconclusive results limiting use in an emergency setting [76].
FIGURE 6.

(a) Maximum enhancement in a series of first‐pass dynamic contrast‐enhanced MR images as well as pulmonary blood flow map (b) in a pediatric cystic fibrosis patient (17‐year‐old female, FEV1 100% of predicted value). Perfusion defects are readily apparent mainly in the right lung. FEV1, forced expiratory volume in 1 s; PBF, pulmonary blood flow.
3.2. ASL MRI
Arterial spin labeling (ASL) in MRI is a method for perfusion assessment using endogenous contrast created by manipulating the magnetization of inflowing blood, thus not requiring the injection of substances. In essence, an ASL acquisition consists of a labeling part and an acquisition part. In the labeling part of the sequence, water protons in a slab containing large arterial vessels are labeled by RF pulses, which later reduce the MR signal in the rapidly imaged acquisition plane through perfusion. Several variants of ASL exist in terms of labeling technique addressing issues like the absorption of RF energy or off‐resonant excitation of macromolecules in the imaging plane, reducing the signal through magnetization transfer unrelated to perfusion.
Perfusion may be quantified in physiologically meaningful units using established theories [77]. Application of ASL to study lung perfusion is viable but suffers from multiple issues, among them being the complex anatomy of vasculature within the thorax, flow within the imaging plane, flow pulsatility and low signal‐to‐noise ratio, motion, and relatively long acquisition times already for single slices [78]. These factors pose limitations on the location and orientation of imaging slices.
Clinical applications of ASL for studying lung perfusion have so far been limited, although there seems to be potential, for example, for detection of pulmonary embolism [79] or monitoring of pediatric cystic fibrosis patients [80]. Nevertheless, the technique proved to be very useful for studies of human lung physiology [81].
3.3. Fourier Decomposition‐Based MRI
In analogy to ventilation, Fourier decomposition and phase‐sorting methods measuring periodic changes of signal intensity may also be used for assessment of lung perfusion, at least in the case of 2D acquisitions. The perfusion contrast here relies mostly on the inflow of unsaturated spins into the imaging plane. While sharing some limitations with ASL and other approaches of perfusion weighting using ECG‐gated acquisitions [82], the technical simplicity of image acquisition using gradient‐echo sequences is advantageous in terms of clinical dissemination. A further advantage over DCE and ASL is the combined assessment of ventilation and perfusion, providing information on ventilation/perfusion (V/Q) mismatch which may be more clinically relevant than perfusion deficits alone. See Figure 3 for representative perfusion maps and ventilation/perfusion match classification in cystic fibrosis. The usual free‐breathing protocols help reduce patient discomfort although free‐breathing protocols may also be feasible for DCE or ASL [83, 84]. Good agreement of visual scores of lung perfusion from Fourier decomposition with those from DCE has been demonstrated [85]. Absolute quantification of perfusion remains challenging despite recent progress [86].
Using phase‐resolved functional lung (PREFUL) MRI, the randomly acquired images are sorted to reconstruct a whole cardiac cycle with higher apparent temporal resolution of approximately 80 ms. This enables visualization and quantification of the pulse wave transit in the pulmonary arterial and venous system and quantification of the pulse wave velocity [87, 88, 89]. These novel markers are currently under investigation for monitoring and prognostication in patients with chronic lung disease.
The potential clinical applications of Fourier decomposition‐based MRI methods for studying lung perfusion are numerous. The longitudinal follow‐up in young patients with cystic fibrosis may be an important application given the concerns of potential long‐term consequences associated with repeated gadolinium injections [90]. Lung perfusion imaging in infants [41] with, for example, bronchopulmonary dysplasia or the potentially detection of pulmonary embolism in pregnant women are other clinically highly relevant examples.
3.4. 129Xe MRI
By virtue of its good solubility and large chemical shift range, hyperpolarized 129Xe may be detected after inhalation in membrane tissues (M) and red blood cells (RBC) because of diffusion into alveolar septa from the airspaces; see Figure 7. RBC signals thereby provide information on blood volume, being probably the MRI method most specific to pulmonary capillary blood. It has been suggested that the RBC signal in established protocols of 129Xe dissolved‐phase imaging is reflective of capillary volume [91] and reductions reflective of micro‐thrombi, for example, in dyspneic patients after COVID infection [92]. However, it can generally also be affected by the rate of diffusion through the alveolar membrane and may thus not always be easily interpretable in terms of perfusion or blood volume. More recent work uses time‐resolved spectroscopy of the 129Xe dissolved phase to assess the pulsatility of the RBC signal which likely primarily probes periodic volume changes of blood in capillaries [93]. Also, an imaging method for assessment of RBC signal pulsatility has been proposed [94]. The 129Xe chemical shift saturation recovery (CSSR) spectroscopy method to be described in more detail later may also provide information on the capillary transit time of blood [95] but thorough validation of this parameter with established physiological measurements is pending.
FIGURE 7.

MR spectroscopy reveals that besides the strong resonance associated with gaseous 129Xe, there are two smaller resonances associated with 129Xe in membrane tissues (M) and 129Xe in red blood cells (RBCs). This allows the selective probing of the individual compartments in the gas uptake process.
Although being in an early stage of development, there is promise for the noninvasive assessment of different forms of pulmonary hypertension through assessment of RBC pulsations in time‐resolved spectroscopy [96, 97]. A limitation in the evaluation of perfusion using 129Xe MRI, also applying to other structural and functional measures, is the fact that poorly ventilated regions are difficult to assess, at least in common protocols with inhalation of a single dose.
3.5. Contrast‐Enhanced CT
Different approaches exist to create iodine maps and thereby probe lung perfusion in CT scans after injection of iodinated contrast agents. Dual‐energy CT employing two X‐ray sources with energies of different distances to iodine's K edge may be used to estimate the iodine content. The ability to acquire images only after contrast administration poses an advantage in terms of radiation dose [98]. A technically simpler technique for perfusion assessment showing advantages in terms of beam‐hardening artifacts is to subtract images before contrast enhancement from those after contrast enhancement, which generally requires image registration due to unavoidable motion [99]. The new generation of photon‐counting CTs also facilitates computation of iodine and virtual native images, which can be combined with assessment of ventilation by acquiring images in inspiration and expiration [63]; see Figure 5. Generally, photon‐counting CT requires less dose and has superior image quality compared to conventional energy‐integrating detector CT, which opens up the opportunity for functional lung CT in the clinic. Providing V and Q maps with much higher image resolution, functional photon‐counting lung CT has the potential to replace V/Q SPECT for the diagnosis of chronic thromboembolic pulmonary hypertension [100]. Using area‐detector CT, it is also possible to obtain dynamic contrast enhancement in axial scanning for quantitative perfusion assessment similar to MRI [101], albeit with limited volumetric coverage.
3.6. SPECT
Clinically, SPECT imaging after injection of radioactively labeled particles is still considered the gold standard for detection of chronic pulmonary embolism [59]. One of the advantages of SPECT imaging with regard to assessment of perfusion is the ability to simultaneously assess ventilation and thereby evaluate the nature of a perfusion defect with regard to V/Q matching. A further advantage may be the fact that perfusion in small vessels can be selectively imaged by choosing the size of injected particles to be in the range of 15–100 μm [59]. Again, the limited spatial resolution and use of ionizing radiation are disadvantages, although radiation doses are still lower compared to perfusion CT [102].
4. Alveolar Membrane Function
Gas exchange may be considered the primary function of the lung. Diseases affecting the function of the alveolar membrane by interstitial thickening, such as pulmonary fibrosis, or by pulmonary edema, such as COVID‐19, are associated with a significant mortality.
Clinically, the test of carbon monoxide uptake for determination of the diffusing capacity of the lung (DLCO) is well established and routinely applied. Reductions of diffusing capacity may be observed, for example, in the presence of emphysema or lung fibrosis. Apart from the fact that the measurement of diffusing capacity for the whole lung may have limited sensitivity for regional changes, the cause of reduced diffusing capacity may be difficult to assess from established lung function tests. While a decomposition of diffusing capacity into a membrane and capillary volume part is possible in principle, few pulmonologists acquire such data, and the underlying Roughton–Forster model may not be as generally valid as was thought for a long time [103].
4.1. 129Xe MRI
Imaging tests may address the aforementioned limitations of clinical lung function tests. Apart from oxygen‐enhanced MRI, which is able to measure diffusion in combination with ventilation and perfusion, 129Xe MRI is the only imaging method that can truly assess gas uptake with specificity to the individual contributions of tissue thickening, reduction of surface area, ventilation distribution, and perfusion.
4.1.1. Dissolved‐Phase Imaging
As mentioned in the previous section, by virtue of xenon's good solubility in bodily fluids and 129Xe's large chemical shift range, hyperpolarized 129Xe MRI is able to track the fate of inhaled gas being taken up into the alveolar wall and transported away by the bloodstream. Compared to the established clinical test of carbon monoxide uptake, this may facilitate regional measurements of gas uptake efficiency, typically quantified as red blood cell/membrane ratio. It has also been proposed to model the clinically measured diffusing capacity by a decomposition into the contribution from membrane conductance and uptake into red blood cells and thereby derive this established quantity from 129Xe MRI [91].
Although imaging of the 129Xe dissolved phase was foreseen early [4], it is a relatively new technique and continues to evolve. Early work utilized the chemical shift displacement in the frequency‐encoding direction using Cartesian sampling to achieve a separation of signals from gas and dissolved phase [104]. Having the advantage of highly robust separation of phases, the method poses restrictions on minimum echo time and maximum receiver bandwidth. The latter also implies the disadvantage of a noticeable chemical shift artifact between red blood cells and membrane tissues, particularly in species like man with two clearly discernible dissolved‐phase resonances.
Later work used frequency‐selective excitation of the dissolved phase for suppression of the strong signal from gaseous 129Xe combined with radial trajectories. For best performance, RF pulses should be optimized for a given MRI system, for example, by varying their duration to account for distortions of the pulse shape created by the RF power amplifier, minimizing spurious excitation of gaseous 129Xe [105]. Methods for retrospective removal of artifacts from off‐resonant excitation have also been proposed [106]. Decomposition into signals originating from red blood cells and membrane tissues may then be achieved by methods similar to those used for water‐fat separation in 1H MRI [107, 108]. There is, however, no clear consensus yet whether single‐ or multi‐point Dixon techniques should be preferred.
Although dissolved‐phase imaging yields quantitative metrics after dividing signals through those from gas‐phase imaging, the ratios obtained are dependent on TR and flip angle [109] and do not take the temporal dynamics of gas uptake into account, thus showing a more qualitative picture of lung function. A further limitation is the still limited spatial resolution achievable both compared to 129Xe ventilation MRI and 1H MRI of the lung [110].
Patients of diseases primarily affecting the lung's interstitium like pulmonary fibrosis may benefit strongly from the information gained through a 129Xe dissolved‐phase MRI scan since sensitivity both to disease and patterns of local disease stage have been suggested [111]; see Figure 8. The method is also sensitive to changes caused by COVID‐19 during the resolution phase [92, 112, 113].
FIGURE 8.

(a) Anatomical virtual native CT images and (b) iodine maps in similar slice location as 129Xe dissolved‐phase ratio maps for M‐Gas (c) and RBC‐Gas (d) in a 73‐year‐old male patient with idiopathic pulmonary fibrosis. Heterogeneity of gas uptake is observed in both ratio maps. RBC, red blood cell, M, membrane tissues.
Although specific signatures have also been observed in obstructive disease and in the presence of pulmonary nodules [104, 108], the clinical value of the method may be less clear in these cases. Consideration of normal age‐related changes in gas uptake for disease detection in 129Xe dissolved‐phase MRI is still a field of ongoing research despite recent progress [114]. Apart from diagnostic applications, the method may be a useful research tool for clinical studies employing models of lung inflammation, for example, for testing of drug efficacy [115].
4.1.2. Chemical Shift Saturation Recovery
Chemical shift saturation recovery (CSSR) MR spectroscopy is an alternative approach for studying gas exchange and structure of alveolar septa. The sequence destroys the magnetization within the dissolved phase using saturation pulses and measures subsequent signal buildup, see Figure 9. For short delay times up to ~100 ms, the signal evolution may be approximated by diffusion within a one‐dimensional rod, showing the process of 129Xe filling the alveolar septa from the interfaces with the gas phase. The signal evolution at later times becomes dominated by the influence of blood flow. Various models have been developed for obtaining quantitative estimates of microstructural parameters like septal thickness, surface–volume ratio, and barrier thickness from CSSR data [95, 97, 116]. Validation of parameters obtained by comparison to histology has so far been limited to animal studies after the creation of clear pathology [117]. Based on numerical simulations, a limitation of these simplistic 1D models is that they do not account for the heterogeneity of lung microstructure, for example, in fibrotic lung disease [118].
FIGURE 9.

(a) 129Xe chemical shift saturation recovery (CSSR) sequence diagram and (b) uptake curves (ratio F of dissolved 129Xe over gaseous 129Xe) with model of xenon exchange (MOXE) fits in a healthy 29‐year‐old male volunteer and (c) a 73‐year‐old male patient with idiopathic pulmonary fibrosis. At short delay times, gas uptake is thought to be dominated by the lung surface–volume ratio. At intermediate delay times, uptake curves have a kink thought to be associated with the saturation of alveolar septa. Increased F at higher delay times is thought to be a consequence of blood flow. Increased septal thickness (15.4 μm vs. 8.1 μm) is apparent in the data from the fibrosis patient.
Being originally developed as a spectroscopy sequence without spatially selective excitation, the method yielded no information on the regional distribution of the parameters. Various strategies have been developed in recent years to obtain regional information, either by use of multi‐channel coils with spatially varying sensitivity [119] or by addition of imaging gradients to the sequence with strategies for acceleration like a Look–Locker‐type acquisition [120]. Such a rapid acquisition also facilitates time‐resolved CSSR measurements, providing new insights into lung physiology [121].
The sensitivity of septal wall thickness derived from CSSR even to subclinical changes has been shown both by its age dependence [122] and its potential to discriminate apparently healthy smokers from healthy subjects [123]. A clinically relevant application could be the monitoring of patients suffering from pulmonary fibrosis [122].
5. Microstructure
Although imaging of the lung microstructure in the sense of mapping of microstructural parameters may not be functional imaging in a strict sense, it has strong implications for lung function in a variety of ways. A number of imaging tools are available to show various aspects of lung microstructure at the sub‐voxel length scale in the form of parameter maps.
5.1. Diffusion‐Weighted MRI of Inhaled Tracers
Gas transport within the lung is based both on convection and diffusion, with the diffusional component predominating in the smallest airways [124]. Paradoxically, while emphysema reduces the surface area of the lung, reducing its capacity for gas exchange, the destruction of alveolar walls improves diffusive gas transport in the lowest airway generations compared to the healthy lung, as evidenced by increased apparent diffusion coefficients (ADC) of inhaled tracer gases [125]. This is thought to provide a natural protection mechanism against the effects of mild emphysema [126].
5.1.1. ADC Mapping
Technically, mapping of the ADC of inhaled tracer gases is typically performed using gradient‐echo based sequences employing a pair of bipolar gradients for diffusion sensitization. The fact that the magnetization of inhaled hyperpolarized gases diminishes throughout the measurement poses special requirements which make diffusion‐weighted spin‐echo sequences common in 1H MRI less useful. Further, the fact that diffusion‐weighted and unweighted acquisitions do not have equal starting magnetizations frequently makes a second unweighted acquisition necessary for compensation.
Due to the great differences between free diffusion coefficients of the common tracer gases 3He, 129Xe and fluorinated gases, ADCs obtained at equal diffusion time are sensitive to different aspects of lung microstructure [127]. In particular, the ADC obtained at short diffusion times and low free diffusion coefficients corresponding to short diffusive length scales can be expected to be related mainly to the surface–volume ratio of lung air spaces, while at higher length scales airway tortuosity is expected to come into play [127].
While emphysema detection could be a clinical application of ADC mapping of inhaled gases, CT is more widely available and the associated ionizing radiation is of less concern in patients typically of advanced age where emphysema could be suspected. The assessment of airspace enlargement in bronchopulmonary dysplasia may be a clinically relevant application [128]. Due to the strong correlation with surface–volume ratio—at least on a whole‐lung level—ADC measurements are an interesting method for assessing, for example, age‐related structural changes in vivo [129]; see Figure 10.
FIGURE 10.

Hyperpolarized gas images with negligible diffusion weighting (b0) (a), apparent diffusion coefficient (ADC) maps (b), and ADC histograms (c) in a healthy child and two healthy adults. An increase in 129Xe ADC with age is apparent, suggesting an increase in airspace sizes in the growing lung. Reproduced with permission from [129]. F, female; M, male.
5.1.2. Microstructure Quantification Using Multiple b‐Value Experiments
Quantitative estimates for structural dimensions of acinar airways may be obtained from gradient‐echo based diffusion‐weighted images using models such as the cylinder model developed by Yablonskiy et al. [130]. The non‐monoexponential decay of the MR signal of 3He or 129Xe in a multiple b‐value experiment is modeled by approximating airways as infinitely long cylinders, for which an equation describing the signal decay in terms of transverse and longitudinal diffusivities in closed form is known. Assuming a cylindrical airway geometry with alveolar sleeves, longitudinal and transverse diffusivities may be modeled in terms of microstructural parameters like the radius of acinar airways and alveolar sleeve depth [131].
The parameters may be used to obtain an estimate on mean chord length, also called mean linear intercept, which is a frequently used histological measurement. Excellent agreement between mean chord length estimated from 3He MRI and mean chord length from histology has been observed in a study with 6 human lung explants [132]. A limitation of the model is the assumption of a geometry representative of healthy human lung such that results obtained in disease may be difficult to interpret. It has also been suggested that airway branching in actual airways may affect the results [133]. Limitations with respect to potential clinical application are the high SNR requirement and relatively long acquisition time.
Consequently, the method may be more suitable to gain insights into lung physiology, for example, with respect to structural changes during respiration [134] or due to aging [135]; see Figure 11.
FIGURE 11.

Alveolar duct radius R and alveolar sleeve depth h at multiple lung inflation levels (residual volume [RV] plus 1 L, functional residual capacity [FRC] plus 1 L and total lung capacity [TLC]) in a healthy volunteer. A reduction in the alveolar sleeve depth and an increase in the alveolar duct radius are observed. The relatively small magnitude of the increase in R may suggest alveolar recruitment as a relevant mechanism during respiration. Reproduced with permission from [134].
Another approach for deriving microstructural estimates from multiple b‐value experiments is based on the stretched exponential model. It is assumed that a voxel contains spins able to diffuse over different length scales during the experimental diffusion time Δ corresponding to a distribution of apparent diffusion coefficients D. By further assuming and fitting a stretched exponential signal decay S(b) = S 0 exp (−(b DDC) α ) with distributed diffusivity DDC and heterogeneity index α, the local distribution of diffusivities within a voxel may be obtained relating to a distribution of length scales L D via the dependence L D = (2ΔD)1/2. This allows the computation of an average length scale L m,D, which, however, is not directly interpretable in terms of standard histological quantities. It appears, however, to be consistently related with mean chord length estimated from the cylinder model in different diseases [136], although a differing relationship was observed at a different magnetic field strength [137]. The fact that no assumptions about the geometry of lung tissue are made may be an advantage over the cylinder model, although results may not be interpretable as easily.
As mentioned, the stretched exponential model has been applied in a range of diseases including COPD, asthma, and idiopathic pulmonary fibrosis [136]. It may be helpful in the characterization of patients, for example, for clinical studies or in studies with disease models in preclinical imaging [138].
5.1.3. Microstructure Quantification Using Multiple Diffusion Time Experiments
As previously mentioned, the ADC of inhaled tracer gases at very short diffusive length scales is expected to depend linearly on the surface–volume ratio of lung airspaces. This is thought to apply to fluorinated gas MRI quite generally and to 129Xe MRI at sub‐millisecond diffusion times [127, 139]. Achievement of low enough diffusion times is technically challenging, especially at high surface–volume ratios; however, such that the introduction of higher‐order terms in the analysis of experiments involving 129Xe MRI at multiple diffusion times for surface–volume estimation may be necessary [140]. A relatively good agreement between surface–volume ratio obtained from 129Xe MRI and 19F MRI has been observed in patients of COPD [141]; see Figure 12. The fact that no assumptions on the underlying airway geometry are made may be an advantage of this method over the more established cylinder model applied to multiple b‐value experiments.
FIGURE 12.
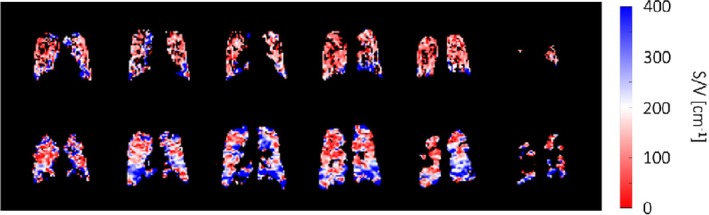
Measurement of the lung surface–volume (S/V) ratio using 19F (top row) and 129Xe (bottom row) diffusion‐weighted MR imaging at variable diffusion time in a patient with chronic obstructive pulmonary disease, forced expiratory volume in 1 s 63% of predicted value. Reproduced from [141], published under the terms of a Creative Commons Attribution License, https://creativecommons.org/licenses/by/4.0/.
5.2. UTE MRI
Given the short transverse relaxation times of lung tissue at clinical field strengths as a consequence of the numerous air‐tissue interfaces and associated susceptibility jumps, great improvements of signal intensity in 1H MRI of the lung can be achieved by going to shorter echo times. Images acquired at ultra‐short echo time (UTE) are typically obtained in the form of 3D volumes and quality may come close to those of structural images obtained from CT despite still impaired resolution; see Figure 13. Apparent transverse relaxation rates measured by multi‐echo UTE are sensitive to tissue destruction and are able to differentiate disease severity in COPD [143].
FIGURE 13.

Ultra‐short echo time (UTE) MRI and CT imaging in a healthy control and patients with cystic fibrosis (CF) obtained at functional residual capacity (FRC). Most features apparent on CT can also be observed in UTE MRI. Reprinted with permission of the American Thoracic Society [142]. Copyright © 2016 American Thoracic Society. All rights reserved. Annals of the American Thoracic Society is an official journal of the American Thoracic Society.
A natural clinical application of UTE MRI for structural assessment could be longitudinal monitoring of bronchopulmonary dysplasia or cystic fibrosis lung disease where, for example, mucus plugging, bronchiectasis, or ground‐glass opacities may be detected [142].
5.3. CT
CT imaging produces high‐resolution images of the lung in exquisite detail compared to other medical imaging modalities but still shows the lung parenchyma as a homogeneous tissue without resolving its microstructure. Yet, given the fact that the average thickness of alveolar septa is only weakly changed in a number of lung diseases, there may be a strong correlation between radiodensity on CT in Hounsfield units and the surface–volume ratio as evidenced in previous studies comparing imaging results with histology in emphysema [144]. Further, the dimensions of airways resolvable with CT were found to be predictive for small airway dimensions below the resolution limit [145]. More qualitatively, the extent of emphysema may be quantified by the fraction of lung tissue with density below −950 HU in inspiration [62].
5.4. Dark‐Field X‐Ray Imaging
The introduction of grating interferometers to the field of X‐ray dark‐field imaging has facilitated the construction of dark‐field imaging devices using conventional X‐ray tubes, thus being associated with low technical complexity and potentially low cost in a future commercial setting. Being sensitive to fluctuations of tissue density on a nanometer to micrometer scale, the imaging method shows strong contrast between, for example, lung tissue and bones compared to surrounding tissues.
An important potential clinical application of this technique could be the detection of emphysema [146], given the potentially improved sensitivity over chest X‐ray and reduced radiation dose compared to CT; see Figure 14. Yet, reduced signal in dark‐field imaging of the chest is not specific to emphysema as it may also be caused by fibrosis, for instance [147]. Recently, it has been shown that dark‐field signal intensity is affected by lung inflation level with maybe somewhat unexpectedly increasing signal at higher inflation level post‐mortem [148]. This was explained by an opening of additional alveoli at higher inflation levels although the surface–volume ratio is generally expected to decrease at increased lung inflation. More work seems necessary to obtain a thorough understanding of dark‐field signal intensity in terms of established histological quantities. Current developments will enable also clinical dark‐field CT studies with human patients in the near future.
FIGURE 14.

Conventional chest X‐ray and dark‐field X‐ray image (a/b) in a subject with chronic obstructive pulmonary disease with results from spirometry (c) and CT images (d). Emphysematous regions are readily apparent in the dark‐field X‐ray image but hard to see on conventional chest X‐ray. Reproduced from [146], published under the terms of a Creative Commons Attribution License, https://creativecommons.org/licenses/by/4.0/. COPD, chronic obstructive pulmonary disease; DLCO SB, diffusing capacity of the lung for carbon monoxide measured in a single breath; FEV1, forced expiratory volume in 1 s; FVC, forced vital capacity; GOLD, global initiative for chronic obstructive lung disease.
6. Summary and Outlook
Great advances have been made to develop and translate quantitative functional lung imaging tools to improve diagnosis, monitoring, and prognostication of patients with lung disease. A great variety of methods exists for functional imaging of the lung, each with its own strengths and weaknesses. While some methods are well‐established clinically and well understood in terms of the underlying contrast mechanisms, others have so far not left the experimental stage and may require more validation before routine application is possible.
In particular, there appears to be a number of experimental MRI methods with great potential for clinical application. Progress in this regard is likely associated with commercialization by companies which take the efforts to develop methods technically ready for the clinic and solve regulatory issues. As an example, the recent approval of hyperpolarized 129Xe for imaging of ventilation by the United States Food and Drug Administration is an important step in the right direction, although a number of issues like the regulatory situation in other countries and the technical complexity remain.
The need for functional pulmonary imaging both for clinical and clinical research applications is likely to increase in the decades to come as a result of the increasing prevalence of lung diseases and the associated urgent need for the development of novel therapies. From a scientific perspective, many aspects of lung function are still to be elucidated, and medical imaging has most likely an important role to play here due to its noninvasive nature and methodological versatility. Consequently, the future of the field of functional pulmonary imaging is bright!
Kern A. L., Klimeš F., Voskrebenzev A., Shin H.‐O., and Vogel‐Claussen J., “Functional Pulmonary Imaging,” Journal of Magnetic Resonance Imaging 62, no. 4 (2025): 986–1008, 10.1002/jmri.29778.
Funding: This work was supported by Deutsches Zentrum für Lungenforschung.
References
- 1. World Health Organization , “The Top 10 Causes of Death,” (2020), https://www.who.int/news‐room/fact‐sheets/detail/the‐top‐10‐causes‐of‐death.
- 2. Gehr P., Bachofen M., and Weibel E. R., “The Normal Human Lung: Ultrastructure and Morphometric Estimation of Diffusion Capacity,” Respiration Physiology 32 (1978): 121–140. [DOI] [PubMed] [Google Scholar]
- 3. Grote J., “Die Sauerstoffdiffusionskonstanten im Lungengewebe und Wasser und ihre Temperaturabhängigkeit,” Pflügers Archiv für die Gesamte Physiologie des Menschen und der Tiere 295 (1967): 245–254. [PubMed] [Google Scholar]
- 4. Albert M. S., Cates G. D., Driehuys B., et al., “Biological Magnetic Resonance Imaging Using Laser‐Polarized 129Xe,” Nature 370, no. 6486 (1994): 199–201, 10.1038/370199a0. [DOI] [PubMed] [Google Scholar]
- 5. Kauczor H.‐U., Ebert M., Kreitner K.‐F., et al., “Imaging of the Lungs Using 3He MRI: Preliminary Clinical Experience in 18 Patients With and Without Lung Disease,” Journal of Magnetic Resonance Imaging 7 (1997): 538–543. [DOI] [PubMed] [Google Scholar]
- 6. de Lange E. E., Mugler J. P., Brookeman J. R., et al., “Lung Air Spaces: MR Imaging Evaluation With Hyperpolarized 3He Gas,” Radiology 210, no. 3 (1999): 851–857, 10.1148/radiology.210.3.r99fe08851. [DOI] [PubMed] [Google Scholar]
- 7. Mugler J. P., “MRI Acquisition Techniques,” in Hyperpolarized and Inert Gas MRI, ed. Albert M. S. and Hane F. T. (Elsevier, 2017), 1–21. [Google Scholar]
- 8. Kern A. L. and Vogel‐Claussen J., “Hyperpolarized Gas MRI in Pulmonology,” British Journal of Radiology 91 (2018): 20170647. [DOI] [PMC free article] [PubMed] [Google Scholar]
- 9. Lu J., Wang Z., Bier E., Leewiwatwong S., Mummy D., and Driehuys B., “Bias Field Correction in Hyperpolarized 129Xe Ventilation MRI Using Templates Derived by RF‐Depolarization Mapping,” Magnetic Resonance in Medicine 88 (2022): 802–816. [DOI] [PMC free article] [PubMed] [Google Scholar]
- 10. Astley J. R., Biancardi A. M., Marshall H., et al., “A Dual‐Channel Deep Learning Approach for Lung Cavity Estimation From Hyperpolarized Gas and Proton MRI,” Journal of Magnetic Resonance Imaging 57 (2023): 1878–1890. [DOI] [PMC free article] [PubMed] [Google Scholar]
- 11. Rao M. and Wild J. M., “RF Instrumentation for Same‐Breath Triple Nuclear Lung MR Imaging of 1H and Hyperpolarized 3He and 129Xe at 1.5T,” Magnetic Resonance in Medicine 75 (2016): 1841–1848. [DOI] [PMC free article] [PubMed] [Google Scholar]
- 12. Meyerspeer M., Magill A. W., Kuehne A., Gruetter R., Moser E., and Schmid A. I., “Simultaneous and Interleaved Acquisition of NMR Signals From Different Nuclei With a Clinical MRI Scanner,” Magnetic Resonance in Medicine 76 (2016): 1636–1641. [DOI] [PMC free article] [PubMed] [Google Scholar]
- 13. Kirby M., Svenningsen S., Owrangi A., et al., “Hyperpolarized 3He and 129Xe MR Imaging in Healthy Volunteers and Patients With Chronic Obstructive Pulmonary Disease,” Radiology 265, no. 2 (2012): 600–610, 10.1148/radiol.12120485. [DOI] [PubMed] [Google Scholar]
- 14. Lin N. Y., Roach D. J., Willmering M. M., et al., “ 129Xe MRI as a Measure of Clinical Disease Severity for Pediatric Asthma,” Journal of Allergy and Clinical Immunology 147 (2021): 2146–2153.e1. [DOI] [PubMed] [Google Scholar]
- 15. Marshall H., Horsley A., Taylor C. J., et al., “Detection of Early Subclinical Lung Disease in Children With Cystic Fibrosis by Lung Ventilation Imaging With Hyperpolarised Gas MRI,” Thorax 72 (2017): 760–762. [DOI] [PubMed] [Google Scholar]
- 16. Svenningsen S., Eddy R. L., Lim H. F., Cox P. G., Nair P., and Parraga G., “Sputum Eosinophilia and Magnetic Resonance Imaging Ventilation Heterogeneity in Severe Asthma,” American Journal of Respiratory and Critical Care Medicine 197 (2018): 876–884. [DOI] [PubMed] [Google Scholar]
- 17. Rayment J. H., Couch M. J., McDonald N., et al., “Hyperpolarised 129Xe Magnetic Resonance Imaging to Monitor Treatment Response in Children With Cystic Fibrosis,” European Respiratory Journal 53 (2019): 1802188. [DOI] [PubMed] [Google Scholar]
- 18. Hamedani H., Kadlecek S., Ruppert K., Xin Y., Duncan I., and Rizi R. R., “Ventilation Heterogeneity Imaged by Multibreath Wash‐Ins of Hyperpolarized 3He and 129Xe in Healthy Rabbits,” Journal of Physiology 599 (2021): 4197–4223. [DOI] [PMC free article] [PubMed] [Google Scholar]
- 19. Morgado F., Couch M. J., Stirrat E., and Santyr G., “Effect of T1 Relaxation on Ventilation Mapping Using Hyperpolarized 129Xe Multiple Breath Wash‐Out Imaging,” Magnetic Resonance in Medicine 80 (2018): 2670–2680. [DOI] [PubMed] [Google Scholar]
- 20. Horn F. C., Rao M., Stewart N. J., and Wild J. M., “Multiple Breath Washout of Hyperpolarized 129Xe and 3He in Human Lungs With Three‐Dimensional Balanced Steady‐State Free‐Precession Imaging,” Magnetic Resonance in Medicine 77 (2017): 2288–2295. [DOI] [PMC free article] [PubMed] [Google Scholar]
- 21. Kauczor H. U., Chen X. J., van Beek E. J. R., and Schreiber W. G., “Pulmonary Ventilation Imaged by Magnetic Resonance: At the Doorstep of Clinical Application,” European Respiratory Journal 17 (2001): 1008–1023. [DOI] [PubMed] [Google Scholar]
- 22. Stewart N. J., Norquay G., Griffiths P. D., and Wild J. M., “Feasibility of Human Lung Ventilation Imaging Using Highly Polarized Naturally Abundant Xenon and Optimized Three‐Dimensional Steady‐State Free Precession,” Magnetic Resonance in Medicine 74 (2015): 346–352. [DOI] [PubMed] [Google Scholar]
- 23. Driehuys B., Martinez‐Jimenez S., Cleveland Z. I., et al., “Chronic Obstructive Pulmonary Disease: Safety and Tolerability of Hyperpolarized 129Xe MR Imaging in Healthy Volunteers and Patients,” Radiology 262 (2012): 279–289. [DOI] [PMC free article] [PubMed] [Google Scholar]
- 24. Rinck P., Petersen S., and Lauterbur P., “NMR‐Imaging Von Fluorhaltigen Substanzen,” RöFo – Fortschritte Auf Dem Gebiet der Röntgenstrahlen Und der Bildgeb Verfahren 140 (1984): 239–243. [DOI] [PubMed] [Google Scholar]
- 25. Gutberlet M., Kaireit T. F., Voskrebenzev A., et al., “Free‐Breathing Dynamic 19F Gas MR Imaging for Mapping of Regional Lung Ventilation in Patients With COPD,” Radiology 286, no. 3 (2018): 1040–1051, 10.1148/radiol.2017170591. [DOI] [PubMed] [Google Scholar]
- 26. Gutberlet M., Kaireit T. F., Voskrebenzev A., et al., “Repeatability of Regional Lung Ventilation Quantification Using Fluorinated (19F) Gas Magnetic Resonance Imaging,” Academic Radiology 26 (2019): 395–403. [DOI] [PubMed] [Google Scholar]
- 27. Goralski J. L., Chung S. H., Glass T. M., et al., “Dynamic Perfluorinated Gas MRI Reveals Abnormal Ventilation Despite Normal FEV1 in Cystic Fibrosis,” JCI Insight 5 (2020): e133400. [DOI] [PMC free article] [PubMed] [Google Scholar]
- 28. Obert A. J., Gutberlet M., Kern A. L., et al., “ 1H‐Guided Reconstruction of 19F Gas MRI in COPD Patients,” Magnetic Resonance in Medicine 84, no. 3 (2020): 1336–1346, 10.1002/mrm.28209. [DOI] [PubMed] [Google Scholar]
- 29. Shepelytskyi Y., Li T., Grynko V., Newman C., Hane F. T., and Albert M. S., “Evaluation of Fluorine‐19 Magnetic Resonance Imaging of the Lungs Using Octafluorocyclobutane in a Rat Model,” Magnetic Resonance in Medicine 85 (2021): 987–994. [DOI] [PMC free article] [PubMed] [Google Scholar]
- 30. Bauman G., Puderbach M., Deimling M., et al., “Non‐Contrast‐Enhanced Perfusion and Ventilation Assessment of the Human Lung by Means of Fourier Decomposition in Proton MRI,” Magnetic Resonance in Medicine 62, no. 3 (2009): 656–664, 10.1002/mrm.22031. [DOI] [PubMed] [Google Scholar]
- 31. Zapke M., Topf H.‐G., Zenker M., et al., “Magnetic Resonance Lung Function – A Breakthrough for Lung Imaging and Functional Assessment? A Phantom Study and Clinical Trial,” Respiratory Research 7 (2006): 106. [DOI] [PMC free article] [PubMed] [Google Scholar]
- 32. Voskrebenzev A., Gutberlet M., Klimeš F., et al., “Feasibility of Quantitative Regional Ventilation and Perfusion Mapping With Phase‐Resolved Functional Lung (PREFUL) MRI in Healthy Volunteers and COPD, CTEPH, and CF Patients,” Magnetic Resonance in Medicine 79 (2018): 2306–2314. [DOI] [PubMed] [Google Scholar]
- 33. Mendes Pereira L., Wech T., Weng A. M., et al., “UTE‐SENCEFUL: First Results for 3D High‐Resolution Lung Ventilation Imaging,” Magnetic Resonance in Medicine 81 (2019): 2464–2473. [DOI] [PubMed] [Google Scholar]
- 34. Vogel‐Claussen J., Kaireit T. F., Voskrebenzev A., et al., “Phase‐Resolved Functional Lung (PREFUL) MRI–Derived Ventilation and Perfusion Parameters Predict Future Lung Transplant Loss,” Radiology 307 (2023): e221958. [DOI] [PubMed] [Google Scholar]
- 35. Voskrebenzev A., Kaireit T. F., Klimeš F., et al., “PREFUL MRI Depicts Dual Bronchodilator Changes in COPD: A Retrospective Analysis of a Randomized Controlled Trial,” Radiology: Cardiothoracic Imaging 4 (2022): e210147. [DOI] [PMC free article] [PubMed] [Google Scholar]
- 36. Kaireit T. F., Kern A., Voskrebenzev A., et al., “Flow Volume Loop and Regional Ventilation Assessment Using Phase‐Resolved Functional Lung (PREFUL) MRI: Comparison With 129 Xenon Ventilation MRI and Lung Function Testing,” Journal of Magnetic Resonance Imaging 53, no. 4 (2021): 1092–1105, 10.1002/jmri.27452. [DOI] [PubMed] [Google Scholar]
- 37. Marshall H., Voskrebenzev A., Smith L. J., et al., “ 129Xe and Free‐Breathing 1H Ventilation MRI in Patients With Cystic Fibrosis: A Dual‐Center Study,” Journal of Magnetic Resonance Imaging 57, no. 6 (2023): 1908–1921, 10.1002/jmri.28470. [DOI] [PMC free article] [PubMed] [Google Scholar]
- 38. Voskrebenzev A., Gutberlet M., Kaireit T. F., Wacker F., and Vogel‐Claussen J., “Low‐Pass Imaging of Dynamic Acquisitions (LIDA) With a Group‐Oriented Registration (GOREG) for Proton MR Imaging of Lung Ventilation,” Magnetic Resonance in Medicine 78 (2017): 1496–1505. [DOI] [PubMed] [Google Scholar]
- 39. Klimeš F., Voskrebenzev A., Gutberlet M., Grimm R., Wacker F., and Vogel‐Claussen J., “Evaluation of Image Registration Algorithms for 3D Phase‐Resolved Functional Lung Ventilation Magnetic Resonance Imaging in Healthy Volunteers and Chronic Obstructive Pulmonary Disease Patients,” NMR in Biomedicine 36 (2023): e4860. [DOI] [PubMed] [Google Scholar]
- 40. Munidasa S., Couch M. J., Rayment J. H., et al., “Free‐Breathing MRI for Monitoring Ventilation Changes Following Antibiotic Treatment of Pulmonary Exacerbations in Paediatric Cystic Fibrosis,” European Respiratory Journal 57 (2021): 2003104. [DOI] [PubMed] [Google Scholar]
- 41. Zanette B., Schrauben E. M., Munidasa S., et al., “Clinical Feasibility of Structural and Functional MRI in Free‐Breathing Neonates and Infants,” Journal of Magnetic Resonance Imaging 55, no. 6 (2022): 1696–1707, 10.1002/jmri.28165. [DOI] [PubMed] [Google Scholar]
- 42. Moher Alsady T., Voskrebenzev A., Greer M., et al., “MRI‐Derived Regional Flow‐Volume Loop Parameters Detect Early‐Stage Chronic Lung Allograft Dysfunction,” Journal of Magnetic Resonance Imaging 50 (2019): 1873–1882. [DOI] [PubMed] [Google Scholar]
- 43. Capaldi D. P. I., Sheikh K., Guo F., et al., “Free‐Breathing Pulmonary 1H and Hyperpolarized 3He MRI: Comparison in COPD and Bronchiectasis,” Academic Radiology 22 (2015): 320–329. [DOI] [PubMed] [Google Scholar]
- 44. Capaldi D. P. I., Sheikh K., Eddy R. L., et al., “Free‐Breathing Functional Pulmonary MRI: Response to Bronchodilator and Bronchoprovocation in Severe Asthma,” Academic Radiology 24 (2017): 1268–1276. [DOI] [PubMed] [Google Scholar]
- 45. Kjørstad Å., Corteville D. M. R., Henzler T., et al., “Quantitative Lung Ventilation Using Fourier Decomposition MRI; Comparison and Initial Study,” Magnetic Resonance Materials in Physics, Biology and Medicine 27 (2014): 467–476. [DOI] [PubMed] [Google Scholar]
- 46. Theilmann R. J., Arai T. J., Samiee A., et al., “Quantitative MRI Measurement of Lung Density Must Account for the Change in T2* With Lung Inflation,” Journal of Magnetic Resonance Imaging 30 (2009): 527–534. [DOI] [PMC free article] [PubMed] [Google Scholar]
- 47. Chassagnon G., Martin C., Marini R., et al., “Use of Elastic Registration in Pulmonary MRI for the Assessment of Pulmonary Fibrosis in Patients With Systemic Sclerosis,” Radiology 291 (2019): 487–492. [DOI] [PubMed] [Google Scholar]
- 48. Voskrebenzev A., Gutberlet M., Klimeš F., et al., “A Synthetic Lung Model (ASYLUM) for Validation of Functional Lung Imaging Methods Shows Significant Differences Between Signal‐Based and Deformation‐Field‐Based Ventilation Measurements,” Frontiers in Medicine 11 (2024): 1418052, 10.3389/fmed.2024.1418052. [DOI] [PMC free article] [PubMed] [Google Scholar]
- 49. Klimeš F., Voskrebenzev A., Gutberlet M., et al., “3D Phase‐Resolved Functional Lung Ventilation MR Imaging in Healthy Volunteers and Patients With Chronic Pulmonary Disease,” Magnetic Resonance in Medicine 85 (2021): 912–925. [DOI] [PubMed] [Google Scholar]
- 50. Boucneau T., Fernandez B., Larson P., Darrasse L., and Maître X., “3D Magnetic Resonance Spirometry,” Scientific Reports 10 (2020): 9649. [DOI] [PMC free article] [PubMed] [Google Scholar]
- 51. Klimeš F., Obert A. J., Scheller J., et al., “Comparison of Free‐Breathing 3D Phase‐Resolved Functional Lung (PREFUL) MRI With Dynamic 19F Ventilation MRI in Patients With Obstructive Lung Disease and Healthy Volunteers,” Journal of Magnetic Resonance Imaging 60 (2024): 1416–1431. [DOI] [PubMed] [Google Scholar]
- 52. Klimeš F., Plummer J. W., Willmering M. M., et al., “Quantifying Spatial and Dynamic Lung Abnormalities With 3D PREFUL FLORET UTE Imaging: A Feasibility Study,” Magnetic Resonance in Medicine 93 (2025): 1984–1998. [DOI] [PMC free article] [PubMed] [Google Scholar]
- 53. Klimeš F., Kern A. L., Voskrebenzev A., et al., “Free‐Breathing 3D Phase‐Resolved Functional Lung MRI vs Breath‐Hold Hyperpolarized 129Xe Ventilation MRI in Patients With Chronic Obstructive Pulmonary Disease and Healthy Volunteers,” European Radiology 35, no. 2 (2024): 943–956, 10.1007/s00330-024-10893-3. [DOI] [PMC free article] [PubMed] [Google Scholar]
- 54. Jakob P. M., Wang T., Schultz G., Hebestreit H., Hebestreit A., and Hahn D., “Assessment of Human Pulmonary Function Using Oxygen‐Enhanced T1 Imaging in Patients With Cystic Fibrosis,” Magnetic Resonance in Medicine 51 (2004): 1009–1016. [DOI] [PubMed] [Google Scholar]
- 55. Ohno Y., Iwasawa T., Seo J. B., et al., “Oxygen‐Enhanced Magnetic Resonance Imaging Versus Computed Tomography,” American Journal of Respiratory and Critical Care Medicine 177 (2008): 1095–1102. [DOI] [PubMed] [Google Scholar]
- 56. Sá R. C., Cronin M. V., Cortney Henderson A., et al., “Vertical Distribution of Specific Ventilation in Normal Supine Humans Measured by Oxygen‐Enhanced Proton MRI,” Journal of Applied Physiology 109 (2010): 1950–1959. [DOI] [PMC free article] [PubMed] [Google Scholar]
- 57. Xu P., Meersmann T., Wang J., and Wang C., “Review of Oxygen‐Enhanced Lung MRI: Pulse Sequences for Image Acquisition and T1 Measurement,” Medical Physics 50 (2023): 5987–6007. [DOI] [PubMed] [Google Scholar]
- 58. Jögi J., Jonson B., Ekberg M., and Bajc M., “Ventilation–Perfusion SPECT With 99m Tc‐DTPA Versus Technegas: A Head‐to‐Head Study in Obstructive and Nonobstructive Disease,” Journal of Nuclear Medicine 51 (2010): 735–741. [DOI] [PubMed] [Google Scholar]
- 59. Bajc M. and Lindqvist A., “Ventilation/Perfusion SPECT Imaging—Diagnosing Other Cardiopulmonary Diseases Beyond Pulmonary Embolism,” Seminars in Nuclear Medicine 49 (2019): 4–10. [DOI] [PubMed] [Google Scholar]
- 60. Chae E. J., Seo J. B., Goo H. W., et al., “Xenon Ventilation CT With a Dual‐Energy Technique of Dual‐Source CT: Initial Experience,” Radiology 248, no. 2 (2008): 615–624, 10.1148/radiol.2482071482. [DOI] [PubMed] [Google Scholar]
- 61. Hegi‐Johnson F., Keall P., Barber J., Bui C., and Kipritidis J., “Evaluating the Accuracy of 4D‐CT Ventilation Imaging: First Comparison With Technegas SPECT Ventilation,” Medical Physics 44 (2017): 4045–4055. [DOI] [PubMed] [Google Scholar]
- 62. Pompe E., van Rikxoort E. M., Schmidt M., et al., “Parametric Response Mapping Adds Value to Current Computed Tomography Biomarkers in Diagnosing Chronic Obstructive Pulmonary Disease,” American Journal of Respiratory and Critical Care Medicine 191 (2015): 1084–1086. [DOI] [PubMed] [Google Scholar]
- 63. Scharm S. C., Schaefer‐Prokop C., Winther H. B., et al., “Regional Pulmonary Morphology and Function: Photon‐Counting CT Assessment,” Radiology 308 (2023): e230318. [DOI] [PubMed] [Google Scholar]
- 64. Konstantinides S. V., Meyer G., Becattini C., et al., “2019 ESC Guidelines for the Diagnosis and Management of Acute Pulmonary Embolism Developed in Collaboration With the European Respiratory Society (ERS),” European Heart Journal 41 (2020): 543–603. [DOI] [PubMed] [Google Scholar]
- 65. Sourbron S. P. and Buckley D. L., “Classic Models for Dynamic Contrast‐Enhanced MRI,” NMR in Biomedicine 26 (2013): 1004–1027. [DOI] [PubMed] [Google Scholar]
- 66. Veldhoen S., Oechsner M., Fischer A., et al., “Dynamic Contrast‐Enhanced Magnetic Resonance Imaging for Quantitative Lung Perfusion Imaging Using the Dual‐Bolus Approach,” Investigative Radiology 51 (2016): 186–193. [DOI] [PubMed] [Google Scholar]
- 67. Kanda T., Ishii K., Kawaguchi H., Kitajima K., and Takenaka D., “High Signal Intensity in the Dentate Nucleus and Globus Pallidus on Unenhanced T1‐Weighted MR Images: Relationship With Increasing Cumulative Dose of a Gadolinium‐Based Contrast Material,” Radiology 270 (2014): 834–841. [DOI] [PubMed] [Google Scholar]
- 68. Juluru K., Vogel‐Claussen J., Macura K. J., Kamel I. R., Steever A., and Bluemke D. A., “Quality Initiatives MR Imaging in Patients at Risk for Developing Nephrogenic Systemic Fibrosis: Protocols, Practices, and Imaging Techniques to Maximize Patient Safety,” Radiographics 29 (2009): 9–22. [DOI] [PubMed] [Google Scholar]
- 69. Brünjes R. and Hofmann T., “Anthropogenic Gadolinium in Freshwater and Drinking Water Systems,” Water Research 182 (2020): 115966. [DOI] [PMC free article] [PubMed] [Google Scholar]
- 70. Ishii M., Emami K., Kadlecek S., et al., “Hyperpolarized 13C MRI of the Pulmonary Vasculature and Parenchyma,” Magnetic Resonance in Medicine 57 (2007): 459–463. [DOI] [PubMed] [Google Scholar]
- 71. Hueper K., Vogel‐Claussen J., Parikh M. A., et al., “Pulmonary Microvascular Blood Flow in Mild Chronic Obstructive Pulmonary Disease and Emphysema: The MESA COPD Study,” American Journal of Respiratory and Critical Care Medicine 192 (2015): 570–580. [DOI] [PMC free article] [PubMed] [Google Scholar]
- 72. Vogel‐Claussen J., Schönfeld C.‐O., Kaireit T. F., et al., “Effect of Indacaterol/Glycopyrronium on Pulmonary Perfusion and Ventilation in Hyperinflated Patients With Chronic Obstructive Pulmonary Disease (CLAIM). A Double‐Blind, Randomized, Crossover Trial,” American Journal of Respiratory and Critical Care Medicine 199 (2019): 1086–1096. [DOI] [PubMed] [Google Scholar]
- 73. Hueper K., Parikh M. A., Prince M. R., et al., “Quantitative and Semiquantitative Measures of Regional Pulmonary Microvascular Perfusion by Magnetic Resonance Imaging and Their Relationships to Global Lung Perfusion and Lung Diffusing Capacity,” Investigative Radiology 48 (2013): 223–230. [DOI] [PMC free article] [PubMed] [Google Scholar]
- 74. Hatabu H., Ohno Y., Gefter W. B., et al., “Expanding Applications of Pulmonary MRI in the Clinical Evaluation of Lung Disorders: Fleischner Society Position Paper,” Radiology 297, no. 2 (2020): 286–301, 10.1148/radiol.2020201138. [DOI] [PubMed] [Google Scholar]
- 75. Johns C. S., Swift A. J., Rajaram S., et al., “Lung Perfusion: MRI vs. SPECT for Screening in Suspected Chronic Thromboembolic Pulmonary Hypertension,” Journal of Magnetic Resonance Imaging 46 (2017): 1693–1697. [DOI] [PMC free article] [PubMed] [Google Scholar]
- 76. Revel M. P., Sanchez O., Couchon S., et al., “Diagnostic Accuracy of Magnetic Resonance Imaging for an Acute Pulmonary Embolism: Results of the ‘IRM‐EP’ Study,” Journal of Thrombosis and Haemostasis 10 (2012): 743–750. [DOI] [PubMed] [Google Scholar]
- 77. Buxton R. B., Frank L. R., Wong E. C., Siewert B., Warach S., and Edelman R. R., “A General Kinetic Model for Quantitative Perfusion Imaging With Arterial Spin Labeling,” Magnetic Resonance in Medicine 40 (1998): 383–396. [DOI] [PubMed] [Google Scholar]
- 78. Hopkins S. R. and Prisk G. K., “Lung Perfusion Measured Using Magnetic Resonance Imaging: New Tools for Physiological Insights Into the Pulmonary Circulation,” Journal of Magnetic Resonance Imaging 32 (2010): 1287–1301. [DOI] [PMC free article] [PubMed] [Google Scholar]
- 79. Othman A. E., Liang C., Komma Y., et al., “Free‐Breathing Arterial Spin Labeling MRI for the Detection of Pulmonary Embolism,” Radiology 307 (2023): e221998. [DOI] [PubMed] [Google Scholar]
- 80. Schraml C., Schwenzer N. F., Martirosian P., et al., “Non‐Invasive Pulmonary Perfusion Assessment in Young Patients With Cystic Fibrosis Using an Arterial Spin Labeling MR Technique at 1.5 T,” Magnetic Resonance Materials in Physics, Biology and Medicine 25 (2012): 155–162. [DOI] [PubMed] [Google Scholar]
- 81. Henderson A. C., Prisk G. K., Levin D. L., Hopkins S. R., and Buxton R. B., “Characterizing Pulmonary Blood Flow Distribution Measured Using Arterial Spin Labeling,” NMR in Biomedicine 22 (2009): 1025–1035. [DOI] [PMC free article] [PubMed] [Google Scholar]
- 82. Ohno Y., Seki S., Koyama H., et al., “3D ECG‐ and Respiratory‐Gated Non‐Contrast‐Enhanced (CE) Perfusion MRI for Postoperative Lung Function Prediction in Non‐Small‐Cell Lung Cancer Patients: A Comparison With Thin‐Section Quantitative Computed Tomography, Dynamic CE‐Perfusion MRI, and Perfus,” Journal of Magnetic Resonance Imaging 42 (2015): 340–353. [DOI] [PubMed] [Google Scholar]
- 83. Chen L., Liu D., Zhang J., et al., “Free‐Breathing Dynamic Contrast‐Enhanced MRI for Assessment of Pulmonary Lesions Using Golden‐Angle Radial Sparse Parallel Imaging,” Journal of Magnetic Resonance Imaging 48 (2018): 459–468. [DOI] [PMC free article] [PubMed] [Google Scholar]
- 84. Seith F., Pohmann R., Schwartz M., et al., “Imaging Pulmonary Blood Flow Using Pseudocontinuous Arterial Spin Labeling (PCASL) With Balanced Steady‐State Free‐Precession (bSSFP) Readout at 1.5T,” Journal of Magnetic Resonance Imaging 52 (2020): 1767–1782. [DOI] [PubMed] [Google Scholar]
- 85. Bauman G., Puderbach M., Heimann T., et al., “Validation of Fourier Decomposition MRI With Dynamic Contrast‐Enhanced MRI Using Visual and Automated Scoring of Pulmonary Perfusion in Young Cystic Fibrosis Patients,” European Journal of Radiology 82 (2013): 2371–2377. [DOI] [PubMed] [Google Scholar]
- 86. Glandorf J., Klimeš F., Behrendt L., et al., “Perfusion Quantification Using Voxel‐Wise Proton Density and Median Signal Decay in PREFUL MRI,” Magnetic Resonance in Medicine 86 (2021): 1482–1493. [DOI] [PubMed] [Google Scholar]
- 87. Wernz M. M., Voskrebenzev A., Müller R. A., et al., “Feasibility, Repeatability, and Correlation to Lung Function of Phase‐Resolved Functional Lung (PREFUL) MRI‐Derived Pulmonary Artery Pulse Wave Velocity Measurements,” Journal of Magnetic Resonance Imaging 60 (2024): 2216–2228. [DOI] [PubMed] [Google Scholar]
- 88. Pöhler G. H., Löffler F., Klimeš F., et al., “Validation of Phase‐Resolved Functional Lung (PREFUL) Magnetic Resonance Imaging Pulse Wave Transit Time Compared to Echocardiography in Chronic Obstructive Pulmonary Disease,” Journal of Magnetic Resonance Imaging 56 (2022): 605–615. [DOI] [PubMed] [Google Scholar]
- 89. Pöhler G. H., Klimes F., Voskrebenzev A., et al., “Chronic Thromboembolic Pulmonary Hypertension Perioperative Monitoring Using Phase‐Resolved Functional Lung (PREFUL)‐MRI,” Journal of Magnetic Resonance Imaging 52 (2020): 610–619. [DOI] [PubMed] [Google Scholar]
- 90. Behrendt L., Smith L. J., Voskrebenzev A., et al., “A Dual Center and Dual Vendor Comparison Study of Automated Perfusion‐Weighted Phase‐Resolved Functional Lung Magnetic Resonance Imaging With Dynamic Contrast‐Enhanced Magnetic Resonance Imaging in Patients With Cystic Fibrosis,” Pulmonary Circulation 12 (2022): e12054. [DOI] [PMC free article] [PubMed] [Google Scholar]
- 91. Wang Z., Rankine L., Bier E. A., et al., “Using Hyperpolarized 129Xe Gas‐Exchange MRI to Model the Regional Airspace, Membrane, and Capillary Contributions to Diffusing Capacity,” Journal of Applied Physiology 130 (2021): 1398–1409. [DOI] [PMC free article] [PubMed] [Google Scholar]
- 92. Grist J. T., Chen M., Collier G. J., et al., “Hyperpolarized 129Xe MRI Abnormalities in Dyspneic Patients 3 Months After COVID‐19 Pneumonia: Preliminary Results,” Radiology 301, no. 1 (2021): E353–E360, 10.1148/radiol.2021210033. [DOI] [PMC free article] [PubMed] [Google Scholar]
- 93. Costelle A., Lu J., Leewiwatwong S., et al., “Combining Hyperpolarized 129Xe MR Imaging and Spectroscopy to Non‐Invasively Estimate Pulmonary Vascular Resistance,” Journal of Applied Physiology 138 (2025): 623–633. [DOI] [PMC free article] [PubMed] [Google Scholar]
- 94. Niedbalski P. J., Bier E. A., Wang Z., Willmering M. M., Driehuys B., and Cleveland Z. I., “Mapping Cardiopulmonary Dynamics Within the Microvasculature of the Lungs Using Dissolved 129Xe MRI,” Journal of Applied Physiology 129 (2020): 218–229. [DOI] [PMC free article] [PubMed] [Google Scholar]
- 95. Patz S., Muradyan I., Hrovat M. I., et al., “Diffusion of Hyperpolarized 129Xe in the Lung: A Simplified Model of 129Xe Septal Uptake and Experimental Results,” New Journal of Physics 13 (2011): 015009. [Google Scholar]
- 96. Bier E. A., Alenezi F., Lu J., et al., “Noninvasive Diagnosis of Pulmonary Hypertension With Hyperpolarised 129Xe Magnetic Resonance Imaging and Spectroscopy,” ERJ Open Research 8 (2022): 00035–2022. [DOI] [PMC free article] [PubMed] [Google Scholar]
- 97. Kern A. L., Park D.‐H., Fuge J., et al., “Loss of Pulmonary Capillaries in Idiopathic Pulmonary Arterial Hypertension With Low Diffusion Capacity Is Accompanied by Early Diffuse Emphysema Detected by 129Xe MRI,” European Radiology (2024), 10.1007/s00330-024-11209-1. [DOI] [PMC free article] [PubMed] [Google Scholar]
- 98. Henzler T., Fink C., Schoenberg S. O., and Schoepf U. J., “Dual‐Energy CT: Radiation Dose Aspects,” American Journal of Roentgenology 199 (2012): S16–S25. [DOI] [PubMed] [Google Scholar]
- 99. Grob D., Oostveen L. J., Prokop M., Schaefer‐Prokop C. M., Sechopoulos I., and Brink M., “Imaging of Pulmonary Perfusion Using Subtraction CT Angiography Is Feasible in Clinical Practice,” European Radiology 29 (2019): 1408–1414. [DOI] [PMC free article] [PubMed] [Google Scholar]
- 100. Kerber B., Flohr T., Ulrich S., Lichtblau M., Frauenfelder T., and Franckenberg S., “Photon‐Counting CT Iodine Maps for Diagnosing Chronic Pulmonary Thromboembolism,” Investigative Radiology (2024), 10.1097/RLI.0000000000001134. [DOI] [PMC free article] [PubMed] [Google Scholar]
- 101. Seki S., Fujisawa Y., Yui M., et al., “Dynamic Contrast‐Enhanced Area‐Detector CT vs Dynamic Contrast‐Enhanced Perfusion MRI vs FDG‐PET/CT: Comparison of Utility for Quantitative Therapeutic Outcome Prediction for NSCLC Patients Undergoing Chemoradiotherapy,” Magnetic Resonance in Medical Sciences 19 (2020): 29–39. [DOI] [PMC free article] [PubMed] [Google Scholar]
- 102. Isidoro J., Gil P., Costa G., de Pedroso Lima J., Alves C., and Ferreira N. C., “Radiation Dose Comparison Between V/P‐SPECT and CT‐Angiography in the Diagnosis of Pulmonary Embolism,” Physica Medica 41 (2017): 93–96. [DOI] [PubMed] [Google Scholar]
- 103. Kang M.‐Y., Grebenkov D., Guénard H., Katz I., and Sapoval B., “The Roughton‐Forster Equation for DL CO and DL NO Re‐Examined,” Respiratory Physiology & Neurobiology 241 (2017): 62–71. [DOI] [PubMed] [Google Scholar]
- 104. Mugler J. P., Altes T. A., Ruset I. C., et al., “Simultaneous Magnetic Resonance Imaging of Ventilation Distribution and Gas Uptake in the Human Lung Using Hyperpolarized Xenon‐129,” Proceedings of the National Academy of Sciences 107 (2010): 21707–21712. [DOI] [PMC free article] [PubMed] [Google Scholar]
- 105. Wang Z., He M., Bier E., et al., “Hyperpolarized 129Xe Gas Transfer MRI: The Transition From 1.5T to 3T,” Magnetic Resonance in Medicine 80 (2018): 2374–2383. [DOI] [PMC free article] [PubMed] [Google Scholar]
- 106. Hahn A. D., Kammerman J., and Fain S. B., “Removal of Hyperpolarized 129Xe Gas‐Phase Contamination in Spectroscopic Imaging of the Lungs,” Magnetic Resonance in Medicine 80 (2018): 2586–2597. [DOI] [PMC free article] [PubMed] [Google Scholar]
- 107. Kaushik S. S., Robertson S. H., Freeman M. S., et al., “Single‐Breath Clinical Imaging of Hyperpolarized 129Xe in the Airspaces, Barrier, and Red Blood Cells Using an Interleaved 3D Radial 1‐Point Dixon Acquisition,” Magnetic Resonance in Medicine 75 (2016): 1434–1443. [DOI] [PMC free article] [PubMed] [Google Scholar]
- 108. Qing K., Mugler J. P., Altes T. A., et al., “Assessment of Lung Function in Asthma and COPD Using Hyperpolarized 129Xe Chemical Shift Saturation Recovery Spectroscopy and Dissolved‐Phase MRI,” NMR in Biomedicine 27, no. 12 (2014): 1490–1501, 10.1002/nbm.3179. [DOI] [PMC free article] [PubMed] [Google Scholar]
- 109. Ruppert K., Amzajerdian F., Hamedani H., et al., “Assessment of Flip Angle–TR Equivalence for Standardized Dissolved‐Phase Imaging of the Lung With Hyperpolarized 129Xe MRI,” Magnetic Resonance in Medicine 81 (2019): 1784–1794. [DOI] [PMC free article] [PubMed] [Google Scholar]
- 110. Niedbalski P. J., Hall C. S., Castro M., et al., “Protocols for Multi‐Site Trials Using Hyperpolarized 129Xe MRI for Imaging of Ventilation, Alveolar‐Airspace Size, and Gas Exchange: A Position Paper From the 129Xe MRI Clinical Trials Consortium,” Magnetic Resonance in Medicine 86 (2021): 2966–2986. [DOI] [PubMed] [Google Scholar]
- 111. Wang J. M., Robertson S. H., Wang Z., et al., “Using Hyperpolarized 129Xe MRI to Quantify Regional Gas Transfer in Idiopathic Pulmonary Fibrosis,” Thorax 73, no. 1 (2018): 21–28, 10.1136/thoraxjnl-2017-210070. [DOI] [PMC free article] [PubMed] [Google Scholar]
- 112. Li H., Zhao X., Wang Y., et al., “Damaged Lung Gas Exchange Function of Discharged COVID‐19 Patients Detected by Hyperpolarized 129Xe MRI,” Science Advances 7, no. 1 (2021): eabc8180, 10.1126/sciadv.abc8180. [DOI] [PMC free article] [PubMed] [Google Scholar]
- 113. Kern A. L., Pink I., Bonifacius A., et al., “Alveolar Membrane and Capillary Function in COVID‐19 Convalescents: Insights From Chest MRI,” European Radiology 34 (2024): 6502–6513. [DOI] [PMC free article] [PubMed] [Google Scholar]
- 114. Plummer J. W., Willmering M. M., Cleveland Z. I., Towe C., Woods J. C., and Walkup L. L., “Childhood to Adulthood: Accounting for Age Dependence in Healthy‐Reference Distributions in 129Xe Gas‐Exchange MRI,” Magnetic Resonance in Medicine 89 (2023): 1117–1133. [DOI] [PMC free article] [PubMed] [Google Scholar]
- 115. Kern A. L., Biller H., Klimeš F., et al., “Noninvasive Monitoring of the Response of Human Lungs to Low‐Dose Lipopolysaccharide Inhalation Challenge Using MRI: A Feasibility Study,” Journal of Magnetic Resonance Imaging 51 (2020): 1669–1676. [DOI] [PubMed] [Google Scholar]
- 116. Chang Y. V., “MOXE: A Model of Gas Exchange for Hyperpolarized 129Xe Magnetic Resonance of the Lung,” Magnetic Resonance in Medicine 69 (2013): 884–890. [DOI] [PubMed] [Google Scholar]
- 117. Imai H., Kimura A., Iguchi S., Hori Y., Masuda S., and Fujiwara H., “Noninvasive Detection of Pulmonary Tissue Destruction in a Mouse Model of Emphysema Using Hyperpolarized 129Xe MRS Under Spontaneous Respiration,” Magnetic Resonance in Medicine 64 (2010): 929–938. [DOI] [PubMed] [Google Scholar]
- 118. Stewart N. J., Parra‐Robles J., and Wild J. M., “Finite Element Modeling of 129Xe Diffusive Gas Exchange NMR in the Human Alveoli,” Journal of Magnetic Resonance 271 (2016): 21–33. [DOI] [PubMed] [Google Scholar]
- 119. Kern A. L., Gutberlet M., Qing K., et al., “Regional Investigation of Lung Function and Microstructure Parameters by Localized 129Xe Chemical Shift Saturation Recovery and Dissolved‐Phase Imaging: A Reproducibility Study,” Magnetic Resonance in Medicine 81 (2019): 13–24. [DOI] [PubMed] [Google Scholar]
- 120. Kern A. L., Gutberlet M., Voskrebenzev A., et al., “Mapping of Regional Lung Microstructural Parameters Using Hyperpolarized 129Xe Dissolved‐Phase MRI in Healthy Volunteers and Patients With Chronic Obstructive Pulmonary Disease,” Magnetic Resonance in Medicine 81 (2019): 2360–2373. [DOI] [PubMed] [Google Scholar]
- 121. Ruppert K., Amzajerdian F., Xin Y., et al., “Investigating Biases in the Measurement of Apparent Alveolar Septal Wall Thickness With Hyperpolarized 129Xe MRI,” Magnetic Resonance in Medicine 84 (2020): 3027–3039. [DOI] [PMC free article] [PubMed] [Google Scholar]
- 122. Stewart N. J., Leung G., Norquay G., et al., “Experimental Validation of the Hyperpolarized 129Xe Chemical Shift Saturation Recovery Technique in Healthy Volunteers and Subjects With Interstitial Lung Disease,” Magnetic Resonance in Medicine 74 (2015): 196–207. [DOI] [PubMed] [Google Scholar]
- 123. Ruppert K., Qing K., Patrie J. T., Altes T. A., and Mugler J. P., “Using Hyperpolarized Xenon‐129 MRI to Quantify Early‐Stage Lung Disease in Smokers,” Academic Radiology 26 (2019): 355–366. [DOI] [PMC free article] [PubMed] [Google Scholar]
- 124. Weibel E. R., Sapoval B., and Filoche M., “Design of Peripheral Airways for Efficient Gas Exchange,” Respiratory Physiology & Neurobiology 148 (2005): 3–21. [DOI] [PubMed] [Google Scholar]
- 125. Salerno M., de Lange E. E., T. Altes, a , Truwit J. D., Brookeman J. R., and Mugler J. P., “Emphysema: Hyperpolarized Helium 3 Diffusion MR Imaging of the Lungs Compared With Spirometric Indexes—Initial Experience,” Radiology 222 (2002): 252–260. [DOI] [PubMed] [Google Scholar]
- 126. Sapoval B. and Filoche M., “Role of Diffusion Screening in Pulmonary Diseases,” in Integration in Respiratory Control Advances in Experimental Medicine and Biology, ed. Poulin M. and Wilson R. (Springer, 2008), 173–178. [DOI] [PubMed] [Google Scholar]
- 127. Jacob R. E., Chang Y. V., Choong C. K., et al., “ 19F MR Imaging of Ventilation and Diffusion in Excised Lungs,” Magnetic Resonance in Medicine 54, no. 3 (2005): 577–585, 10.1002/mrm.20632. [DOI] [PubMed] [Google Scholar]
- 128. Stewart N. J., Higano N. S., Mukthapuram S., et al., “Initial Feasibility and Challenges of Hyperpolarized 129Xe MRI in Neonates With Bronchopulmonary Dysplasia,” Magnetic Resonance in Medicine 90 (2023): 2420–2431. [DOI] [PMC free article] [PubMed] [Google Scholar]
- 129. Bdaiwi A. S., Niedbalski P. J., Hossain M. M., et al., “Improving Hyperpolarized 129Xe ADC Mapping in Pediatric and Adult Lungs With Uncertainty Propagation,” NMR in Biomedicine 35, no. 3 (2022): e4639, 10.1002/nbm.4639. [DOI] [PMC free article] [PubMed] [Google Scholar]
- 130. Yablonskiy D. A., Sukstanskii A. L., Leawoods J. C., et al., “Quantitative In Vivo Assessment of Lung Microstructure at the Alveolar Level With Hyperpolarized 3He Diffusion MRI,” Proceedings of the National Academy of Sciences 99 (2002): 3111–3116. [DOI] [PMC free article] [PubMed] [Google Scholar]
- 131. Sukstanskii A. L. and Yablonskiy D. A., “In Vivo Lung Morphometry With Hyperpolarized 3He Diffusion MRI: Theoretical Background,” Journal of Magnetic Resonance 190 (2008): 200–210. [DOI] [PMC free article] [PubMed] [Google Scholar]
- 132. Yablonskiy D. A., Sukstanskii A. L., Woods J. C., et al., “Quantification of Lung Microstructure With Hyperpolarized 3He Diffusion MRI,” Journal of Applied Physiology 107 (2009): 1258–1265. [DOI] [PMC free article] [PubMed] [Google Scholar]
- 133. Parra‐Robles J. and Wild J. M., “The Influence of Lung Airways Branching Structure and Diffusion Time on Measurements and Models of Short‐Range 3He Gas MR Diffusion,” Journal of Magnetic Resonance 225 (2012): 102–113. [DOI] [PubMed] [Google Scholar]
- 134. Hajari A. J., Yablonskiy D. A., Sukstanskii A. L., Quirk J. D., Conradi M. S., and Woods J. C., “Morphometric Changes in the Human Pulmonary Acinus During Inflation,” Journal of Applied Physiology 112 (2012): 937–943. [DOI] [PMC free article] [PubMed] [Google Scholar]
- 135. Quirk J. D., Sukstanskii A. L., Woods J. C., et al., “Experimental Evidence of Age‐Related Adaptive Changes in Human Acinar Airways,” Journal of Applied Physiology 120 (2016): 159–165. [DOI] [PMC free article] [PubMed] [Google Scholar]
- 136. Chan H.‐F., Collier G. J., Weatherley N. D., and Wild J. M., “Comparison of In Vivo Lung Morphometry Models From 3D Multiple b‐Value 3He and 129Xe Diffusion‐Weighted MRI,” Magnetic Resonance in Medicine 81 (2019): 2959–2971. [DOI] [PubMed] [Google Scholar]
- 137. Ouriadov A., Lessard E., Sheikh K., and Parraga G., “Pulmonary MRI Morphometry Modeling of Airspace Enlargement in Chronic Obstructive Pulmonary Disease and Alpha‐1 Antitrypsin Deficiency,” Magnetic Resonance in Medicine 79 (2018): 439–448. [DOI] [PubMed] [Google Scholar]
- 138. Ouriadov A. V., Fox M. S., Lindenmaier A. A., Stirrat E., Serrai H., and Santyr G., “Application of a Stretched‐Exponential Model for Morphometric Analysis of Accelerated Diffusion‐Weighted 129Xe MRI of the Rat Lung,” Magnetic Resonance Materials in Physics, Biology and Medicine 34 (2021): 73–84. [DOI] [PubMed] [Google Scholar]
- 139. Sukstanskii A. L. and Yablonskiy D. A., “Lung Morphometry With Hyperpolarized 129Xe: Theoretical Background,” Magnetic Resonance in Medicine 67 (2012): 856–866. [DOI] [PMC free article] [PubMed] [Google Scholar]
- 140. Kern A. L., Gutberlet M., Moher Alsady T., et al., “Investigating Short‐Time Diffusion of Hyperpolarized 129Xe in Lung Air Spaces and Tissue: A Feasibility Study in Chronic Obstructive Pulmonary Disease Patients,” Magnetic Resonance in Medicine 84 (2020): 2133–2146. [DOI] [PubMed] [Google Scholar]
- 141. Obert A. J., Gutberlet M., Kern A. L., et al., “Examining Lung Microstructure Using 19F MR Diffusion Imaging in COPD Patients,” Magnetic Resonance in Medicine 88, no. 2 (2022): 860–870, 10.1002/mrm.29237. [DOI] [PubMed] [Google Scholar]
- 142. Roach D. J., Crémillieux Y., Fleck R. J., et al., “Ultrashort Echo‐Time Magnetic Resonance Imaging Is a Sensitive Method for the Evaluation of Early Cystic Fibrosis Lung Disease,” Annals of the American Thoracic Society 13, no. 11 (2016): 1923–1931, 10.1513/AnnalsATS.201603-203OC. [DOI] [PMC free article] [PubMed] [Google Scholar]
- 143. Ohno Y., Koyama H., Yoshikawa T., et al., “T2* Measurements of 3‐T MRI With Ultrashort TEs: Capabilities of Pulmonary Function Assessment and Clinical Stage Classification in Smokers,” American Journal of Roentgenology 197 (2011): W279–W285. [DOI] [PubMed] [Google Scholar]
- 144. Coxson H., Rogers R., Whittall K., et al., “A Quantification of the Lung Surface Area in Emphysema Using Computed Tomography,” American Journal of Respiratory and Critical Care Medicine 159 (1999): 851–856. [DOI] [PubMed] [Google Scholar]
- 145. Nakano Y., Wong J. C., de Jong P. A., et al., “The Prediction of Small Airway Dimensions Using Computed Tomography,” American Journal of Respiratory and Critical Care Medicine 171 (2005): 142–146. [DOI] [PubMed] [Google Scholar]
- 146. Willer K., Fingerle A. A., Noichl W., et al., “X‐Ray Dark‐Field Chest Imaging for Detection and Quantification of Emphysema in Patients With Chronic Obstructive Pulmonary Disease: A Diagnostic Accuracy Study,” Lancet Digital Health 3 (2021): e733–e744. [DOI] [PMC free article] [PubMed] [Google Scholar]
- 147. Hellbach K., Yaroshenko A., Willer K., et al., “X‐Ray Dark‐Field Radiography Facilitates the Diagnosis of Pulmonary Fibrosis in a Mouse Model,” Scientific Reports 7 (2017): 340. [DOI] [PMC free article] [PubMed] [Google Scholar]
- 148. Gassert F. T., Frank M., De Marco F., et al., “Assessment of Inflation in a Human Cadaveric Lung With Dark‐Field Chest Radiography,” Radiology: Cardiothoracic Imaging 4 (2022): e220093. [DOI] [PMC free article] [PubMed] [Google Scholar]