

Abstract
The escalating prevalence of antibiotic resistance underscores the urgent need for innovative antimicrobial agents. Fusidic acid (FA), a fungal-derived tetracyclic triterpene clinically employed against methicillin-resistant Staphylococcus aureus (MRSA), is limited by rapid resistance development and elevated MIC values in resistant strains. While previous olefinic side chain (Δ24,25) modifications yielded FA derivatives with retained anti-MRSA activity, most analogs exhibited compromised efficacy against Gram-positive bacteria. To address this limitation, we systematically engineered the olefinic side chain through Wittig and olefin metathesis reactions, synthesizing 26 novel FA derivatives. Compound 10a emerged as a standout candidate, demonstrating MIC value lower than FA against MRSA (0.125 μg mL−1) as well as low resistance. It also exhibited biofilm disruption capability of reducing MRSA biofilm formation by 61.4% at 0.5 × MIC, along with downregulation of biofilm-related regulators (e.g. clfA, cna, agrA, agrC). In a murine skin infection model, compound 10a significantly inhibited bacterial growth and accelerated wound healing at 2 mg kg−1. Given these advantages, compound 10a represents a promising candidate molecule for combating multidrug-resistant Gram-positive infections.
Fusidic acid side chain modification yielded derivative 10a with lower MIC against MRSA, low resistance, and biofilm disruption capabilities, and improves skin infection healing.
Introduction
The ongoing evolutionary battle between pathogens and antibiotics is evident in the adaptive strategies employed by microbes to effectively counteract conventional antibiotics. Antimicrobial resistance (AMR), which refers to the acquired resistance of bacteria, fungi, and viruses to antimicrobial agents through genetic mutations and horizontal gene transfer, has reached alarming levels due to human activities.1–3 Of particular concern, the extensive use of prophylactic antibiotics in livestock farming (e.g. approximately 80% of antibiotic consumption in the United States) coupled with the widespread clinical overprescription, particularly in developing countries, has synergistically fuelled the rapid evolution of multidrug-resistant pathogens.4,5 Given the alarming surge in AMR infection rates and the slow progress in developing new antimicrobial drugs to combat this crisis, AMR could lead to an estimated 10 million annual deaths by 2050, emerging as one of the most critical global health threats in modern history.6
Methicillin-resistant Staphylococcus aureus (MRSA), a multidrug-resistant pathogen, is a leading contributor to healthcare-associated infections worldwide.3 Its clinical ramifications include high morbidity, mortality, prolonged hospitalizations, and substantial healthcare expenditures.7–9 Clinically, MRSA infections most frequently present as localized skin and soft tissue pathologies.10 However, systemic dissemination can result in severe invasive syndromes such as osteomyelitis, pneumonia, endocarditis, and disseminated abscesses, thereby exacerbating therapeutic challenges.11–13 As a quintessential AMR “superbug”, MRSA is implicated in an estimated 120 000 deaths annually.14 The pathogen exhibits cross-resistance to all β-lactam antibiotics, historically restricting effective treatment to vancomycin.15,16 Alarmingly, the 1990s marked the emergence of vancomycin-intermediate S. aureus (VISA), followed by the first isolation of VRSA in the United States in 2002.17,18 These developments exemplify the escalating threat of AMR and highlight the urgent need for novel antibiotics.
Fusidic acid (FA), a fusidane-class antibiotic originally isolated from Fusidium coccineum,19 has served as an agent combating Gram-positive bacterial infections since its clinical introduction in 1960s, demonstrating particularly efficacy against S. aureus and methicillin-resistant strains (MRSA). Its unique bactericidal mechanism involves targeting the EF-G-ribosome complex to terminate bacterial protein synthesis conferring low cross-resistance.20–22 However, the rapid evolution of antimicrobial resistance has progressively restricted its clinical application. To address this challenge, extensive structure–activity relationship (SAR) studies focusing on its essential pharmacophoric groups (at C3–OH and C21–COOH) and non-essential olefin (Δ24,25) side chain have failed to produce derivatives with enhanced efficacy or resistance reversal capacity.23–29 Notably, in 2021, Garcia Chavez et al. reported an olefin side chain analog (FA-CP) that maintained anti-S. aureus potency comparable to FA while exhibiting an improved resistance profile, suggesting untapped potential in olefinic side chain modification.30 Building upon this discovery, we designed novel FA derivatives through hydrophobic group incorporation at the C24 position via Wittig reaction and olefin metathesis. Initial efficacy screening results revealed that 10a exhibited enhanced anti-MRSA activity. Herein, we reported the minimum inhibitory concentration (MIC) value, biofilm disruption activity, and cytotoxicity of compound 10a against MRSA, along with its therapeutic efficacy in an MRSA-infected murine scalded skin model.
Results and discussion
Chemistry
To access FA derivatives 6a–6u, FA–aldehyde (3) was first prepared as a versatile intermediate through protection and oxidative cleavage in Scheme 1 (following established methods30). Starting with compound 3, diverse groups were introduced through Wittig reactions with triphenylphosphine salt, generating intermediates 4a–4u as E/Z isomeric mixtures. These intermediates were then subjected to hydrogenation using Pd/C under a H2 atmosphere in methanol, affording saturated derivatives 5a–5u. Finally, deprotection with aqueous potassium carbonate in methanol yielded the target FA derivatives 6a–6u. Expanding this synthetic route, compound 3 was further converted to 7via Wittig olefination,31 followed by pivaloyloxy-methyl ester cleavage (K2CO3/MeOH) to yield 8. Intermediate 7 was subsequently subjected to cross-metathesis with 2-ethyl-1-butene, 2-chloromethyl-3-chloropropene, freshly synthesized 5-methylene-nonane, and 1-tert-butyl-4-methylenecyclohexane using Grubbs cat 2 to generate analogues 9a–9e, which were further deprotected (pivaloyloxy-methyl ester removal) to furnish novel olefinic side-chain FA derivatives 10a–10e (Scheme 2). All FA derivatives were characterized by nuclear magnetic resonances and high resolution mass spectrometry.
Scheme 1. Reagents and conditions: (a) POM-Cl, Et3N, DMF, rt, 3 h; (b) (i) OsO4, NMO, acetone, N2, rt, 3 h; (ii) NaIO4, MeCN/H2O, rt, 1 h; (c) PPh3, toluene, 110 °C, 12 h; (d) t-BuOK, toluene, 0 °C to rt, 3 h; (e) Pd/C, H2, MeOH, rt, 12 h; (f) K2CO3, MeOH, rt, 3 h.

Scheme 2. Reagents and conditions: (a) Ph3PCH3Br, t-BuOK, toluene, rt, 1 h; (b) Ph3PCH3Br, THF, rt, overnight; (c) K2CO3, MeOH, rt, 3 h; (d) Grubbs cat 2, DCM, N2, 35 °C, 36 h.

Antibacterial activity and SAR analysis of FA derivatives
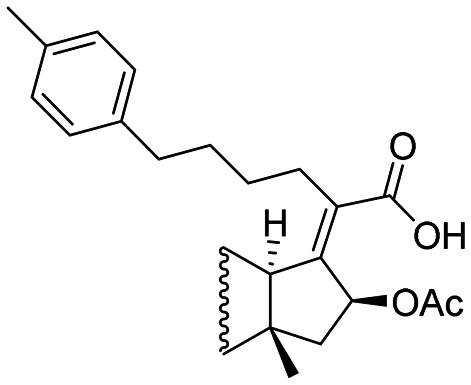
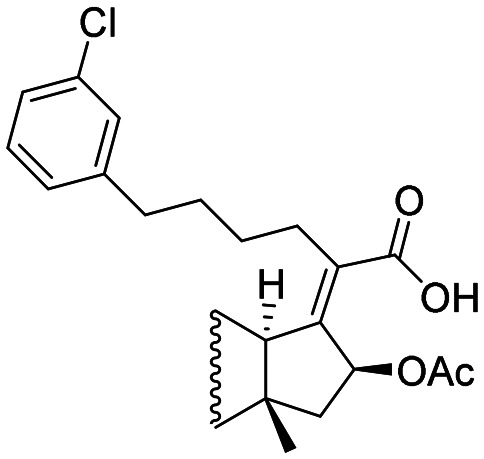
Fusidic acid (FA) has been demonstrated to exhibit potent antibacterial activity against Gram-positive bacteria. Based on this finding, twenty-six FA derivatives were systematically screened for antimicrobial efficacy against three clinically relevant Gram-positive strains: methicillin-resistant S. aureus (MRSA, ATCC 43300), S. aureus (ATCC 25923), and E. faecalis (ATCC 19433), using FA itself as the positive control. The antibacterial activities results are summarized in Table 1. In general, phenyl–FA derivatives (6a–6n) containing substitutes such as halogens, cyano, trifluoromethyl, tert-butyl, methyl and methoxy groups on the benzene ring demonstrated reduced antibacterial activity compared to FA. Specifically, electron-withdrawing groups (CN, CF3, and halogen) in the phenyl-FA derivatives (6g–6n) showed diminished activity against MRSA and S. aureus with increased electronegativity (except iodine), as evidenced by the trend 6k > 6j > 6g. however, such correlation was not observed for E. faecalis. Additionally, the positional isomerism of chlorine substituents (para vs. meta) on the aromatic ring (6h and 6l) had negligible effects on activity. Notably, difluoro-substituted derivatives (e.g., 6nvs.6m and 6g) demonstrated significantly enhanced activity against S. aureus (MICs: 0.5, 2, and 2 μg mL−1), respectively). Replacement of the C25 position in FA with naphthyl (6o) or heterocyclic groups (6s–6u) resulted in reduced activity across all tested strains. In contrast, electron-donating cyclopropane (6p) and cyclopentane (6q) substitutions at C25 displayed potent antibacterial effects against MRSA and S. aureus, with MICs ranging from 0.25 to 4 μg mL−1). These findings suggest that electron-donating groups may enhance anti-MRSA activity. Subsequently, symmetric alkanes (10a–10e) were introduced at C25 while retaining the Δ24,25 double bond of FA. Among these, compound 10a outperformed FA against all three strains. However, further elongation, chlorination of alkanes, or cycloalkane substitutions at C25 in this study failed to improve activity.
Table 1. Antibacterial activities of FA derivativesa.
| Compounds | Structures | MRSA ATCC 43300 | S. aureus ATCC 25923 | E. faecalis ATCC 19433 |
|---|---|---|---|---|
| MIC (μg mL−1) | MIC (μg mL−1) | MIC (μg mL−1) | ||
| 6a |

|
16 | 16 | 8 |
| 6b |

|
2 | 2 | 8 |
| 6c |
|
4 | 2 | 8 |
| 6d |

|
4 | 8 | 16 |
| 6e |

|
2 | 1 | 8 |
| 6f |

|
16 | >16 | >16 |
| 6g |

|
2 | 2 | 8 |
| 6h |

|
2 | 0.5 | 4 |
| 6i |

|
4 | 2 | 8 |
| 6j |

|
4 | 4 | 8 |
| 6k |

|
8 | 8 | >16 |
| 6l |
|
2 | 0.5 | 8 |
| 6m |

|
4 | 2 | 8 |
| 6n |

|
2 | 0.5 | 8 |
| 6o |

|
4 | 2 | 16 |
| 6p |

|
0.5 | 0.5 | 4 |
| 6q |

|
0.5 | 0.25 | 8 |
| 6r |

|
4 | 1 | 16 |
| 6s |

|
4 | 4 | 16 |
| 6t |

|
4 | 16 | 16 |
| 6u |

|
2 | 16 | 16 |
| 8 |

|
4 | 2 | 8 |
| 10a |

|
0.125 | 0.0625 | 2 |
| 10b |

|
2 | 8 | 8 |
| 10c |

|
>16 | 1 | >16 |
| 10d |

|
>16 | 0.25 | >16 |
| 10e |

|
1 | 4 | 8 |
| FA |

|
0.25 | 0.125 | 4 |
All experiments were conducted in triplicate.
The antibacterial activity of compound 10a was further evaluated using four clinically isolated MRSA strains (M1–M4). We used FA, methicillin, ampicillin, tetracycline, clarithromycin, and vancomycin as positive controls. Compound 10a exhibited significant antibacterial activity against all strains, with an MIC of 0.25 μg mL−1 across M1–M4 (compared to an MIC of 0.125 μg mL−1 for standard MRSA ATCC 43300). Compared to FA, compound 10a exhibited superior antibacterial activity against strains M1 and M4. Furthermore, it demonstrated greater overall potency than the other five antibiotics (Table 2).
Table 2. Antimicrobial activities of 10a against clinical strains MRSA (M1–M4).
| MIC (μg mL−1) | ||||
|---|---|---|---|---|
| M1 | M2 | M3 | M4 | |
| 10a | 0.25 | 0.25 | 0.25 | 0.25 |
| FA | 0.5 | 0.25 | 0.25 | 0.5 |
| Methicillin | >32 | 16 | 32 | 32 |
| Ampicillin | 8 | 4 | 4 | 8 |
| Tetracycline | 8 | 4 | 4 | 4 |
| Clarithromycin | 0.25 | 8 | 32 | 1 |
| Vancomycin | 1 | 1 | 1 | 1 |
The time-growth curve of 10a against MRSA
Following preliminary screening, we selected compound 10a for detailed investigation of its antibacterial activity against MRSA (ATCC 43300). To characterize its dynamic inhibition profile, MRSA cultures were exposed to 10a at sub-inhibitory (0.25 × MIC and 0.5 × MIC) and inhibitory concentrations (1 × MIC and 2 × MIC). As shown in Fig. 1A, the untreated control group exhibited continuous bacterial proliferation with time-dependent growth kinetics over 24 h. Notably, all treatment groups demonstrated significant growth suppression after 4 h of exposure. Concentration-dependent responses emerged thereafter: cultures treated with 0.25 × MIC and 0.5 × MIC showed progressive inhibition patterns with marked growth trend alterations at 8 h, while those exposed to 1 × MIC and 2 × MIC maintained sustained bacteriostatic effects from 4 to 24 h without notable population recovery. Quantitative analysis confirmed a positive correlation between antimicrobial efficacy and compound concentration, establishing a clear concentration-dependent inhibition pattern.
Fig. 1. The activity, resistance, and safety evaluation of 10ain vitro. (A) Time-growth curve of 10a inhibition of MRSA. (B) Resistance frequency of 10a and FA; * p < 0.05, ** p < 0.01, vs. FA group. (C) Fold changes in MIC values of 10a, FA, and oxacillin. (D and F) Hemolysis assay of 10a; *** p < 0.001, vs. Triton group. (E and G) 10a inhibits the hemolytic activity of MRSA on erythrocytes; *** p < 0.001, vs. DMSO and MRSA groups. (H–J) Cytotoxic effects of 10a against A549, 293T, and THLE-2 cells.

Resistance of 10a
The therapeutic potential of this antibiotic class has been constrained by high resistance frequencies, significant MIC fluctuations during bacterial adaptation to FA, and a limited number of potent derivatives. To analyze resistance frequency, we employed the large inoculum assay for both FA and compound 10a.32 Resistance frequencies were quantified at 2, 4, 8, 16, and 32 times the MIC (10a: MIC = 0.125 μg mL−1, FA: MIC = 0.25 μg mL−1) by isolating mutants and subsequently counting their viability. As shown in Fig. 1B, compound 10a demonstrated a significantly lower resistance frequency compared to FA across all tested concentrations, indicating its improved ability to mitigate resistance. Over a 15 day incubation period, 10a demonstrated a notable delay in the development of drug resistance in MRSA when compared to oxacillin and FA (Fig. 1C). The MIC of 10a remained stable at 8 μg mL−1, while 15 passages resulted in 512-fold and 64-fold increases in the MICs for oxacillin and FA, respectively.
10a inhibits the hemolytic activity of MRSA
Hemolytic activity tests were conducted to evaluate the toxicity of compound 10a toward erythrocytes and confirm its safety profile for clinical applications.33 Across concentrations ranging from 0.125 to 16 μg mL−1, the 10a-treated groups maintained a supernatant appearance comparable to the control, demonstrating visibly reduced background coloration relative to the hemolytic control (0.1% Triton X-100) (Fig. 1D and F). Notably, erythrocytes remained intact even at a high concentration of 128 × MIC, demonstrating that 10a does not induce hemolysis within this range. Since MRSA is known to cause erythrocyte hemolysis and subsequent cell death, we investigated the protective effects of 10a against MRSA-induced hemolysis. In the absence of 10a, MRSA infection resulted in extensive erythrocyte lysis. However, treatment with 10a exhibited a dose-dependent protective effect, as evidenced by the lighter red supernatant color in MRSA-infected erythrocytes compared to untreated controls (Fig. 1E and G).
Safety evaluation for 10a on mammalian cells
The toxicity assessment was further conducted on mammalian cells (A549, THLE-2, and 293 T).34 As illustrated in Fig. 1H–J, compound 10a demonstrated excellent tolerability towards these cell types even at high concentrations up to 100 μM (54.47 μg mL−1), with cell viability exceeding 70%. This indicates that 10a exhibits favourable biosafety for mammalian cells at effective antibacterial concentrations.
Live/dead staining
A dual staining assay using DMAO and PI dyes was performed.35 DMAO, a membrane-permeable green-fluorescent dye, stains both live and dead bacteria. PI, which produces red fluorescence, selectively stains bacteria with damaged membranes. In this experiment, bacterial growth was unaffected in both the natural and DMSO control groups, accompanied by intense green fluorescence in DMAO staining (Fig. 2). Treatment with 0.25 × MIC or 0.5 × MIC of 10a significantly inhibited bacterial growth, with correspondingly little green fluorescence (DMAO) and red fluorescence (PI). At higher concentrations (1 × MIC and 2 × MIC), 10a resulted in substantially reduced bacterial growth in the DMAO group, while PI staining indicated increased bacterial death, though the absolute number of dead bacteria remained relatively low. These results suggest that 10a primarily exerts its antibacterial effect by inhibiting bacterial growth.
Fig. 2. DMAO/PI staining of MRSA dealt by 10a.

The effect of 10a on biofilm and biofilm-related genes
Biofilm formation is a critical mechanism underlying MRSA resistance, significantly complicating the treatment of MRSA infections.36 Biofilms enhance bacterial virulence and pathogenicity by providing a protective niche that enables bacterial evasion of antibiotic treatment, a hallmark of antimicrobial resistance.37 Consequently, antibiofilm activity is a key criterion for evaluating novel antimicrobial agents. Compound 10a, a derivative of fusidic acid, exhibits good affinity for EF-G (a known target of fusidic acid38) based the result of molecule docking (Fig. S30). It reported that elongation factor EF-G of MRSA is multifunctional factor associated with energetic metabolic pathways and also involved in adhesion to extracellular matrix and invasion of host cells.39 To determine whether 10a also exerts anti-MRSA activity by interfering with biofilms, we employed the crystal violet assay to quantify its inhibition of biofilm formation. The crystal violet staining results (Fig. 3A and B) revealed that 10a significantly inhibited MRSA biofilm formation by 22.85, 61.4%, 68.3%, and 75.4% at 0.25 × MIC, 0.5 × MIC, 1 × MIC, and 2 × MIC, respectively. These findings demonstrate a concentration-dependent reduction in biofilm biomass, with higher drug concentrations correlating to greater inhibition. Furthermore, imaging analysis using the Cytation 5 at increasing magnifications confirmed that 10a markedly reduced both the density and structural complexity of MRSA biofilms (Fig. 3C).
Fig. 3. 10a inhibited MRSA biofilm formation. (A) Crystal violet staining, adhesion of biofilm in 96-well plates. (B) 30% glacial acetic acid dissolved the biofilm, and the OD492 nm absorbance value was determined (n = 3). (C) Images acquired by the Cytation 5 microscope with a multifunctional imaging system for black and white and color fields at different magnifications. ***p < 0.001, vs. DMSO group.

In order to investigate whether 10a interferes with key signalling pathways involved in MRSA biofilm formation, the expression of genes related to regulatory systems, adhesion, and matrix production was studied (Fig. 4A). Specifically, we focused on clfA and cna, genes known to mediate the initial attachment of MRSA cells to surfaces and to components of the extracellular matrix.40–43 RT-qPCR analysis revealed that 10a treatment led to a decrease in clfA and cna transcript levels (Fig. 4B), suggesting that 10a inhibits the initial stages of biofilm formation by interfering with bacterial adhesion. Agr is a key regulatory system for S. aureus virulence and biofilm gene expression, controlling the production of phenol-soluble protein, extracellular proteases and toxins.44 It is also responsible for the legal sensing mechanisms in biofilms and is therefore involved in the control of biofilm maturation and biofilm bacterial cell density.45 In this study, 10a could significantly down-regulated the expression levels of agrA and agrC. Thereby, effective inhibition of MRSA biofilm formation by 10a is related to down-regulated expression levels of clfA, cna, agrA and agrC.
Fig. 4. 10a downregulated the transcriptional expression of biofilm-related genes. (A) Diagram of biofilm mechanism formation. (B) The expression of biofilm-related genes (clfA, cna, agrA, agrC) after 10a treatment with MRSA (n = 3). ***p < 0.001, vs. DMSO group.

Mouse skin infection
Skin infections are among the most common clinical manifestations of MRSA in hospital settings. To evaluate the therapeutic potential of 10a, we established a murine model of MRSA-infected skin wounds and assessed the compound's efficacy.46 Treatments included topical application of 10a (2 mg kg−1 or 8 mg kg−1) or FA (2 mg kg−1, positive control) twice daily for 11 days (Fig. 5A). Throughout the treatment period, no significant weight loss was observed in any group, and all wounds exhibited typical healing progression, including scab formation and gradual reduction in lesion area (Fig. 5B and C). Both 10a and FA demonstrated potent therapeutic effects, with wound sizes significantly reduced post-treatment. The high-dose 10a group (8 mg kg−1) showed superior efficacy to the low-dose group (2 mg kg−1), though no significant difference was observed between FA and 10a at equivalent doses. Bacterial load reduction further corroborated treatment efficacy. Colony counting revealed a significant decrease in viable MRSA at the wound site in treated groups compared to untreated control (Fig. 5D). Morphological analysis highlighted accelerated healing in the high-dose 10a group (8 mg kg−1), marked by rapid eschar formation within 5 days (Fig. 6A), likely due to effective bacterial clearance. To further validate these findings, histopathological analysis of mice skin lesions was performed. H&E staining of tissues from the 10a- and FA-treated groups after 11 days enabled direct assessment of therapeutic outcomes. In contrast to the negative control (10% DMSO), which exhibited severe inflammatory cell infiltration, epidermal necrosis, and follicular damage, both 10a and FA treatments restored tissue integrity, promoting epidermal regeneration and follicular development (Fig. 6B). These results align with observed reductions in wound area and bacterial load, collectively demonstrating that 10a effectively eradicates MRSA and accelerates wound healing post-infection.
Fig. 5. Effects of 10a on the mice skin wounds infected by MRSA (n = 8). (A) Schematic diagram of 10a for the timeline of the model of scald infection caused by MRSA. (B) 11 day body-weight changes in mice. (C) Relative wound-area changes in mice. (D) the number of colonies at the wound site after 11 day MRSA infection. ns, not significant; ***p < 0.001, vs. DMSO group; ## p < 0.01, vs. FA group.

Fig. 6. 10a promoted skin wound healing. (A) The representative images of the wound healing process under varying treatment regimens. (B) Histopathological examination (200×) of H&E-stained MRSA-infected mice skin (scale bar: 100 μm), exhibited hair follicle integrity (yellow arrow), a clearly visible stratum corneum (blue arrow), epithelial integrity (green arrow) and scab thickness (orange arrow).

Conclusions
Twenty-six FA derivatives with olefinic-side-chain modifications were designed and synthesized. Among them, compound 10a emerged as the most potent candidate, exhibiting superior antibacterial activity and resistance compared to the positive control FA, along with low levels of hemolytic activity and cytotoxicity. It rapidly inhibited bacterial growth and hindered the development of bacterial resistance, and biofilm formation. Furthermore, compound 10a demonstrated significant efficacy in a mouse model of MRSA subcutaneous infection. These findings strongly suggest that compound 10a is a promising candidate for the treatment of MRSA infections.
Experimental
Instruments and materials
Melting points were determined using a Yanaco WRX-4 micro melting point apparatus (Shanghai YiCe Apparatus & Equipment Co., Ltd., CN). 1H NMR and 13C NMR spectra were acquired on a Bruker AVANCE NEO 600 M NMR spectrometer (Bruker Switzerland AG, Switzerland) with tetramethylsilane as an internal standard. High-resolution mass spectrometry (HRMS) was conducted on a Waters Xevo quadrupole time-of-flight (Q-TOF) spectrometer (Waters Corporation, USA) using ESI. Purity of all final compounds (≥95%) was confirmed by HPLC (Therm Scientific Ultimate 3000, Thermo Fisher Scientific, USA). TLC was performed on silica gel GF254 plates (Qingdaohaiyang, China), with visualization under UV light at 254 nm. Bacterial strains: methicillin-resistant Staphylococcus aureus (ATCC 43300), Staphylococcus aureus (ATCC 25923), and Enterococcus faecalis (ATCC 19433) strains were from the China General Microbiological Culture Collection Center. Clinical MRSA (M1–M4) were sourced from the First Affiliated Hospital of Guizhou Medical University, Guiyang, China.
The primers for genes involved in biofilm formation of MRSA47 (Table 3).
Table 3. Forward and reverse primers for MRSA.
| Gene | Forward (5′ to 3′) | Reverse (5′ to 3′) |
|---|---|---|
| gyrB | GGTGCTGGGCAAATACAAGT | TCCCACACTAAATGGTGCAA |
| cna | AAAGCGTTGCCTAGTGGAGA | AGTGCCTTCCCAAACCTTT |
| clfA | ATTGGCGTGGCTTCAGTGCT | CGTTTCTTCCGTAGTTGCATTTG |
| agrA | TGATAATCCTTATGAGGTGCTT | CACTGTGACTCGTAACGAAAA |
| agrC | CATTCGCGTTGCATTTATTG | CCTAAACCACGACCTTCACC |
Female BALB/c mice (7–8 weeks old, 18–20 g body weight) were procured from Henan Sikebaisi Biotechnology Co., Ltd. (Animal Use License No. SCXK(Yu) 2020–0005). All experimental protocols strictly adhered to the National Institutes of Health Guide for the Care and Use of Laboratory Animals and were approved by the Institutional Animal Care and Use Committee (IACUC) of Guizhou Medical University (Ethics Approval No. 2020-10).
Preparation of triphenylphosphine salts
The corresponding bromide (2.0 mmol) was charged into a solution of triphenylphosphine (550 mg, 2.1 mmol) in anhydrous toluene (5 mL). The reaction mixture was heated under reflux with continuous stirring until crystalline salt formation occurred.32 The resulting precipitate was collected by vacuum filtration, exhaustively washed with diethyl ether (3 × 10 mL) to eliminate triphenylphosphine oxide byproducts, and subsequently dried in vacuo to yield the target compound quantitatively.
Synthesis of 4a–4u
A dry Schlenk flask was charged with triphenylphosphine salt (43.3 mg, 0.1 mmol) and t-BuOK (12.2 mg, 0.1 mmol) under a vacuum atmosphere. After the addition of 1 mL of anhydrous toluene via syringe, the mixture was stirred at room temperature for 1 h to generate the ylide. The reaction system was subsequently cooled to 0 °C in an ice bath for 10 min, after which compound 3 (30 mg, 0.05 mmol) was added under an argon atmosphere. The resulting mixture was stirred at 0 °C for 10 min, warmed to room temperature and stirred for 2 h.48 The reaction was quenched by slow addition of H2O (50 mL), and extracted with EtOAc (2 × 50 mL). The combined organic layers were sequentially washed with H2O (2 × 50 mL), brine (50 mL), dried over anhydrous Na2SO4, filtered, and concentrated in vacuo. Purification via silica gel column chromatography (petroleum ether/ethyl acetate 5 : 1) afforded a mixture of inseparable E/Z isomers (ratio ≈ 6 : 4) as a white solid in a yield of 40–68%.
Preparation of 5a–5u
0.03 mmol of the coupling product (4) was introduced in a Schlenk flask, followed by a 5% palladium on carbon (Pd/C, catalytic amount). Methanol (MeOH, 1 mL) was introduced via gastight syringe, and the reaction system was subjected to three vacuum-hydrogen purge cycles to ensure an inert atmosphere. The mixture was stirred vigorously at ambient temperature for 12 h under a static hydrogen atmosphere. Upon completion, the catalyst was removed through a filter paper, and the filtrate was directly employed in subsequent reactions without further purification.
Alkali-catalyzed deprotection
A methanol solution (0.5 mL) containing the protected fusidic acid analogue (0.03 mmol) was charged into a 5 mL reaction vial under ambient conditions. K2CO3 (8.3 mg, 0.06 mmol, 2.0 equiv.) was introduced to the resulting solution, initiating a base-mediated deprotection. The heterogeneous mixture was subjected to continuous agitation (3 h, 25 °C) until full consumption of starting material was confirmed by TLC analysis. The mixture was filtered and concentrated under reduced pressure. Final purification was achieved through silica gel column chromatography using a 1 : 1 mixture of petroleum ether and ethyl acetate as the eluent.
Preparation of alkene
Under an argon atmosphere, dissolve t-BuOK (24 mg, 2.0 mmol) in anhydrous tetrahydrofuran (THF, 10 mL), then add methyltriphenylphosphine bromide (714 mg, 2.0 mmol) in one portion. Stir the mixture at room temperature for 1 hour, followed by slow dropwise addition of a solution of the ketone compound (1.0 mmol) in anhydrous THF (2 mL), maintaining the internal temperature below 10 °C. After the reaction system warms to room temperature, continue stirring for 12 h.49 Remove the solvent under vacuum, and wash the residue with n-hexane (3 × 5 mL). The washed product is concentrated in vacuo and directly used in the next step.
Synthesis of compounds 9a–9e
In a 5 mL vial, the fusidic acid analogue alkene (7) (156 mg, 0.26 mmol, 1.0 eq.) and Grubbs cat 2 (12.7 mg, 0.015 mmol, 0.06 eq.) were added. The vial was purged with nitrogen (three cycles) to establish an inert atmosphere. DCM (2.0 mL) and alkene (4.0 eq.) were added sequentially. Stirring at 35 °C for 36 h,30 the reaction mixture was quenched with saturated aqueous NaCl (10 mL). The layers were separated, and the aqueous fraction was extracted with ethyl acetate (EtOAc, 3 × 10 mL). The combined organic fractions were dried over Na2SO4, filtered, and concentrated in vacuo. The crude residue was purified by silica gel column chromatography (petroleum ether/EtOAc, 5 : 1 v/v) to afford the product as a white solid in 15–20% yield.
Minimal inhibitory concentration assay
The minimal inhibitory concentrations of FA derivatives were determined using broth microdilution assay, in accordance with the standardized protocols outlined by the Clinical and Laboratory Standards Institute (CLSI).50 The bacterial strains were retrieved from the −80 °C freezer and activated by three-zone streaking on solid agar plates. After incubation at 37 °C for 20 h, a single colony was inoculated into liquid culture medium and cultured in a shaking incubator (37 °C, 200 rpm) for 16–20 h. After centrifuging the bacterial suspension at 3000g for 3 min, the resulting pellet was washed twice with 1 mL of 0.9% (w/v) NaCl solution. The turbidity was adjusted to 5 × 10⁷ CFU mL−1 to prepare the working suspension. Compound 10a was prepared at a concentration of 0.03125–16 μg mL−1 in sterile medium. Aliquots (100 μL) of the working suspension were dispensed into 96-well plates and incubated at 37 °C for 16 h. Resazurin solution (5 μL, 0.4 mg mL−1) was then added to each well, followed by a 4 h incubation period. MIC values were recorded as the lowest concentration showing no color change (absence of resazurin reduction) and confirmed by agar diffusion assay.
MRSA time-growth analysis
A time-growth curve study of MRSA strain was performed using three experimental groups: control (natural growth), vehicle control (DMSO), and 10a-treated group. All groups were tested in triplicate wells. For drug treatment, 100 μL of 10a supplemented medium was added to each well, followed by 100 μL of bacterial suspension (1 × 10⁶ CFU mL−1). This protocol achieved final 10a concentrations of 0.25×, 0.5×, 1× and 2× the MIC through sequential dilution. Plates were incubated at 37 °C under aerobic conditions. Bacterial growth kinetics were assessed by measuring the optical density at 595 nm at 4 hour intervals for the first 12 h, followed by a final measurement at 24 h. A bacterial growth curve was constructed with time on the x-axis (abscissa) and OD595nm on the y-axis (ordinate).51
Evaluation of resistance frequency of 10a
Resistant mutants were selected through high-density inoculation.32 The MRSA bacterial suspension (1 × 10⁸ CFU mL−1) was inoculated onto 100 mm agar plates containing FA and compound 10a at concentrations corresponding to 32, 16, 8, 4, and 2× the MIC of each agent. After 24 h at 37 °C, resistant colonies were counted, and mutation frequency was determined by comparing the number of resistant colonies to the total CFU plated on drug-free agar. Mutation frequency was expressed as the ratio of resistant mutants to the total bacterial population.
Determination of resistance development of 10a
To develop resistance through sequential passaging, exponential-phase MRSA was transferred into fresh TSB containing 10a, FA, and oxacillin at 0.5 × MIC. After 24 h incubation in a shaker (160 rpm, 37 °C), the cultures were subcultured for subsequent MIC determination. This process was repeated for 15 passage cycles.52
Cytotoxicity assay
The A549 and 293T were cultured in high-glucose DMEM medium supplemented with 10% fetal bovine serum (FBS) and 1% penicillin–streptomycin. The THLE-2 was maintained in high-glucose DMEM containing 15% FBS and 1% penicillin–streptomycin. All cell lines were incubated at 37 °C in a humidified atmosphere with 5% CO2. Cytotoxicity was assessed by MTT assay according to literatures.34 All experimental results were validated through at least three independent replicates.
Hemolysis assay
To evaluate the compound's hemolytic potential, a safety assessment was performed using erythrocyte lysis as the endpoint. The experimental design included four groups with triplicate wells: negative control, solvent control (DMSO), positive control (0.1% Triton X-100), and test compound (10a). In a 96-well microplate, 100 μL of erythrocytes suspension was combined with 100 μL of either: (1) erythrocyte (negative control), (2) DMSO solution, (3) 0.1% Triton X-100, and (4) compound 10a solutions serially diluted to final concentrations of 16, 8, 4, 2, 1, 0.5, 0.25, and 0.125 μg mL−1. Following 10 h incubation at 37 °C under 5% CO2 atmosphere, the plate was centrifuged at 500g for 5 min using a microplate rotor. Aliquots (100 μL) of supernatant were transferred to a fresh plate for spectrophotometric measurement at 570 nm, and the hemolysis rate was calculated.
In vitro inhibition of MRSA hemolysin activity by 10a
Dilute the MRSA suspension with RPMI-1640 medium and adjust to 5 × 10⁷ CFU mL−1. In a 96-well microplate, 100 μL of the MRSA suspension (prepared with compound 10a at final concentrations of 2, 1, 0.5, 0.25, and 0.125 μg mL−1) was combined with 100 μL of erythrocytes suspension. Culture plates were subjected to a 10 hour incubation in a humidified chamber (37 °C, 5% CO2), followed by centrifugation (500g, 5 min). Supernatants (100 μL) were subsequently aliquoted into fresh 96-well plates. Absorbance measurements were performed at 570 nm using a microplate reader with triplicate technical replicates. Hemolysis rates were calculated as previously described.
DMAO/PI staining assay
MRSA was diluted to a concentration of 107 CFU mL−1 using PBS. The bacterial cultures were then treated with 10a at both sub-inhibitory concentrations (0.25 × MIC and 0.5 × MIC) and inhibitory concentrations (1 × MIC and 2 × MIC), with PBS and DMSO serving as control groups. The samples were incubated at 37 °C for 24 hours. Following incubation, staining was performed in accordance with the manufacturer's protocol using the LIVE/DEAD bacterial staining kit containing DMAO and PI. The staining process lasted for 30 minutes in the dark. Finally, the stained samples were examined under a confocal laser scanning microscope (Nikon-AXR, Japan).35
10a inhibits the biofilm formation of MRSA
The experimental design included four groups (blank control, natural growth control, solvent control, and 10a treatment) with triplicate wells per condition. 100 μL of logarithmic-phase MRSA (1 × 10⁷ CFU mL−1) suspension was inoculated into 100 μL of TSB (1% glucose) solution to achieve final drug concentrations of 0.03125, 0.0625, 0.125, and 0.25 μg mL−1 through serial dilution. Following 24 h of static incubation at 37 °C, planktonic cells were removed by aspiration of the supernatant. The resulting biofilms were fixed with 4% paraformaldehyde for 20 min, stained with 0.1% crystal violet (CV) for 20 min at room temperature, and washed three times with 0.9% saline to remove excess stain. Air-dried samples were imaged at multiple magnifications using a Cytation 5 imaging system (Agilent, USA), after which 30% glacial acetic acid was added to solubilize biofilm-bound CV for spectrophotometric quantification at OD492 nm, with biofilm biomass demonstrating direct proportionality to the optical density measurements.
RNA extraction
The experimental design comprised two treatment groups (solvent control [DMSO] and drug-treated [10a at 1 × MIC]) cultured in 6-well plates under static incubation at 37 °C for 24 h. Collect the bacteria and add 1 mL of TRIzol™ reagent (Takara Bio, JPN) lysed bacteria. RNA was dissolved with chloroform layering, isopropanol precipitation, 75% ethanol elution, and nuclease-free water. Subsequently, 1 μg total RNA was reverse-transcribed into cDNA using the Takara PrimeScript™ RT reagent kit (Takara Bio, JPN), with resultant cDNA serving as template for RT-qPCR analysis.
Real-time fluorescence quantitative PCR analysis
RT-qPCR quantified target genes in MRSA using gyrB as reference. Amplifications used QuantStudio 6 Pro (Applied Biosystems, USA) under standard protocols.53 Each 20 μL reaction mixture contained: 10 μL of 2× TB Green Fast PCR Master Mix, 1 μL of cDNA template, 1 μL each of forward and reverse primers (10 μM), and 8 μL of RNase-free water. Amplification was carried out using a StepOnePlus real-time PCR system (Applied Biosystems, CA, USA) with the following thermal profile: initial denaturation at 95 °C for 30 s, then 40 cycles of 95 °C for 10 s, 60 °C for 30 s, and 72 °C for 30 s. Relative gene expression was calculated via the 2−ΔΔCt method with cycle threshold (Ct) values normalized to the reference gene.54 Primers sequences targeting biofilm-related genes are listed in Table 2, with all reaction performed in triplicate.
Mouse skin infection assay
Animal experimental designs and procedures were approved by the Institutional Animal Care and Use Committee (IACUC) of Guizhou Medical University. A murine wound infection model, modified from protocols described by Yao et al.55 was used. Thirty-two female BALB/c mice (7–8 weeks old, 18–20 g) were purchased and housed under standard conditions with ad libitum access to water and food. After a one week acclimatization period, a cutaneous infection model was established by creating standardized dorsal wounds. Briefly, mice were anesthetized with 3% isoflurane procedure to minimize pain and stress, the dorsal hair was removed and sterilized with 70% ethanol. A circular scald wound (1 cm diameter) was created by applying a hollow plastic tube (1 cm diameter, 5 cm height) filled with boiling water to the dorsal skin for 15 seconds. Immediately following wound creation, 10 μL of bacterial suspension (5 × 10⁷ CFU mL−1) was applied topically to each wound. Following confirmation of skin wound infection, mice were randomly assigned to one of four groups (n = 8 per group): DMSO vehicle control, FA (2 mg kg−1), 10a (2 mg kg−1), and 10a (8 mg kg−1). Then freshly prepared 10a solutions (2 mg kg−1 and 8 mg kg−1) or FA (2 mg kg−1) were topically administered to wound sites twice daily. Skin lesion progression was monitored daily from day 1 to 11, with wound diameters quantified using digital calipers.56 Wound healing was documented photographically at a uniform height on consecutive days. On day 11, mice were anesthetized and euthanized, and the injured skin tissue samples were excised. Then skin specimens were bisected for parallel analyses: one half underwent serial dilution plating on TSB agar for bacterial enumeration, while the contralateral half was fixed in 4% PFA, longitudinally sectioned, and stained with hematoxylin and eosin (H & E) for histopathological evaluation.
Statistical analyses
All experiments were conducted in triplicate, with results presented as mean ± SD. Graphical representations were generated using GraphPad Prism 8.3.0 (Reachsoft, USA) unless otherwise noted. Statistical analyses employed unpaired two-tailed Student's t-tests for two-group comparisons and one-way ANOVA with Tukey's for multi-group analyses.
Author contributions
W. H. W. and L. J. S. contributed equally. W. H. W. & L. J. S.: investigation, methodology, formal analysis, software, data curation, writing original draft; K. Y. B., Y. X. L., and J. L.: methodology, formal analysis; F. H. L.: methodology, formal analysis, data curation; X. F. L. & S. G. L.: data curation, supervision, review & editing; J. L. A., and G. B. X.: project administration, validation, formal analysis, investigation, methodology, writing – review & editing. All authors have given approval to the final version of the manuscript.
Conflicts of interest
There are no conflicts to declare.
Supplementary Material
Acknowledgments
We greatly appreciate the financial support of the Scientific Research Foundation for Innovative Talent of Guizhou Province ([2020]6011-2), National Innovation and Entrepreneurship Training Program for College Students (202310660023), and Engineering Research Center for the Prevention and Treatment of Chronic Diseases by Authentic Medicinal Materials, Guizhou Provincial Department of Education [2023]035.
Data availability
Supplementary information: Chemical physical data, molecular docking, compounds spectra. See DOI: https://doi.org/10.1039/D5MD00652J.
The data supporting this article have been included as part of the SI.
References
- Chokshi A. Sifri Z. Cennimo D. Horng H. J. Global Infect. Dis. 2019;11:36–42. doi: 10.4103/jgid.jgid_110_18. [DOI] [PMC free article] [PubMed] [Google Scholar]
- Li W. Coulon F. Singer A. Zhu Y. G. Yang Z. Environ. Sci. Technol. 2021;55:12133–12135. doi: 10.1021/acs.est.1c03396. [DOI] [PubMed] [Google Scholar]
- Brown E. D. Wright G. D. Nature. 2016;529:336–343. doi: 10.1038/nature17042. [DOI] [PubMed] [Google Scholar]
- Prestinaci F. Pezzotti P. Pantosti A. Pathog. Global Health. 2015;109:1–10. doi: 10.1179/2047773215Y.0000000030. [DOI] [PMC free article] [PubMed] [Google Scholar]
- Khmaissa M. Héla Z. M. Sciara G. Record E. Mechichi T. J. Hazard. Mater. Adv. 2024;13:100410. [Google Scholar]
- Murray C. J. Ikuta K. S. Sharara F. Swetschinski L. Aguilar G. R. Gray A. Han C. Bisignano C. Rao P. Lancet. 2022;399:629–655. doi: 10.1016/S0140-6736(21)02724-0. [DOI] [PMC free article] [PubMed] [Google Scholar]
- Mcelvania E. Mindel S. Lemstra J. Brands K. Patel P. Good C. E. Morel D. Orny C. Volle J. M. Desjardins M. J. Clin. Microbiol. 2024;62:9. doi: 10.1128/jcm.01445-23. [DOI] [PMC free article] [PubMed] [Google Scholar]
- Perini H. F. Pereira B. B. Sousa E. G. Matos B. S. Silva Prado L. C. D. Castro Soares V. A. Carvalho Azevedo S. Silva M. V. D. Microb. Pathog. 2024;197:107065. doi: 10.1016/j.micpath.2024.107065. [DOI] [PubMed] [Google Scholar]
- Nelson R. E. Goto M. Samore M. H. Jones M. Stevens V. W. Evans M. E. Schweizer M. L. Perencevich E. N. Rubin M. A. Clin. Infect. Dis. 2021;72:S50–S58. doi: 10.1093/cid/ciaa1591. [DOI] [PubMed] [Google Scholar]
- Hulme J. Molecules. 2025;30:512. doi: 10.3390/molecules30030512. [DOI] [PMC free article] [PubMed] [Google Scholar]
- Chen I. H. Silberg B. N. Nicolau D. P. Surg. Infect. 2021;22:447–449. doi: 10.1089/sur.2020.293. [DOI] [PubMed] [Google Scholar]
- Kaushik A. Kest H. Sood M. Thieman C. Steussy B. W. Padomek M. Gupta S. Antibiotics. 2024;13:1132. doi: 10.3390/antibiotics13121132. [DOI] [PMC free article] [PubMed] [Google Scholar]
- Yi S. Y. Jeong J. Lee K. P. K. J. Microbiol. Biotechnol. 2023;33:698–705. doi: 10.4014/jmb.2301.01004. [DOI] [PMC free article] [PubMed] [Google Scholar]
- Adedeji-Olulana A. F. Wacnik K. Lafage L. Pasquina-Lemonche L. Tinajero-Trejo M. Sutton J. A. F. Bilyk B. Irving S. E. Portman Ross C. J. Meacock O. J. Randerson S. A. Beattie E. Owen D. S. Florence J. Durham W. M. Hornby D. P. Corrigan R. M. Green J. Hobbs J. K. Foster S. J. Science. 2024;386:573–580. doi: 10.1126/science.adn1369. [DOI] [PMC free article] [PubMed] [Google Scholar]
- Abo-Amer A. E. El-Rab S. M. G. Halawani E. M. Niaz A. M. Bamaga M. S. J. Microbiol. Biotechnol. 2022;32:1537–1546. doi: 10.4014/jmb.2208.08004. [DOI] [PMC free article] [PubMed] [Google Scholar]
- Alghamdi B. A. Al-Johani I. Al-Shamrani J. M. Alshamrani H. M. Al-Otaibi B. G. Almazmomi K. Yusof N. Y. Saudi J. Biol. Sci. 2023;30:103604. doi: 10.1016/j.sjbs.2023.103604. [DOI] [PMC free article] [PubMed] [Google Scholar]
- Unni S. Siddiqui T. J. Bidaisee S. Cureus. 2021;13:e18925. doi: 10.7759/cureus.18925. [DOI] [PMC free article] [PubMed] [Google Scholar]
- Khoothiam K. Prapasawat W. Yosboonruang A. Rawangkan A. Phuangsri C. Rupprom K. Kraivuttinun P. Tanomsridachchai W. Suthienkul O. Siriphap A. Ann. Clin. Microbiol. Antimicrob. 2023;22:68. doi: 10.1186/s12941-023-00621-y. [DOI] [PMC free article] [PubMed] [Google Scholar]
- Godtfredsen W. O. S. Jahnsen H. Lorck K. Roholt L. Tybring L. Nature. 1962;193:987. doi: 10.1038/193987a0. [DOI] [PubMed] [Google Scholar]
- Fernandes P. Cold Spring Harbor Perspect. Med. 2016;6:a025437. doi: 10.1101/cshperspect.a025437. [DOI] [PMC free article] [PubMed] [Google Scholar]
- Jones R. N. Castanheira M. Rhomberg P. R. Woosley L. N. Pfaller M. A. J. Clin. Microbiol. 2010;48:972–976. doi: 10.1128/JCM.01829-09. [DOI] [PMC free article] [PubMed] [Google Scholar]
- Besier S. Ludwig A. Brade V. Wichelhaus T. A. Mol. Microbiol. 2003;47:463–469. doi: 10.1046/j.1365-2958.2003.03307.x. [DOI] [PubMed] [Google Scholar]
- Daehne W. V. Godtfredsen W. O. Rasmussen P. R. Adv. Appl. Microbiol. 1979;25:95–146. doi: 10.1016/s0065-2164(08)70148-5. [DOI] [PubMed] [Google Scholar]
- Duvold T. Sørensen M. D. Björkling F. Henriksen A. S. Rastrup-Andersen N. J. Med. Chem. 2001;44:3125–3131. doi: 10.1021/jm010899a. [DOI] [PubMed] [Google Scholar]
- Bodley J. W. Godtfredsen W. O. Biochem. Biophys. Res. Commun. 1972;46:871–877. doi: 10.1016/s0006-291x(72)80222-5. [DOI] [PubMed] [Google Scholar]
- Kaur G. Pavadai E. Wittlin S. Chibale K. J. Chem. Inf. Model. 2018;58:1553–1560. doi: 10.1021/acs.jcim.8b00105. [DOI] [PubMed] [Google Scholar]
- Wu P. P. He H. Hong W. D. Wu T. R. Huang G. Y. Zhong Y. Y. Tu B. R. Gao M. Zhou J. Zhao S. Q. Li D. L. Xu X. T. Sheng Z. J. Ward S. A. O'Neill P. M. Zhang K. Infect. Drug Resist. 2018;11:1945–1957. doi: 10.2147/IDR.S176390. [DOI] [PMC free article] [PubMed] [Google Scholar]
- Ibrahim A. R. S. Elokely K. M. Ferreira D. Ragab A. E. Molecules. 2018;23:970. doi: 10.3390/molecules23040970. [DOI] [PMC free article] [PubMed] [Google Scholar]
- Tian C. Wang K. Li G. Lou H. X. Chin. J. Nat. Med. 2022;20:81–101. doi: 10.1016/S1875-5364(21)60114-0. [DOI] [PubMed] [Google Scholar]
- Garcia Chavez M. Garcia A. Lee H. Y. Lau G. W. Parker E. N. Komnick K. E. Hergenrother P. J. ACS Infect. Dis. 2021;7:493–505. doi: 10.1021/acsinfecdis.0c00869. [DOI] [PMC free article] [PubMed] [Google Scholar]
- Zhao S. W., Zhang P. P., Hong K., Jiang W. Q., Cui Z. Y., Cheng X. P. and Qin A. M., CN105924488, Sep. 7, 2016
- Biedenbach D. J. Rhomberg P. R. Mendes R. E. Jones R. N. Diagn. Microbiol. Infect. Dis. 2010;66:301–307. doi: 10.1016/j.diagmicrobio.2009.10.014. [DOI] [PubMed] [Google Scholar]
- Eltwisy H. O. Abdel-Fattah M. Elsisi A. M. Omar M. M. Abdelmoteleb A. A. El-Mokhtar M. A. Virulence. 2020;11:1142–1157. doi: 10.1080/21505594.2020.1809962. [DOI] [PMC free article] [PubMed] [Google Scholar]
- Xia J. Xin L. Li J. Tian L. Wu K. Zhang S. Yan W. Li H. Zhao Q. Liang C. J. Med. Chem. 2023;66:5061–5078. doi: 10.1021/acs.jmedchem.2c02135. [DOI] [PubMed] [Google Scholar]
- Kuong M. Wang H. Han F. Fan L. Yao F. Yang K. Hou X. Li Z. He W. Shu X. Sun B. Liu Y. Li Y. J. Controlled Release. 2025;10:113949. doi: 10.1016/j.jconrel.2025.113949. [DOI] [PubMed] [Google Scholar]
- Koo H. Allan R. N. Howlin R. P. Stoodley P. Hall-Stoodley L. Nat. Rev. Microbiol. 2017;15:740–755. doi: 10.1038/nrmicro.2017.99. [DOI] [PMC free article] [PubMed] [Google Scholar]
- Cao Y. Naseri M. He Y. Xu C. Walsh L. J. Ziora Z. M. J. Global Antimicrob. Resist. 2020;21:445–451. doi: 10.1016/j.jgar.2019.11.012. [DOI] [PubMed] [Google Scholar]
- Chen Y. Koripella R. K. Sanyal S. Selmer M. FEBS J. 2010;277:3789–3803. doi: 10.1111/j.1742-4658.2010.07780.x. [DOI] [PubMed] [Google Scholar]
- Papa R. Artini M. Cellini A. Tilotta M. Galano E. Pucci P. Amoresano A. Selan L. Microb. Pathog. 2013;63:44–53. doi: 10.1016/j.micpath.2013.05.003. [DOI] [PubMed] [Google Scholar]
- Wang B. Yao Y. Wei P. Song C. Wan S. Yang S. Zhu G. M. Liu H. M. Int. J. Biol. Macromol. 2021;167:1424–1434. doi: 10.1016/j.ijbiomac.2020.11.096. [DOI] [PubMed] [Google Scholar]
- Goel M. Kalra R. Ponnan P. Jayaweera J. Kumbukgolla W. W. Microb. Pathog. 2021;150:104676. doi: 10.1016/j.micpath.2020.104676. [DOI] [PubMed] [Google Scholar]
- Mohammed Y. H. E. Manukumar H. M. Rakesh K. P. Karthik C. S. Mallu P. Qin H. L. Microb. Pathog. 2018;123:339–347. doi: 10.1016/j.micpath.2018.07.002. [DOI] [PubMed] [Google Scholar]
- Vergara A. Normanno G. Di Ciccio P. Pedonese F. Nuvoloni R. Parisi A. Ghidini S. Colagiorgi A. Zanardi E. Ghidini S. Ianieri A. J. Food Sci. 2017;82:2364–2370. doi: 10.1111/1750-3841.13846. [DOI] [PubMed] [Google Scholar]
- Spiegel C. Steixner S. J. M. Coraça-Huber D. C. Antibiotics. 2022;11:932. doi: 10.3390/antibiotics11070932. [DOI] [PMC free article] [PubMed] [Google Scholar]
- Otto M. Annu. Rev. Med. 2013;64:175–188. doi: 10.1146/annurev-med-042711-140023. [DOI] [PubMed] [Google Scholar]
- Yuan Z. Wang J. Qu Q. Zhu Z. Xu M. Zhao M. Sun C. Peng H. Huang X. Dong Y. Dong C. Zheng Y. Yuan S. Li Y. Adv. Sci. 2023;10:2302459. doi: 10.1002/advs.202302459. [DOI] [PMC free article] [PubMed] [Google Scholar]
- Selvaraj A. Jayasree T. Valliammai A. Pandian S. K. Front. Microbiol. 2019;10:2027. doi: 10.3389/fmicb.2019.02027. [DOI] [PMC free article] [PubMed] [Google Scholar]
- Pokorný J. Olejníková D. Frydrych I. Lišková B. Gurská S. Benická S. Šarek J. Kotulová J. Hajdúch M. Džubák P. Urban M. Eur. J. Med. Chem. 2021;224:113706. doi: 10.1016/j.ejmech.2021.113706. [DOI] [PubMed] [Google Scholar]
- Gurbanov R. Sokolov A. Golovach S. Melnykov K. Dobrydnev A. V. Grygorenko O. O. Synthesis. 2020;53:1771–1784. [Google Scholar]
- Sader H. S. Mendes R. E. Pfaller M. A. Flamm R. K. J. Antimicrob. Chemother. 2019;74:1306. doi: 10.1093/jac/dkz006. [DOI] [PubMed] [Google Scholar]
- Yu Y. Huang H. L. Ye X. Q. Cai D. T. Fang J. T. Sun J. Liao X. P. Liu Y. H. Front. Microbiol. 2020;11:1919. doi: 10.3389/fmicb.2020.01919. [DOI] [PMC free article] [PubMed] [Google Scholar]
- Wu S. C. Han F. Song M. R. Chen S. Li Q. Zhang Q. Zhu K. Shen J. Z. J. Agric. Food Chem. 2019;67:10222–10234. doi: 10.1021/acs.jafc.9b01795. [DOI] [PubMed] [Google Scholar]
- Yadav B. P. Ahmad I. Thakur M. IOSR J. Pharm. 2016;10:27–33. [Google Scholar]
- Kot B. Sytykiewicz H. Sprawka I. Int. J. Mol. Sci. 2018;19:3487. doi: 10.3390/ijms19113487. [DOI] [PMC free article] [PubMed] [Google Scholar]
- Yao Z. Xiang M. Yang Y. Shao W. Zhang J. Wang L. Liu B. Tang W. Zhang J. Int. Immunopharmacol. 2024;143:113303. doi: 10.1016/j.intimp.2024.113303. [DOI] [PubMed] [Google Scholar]
- Jia J. Zheng M. Zhang C. Li B. Lu C. Bai Y. Tong Q. Hang X. Ge Y. Zeng L. Zhao M. Song F. Zhang H. Zhang L. Hong K. Bi H. Sci. Adv. 2023;9:eadg5995. doi: 10.1126/sciadv.adg5995. [DOI] [PMC free article] [PubMed] [Google Scholar]
Associated Data
This section collects any data citations, data availability statements, or supplementary materials included in this article.
Supplementary Materials
Data Availability Statement
Supplementary information: Chemical physical data, molecular docking, compounds spectra. See DOI: https://doi.org/10.1039/D5MD00652J.
The data supporting this article have been included as part of the SI.