

Abstract
Background
Endometrial cancer (EC) is a genomically heterogeneous malignancy with diverse immune microenvironment profiles. Although POLE mutations and MSI‐H status are established predictors of immunotherapy response, additional composite biomarkers that integrate mutational burden and immune activation are needed. PCLO and SYNE1 are frequently mutated structural genes in EC, yet their cooperative significance remains unknown.
Methods
We analyzed 505 EC cases from The Cancer Genome Atlas (TCGA) and 95 additional samples from the Clinical Proteomic Tumor Analysis Consortium (CPTAC), stratifying tumors based on PCLO and SYNE1 mutation status. Genomic, transcriptomic, immunologic, and clinical features were compared between co‐mutation and non‐co‐mutation groups. Differential expression gene and pathway enrichment were conducted to identify immune‐related transcriptional programs. Survival analysis and nomogram were performed to assess prognostic impact.
Results
PCLO and SYNE1 co‐mutation defined a notable EC subtype with significant enrichment of POLE mutations, high tumor mutation burden (TMB), reduced aneuploidy, and elevated MSIsensor scores. Clinically, the overall survival (OS), progression‐free survival (PFS), and disease‐free survival (DFS) of the co‐mutation group was significantly improved. Moreover, the co‐mutation group exhibited increased infiltration of CD8+ T cells, M1 macrophages, and activated CD4+ memory T cells, as well as upregulation of immune checkpoint genes and chemokine signaling pathways. Finally, a nomogram incorporating co‐mutation status outperformed conventional prognosticators and demonstrated high accuracy in survival prediction.
Conclusions
PCLO and SYNE1 co‐mutation identifies a biologically distinct EC subset with heightened immunogenicity and superior prognosis. The co‐mutation may serve as a robust, integrative biomarker for immune responsiveness and risk stratification in EC.
Keywords: endometrial cancer, immune microenvironment, PCLO, prognosis, SYNE1
INTRODUCTION
Endometrial cancer (EC) is one of the common malignant tumors of the female reproductive system worldwide, and its incidence rate is on the rise. The highest incidence rate is observed in North America, followed by Eastern Europe and Central Europe. 1 In the early stage of EC, treatment is mainly carried out through surgery, and the overall prognosis is relatively good. However, the treatment methods for patients with advanced metastatic or recurrent EC are limited, and the prognosis for patients is poor. In 2013, the Cancer Genome Atlas (TCGA) of the United States proposed that EC could be classified into four molecular subtypes including POLE mutant type, microsatellite highly unstable type (MSI‐H), low copy number type (CN_LOW) and high copy number type (CN_HIGH) based on the genomic, transcriptomic, and proteomic characteristics of EC. 2 Although most EC patients can be classified into different subtypes based on the new molecular classification, it has been found that some tumors exhibit multiple molecular phenotypes. 3 In 2020, POLE mutant type, mismatch repair‐deficient type (MMRd), no specific molecular profile type (NSMP) and p53 mutant type were proposed, respectively corresponding to the four molecular types of TCGA mentioned earlier. 4 Molecular types can be used to screen the beneficiaries of immunotherapy for EC, which has important guiding significance for immunotherapy and prognosis. 5
PCLO (presynaptic cytomatrix protein, Piccolo) has mainly focused on the field of neuroscience in the past. Its mutations can cause instability in gene expression, thereby affecting different pathological characteristics. 6 , 7 PCLO also frequently mutates in various tumors, including esophageal squamous cell carcinoma, gastric adenocarcinoma, endometrial cancer, and so forth. 8 , 9 , 10 Its effects on different tumors vary. For instance, it promotes the invasion of ESCC by regulating the EGFR signaling pathway, 8 but delays the progression of gastric adenocarcinoma. 9 Spectrin Repeat Containing Nuclear Envelope Protein 1 (SYNE1) mainly helps maintain the morphology of the cell nucleus and the function of the cytoskeleton tissue. It changes in various cancers, especially in ovarian cancer, where its mutations are associated with increased TMB and immune cell infiltration. 11 , 12 , 13 , 14 , 15 The reported frequencies of PCLO and SYNE1 mutation in EC reached 22% and 23%, respectively. 10 We observed a highly significant co‐occurrence of PCLO and SYNE1 mutations in EC. It was evident that in both PCLO mutation samples and SYNE1 mutation samples, the proportion of co‐mutation exceeded 50%. However, no study has confirmed the role of the co‐mutation of these two genes.
The preliminary observations of frequent co‐occurrence of PCLO and SYNE1 mutations in EC prompt us to hypothesize that their co‐mutations may define a biologically distinct subgroup with a unique immune genomic structure and clinical outcomes. We attempt to explore the prognostic impact of co‐mutation of the PCLO and SYNE1 genes on EC patients and the guiding significance of immunotherapy by analyzing various immune‐related biomarkers in the tumor microenvironment, thereby providing certain reference value for the selection of comprehensive tumor treatment. Finally, we constructed a prognostic model in combination with relevant clinical indicators to elaborate the clinical application value of co‐mutation. The flowchart is shown in Figure 1. 16 , 17
FIGURE 1.

Flowchart.
MATERIALS AND METHODS
Cohort selection and mutation stratification
A total of 505 UCEC samples with complete mutation annotation, copy number data, RNA sequencing, and clinical follow‐up were curated from TCGA. The validation set is an independent EC cohort from CPTAC (https://cptac-data-portal.georgetown.edu/cptacPublic/). PCLO and SYNE1 mutations were defined as any coding sequence alteration excluding synonymous and intronic variants. Samples were stratified into four groups: PCLO and SYNE1 co‐mutant group (PCLO+/SYNE1+), PCLO mutant and SYNE1 wild‐type group (PCLO+/SYNE1−), PCLO wild‐type and SYNE1 mutant group (PCLO−/SYNE1+), PCLO and SYNE1 double wild‐type group (PCLO−/SYNE1−). Additionally, a binary classification into co‐mutation group (PCLO+/SYNE1+) and non‐co‐mutation group (NCM) was adopted for key comparative analyses.
Molecular and immunogenomic profiling
Tumor mutation burden (TMB), Aneuploidy scores, and MSIsensor values were obtained from the cBioPortal database (https://www.cbioportal.org/). Immune cell fractions were deconvoluted from bulk RNA‐seq data using CIBERSORT. Immune gene sets were curated from immunoinhibitors, immunostimulators, chemokines, and receptors. TMB, aneuploidy scores, and MSIsensor values were compared and analyzed pairwise in the four groups, respectively. Tumor‐infiltrating immune cells and immunomodulatory gene expression were mainly compared and analyzed between the co‐mutation group and the NCM group.
Transcriptomic and pathway analysis
Differential expression gene (DEG) analysis was performed via the R software package “limma” (version3.40.6). DEGs that were significantly upregulated and significantly downregulated were screened using the cutoff of |log2FC| >1 and FDR <0.05. Hierarchical clustering and heatmaps were generated to visualize global transcriptomic remodeling. Functional enrichment was conducted using the R package “clusterProfiler” for Gene Ontology (GO) and Kyoto Encyclopedia of Genes and Genomes (KEGG) analyses. Gene set enrichment analysis (GSEA) was performed using pre‐ranked gene lists.
Survival curves and prognostic modeling
Kaplan–Meier analysis was used to compare overall survival (OS), progression‐free survival (PFS), and disease‐free survival (DFS) among different groups. The prognostic factors affecting OS independence were determined through univariate and multivariate Cox proportional hazards regression. Finally, a nomogram containing the co‐mutation status and the genomic and clinical characteristics of the samples was constructed, and the performance of the model was verified and evaluated using receiver operating characteristic (ROC), calibration curve, and decision curve analysis (DCA).
Statistical analysis
The data of numerical types (age, weight) between the two groups were compared using the Wilcoxon test, while other clinical features (pathological type, Stage) were analyzed by the Fisher exact test. The comparison of multiple sets of data was conducted using the Kruskal–Wallis rank sum test. All statistical tests were considered significant with the p‐value <0.05.
RESULTS
PCLO and SYNE1 co‐mutation define a genomically distinct EC subtype
Among 505 samples, PCLO mutation frequency was 20.0% (101 of 505) and SYNE1 mutation frequency was 23.4% (118 of 505) with a co‐mutation rate of 13.9% (70 of 505). In the PCLO mutation subgroup, nearly 70% of the samples also had SYNE1 gene mutation, and approximately 60% of the samples in the SYNE1 mutation subgroup had PCLO gene mutation. PCLO and SYNE1 genes tended to co‐occur (Fisher's exact test, p <0.001). After the cohort was divided into four groups: PCLO+/SYNE1+, PCLO+/SYNE1−, PCLO−/SYNE1+, and PCLO−/SYNE1−, the manifestations of clinical characteristics in each group were different (Table S1). The PCLO+/SYNE1+ group had a relatively earlier diagnosis age, lower weight, and a higher proportion of endometrioid endometrial adenocarcinoma than the PCLO−/SYNE1− group.
PCLO and SYNE1 were within the list of the top 20 frequently mutated genes of the 505 cases. The mutation types of the PCLO gene were mainly missense mutations, and the mutation types of the SYNE1 gene mainly include missense mutations and amplification (Figure 2a). The proportion of co‐mutation in PCLO and SYNE1 mutation groups was relatively high (Figure 2b). The PCLO+/SYNE1+ group exhibited the highest proportion of POLE‐mutant tumors (Figure 2c), consistent with a hypermutated phenotype. Compared to the other groups, the PCLO+/SYNE1+ group showed a marked increase in TMB (Figure 2d), significantly lower aneuploidy scores (Figure 2e), and elevated MSIsensor indices (Figure 2f), suggesting enhanced immunogenicity coupled with genome stability. These patterns were highly consistent when comparing the co‐mutation group to the NCM group (Figure 2g–i).
FIGURE 2.

The molecular characteristic of 505 UCEC samples. (a) Waterfall chart for genetic mutation analysis. (b) Stacked bar chart showcasing the percentages of the co‐mutation for PCLO mutation and SYNE1 mutation groups. (c) The proportion of molecular subtypes of four groups (PCLO+/SYNE1+, PCLO+/SYNE1−, PCLO−/SYNE1+, PCLO−/SYNE1−); (d) The TMB level of four groups. (e) The aneuploidy score of four groups; (f) The MSIsensor score of four groups. (g) The comparison of TMB level analysis between co‐mutation group and NCM group. (h) The comparison of aneuploidy score analysis between co‐mutation group and NCM group. (i) The comparison of MSIsensor score analysis between co‐mutation group and NCM group. PCLO+/SYNE1+/co‐mutation, PCLO and SYNE1 co‐mutant group; PCLO+/SYNE1−, PCLO mutant and SYNE1 wild‐type group; PCLO−/SYNE1+, PCLO wild‐type and SYNE1 mutant group; PCLO−/SYNE1−, PCLO and SYNE1 double wild‐type group; NCM, non‐co‐mutation; **, p <0.01; ***, p <0.001.
Co‐mutation predicts superior prognosis
Survival analysis revealed no significant differences in OS, PFS, or DFS for PCLO or SYNE1 mutation separately (Figure 3a,b). However, the co‐mutation group demonstrated significantly prolonged OS, PFS, and DFS compared to all other subgroups (Figure 3c). Especially compared with the NCM group, the co‐mutation group showed significant improvements in OS (HR = 0.38, 95% CI (0.17, 0.88), Logrank Test p = 0.02), PFS (HR = 0.32, 95% CI (0.15, 0.69), Logrank Test p <0.01), and DFS (HR = 0.19, 95% CI (0.05, 0.79), Logrank Test p = 0.01)(Figure 3d). The TMB level, aneuploidy score, and MSIsensor score had predictive effects on the efficacy of tumor immunotherapy. The POLE‐mutant subtype had obvious tumor‐infiltrating lymphocytes. So we immediately analyzed the influence of the co‐mutation group on the immune microenvironment.
FIGURE 3.

Analysis of the survival status of the UCEC samples. (a) Analysis of PCLO gene mutation on OS, PFS, and DFS. (b) Kaplan–Meier survival curves were established by SYNE1 mutation on OS, PFS, and DFS. (c) The survival curve between four groups (PCLO+/SYNE1+, PCLO+/SYNE1−, PCLO−/SYNE1+, PCLO−/SYNE1−) in OS, PFS, DFS. (d) The survival curve of comparison of co‐mutation group and NCM group in OS, PFS, DFS. OS, overall survival; PFS, progression‐free survival; DFS, disease‐free survival.
Co‐mutation remodels the immune microenvironment toward a cytotoxic‐inflamed phenotype
The exploration was mainly carried out from the cellular level to the molecular level. The co‐mutation group harbored elevated infiltration of CD8+ T cells, activated CD4+ memory T cells, T follicular helper (Tfh) cells, and M1 macrophages, while resting CD4+ memory T cells, monocytes, activated NK cells, and activated DCs were reduced (Figure 4a,b). Immune cell–cell correlation matrix analysis highlighted tight positive correlations between CD8+ T cells and M1 macrophages, Tfh cells, consistent with a Th1‐polarized milieu (Figure 4c).
FIGURE 4.

The analysis of immune characteristics between the group of co‐mutation and the NCM. (a) The analysis of 22 immune cell proportions in 505 UCEC samples. (b) The immune cell level between the co‐mutation and NCM; (c) The feedback relationship between immune cells through Pearson correlation analysis; (d) The expression levels of immune checkpoint markers (LAG3, TGFB1, BTLA, PDCD1, HAVCR2, CTLA4, CD274, et al.) beween the co‐mutation and NCM were analyzed. (e) The expression levels of chemokine markers between the co‐mutation and NCM group. (f) The expression level of chemokine receptor markers between the co‐mutation and NCM group. *, p <0.05; **, p <0.01; ***, p <0.001; ****, p < 0.0001; ‐, no significance.
At the molecular level, the co‐mutation group exhibited significant upregulation of immune checkpoints (PDCD1, CTLA4, LAG3, and HAVCR2) and costimulatory ligands (CD40, TNFSF9) (Figure 4d). Additionally, a wide array of chemokines (CXCL9, CCL5) and chemokine receptors (CCR5, CXCR3) was overexpressed (Figure 4e,f), providing mechanistic support for enhanced immune cell recruitment and retention.
Validation in CPTAC confirms immunogenic landscape of co‐mutated EC
The immune response that might be caused by the co‐mutation was further verified using the independent validation dataset of 95‐sample EC cohort. The PCLO+/SYNE1+ group showed significantly elevated TMB and POLE enrichment (Figure 5a–c). Immune deconvolution again demonstrated increased M1 macrophages and CD4+ memory activation in the co‐mutation group (Figure 5d), reinforcing the above findings.
FIGURE 5.

The immune molecular characteristic in 95 samples from CPTAC. (a) The proportion of molecular subtypes of four groups (PCLO+/SYNE1+, PCLO+/SYNE1−, PCLO−/SYNE1+, PCLO−/SYNE1−); (b) The TMB level of four groups; (c) The TMB level between the co‐mutation and NCM group; (d) The immune cell level between the co‐mutation and NCM in EC samples. EC, endometrial carcinoma.*, P<0.05; **, P<0.01; ***, P<0.001; ****, P< 0.0001; ‐, no significance.
Transcriptomic remodeling suggests immunomodulatory mechanisms
RNA‐seq data were utilized to explore the possible mechanism by which the co‐mutation affected tumorigenesis and development. The volcano map of the DEGs was obtained between the co‐mutation group and the NCM group (Figure 6a). Then a total of 668 (log2FC >1, FDR <0.05) were selected, including 338 genes with upregulated expression and 330 genes with downregulated expression (Figure 6b). These were enriched in immune‐related KEGG pathways, including T cell receptor signaling pathway (TCR signaling), PD‐L1 expression and PD‐1 checkpoint pathway, regulation of cytotoxicity by natural killer cells, and chemokine signaling pathway, and so forth. (Figure 6c). GO terms highlighted adaptive immune response, lymphocyte mediated immunity, cytokine signaling, and T cell differentiation (Figure 6d). GSEA confirmed strong positive enrichment of immune effector and trafficking pathways (Figure 6e,f), suggesting that co‐mutation modulates immune microenvironment responsiveness via transcriptional reprogramming. This clarifies the molecular mechanism of the host immune response caused by the PCLO and SYNE1 co‐mutation.
FIGURE 6.

Pathway enrichment analysis of PCLO and SYNE1 co‐mutation impact. (a) Volcano plot showing DEGs between co‐mutation and NCM groups. (b) Heatmap of 668 DEGs screening out; (c)–(d) GO/KEGG enrichment analyses based on DEGs. (e)–(f) GSEA of GO and KEGG. DEG, differential expressed genes; GSEA, gene set enrichment analysis; NES, normalized enrichment score.
Nomogram demonstrates high clinical utility
Univariate Cox analysis indicated that co‐mutation status, age, subtype, tumor type, TMB, MSIsensor score, aneuploidy score, stage, and neoplasm histologic grade were significantly correlated with OS (Table S2). Considering that the co‐mutation samples showed a high proportion of POLE mutation and significant TMB level, we ultimately selected seven indicators including the co‐mutation status, tumor type, age, aneuploidy score, MSIsensor score, stage, and neoplasm histologic grade. A prognostic nomogram integrating these features was established to predict the probabilities of 1‐year, 3‐year, and 5‐year OS (Figure 7a). The nomogram yielded high values of the area under the curve (AUC) at 1, 3, and 5 years (0.81, 0.80, 0.82; Figure 7b). The prognosis of patients with a low nomogram score was significantly improved (p <0.001, Figure 7c). Moreover, the nomogram had excellent calibration (Figure 7d) and clinical application effect (Figure 7e–g). Notably, the nomogram risk score showed substantial clinical net benefit and stratified patients into distinct prognostic categories, outperforming any single biomarker.
FIGURE 7.
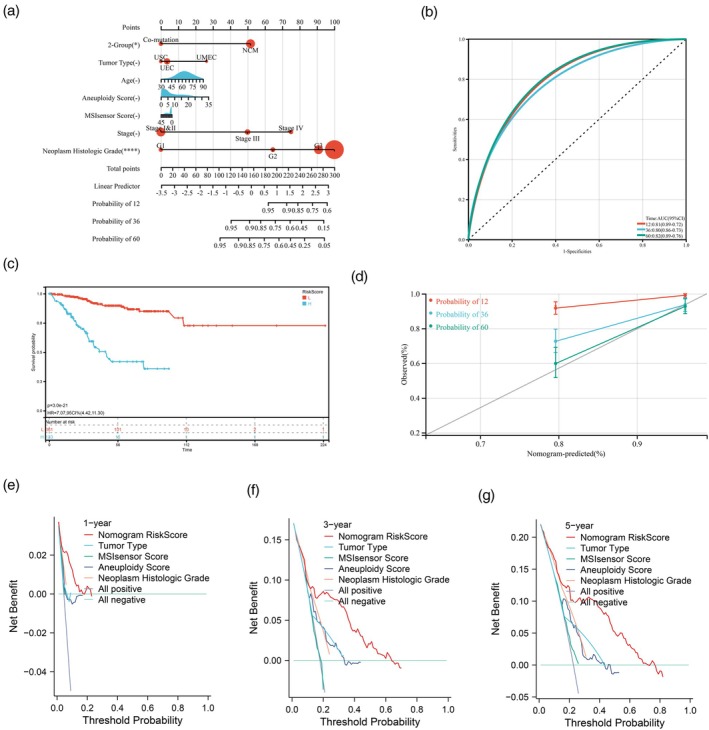
The nomogram survival model has high predictive value in prognosis. (a) The nomogram model was established to predict prognosis. (b) ROC curve analyses of the nomogram model. (c) Kaplan–Meier curves of OS in nomogram risk score. (d) Calibration plot of the nomogram for predicting the probability of OS at 1, 3, and 5 years. (e)–(g) Decision curve Analysis in 1‐, 3‐, and 5‐year OS. AUC, area under curve; CI, confidence interval; OS, overall survival; ROC, receiver operating characteristic curve; TMB, tumor mutation burden.
DISCUSSION
EC represents a molecularly heterogeneous malignancy whose pathogenesis spans microsatellite instability (MSI), POLE exonuclease domain mutations, copy number alterations, and immunoregulatory dysregulation. While advances in molecular classification have improved risk stratification and therapy selection—particularly through TCGA‐driven genomics—clinically actionable biomarkers that synergize prognostic and immunologic relevance remain scarce. In this study, we identified the co‐mutation of PCLO and SYNE1 as a defining genomic alteration in EC that stratifies a biologically distinct subgroup characterized by extremely high TMB, POLE mutation enrichment, enhanced immune cell infiltration, and prolonged clinical survival. To our knowledge, this is the first report systematically integrating mutational, transcriptomic, immunologic, and clinical prognostic insights to reveal the biological and translational implications of PCLO and SYNE1 co‐mutation in EC.
PCLO and SYNE1 genes are prone to truncating and missense mutations due to their large coding size and complex domain structure, yet their functional convergence in tumor immunity has not been previously examined. Our data revealed a remarkably high co‐occurrence rate of PCLO and SYNE1 mutations (13.9%), suggesting potential cooperativity rather than stochasticity. The co‐mutated tumors exhibit molecular hallmarks of immune‐reactive EC, including hypermutation, low aneuploidy, MSI‐H status, and most notably POLE proofreading mutations, which were significantly enriched and may reflect a shared mutagenic mechanism or selection pressure for antigenic diversity. The TMB‐H and MSI‐H tend to develop neoantigens more easily, which triggers a stronger immune response and leads to a higher rate of response to immunotherapy. 18 , 19 POLE/POLD1 mutation can identify patients who benefit from immune checkpoint inhibitors (ICIs). 20
Immunotherapy prolongs the survival time of cancer patients by activating their own immune system to generate the immune response. The common ICIs in clinical practice are mainly PD‐1/PD‐L1 and CTLA‐4 inhibitors. The objective response rate (ORR) of Pembrolizumab for patients with MMRd EC subtype can reach 49%. 21 Clinical trials have also shown that standard platinum‐based chemotherapy combined with PD‐1/PD‐L1 blockers can improve the median PFS of patients with advanced/recurrent endometrial cancer. 22 Ipilimumab is a fully human IgG1 anti‐CTLA‐4 monoclonal antibody and is the first ICI targeting CTLA‐4 approved by the FDA in 2018 for the treatment of MMRd type cancer. 23 In addition, LAG‐3 (lymphocyte activation gene‐3) may be a promising immunotherapy target for patients with microsatellite stable (MSS) EC who lack a response to PD‐L1/CTLA4 inhibitors. 24 But there is still a lack of effective biomarkers for predicting the efficacy of immunotherapy. The research results of the discovered biomarkers are not completely consistent, especially for the population with low expression of PD‐L1. 25 The biomarkers applied to EC are even fewer.
The POLE mutant type has a relatively younger age of onset and a higher degree of differentiation. The prognosis improvement of the POLE mutant type is the best among the four subtypes of EC. 26 Moreover, the POLE mutant type is a subgroup of high gene mutation load, which can lead to an increase in the level of tumor‐infiltrating lymphocytes including CD8 + T cells. 27 The EC samples of TMB‐H had a high proportion of CD8+ T cells (cytotoxic T lymphocytesphocytes, CTLs) and good survival outcome. 28 , 29 Aneuploidy is associated with tumor progression, and the number of tumor‐infiltrating immune cells with extensive aneuploidy is reduced. 30 , 31 This coincides with our discovery of the co‐mutation of PCLO and SYNE1.
Our study provides compelling evidence that PCLO and SYNE1 co‐mutation is a prognostically favorable biomarker. Unlike the separate mutation of two genes, which showed no survival benefit, the co‐mutation group exhibited significantly improved OS, PFS, and DFS. Meanwhile, the co‐mutation group harbored a robust Th1‐skewed immune microenvironment, as evidenced by the infiltration of CD8+ T cells, T follicular helper (Tfh) cells, M1 macrophages, and activated memory CD4+ T cells. These immune subsets are critical for antigen recognition, cytolytic execution, and memory response maintenance, and their abundance has been correlated with ICI responsiveness across tumor types. 32 M1 macrophages can effectively distinguish cancer cells from surrounding normal cells by recognizing cancer‐specific antigens and induce infiltration and activation of natural killer cells (NK) and cytotoxic T lymphocytes at the tumor site, indirectly inhibiting cancer progression. 33 , 34
Moreover, the upregulation of immune checkpoint genes (e.g., PDCD1, LAG3, HAVCR2) and chemokines (e.g., CXCL9, −10, −11/CXCR3) in the co‐mutation group suggests a pre‐existing adaptive immune resistance state, which is a known biomarker for PD‐1/PD‐L1 blockade efficacy. 35 Beyond phenotypic immune activation, transcriptomic analysis revealed that co‐mutated tumors are transcriptionally reprogrammed toward immune effector signaling. Differentially expressed genes were enriched in pathways including TCR signaling, PD‐1 immunosuppressant pathway, regulation of cytotoxicity by natural killer cells, chemokine and chemokine‐receptor interaction, all of which orchestrate T cell priming, trafficking, and lytic function. Immune activation may cause tumors to suppress immunity through the PD‐1/PD‐L1 checkpoint axis, but the overall immune status is still dominated by activation. These findings suggest that PCLO and SYNE1 co‐mutation not only correlates with an inflamed immune contexture but also potentially drives it via tumor‐intrinsic transcriptional cues. Whether these mutations directly alter antigen processing/presentation, chromatin accessibility, or interferon signaling remains an important avenue for mechanistic dissection. Chemokines, as important links regulating the migration and differentiation of immune cells, may provide clues for the mechanism of drug resistance of immune examination inhibitors. Cancer treatment methods for the CXCL9, −10, −11/CXCR3 axes are already under exploration. 36
Importantly, when combined with immune indicators, clinical parameters, and co‐mutation status into the nomogram, the prediction accuracy has been greatly improved, and the nomogram achieved high discriminative performance (AUC >0.80) across multiple time points. These findings support its potential utility as a stratification factor for immunotherapy trials or risk‐adapted adjuvant therapy. Although the co‐mutation did not reach statistical significance in the multivariate Cox regression after adjusting for POLE status, stage, grade, and TMB, the co‐mutation was associated with robust immunogenic features—high TMB, low aneuploidy, immune‐inflamed TME, and strong cytotoxic effector enrichment—which were all mechanistically relevant to survival. These non‐redundant molecular attributes suggest a distinct biological subtype rather than a mere surrogate of POLE mutation.
Several limitations warrant discussion. First, our study is retrospective and reliant on public datasets; although validated in CPTAC, larger multicenter cohorts are needed to confirm generalizability. Second, while we demonstrate strong associations between co‐mutation and immune activation, functional validation—for example, CRISPR‐mediated knockout, antigen presentation assays, or orthotopic murine models—is necessary to elucidate causality. 37 , 38 , 39 , 40 Finally, although PCLO and SYNE1 are not currently included in standard clinical gene panels, our findings argue for their integration into extended next‐generation sequencing (NGS) assays, particularly in immunotherapy‐eligible EC patients.
In summary, our work establishes PCLO and SYNE1 co‐mutation as a novel, functionally relevant, and clinically meaningful biomarker in endometrial cancer. It delineates a subgroup with hypermutated and immune‐enriched features, portends superior prognosis, and offers mechanistic rationale for immunotherapy responsiveness. Future work is needed to explore its pan‐cancer relevance, potential mechanistic underpinnings, and feasibility for routine clinical deployment.
AUTHOR CONTRIBUTIONS
Caihong Wu: Conceptualization; methodology; software; writing – original draft; writing – review and editing; data curation. Dongmei Han: Conceptualization; methodology; software; formal analysis; writing – review and editing. Xin Li: Methodology; validation; writing – review and editing; formal analysis. Dan Wang: Data curation; investigation. Hao Jin: Writing – review and editing; funding acquisition; project administration; conceptualization; methodology.
CONFLICT OF INTEREST STATEMENT
The authors declare no conflicts of interest.
ETHICS STATEMENT
The study was exempted from the approval of the Ethics Committee of Tianjin Cancer Hospital Airport Hospital and conformed to the provisions of the Declaration of Helsinki in 1995 (as revised in Brazil 2013), because the study data were obtained from the open database.
CONSENT STATEMENT
Informed consent was received from all participants.
Supporting information
Table S1. Demographic and clinicopathological characteristics in the EC population according to PCLO and SYNE1 mutation status.
Table S2. Univariate and Multivariate Cox Regression Analysis of Clinical Pathological Parameters with UCEC Patients.
ACKNOWLEDGMENTS
The study was sponsored by Tianjin Binhai New Area Health Research Project (Grant No. 2024BWKZ09).
Wu C, Han D, Li X, Wang D, Jin H. Co‐mutation of PCLO and SYNE1 defines an immune‐activated endometrial cancer subtype with favorable prognosis. J Obstet Gynaecol Res. 2025;51(9):e70077. 10.1111/jog.70077
Caihong Wu, Dongmei Han, and Xin Li contributed equally to this work.
DATA AVAILABILITY STATEMENT
A total of UCEC samples were curated from TCGA (https://www.cancer.gov/ccg/research/genome-sequencing/tcga).
REFERENCES
- 1. Crosbie EJ, Kitson SJ, Mcalpine JN, Mukhopadhyay A, Powell ME, Singh N. Endometrial cancer. Lancet. 2022;399(10333):1412–1428. [DOI] [PubMed] [Google Scholar]
- 2. Rossi EC, Kowalski LD, Scalici J, Cantrell L, Schuler K, Hanna RK, et al. A comparison of sentinel lymph node biopsy to lymphadenectomy for endometrial cancer staging(FIREStrial): a multi‐centre, prospective, cohortstudy. Lancet Oncol. 2017;18(3):384–392. [DOI] [PubMed] [Google Scholar]
- 3. Stelloo E, Nout RA, Osse EM, Jürgenliemk‐Schulz IJ, Jobsen JJ, Lutgens LC, et al. Improved risk assessment by integrating molecular and clinicopathological factors in early‐stage endometrial cancer‐combined analysis of the portec cohorts. Clin Cancer Res. 2016;22(16):4215–4224. [DOI] [PubMed] [Google Scholar]
- 4. Jamieson A, Mcalpine JN. Molecular profiling of endometrial cancer from TCGA to clinical practice. J Natl Compr Canc Netw. 2023;21(2):210–216. [DOI] [PubMed] [Google Scholar]
- 5. van den Heerik ASVM, Horeweg N, de Boer SM, Bosse T, Creutzberg CL. Adjuvant therapy for endometrial cancer in the era of molecular classification: radiotherapy, chemoradiation and novel targets for therapy. Int J Gynecol Cancer. 2021;31(4):594–604. [DOI] [PMC free article] [PubMed] [Google Scholar]
- 6. Minelli A, Scassellati C, Cloninger CR, Tessari E, Bortolomasi M, Bonvicini C, et al. PCLO gene: its role in vulnerability to major depressive disorder. J Affect Disord. 2012;139:250–255. [DOI] [PubMed] [Google Scholar]
- 7. Ivanova D, Dirks A, Montenegro‐Venegas C, Schöne C, Altrock WD, Marini C, et al. Synaptic activity controls localization and function of CtBP1 via binding to bassoon and piccolo. EMBO J. 2015;34:1056–1077. [DOI] [PMC free article] [PubMed] [Google Scholar]
- 8. Zhang W, Hong R, Xue L, Ou Y, Liu X, Zhao Z, et al. Piccolo mediates EGFR signaling and acts as a prognostic biomarker in esophageal squamous cell carcinoma. Oncogene. 2017;36:3890–3902. [DOI] [PubMed] [Google Scholar]
- 9. Bernhardt M, Behrens HM, Krüger S, Röcken C. Exploration of the tumour biological significance of PCLO in gastric cancer: results from a large central European cohort. Pathobiology. 2024;91(3):187–195. [DOI] [PMC free article] [PubMed] [Google Scholar]
- 10. Jiang Z, Zhu M, Zhang L, Cui H, Jiang R, Yang Y. Antitumor immunity and prognosis value elicited by FAT3 and LRP1B co‐mutation in endometrial cancer. Gynecol Oncol. 2024;187:1–11. 10.1016/j.ygyno.2024.04.023 [DOI] [PubMed] [Google Scholar]
- 11. Shah K, Patel S, Modi B, Shah F, Rawal R. Uncovering the potential of CD44v/SYNE1/miR34a axis in salivary fluids of oral cancer patients. J Oral Pathol Med. 2018;47(4):345–352. [DOI] [PubMed] [Google Scholar]
- 12. Chu YD, Kee KM, Lin WR, Lai MW, Lu SN, Chung WH, et al. SYNE1 exonic variant rs9479297 contributes to concurrent hepatocellular and transitional cell carcinoma double primary cancer. Biomedicine. 2021;9(2):1819. 10.3390/biomedicines9121819 [DOI] [PMC free article] [PubMed] [Google Scholar]
- 13. Harbin LM, Lin N, Ueland FR, Kolesar JM. SYNE1 mutation is associated with increased tumor mutation burden and immune cell infiltration in ovarian cancer. Int J Mol Sci. 2023;24(18):14212. [DOI] [PMC free article] [PubMed] [Google Scholar]
- 14. Qu Y, Gao N, Wu T. Expression and clinical significance of SYNE1 and MAGI2 gene promoter methylation in gastric cancer. Medicine. 2021;100(4):e23788. [DOI] [PMC free article] [PubMed] [Google Scholar]
- 15. Li P, Xiao J, Zhou B, Wei J, Luo J, Chen W. SYNE1 mutation may enhance the response to immune checkpoint blockade therapy in clear cell renal cell carcinoma patients. Aging. 2020;12:19316–19324. [DOI] [PMC free article] [PubMed] [Google Scholar]
- 16. Bao L, Wu Y, Ren Z, Huang Y, Jiang Y, Li K, et al. Comprehensive pan‐cancer analysis indicates UCHL5 as a novel cancer biomarker and promotes cervical cancer progression through the Wnt signaling pathway. Biol Direct. 2024;19(1):139. [DOI] [PMC free article] [PubMed] [Google Scholar]
- 17. Zheng L, Zhang J, Ye Y, Shi Z, Huang Y, Zhang M, et al. Construction of a novel cancer‐associated fibroblast‐related signature to predict clinical outcome and immune response in colon adenocarcinoma. Aging. 2023;15(18):9521–9543. [DOI] [PMC free article] [PubMed] [Google Scholar]
- 18. Palmeri M, Mehnert J, Silk AW, Jabbour SK, Ganesan S, Popli P, et al. Real‐world application of tumor mutational burden‐high (TMB‐high) and microsatellite instability (MSI) confirms their utility as immunotherapy biomarkers. ESMO Open. 2022;7(1):100336. [DOI] [PMC free article] [PubMed] [Google Scholar]
- 19. Yi M, Qin S, Zhao W, Yu S, Chu Q, Wu K. The role of neoantigen in immune checkpoint blockade therapy. Exp Hematol Oncol. 2018;7:1–11. [DOI] [PMC free article] [PubMed] [Google Scholar]
- 20. Wang F, Zhao Q, Wang YN, Jin Y, He M‐M, Liu Z‐X, et al. Evaluation of POLE and POLD1 mutations as biomarkers for immunotherapy outcomes across multiple cancer types. JAMA Oncol. 2019;5(10):1504–1506. [DOI] [PMC free article] [PubMed] [Google Scholar]
- 21. Maio M, Ascierto PA, Manzyuk L, Motola‐Kuba D, Penel N, Cassier PA, et al. Pembrolizumab in microsatellite instability high or mismatch repair deficient cancers: updated analysis from the phase II KEYNOTE‐158 study. Ann Oncol. 2022;33(9):929–938. [DOI] [PubMed] [Google Scholar]
- 22. Bogani G, Monk BJ, Powell MA, Westin SN, Slomovitz B, Moore KN, et al. Adding immunotherapy to first‐line treatment of advanced and metastatic endometrial cancer. Ann Oncol. 2024;35(5):414–428. [DOI] [PubMed] [Google Scholar]
- 23. Crimini E, Boscolo Bielo L, Berton Giachetti PPM, Pellizzari G, Antonarelli G, Taurelli Salimbeni B, et al. Beyond PD(L)‐1 blockade in microsatellite‐instable cancers: current landscape of immune co‐inhibitory receptor targeting. Cancers. 2024;16(2):281. [DOI] [PMC free article] [PubMed] [Google Scholar]
- 24. Hong JH, Cho HW, Ouh YT, Lee JK, Chun Y. Lymphocyte activation gene (LAG)‐3 is a potential immunotherapeutic target for microsatellite stable, programmed death‐ligand 1 (PD L1)‐positive endometrioid endometrial cancer. J Gynecol Oncol. 2023;34(2):e18. [DOI] [PMC free article] [PubMed] [Google Scholar]
- 25. Shum B, Larkin J, Turajlic S. Predictive biomarkers for response to immune checkpoint inhibition. Semin Cancer Biol. 2022;79:4–17. [DOI] [PubMed] [Google Scholar]
- 26. Mcalpine JN, Chiu DS, Nout RA, Church DN, Schmidt P, Lam S, et al. Evaluation of treatment effects in patients with endometrial cancer and pole mutations: An individual patient data meta‐analysis. Cancer. 2021;127(14):2409–2422. [DOI] [PubMed] [Google Scholar]
- 27. Talhouk A, Derocher H, Schmidt P, Leung S, Milne K, Gilks CB, et al. Molecular subtype not immune response drives outcomes in endometrial carcinoma. Clin Cancer Res. 2019;25(8):2537–2548. [DOI] [PubMed] [Google Scholar]
- 28. Workel HH, Komdeur FL, Wouters MCA, Plat A, Klip HG, Eggink FA, et al. CD103 defines in traepithelial CD8+ PD1+ tumour‐infiltrating lymphocytes of prognostic significance in endometrial adenocarcinoma. Eur J Cancer. 2016;60:1–11. [DOI] [PubMed] [Google Scholar]
- 29. Dai Y, Zhao L, Hua D, Cui L, Zhang X, Kang N, et al. Tumor immune microenvironment in endometrial cancer of different molecular subtypes: evidence from a retrospective observational study. Front Immunol. 2022;13:1035616. [DOI] [PMC free article] [PubMed] [Google Scholar]
- 30. Baker TM, Waise S, Tarabichi M, van Loo P. Aneuploidy and complex genomic rearrangements in cancer evolution. Nat Cancer. 2024;5(2):228–239. [DOI] [PMC free article] [PubMed] [Google Scholar]
- 31. Hutchinson L. Biomarkers: aneuploidy and immune evasion—a biomarker of response. Nat Rev Clin Oncol. 2017;14(3):140. [DOI] [PubMed] [Google Scholar]
- 32. Ock C‐Y, Keam B, Kim S, Lee JS, Kim M, Kim TM, et al. Pan‐cancer immunogenomic perspective on the tumor microenvironment based on PD‐L1 and CD8 T‐cell infiltration. Clin Cancer Res. 2016;22:2261–2270. [DOI] [PubMed] [Google Scholar]
- 33. Duluc D, Corvaisier M, Blanchard S, Catala L, Descamps P, Gamelin E, et al. Interferon‐gamma reverses the immunosuppressive and protumoral properties and prevents the generation of human tumor‐associated macrophages. Int J Cancer. 2009;125(2):367–373. [DOI] [PubMed] [Google Scholar]
- 34. Mantovani A, Allavena P, Marchesi F, Garlanda C. Macrophages as tools and targets in cancer therapy. Nat Rev Drug Discov. 2022;21(11):799–820. [DOI] [PMC free article] [PubMed] [Google Scholar]
- 35. Bai X, Zhou Y, Yokota Y, Matsumoto Y, Zhai B, Maarouf N, et al. Adaptive antitumor immune response stimulated by bio‐nanoparticle based vaccine and checkpoint blockade. J Exp Clin Cancer Res. 2022;41(1):132. [DOI] [PMC free article] [PubMed] [Google Scholar]
- 36. Tokunaga R, Zhang W, Naseem M, Puccini A, Berger MD, Soni S, et al. CXCL9, CXCL10, CXCL11/CXCR3 axis for immune activation—a target for novel cancer therapy. Cancer Treat Rev. 2018;63:40–47. [DOI] [PMC free article] [PubMed] [Google Scholar]
- 37. Horvat NK, Karpovsky I, Phillips M, Wyatt MM, Hall MA, Herting CJ, et al. Clinically relevant orthotopic pancreatic cancer models for adoptive T cell transfer therapy. J Immunother Cancer. 2024;12(1):e008086. [DOI] [PMC free article] [PubMed] [Google Scholar]
- 38. Iorgulescu JB, Ruthen N, Ahn R, Panagioti E, Gokhale PC, Neagu M, et al. Antigen presentation deficiency, mesenchymal differentiation, and resistance to immunotherapy in the murine syngeneic CT2A tumor model. Front Immunol. 2023;14:1297932. [DOI] [PMC free article] [PubMed] [Google Scholar]
- 39. Liu C, Liu X, Xiang X, Pang X, Chen S, Zhang Y, et al. A nanovaccine for antigen self‐presentation and immunosuppression reversal as a personalized cancer immunotherapy strategy. Nat Nanotechnol. 2022;17(5):531–540. [DOI] [PubMed] [Google Scholar]
- 40. Chiu DK‐C, Zhang X, Cheng BY‐L, Liu Q, Hayashi K, Yu B, et al. Tumor‐derived erythropoietin acts as an immunosuppressive switch in cancer immunity. Science. 2025;388:eadr3026. [DOI] [PMC free article] [PubMed] [Google Scholar]
Associated Data
This section collects any data citations, data availability statements, or supplementary materials included in this article.
Supplementary Materials
Table S1. Demographic and clinicopathological characteristics in the EC population according to PCLO and SYNE1 mutation status.
Table S2. Univariate and Multivariate Cox Regression Analysis of Clinical Pathological Parameters with UCEC Patients.
Data Availability Statement
A total of UCEC samples were curated from TCGA (https://www.cancer.gov/ccg/research/genome-sequencing/tcga).