

Abstract
Fluoride (F−) and arsenic (As) are the two most conspicuous contaminants, in terms of distribution and menace, in aquifers cause health problems. These contaminants in the shallow aquifers of the eastern Henan Plain, posing serious health risks for the local residents. A total of 136 groundwater samples (74 from the dry season and 62 from the wet season) were analyzed to investigate the to assess the levels and mechanisms of high F− and As enrichment in groundwater. Statistical and geostatistical methods, including charge balance calculations and health risk assessments, were employed to evaluate the spatial distribution and associated health risks of these contaminants. The results indicate the maximum concentrations of 2.82 mg/L for F− and 51.4 μg/L for As, predominantly in the central, eastern, and southern regions of the study area, particularly at depths of 10–40 m. Elevated levels of these contaminants are associated with higher pH and increased Na+, HCO3−, SO42− ions, while Ca2+ levels are depleted, attributed to fluorite and sulfide-bearing minerals and anthropogenic activities. The northern part shows a higher vulnerability to non-carcinogenic health risks, whereas the southeastern region exhibits greater carcinogenic risks. The hazard index (HI) values exceeding 1.0 suggest significant non-carcinogenic health risks. The study addresses a significant gap by comprehensively examining the co-occurrence and mechanisms of fluoride and arsenic in groundwater, providing critical data for policymakers to enhance and improve water quality management.
Keywords: Groundwater contamination, F⁻/As Co-occurrence, Health risk, Geostatistical mapping, Hydrochemical analysis
Introduction
Groundwater contamination particularly from harmful elements like fluoride (F⁻) and arsenic (As) poses a significant global health risk. These naturally occurring contaminants are widely distributed in various geological formations, leading to serious health concerns in many regions around the world (Alao et al. 2023b, Zeng et al. 2024). Notably, the Indo-Gangetic and Brahmaputra flood plains in India and Bangladesh have been identified as critical hotspots for high levels of these pollutants, affecting millions of people (Das et al. 2017, Jha &Tripathi 2021). Fluoride, a trace element widely distributed in nature, critically impacts human health. While an appropriate intake of F− can strengthen tooth enamel, prolonged consumption of drinking water with excessive F− can lead to dental and skeletal fluorosis (Han et al. 2021, Iqbal et al. 2023, Kabir et al. 2020). The World Health Organization (WHO) sets the upper limit for F− content in drinking water at 1.5 mg/L (WHO 2022), while Chinese standards stipulate a maximum of 1.0 mg/L (Wang et al. 2021a). In addition, As is a toxic element that normally originates in subsurface water and is one of the major important groundwater pollutants. As comes into the As cycle as dust and/or by dissolution in rain, open water (such as rivers, ponds), and groundwater (Jiang et al. 2023). Therefore, As pollution in groundwater poses severe risks to humans worldwide. The WHO recommended value of As for drinking water is 10 μg/L (WHO 2022). Long-term intake of groundwater with high As contents causes various non-carcinogenic effects, including skin damage, circulatory problems, abnormal pigmentation, as well as an increased risk of lung and kidney cancers (De et al. 2022, Su et al. 2021). The co-occurrence of F− and As in groundwater is commonly observed in arid and semi-arid areas of Latin America, Bangladesh, and China (Huq et al. 2019, Kumar et al. 2020, Xu et al. 2024). The co-occurrence of F⁻ and As in groundwater is influenced by various geological and hydrochemical conditions. Key factors include the presence of specific geological formations, such as volcanic rocks and sedimentary basins, which can naturally contain both elements (Kumar et al. 2020). High alkalinity and elevated pH levels enhance the solubility and mobility of arsenic, while also facilitating the dissolution of fluoride. Additionally, ionic strength plays a significant role in the co-leaching of these contaminants (Xu et al. 2024). Areas affected by mining activities or agricultural runoff are particularly vulnerable, as these practices can introduce both fluoride and arsenic into groundwater systems (Das et al. 2017). In China, notable areas with F− and As groundwater include the Datong Basin in Shanxi Province (Hao &Wu 2023), the Hetao Basin in Inner Mongolia Autonomous Region (Zhang et al. 2014), and the Kuitun area in the Xinjiang Uyghur Autonomous Region (Li et al. 2021a). In the eastern Henan Plain of Northern China, similar issues have emerged, with elevated concentrations of F⁻ and As threatening local populations. Therefore, understanding the distribution patterns, sources, and health risks associated with these contaminants in this region is essential for developing effective water quality management strategies and safeguarding public health.
The contamination of groundwater with F− primarily results from the dissolution of fluoride-bearing minerals, desorption from sediment surfaces, and ion exchange processes. As is released into groundwater through the reductive dissolution of arsenic-bearing iron (hydr)oxides in sediments. High pH and alkaline conditions prevalent in these regions facilitate the desorption and hydrolysis of both F− and As (LaFayette et al. 2020, Lu et al. 2023, Mukherjee &Singh 2020). Additionally, strong evaporation processes significantly enhance the concentrations of F− and As in groundwater (Ruidas et al. 2024). Human activities, such as mining (coal and phosphate rock), land-use change (intensive agricultural practices and urbanization), and industrial emissions (coal-fired power plants, fertilizers, pesticides, and chemical manufacturing), further exacerbate the enrichment of these contaminants (Amiri &Berndtsson 2020, Li et al. 2019, Zhang et al. 2022).
Recent studies have increasingly focused on the genesis, distribution, characteristics, geochemical processes, and health hazards associated with geogenic-contaminated groundwater, particularly concerning fluoride and arsenic contamination (Abanyie et al. 2023, Alao et al. 2023a, Chaithra et al. 2020, Parrone et al. 2020, Wang et al. 2021b). A significant mechanism contributing to elevated F− concentrations in groundwater is the removal of calcium ions (Ca2+) through precipitation processes. Ca2+ and OH− tend to form a precipitate and precipitate out, thus releasing F− into the water. In addition, a suitable HCO3− concentration favors the production of precipitation of HCO3− with Ca2+ in groundwater, thereby promoting the dissolution of fluorine-containing minerals (e.g., fluorite) and increasing the concentration of F− in groundwater (Su et al. 2013). In parallel, research has identified the reductive dissolution of As-containing iron oxides under reducing conditions and the desorption of As from sediment surfaces in alkaline environments as key mechanisms for As mobilization and enrichment within aquifers (Moore et al. 2023, Shao et al. 2020, Zhang et al. 2020a). Furthermore, molecular analyses of organic matter along the groundwater flow path have indicated that the migration of refractory organic molecules facilitates As release from sediments. This process occurs through electron shuttling, complexation, and competitive adsorption, with water temperature and pH playing significant roles in accelerating these mechanisms (Aftabtalab et al. 2022, Jiang et al. 2022). The pH significantly influences mechanisms such as the reductive dissolution of As-containing iron oxides under reducing conditions and the desorption of As from sediment surfaces in alkaline environments. Additionally, it affects the migration of refractory organic molecules, which can enhance arsenic mobilization in groundwater. There is a limited understanding of the co-occurrence and co-enrichment mechanisms of F⁻ and As in groundwater. While previous studies have extensively detailed the individual mechanisms of F⁻ and As enrichment in groundwater, research on their co-enrichment mechanisms has been limited. Most investigations have primarily addressed groundwater contamination by either high F⁻ or high As levels, with few studies exploring the co-occurrence and co-enrichment of both contaminants. There is a notable lack of research examining exposure to F⁻ and As-contaminated groundwater across various landforms, and even fewer studies have projected the population at risk for associated health issues. Additionally, there is a lack of research on health risks associated with exposure to both contaminants, highlighting the need for comprehensive assessments in the eastern Henan Plain. Despite mounting evidence of groundwater contamination in proximity to unmanaged landfills, limited data exist on quantified health risks in peri-urban regions (Egbueri et al. 2023).
Therefore, this study addresses this gap using a structured, risk-based framework. Addressing these gaps is crucial for developing comprehensive strategies to manage groundwater contamination and protect public health.
The specific research objectives include (1) elucidating the release, and mobilization mechanisms of F− and As; (2) generating precise maps of F− and As contaminated groundwater to identify areas of high vulnerability and affected populations; and (3) calculating the carcinogenic and non-carcinogenic health risks associated with F− and As contaminated groundwater. The findings of this study may provide a scientific foundation for developing effective and targeted policies and interventions, thereby aiding in water resource management and public health planning in affected areas. Furthermore, the research outcomes could provide practical implications for ensuring groundwater quality standards and determining effective policies to protect groundwater resources and public health. By identifying the sources and pathways of F− and As contamination, policymakers can implement comprehensive regulations and management practices to reduce risks.
Materials and methods
Study area
The eastern Henan Plain, located in the eastern part of Henan Province, encompasses the regions of Kaifeng, Shangqiu and Zhoukou cities, covering an area of approximately 28,800 km2. The study area, presented in Fig. 1, lies within a warm temperate climate characterized by arid and semi-arid monsoonal conditions. with an average annual temperature of 14.52°C and an average annual rainfall of 640.9 mm (Li et al. 2021b, Zheng et al. 2021). The region is drained by the following water systems, including the Wohui, Bao, Hui, and Tuo rivers, as well as the old courses of the Yellow River (Li et al. 2022). These water systems exhibit a dendritic pattern, flowing from the northwest to the southeast and ultimately joining the Huaihe River (Zhang et al. 2022). The lithology of the area primarily consists of Holocene and Upper Pleistocene alluvial lake sediments, which include carbonate fissure karst and intrusive rock fissure water-bearing formations (Zhang et al. 2024a). The water-bearing rock groups are predominantly composed of limestone, dolomite, and Cretaceous granodiorite, of the Paleozoic Ordovician Majiagou Formation (O2m) and the Cambrian Gushan Formation (∈3). The water-bearing layer is typically located at a depth of 97–125 m. Groundwater recharge occurs mainly through precipitation, lateral seepage from rivers, and irrigation runoff, while discharge is influenced by human activities such as mining and agriculture (Li et al. 2022, Sun et al. 2021).
Fig. 1.

Locations of the study area and the sites of groundwater samples in the Eastern Henan Plain.
Sampling and hydrochemical analysis
To investigate the hydrochemical characteristics in the study area, a total of 136 groundwater samples were collected from around 10~80 m below land surface (BLS) during August and December 2023 (Fig. 1). The sampling included 74 samples from the dry season and 62 samples from the wet season. All samples were sourced from domestic and irrigation wells. Sampling is preceded by pumping for 5 minutes or more to empty the water stored in the well pipe. Upon collection, the water samples were filtered through a 0.45 μm filter membrane. On-site measurements were taken for water temperature (T), pH, electrical conductivity (EC), and oxidation-reduction potential (ORP) using a potable multi-parameter analyzer (brand: SKZ, HS code: 9027809900, manufacturer: SKZ Industrial Co. and country of origin: China). Redox-sensitive elements, including NH4+, sulfide, Fe2+, and dissolved manganese, were analyzed with a portable Hach spectrophotometer (brand: Hach, code: AFS-9700, manufacturer: Hach Company and country of origin: USA). Samples used to test for hydroxide isotopes are sampled to fill the sampling vial without leaving a headspace. Samples collected to analyze anions were filtered, packaged, and stored directly. For trace elements and cation testing, water samples were filtered and packaged with the addition of one to two drops of concentrated nitric acid, reaching a pH of < 2 before being stored in a refrigerator. Anion and cation analysis were performed using ICP-OES/AES (brand: Agilent, code: ICP-OES 5100, manufacturer: Agilent Technologies and country of origin: USA), with a detection limit of 0.1 mg/L and a charge balance error of less than 5%.
The charge balance of anion and cation analysis with an error margin of less than 5% is essential to systematically measure the concentrations of major cations (such as Na⁺, K⁺, Ca2⁺, and Mg2⁺) and anions (including Cl⁻, SO₄2⁻, and HCO₃⁻). These concentrations are converted to equivalents by using Eq. 1.
| 1 |
Following this, the total equivalents of cations and anions are calculated and compared. The charge balance is then determined using Eq. 2.
| 2 |
Trace elements were measured using ICP-MS (brand: Agilent, model code: G3155A (for the 7500c series), manufacturer: Agilent Technologies and country of origin: USA), while As concentrations were determined using an atomic fluorescence photometer (AFS-9700). Isotopic analysis was conducted according to the Technical Guide for Isotope Analysis of Groundwater Pollution Sources, employing mass spectrometry with a PICARRO water isotope analyzer (brand: Picarro, code: L2130-i, manufacturer: Picarro, Inc. and country of origin: USA).
Health risk estimation
Health risk assessment is employed to estimate the potential health impacts of contaminants on humans at specified concentrations through various exposure pathways (Ayejoto &Egbueri 2024, Sohrabi et al. 2021). To calculate the Chronic Daily Intake (CDI) values (in mg/kg·d), Eq. 3 suggested by the United States Environmental Protection Agency (USEPA) was used.
| 3 |
where CDI is the exposure dose (mg/(kg·d)), Contamination concentration (CW) is the groundwater pollutant concentration (mg/L), Intake Rate (IR) refers average daily water intake for adults (L/d), Exposure Frequency (EF) is the exposure frequency (d/a), Exposure Duration (ED) is the continuous exposure time (a), Body Weight (BW) is the average weight per capita (kg), and Average Time (AT) (d) that exposure occurs.
The Hazard Quotient (HQ), which represents the non-cancerous risk for a single contaminant, was computed using Eq. 4 (Zhang et al. 2021) where RFD refers Reference Dose:
| 4 |
Cancerous risk (CR) via the oral pathway was assessed by Eq. 5 where SF refers Slop Fcator.
| 5 |
where HQ-the risk value of non-carcinogenic risk value (dimensionless), CDI-exposure dose (mg/(kg·d)), RFD-reference dose of chemical pollutants (mg/(kg·d)), CR- cancer hazard risk value (dimensionless), and SF-Carcinogenic slope factor of chemical substances, ((kg·d)/mg).
The total non-carcinogenic health risk was calculated by using Eq. 6.
| 6 |
where PI represents the total non-carcinogenic risk index caused by drinking groundwater, Pi-non-carcinogenic risk of each contaminant, and n-the total number of pollutants contributing to non-carcinogenic effects.
The hazard quotient (HQ) and carcinogenic risk (CR) are applied to characterize the risk associated with non-carcinogenic and carcinogenic pollutants to human health. According to these guidelines, when HQ<1 or CR<10−6, the health risks posed by pollutants can be considered negligible. Conversely, when HQ>1 or CR>10−6, pollutants may adversely affect human health.
Quality control measures
For data quality and consistency, various quality control measures are implemented. Groundwater samples were collected according to standard protocols that involved flushing wells prior to representative sampling taking place. Measurements of critical hydrochemical parameters such as pH, electrical conductivity and temperature were made using calibrated multi-parameter analyzers with daily calibration protocols that ensure accuracy and precision when making on-site measurements. Laboratory analyses were carried out with high-resolution instrumentation such as Inductively Coupled Plasma Optical Emission Spectrometry (ICP-OES) and Atomic Fluorescence Spectrometry (AFS), according to established methodologies. Quality assurance protocols included the systematic inclusion of reagent blanks, duplicate samples and certified reference materials into each analytical batch in order to assess contamination risks and ensure optimal performance of the analyses. Similarly, duplicate samples were conducted at select monitoring sites during the study in order to test reproducibility and consistency and maintain scientific integrity.
Statistical analyses and graphical tools
The Statistical Package for Social Sciences (SPSS) (version 20) was utilized for the statistical analyses, including maximums, minimums, means, SD, CV, and analytical error. The AqQA RockWare software (version 1.1.1 [1.1.5.1] AqQA LLC, 2006) was employed to produce the Piper diagram to define the water type and assess water chemistry. Box and whisker plots of major ions were created by OriginLab (version 8E, OriginLab Corporation, 2007). Additionally, ArcGIS (version 10.8) was used to draw spatial distribution maps.
Results and interpretation
Groundwater chemistry
In the eastern Henan Plain, significant impacts of seasonal variations were observed in the physical and chemical parameters of groundwater, highlighting the role of hydrological cycles on water chemistry and quality. The contents of hydrochemical components in groundwater are shown in Table 1. The average pH decreased from 7.93 in the dry season to 7.26 during the wet season, indicating a shift towards more acidic conditions. It may be attributed to several interrelated factors associated with increased precipitation. Rainfall introduces dissolved carbon dioxide from the atmosphere into groundwater, resulting in the formation of carbonic acid, which contributes to pH reduction. During the wet season, particularly the decomposition of organic materials, organic acids can be released into groundwater, which may reduce pH. Furthermore, soil leaching due to heavy rainfall may mobilize naturally occurring acids, amplifying the overall decrease in pH. Collectively, these processes influence the impact of seasonal hydrological changes on groundwater chemistry, leading to noticeable shifts in acidity. Electrical conductivity (EC) showed a decline from 1571 µS/cm to 1379 µS/cm, suggesting reduced ion concentrations, whereas total dissolved solids (TDS) experienced an increase from 771.5 mg/L to 928.7 mg/L, indicative of enhanced leaching processes during the wet season. During the wet season, increased rainfall can enhance leaching processes, removing certain ion concentrations from the groundwater and reducing EC. This leaching influences the mobilization of less soluble or non-ionic substances that contribute to TDS, such as organic matter and particulate matter, which do not significantly affect EC measurements. Moreover, the composition of dissolved solids can change during this period. For instance, while some ions might be washed away, others that are less conductive could enter the groundwater system, leading to a decrease in EC despite an overall increase in TDS. This indicates the balance of ions and other dissolved substances and the complexity of water chemistry dynamics during seasonal changes. Remarkable decreases of K⁺ and Na⁺ concentrations in groundwater, from 7.58 mg/L to 1.15 mg/L and from 172.6 mg/L to 126.8 mg/L, respectively. It reflects potential leaching effects and further supports the dilution effect of rainfall. Conversely, levels of Cl⁻ and HCO₃⁻ rose significantly, from 99.31 mg/L to 158.7 mg/L and from 659.9 mg/L to 778.4 mg/L, respectively, indicating contributions from surface runoff and potential contamination. Additionally, F⁻ and NO₃⁻ concentrations increased markedly, from 1.19 mg/L to 1.71 mg/L and from 4.21 mg/L to 17.28 mg/L, underscoring the risks associated with agricultural runoff during wetter periods. Stable isotopes of δD and δ1⁸O showed only slight variations, suggesting consistent hydrological sources across seasons. These findings emphasize the dynamic nature of groundwater chemistry influenced by seasonal changes, necessitating continuous monitoring to ensure water quality and inform management practices.
Table 1.
Statistics of physical and chemical parameters of groundwater samples in the eastern Henan Plain
| Dry season | Wet season | ||||||||||
|---|---|---|---|---|---|---|---|---|---|---|---|
| Properties | Unit | Minimum value | Maximum value | Average | SD | CV | Minimum value | Maximum value | Average | SD | CV |
| pH | 7.20 | 10.20 | 7.93 | 0.48 | 0.06 | 6.58 | 8.46 | 7.26 | 0.32 | 0.04 | |
| EC | µS/cm | 9.88 | 6810 | 1571 | 935 | 0.60 | 110 | 4480 | 1379 | 756.20 | 0.55 |
| TDS | mg/L | 332 | 3360 | 771.50 | 37.19 | 0.05 | 144.80 | 2713 | 928.70 | 486 | 0.52 |
| K+ | mg/L | Nd | 95.10 | 7.58 | 17.69 | 2.33 | 0.20 | 5.74 | 1.15 | 1.04 | 0.90 |
| Na+ | mg/L | 24.00 | 1200 | 172.60 | 166.43 | 0.96 | 15.11 | 341.30 | 126.80 | 68.14 | 0.54 |
| Ca2+ | mg/L | 4.81 | 220 | 83.46 | 42.26 | 0.51 | 5.54 | 150.10 | 54.82 | 31.37 | 0.57 |
| Mg2+ | mg/L | 16.40 | 254 | 68.60 | 37.19 | 0.54 | 5.05 | 47.90 | 30.99 | 9.71 | 0.31 |
| Cl- | mg/L | 11.40 | 696 | 99.31 | 108.10 | 1.09 | 8.55 | 879 | 158.70 | 183.10 | 1.15 |
| HCO3- | mg/L | 231 | 1310 | 659.90 | 169 | 0.26 | 154.10 | 1256 | 778.40 | 244.50 | 0.31 |
| SO42- | mg/L | 12 | 1180 | 158.50 | 198 | 1.25 | 4.63 | 868.90 | 142.20 | 176.30 | 1.24 |
| F- | mg/L | 0.26 | 2.82 | 1.19 | 0.64 | 0.54 | 0.43 | 5.14 | 1.71 | 0.91 | 0.53 |
| NO3- | mg/L | 0.45 | 56.00 | 4.21 | 8.12 | 1.93 | 0.83 | 74.03 | 17.28 | 25.00 | 1.45 |
| δD | ‰ | −68.07 | −53.27 | −61.64 | 3.63 | 0.06 | −74.93 | -44.64 | −61.15 | 5.58 | 0.09 |
| δ18O | ‰ | −9.42 | −6.94 | −8.51 | 0.5 | 0.06 | −10.09 | −5.35 | −8.34 | 0.85 | 0.1 |
Annotation: "nd": not checked out
Calcium (Ca2⁺) levels decreased from an average of 83.46 mg/L in the dry season to 54.82 mg/L in the wet season, indicating potential dilution effects due to increased rainfall. Similarly, Mg2⁺ concentrations showed a notable decline from 68.6 mg/L to 30.99 mg/L (Fig. 2), further suggesting that precipitation impacts the ionic composition of groundwater. Chloride levels increased substantially from 99.31 mg/L during the dry season to 158.7 mg/L in the wet season, which may be attributed to surface runoff and leaching of salts from surrounding soils. Conversely, SO₄2⁻ levels decreased from 158.5 mg/L to 142.2 mg/L, indicating a reduction in sulfate sources or altered transport mechanisms during wetter conditions. NO₃⁻ concentrations experienced a significant rise, from 4.21 mg/L in the dry season to 17.28 mg/L in the wet season, highlighting the potential for enhanced agricultural runoff and nutrient loading during periods of heavy rainfall. These changes underscore the complex interactions between seasonal hydrological processes and groundwater quality, necessitating ongoing monitoring to assess the implications for water resource management and environmental health.
Fig. 2.
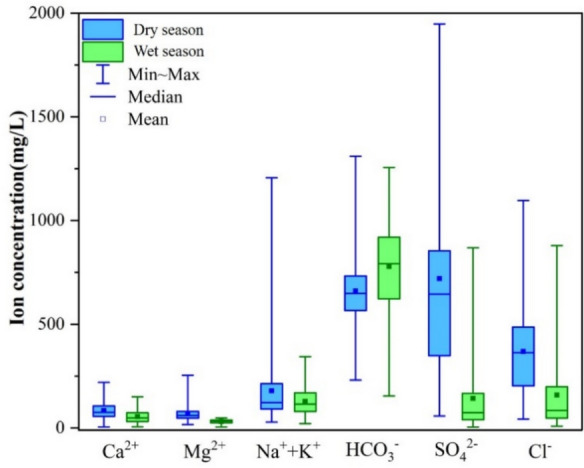
Main ion box diagram in groundwater in the eastern Henan Plain
Hydrochemical characteristics of high fluoride groundwater
The F− concentration in shallow (below 60 m) groundwater ranged from 0.26 to 2.82 mg/L, with an average value of 1.19 mg/L. 40 samples (54%) exhibited fluoride concentration exceeding 1 mg/L. In the wet season, 62 groundwater samples were collected, and 47 samples (76%) had F− concentrations above 1 mg/L. The fluoride concentrations in shallow groundwater during this period ranged from 0.43 to 22.28 mg/L, with an average of 2.04 mg/L (Table 1).
Fluoride concentration is directly related to the hydrochemical type of groundwater. As illustrated in Fig. 3, the predominant chemical types of groundwater are Na-HCO3 and Na·Ca-HCO3. High fluoride groundwater is generally associated with hydrochemical characteristics of low Ca2+, elevated Na+, and high HCO3− levels, with Na-HCO3 type being the dominant type. Low Ca2⁺ levels often result from the absence of limestone or dolomite in the geological substrate, which limits the availability of Ca2⁺ ions through weathering. Elevated Na⁺ concentrations can arise from saline intrusion in coastal aquifers, the use of sodium-rich fertilizers in agricultural practices, and the weathering of sodium-bearing minerals. Concurrently, high HCO3− levels are typically associated with the weathering of carbonate rocks, where carbon dioxide reacts with water to form bicarbonate ions, and the decomposition of organic matter, which releases carbon dioxide into the groundwater system.
Fig. 3.

Piper three-line diagram of groundwater with various F− a and As b levels in the study area (the size of the dot indicates the content of fluoride and arsenic)
Hydrochemical characteristics of high as groundwater
The pH of low-arsenic groundwater in the study area ranges from 6.58 ~ 10.20, the average value is 7.6. The oxidation-reduction potential (ORP) ranges 124.5 ~ 288 mV, with an average value of 103.4 mV. The TDS in this groundwater varies from 145 ~ 3360 mg/L, averaging 860 mg/L. In contrast, high-arsenic groundwater exhibits a pH range of 7.06 ~ 8.2, with the mean value of 7.7. Its ORP varies from −124.5 ~ 212.9 mV, averaging 103 mV, while TDS concentrations range from 360 ~ 1340 mg/L, with an average of 672 mg/L. High TDS groundwater is mainly found in the shallow groundwater areas near the Yellow River. From the dry season to the wet season, the redox environment of groundwater changes from oxidation to weak reduction due to increased groundwater levels. Except for a few samples, the concentrations of SO42− and NO3− in groundwater are generally lower than 250 mg/L and 20 mg/L, respectively. High concentrations of HCO3− in high-arsenic groundwater are typically between 500 and 800 mg/L, suggesting microbial degradation of organic matter exists within the aquifers, which enhances the reducibility of the groundwater.
HCO3−Na·Ca and Na-HCO3 are the predominant hydrochemical types for both dry and wet seasons in the study area. Most cationic samples are located in the lower right of the cationic triangle, with higher Na+ content relative to Ca2+ and Mg2+, with a predominant Na type followed by Ca type. Anionic samples are mainly found in the lower left of the anion region, indicating that HCO3− is the dominant anion in both groundwater and surface water, while the contributions of Cl− and SO42− are minimal. The variation in As concentration reveals that the hydrochemical type of high-arsenic groundwater (more than 10 μg/L) is predominantly HCO3−Na·Ca, whereas the low-arsenic groundwater is mainly classified as HCO3−Na·Ca and Na-HCO3 types, showing minimal differences (Fig. 3).
Spatial distribution of F− and as in groundwater
The concentration of F− in groundwater across the eastern Henan Plain is high and widely distributed throughout the region (Fig. 4a). During the dry season, 74 monitoring points were established, with 54% (n=40) of the samples exceeding the national standard (F−>1 mg/L). In the wet season, this percentage increased to 76% (n=47) from shallow groundwater sources. The maximum F− concentration in the dry season reached up to 2.82 mg/L, located in Miaodong Village, Liyuan Township, Zhecheng County, and Shangqiu City. In the wet season, the highest concentration was found to be 5.14 mg/L in Caozhuang, Huabao Town, Ningling County, and Shangqiu City. During the wet season, increased precipitation enhances the leaching of fluoride from surrounding soils and minerals, particularly from fluoride-bearing minerals such as fluorite and apatite. This process mobilizes fluoride ions into the groundwater system, leading to elevated concentrations. Additionally, the dilution effect observed in the dry season, when groundwater levels are lower and evaporation rates are higher, can concentrate other ions, but the influx of precipitation during the wet season outweighs this effect, resulting in higher fluoride levels. Areas with lower F− concentrations (<1 mg/L) are relatively scattered, primarily distributed near the old course of the Yellow River, in the eastern and central parts of the study area. Conversely, regions with higher F− concentrations (>2 mg/L) are predominantly located in Suixian, Zhecheng, Qixian, and Minquan in the western part of the study area.
Fig. 4.

Spatial distribution map of a F− and b As concentration of monitoring sampling points in the eastern Henan Plain
During the dry season, 74 groundwater monitoring points were surveyed, revealing As concentrations ranged from 0.3 to 51.4 μg/L, with a CV of 1.83. It indicates significant spatial variability in As concentrations across the study area. Notably, 12.16% of the water samples exceeded the WHO standard of 10 μg/L. In particular, 5 monitoring points recorded As concentrations greater than 20 μg/L, located in Minquan County, Yucheng County, Xiayi County in Shangqiu City, and Ningling County. In the wet season, 62 groundwater monitoring points were investigated, with 3 samples exceeding the WHO standard, all located in Shangqiu City (Fig. 4b). During this season, As concentrations in groundwater ranged from 0 to 31.72 μg/L, with the mean value of 2.07 μg/L.
Health risk
As groundwater serves as the main source of drinking and domestic water for rural residents, it is a significant pathway for pollutants to enter the human body (Ayejoto et al. 2024, Wang et al. 2024). Therefore, health risk assessments are calculated based on drinking water exposure pathways. During the dry season, the non-carcinogenic exposure range for As varies from 0 to 0.0017 mg/(kg·d), while the carcinogenic exposure range is from <0.0007 mg/(kg·d). For the F−, carcinogenic exposure range for Mn is 0.0085-0.0921 mg/(kg·d), and the non-carcinogenic exposure is from <0.0536 mg/(kg·d). The non-carcinogenic exposure range for Cl− is 0.3722-22.7265 mg/(kg·d), and for NO3− it ranges from 0.0146 to 1.8286 mg/(kg·d). In the wet season, the non-carcinogenic exposure range for As is from <0.0011 mg/(kg·d), with a carcinogenic range of <0.0005 mg/(kg·d). The non-carcinogenic exposure for F− arrays from 0.0140 to 0.7277 mg/(kg·d), while for Mn 0.0002-0.0253 mg/(kg·d). The non-carcinogenic exposure ranges for Fe, Cl−, and NO3− ranged from <0.0174, 0.2793-28.7003, and <24.0000 mg/(kg·d) respectively.
The calculated non-carcinogenic HQ and carcinogenic CR risk values for each pollutant are presented in Table 2.
Table 2.
Non-carcinogenic risk values of pollutants in dry and wet seasons
| Non-carcinogenic HQ | Non-carcinogenic CR | |||||||||||
|---|---|---|---|---|---|---|---|---|---|---|---|---|
| Pollutants | As | F- | Mn | Cl- | NO3- | As | ||||||
| Season | Dry | Wet | Dry | Wet | Dry | Wet | Dry | Wet | Dry | Wet | Dry | Wet |
| Maximum value | 5.59 | 3.56 | 2.30 | 18.19 | 0.38 | 0.18 | 97.4 | 287.00 | 1.14 | 15.00 | 0.0011 | 0.002 |
Discussion
Mechanism regulating F− mobilization and enrichment
The weakly alkaline groundwater environment in the study area (Fig. 5a) facilitates the release of F− into the groundwater system. However, the correlation between pH and F− concentration is weak, suggesting that while a suitable pH may promote the enrichment of F− in groundwater, it is not the primary controlling factor. As illustrated in Fig. 5b, there is a positive correlation between F− and HCO3−. In alkaline-rich aqueous environments, OH− and HCO3− compete for adsorption sites with F−, leading to the desorption of F− from mineral surfaces and its subsequent release into the water. In addition, appropriate HCO3− concentrations enhance the production of Ca2+ in groundwater, which promotes the dissolution of fluoride-bearing minerals such as fluorite, thereby contributing to the enrichment of F− in groundwater.
Fig. 5.

Relationship between a F− and pH b F− and HCO3− c CAⅠ-1 and CAⅠ-2 and d δD and δ18O in the study area
Cation exchange promotes the further dissolution of fluorite, because fluorite is the mineral CaF. When Na+ and K+ in the water exchanged Ca2+ and Mg2+ in adsorption state, the values of CAⅠ-1 and CAⅠ-2 would be positive; on the contrary, when Ca2+ and Mg2+ in the water exchanged Na+ and K+ in adsorption state, the values of CAⅠ-1 and CAⅠ-2 would be negative. The larger the absolute values of CAⅠ-1 and CAⅠ-2 were the larger the influence of the cationic exchange effect. CAI-1 and CAI-2 showed negative values in water samples with high fluoride (Fig. 5c). This indicates that cation exchange, mainly the exchange of Ca2+ and Mg2+ for adsorbed Na+ occurs in groundwater with high F− concentration. Consequently, the decrease in Ca2+ concentration due to cation exchange promotes the enrichment of F− in groundwater. The source of groundwater recharge and the role of evapotranspiration can be determined from the distribution of δD and δ18O in groundwater samples with the global atmospheric precipitation line (GMWL) and the local atmospheric precipitation line (LMWL) (Zhang et al. 2024b). Most samples in the study area fall below the local atmospheric precipitation line, suggesting that evaporation influences groundwater, which is favorable for F− enrichment (Fig. 5d).
The relationship between F− and Ca2+ concentrations indicates that as F− concentrations decrease, Ca2+ concentrations increase (Fig. 6a). This indicates that F− concentration in groundwater is limited by the solubility of fluorite. The dissolution balance of CaF2 is a crucial factor controlling F− concentrations in groundwater (Li et al. 2020, Su et al. 2016). Previous studies have shown that the dissolution of fluorite-containing minerals is the main source of fluoride in groundwater (Feng et al. 2020, Wang et al. 2024). Fig. 6b illustrates that the CaF2 saturation index increases with rising F− concentrations, demonstrating that the dissolution of fluorite-containing minerals is the main source of fluoride in groundwater. High fluoride concentrations are concentrated near a fluorite saturation index of 0, representing that the dissolution of fluorite occurs in a dynamic equilibrium process. The comparison of the saturation index of fluorite and gypsum (Fig. 6c) shows the relationship between these minerals in groundwater, with gypsum dissolution prevalent in the area. Ca2+ in groundwater is removed through precipitation as calcite and dolomite, which increases F− concentrations by stimulating fluorite dissolution. The supersaturation of calcite and dolomite further suggests that the unsaturation of CaSO4·2H2O and CaF2 occurs due to the precipitation of CaCO3 (Fig. 6d). By reducing Ca2+ content in groundwater, more gypsum and fluorite dissolve, inhibiting the dissolution of CaCO3. Thus, fluoride enrichment is influenced by the dissolution of fluoride-containing minerals, such as fluorite, and the calcium-containing minerals, such as calcite.
Fig. 6.

Relationship between a F− and Ca2+ b–e SICaF2 and F− and main mineral saturation index and f F− and Ca2+ activity in the study area
The samples plotted below the fluorite dissolution equilibrium line (pKfluorite=10.6) (Fig. 6f), indicating that the fluoride concentration is controlled by the solubility of fluorite (Jiang et al. 2023). When only fluorite is dissolved, the activities of F− and Ca2+ increase along trend line 1. However, most samples are located on the right side of trend line 1, suggesting that Ca2+ in groundwater has additional sources besides fluorite. Considering significant amounts of HCO3− and SO42− in groundwater, these Ca2+ ions may originate from dissolved calcite, dolomite, and gypsum. When calcite and fluorite are dissolved in a mass ratio of 200:1, the activities of F− and Ca2+ increase along trend line 2. Most water sample points fall between trend line 1 and trend line 2, indicating that F− concentration is influenced by both fluorite dissolution and the control exerted by Ca2+, from the dissolution of minerals such as calcite and gypsum. Furthermore, when cation exchange or calcite precipitation occurs, the activities of F− and Ca2+ evolve along trend line 3 (Fig. 6f). The majority of water sample points are located near trend line 3, suggesting that the decrease in Ca2+ activity is likely due to calcite precipitation or cation exchange processes.
In summary, fluoride in the study area primarily originates from geogenic sources. The region’s weakly alkaline groundwater environment facilitates the release of fluoride ions (F⁻) adsorbed onto mineral surfaces into the aqueous phase through competitive desorption driven by HCO₃⁻. Concurrently, HCO₃⁻ promotes calcite precipitation, continuously depleting calcium ions (Ca2⁺) and creating a “calcium-depleted” hydrochemical setting. This disrupts the dissolution equilibrium of fluorite (CaF₂), accelerating the sustained dissolution of fluoride-bearing minerals. The cation exchange process (evidenced by negative CAI values) further exacerbates calcium deficiency via Na⁺-Ca2⁺ exchange, thereby weakening the inhibition of fluorite dissolution. Although gypsum dissolution introduces exogenous Ca2⁺, this input is absorbed and transformed through calcite precipitation, maintaining low calcium concentrations. Evaporation concentrates ionic concentrations and prolongs water-rock interaction times, amplifying these cascading effects. Ultimately, fluoride enrichment occurs within a dynamic hydrochemical context characterized by weak alkalinity and calcium depletion, highlighting the synergistic control of natural processes involving mineral dissolution equilibrium, ionic competition, and hydroclimatic influences.
Factors causing as enrichment in groundwater
In groundwater with a pH range of 4–9, As mainly exists as arsenate or arsenite, both of which can be readily adsorbed by positively charged minerals in aqueous environments, such as iron, alumina, and acicular ferrite. As pH increases, the positive charge of these colloidal and clay minerals diminishes, thereby reducing their transformation to arsenate and arsenite. This decrease in adsorption results in higher concentrations of arsenic in the surrounding aqueous environment. The pH of groundwater is a significant factor influencing arsenic enrichment in the study area.
The reduction and dissolution of arsenic-containing iron oxides and other substances are key factors affecting As level in sediments that enter groundwater. As shown in Fig. 7b, the HCO3−/SO42− ratio for almost all groundwater samples in the study area exceeds 1 mg/L, indicating that these samples are located in a highly reducing environment. This suggests that redox conditions are crucial for As enrichment, as reducing conditions favor the release of As into groundwater. Under alkaline reducing or sub-oxidizing conditions, SO42− acts as the main redox-sensitive component (Zhao et al. 2024), and its reduction facilitates As mobilization within the aquifer. To mitigate the influence of evaporation, SO42−/Cl− (meq/L) ratio was analyzed concerning changes in SO42− (Fig. 7c). When As concentration increases, the SO42−/Cl− (meq/L) ratio in groundwater decreases, indicating desulfurization and the release of As from aquifer sediments into the groundwater. Microbial degradation-mediated desulfurization can also contribute to As mobilization, leading to an increase As enrichment in groundwater (Huq et al. 2024, Zhang et al. 2020b). High-arsenic groundwater typically exists in a strongly reducing environment.
Fig. 7.

Relationship between a As and well depth b groundwater HCO3−/SO42− ratio relationship (the size of the points represents As concentration) and (c) relationship between groundwater As and SO42−/Cl− (meq/L) ratio d Hydrochemical process of high arsenic groundwater (the size of the dots represents the As concentration) e relationship between As and HCO3− and f HCO3-/(HCO3−+ Cl−) in groundwater in the study area
The impact of evaporation can be assessed by examining the relationship between Cl− concentration and δ18O. There are three main trend distributions of high As groundwater: (i) along trend line 1, where δ18O increases sharply while chloride changes little; (ii) along trend line 2, both Cl− concentration and δ18O increase simultaneously, showing evaporation influence; and (iii) along trend line 3, the δ18O changes slightly while Cl− varies considerably, reflecting the effect of rock salt dissolution and anthropogenic pollution (Fig. 7d). The HCO3− concentration in high-arsenic groundwater is relatively elevated (Fig. 7e). In aqueous environment, HCO3− forms carbonate complexes on the mineral surface and competes with arsenate ions for adsorption sites, which can lead to increase As content in groundwater solutions. Since Cl− is highly stable due to its electronic configuration and the nature of its interactions in various environments, the HCO3−/(HCO3−+Cl−) ratio can be used to evaluate the dominance of HCO3− in the region. The analyzed samples show an increasing trend in ion ratios and As concentrations (Fig. 7f). Generally, when HCO3− is dominant, AsO43− and HCO3− share chemical structures and dissociation constants, leading to competitive adsorption from mineral surfaces. The competitive process results in the release of AsO43−, which can simultaneously be reduced to AsO33− under strong reducing conditions. Therefore, the competitive adsorption of HCO3− enhances As release and enrichment in groundwater. In addition to redox conditions and pH, other hydrochemical processes such as evaporation and cation exchange adsorption can also influence arsenic release (De et al. 2022, Moore et al. 2023). In the study area, as enrichment in groundwater is driven by both natural geological processes and anthropogenic activities, each contributing distinctively to the contamination profile. Naturally, geological formations of the region, including sedimentary deposits rich in As-bearing minerals such as pyrite and arsenopyrite, facilitate the release of as through prolonged weathering and dissolution. The hydrogeological context, characterized by reducing conditions in shallow aquifers, enhances as mobilization from iron oxides, further increasing groundwater concentrations. Conversely, anthropogenic influences, particularly from intensive agricultural practices involving arsenic-containing fertilizers and pesticides, significantly elevate as levels through leaching into the groundwater. Furthermore, industrial activities, such as chemical manufacturing, contribute to contamination via effluent discharges. Urbanization exacerbates the situation by shifting hydrological dynamics and increasing runoff, which can transport arsenic from contaminated sites into aquifers.
In the alkaline reducing aquifer environment of the Eastern Henan Plain, arsenic enrichment results from the synergistic effects of multiple geochemical processes. Firstly, the reductive dissolution of arsenic-bearing iron oxides within the sediments serves as the core driving force for arsenic release. Intense microbially-mediated degradation of organic matter consumes dissolved oxygen, creating a highly reducing environment (HCO₃⁻/SO₄2⁻ > 1), which drives sulfate-reducing bacteria to utilize SO₄2⁻ as an electron acceptor (the SO₄2⁻/Cl⁻ ratio decreases as arsenic concentration increases). This process not only directly disrupts the mineral structure of iron oxides, releasing adsorbed arsenic, but also generates sulfides that participate in complex reactions involving co-precipitation or re-adsorption with arsenic. Secondly, the high pH (generally >7) weakens the surface positive charge of iron (hydr)oxides and clay minerals in the aquifer, significantly reducing their adsorption capacity for arsenate and arsenite, thereby facilitating the desorption of arsenic into the aqueous phase. Simultaneously, the high concentration of HCO₃⁻ in the enrichment environment further exacerbates arsenic release through competitive adsorption mechanisms. The dissociated arsenic can then be reduced to the more mobile arsenite (As3⁺) under strong reducing conditions, posing serious health risks for drinking and irrigation. Spatially, these processes are controlled by sedimentary facies—paleochannels or river-lacustrine sedimentary units rich in organic matter and easily reducible iron, sustaining reducing conditions through continuous microbial metabolism. Ultimately, this forms a dynamic mechanism for arsenic enrichment dominated by iron reduction-desulfurization, synergistically influenced by pH and carbonate competition.
Health risk assessment of groundwater
Health risk assessment quantifies the risk that pollutants pose to human health. In this study, we selected the risk assessment framework from the EPA (A framework for assessing health risk of environmental exposures to children, 2006). The elements selected for health risk assessment include As, F−, Fe, Mn, NO3−, Cl−, and other relevant pollutants. During the dry season, all non-carcinogenic risk values of Mn were less than 1 (Table 2), indicating an acceptable level for human health. However, F− and NO3− had 29 and 1 sampling points, respectively, with HQ>1, but all the samples exhibited HQ>1 for Cl−. Additionally, the non-carcinogenic risk value for As exceeded 1 at 9 groundwater sampling points. Thus, the risk values for As, F−, and Cl− exceed acceptable levels, which negatively impact the human health of the local population. The carcinogenic risk values CR for As were >10−6 at 70 groundwater sampling points. Indicating a risk level that poses a threat to public health. In the wet season, the non-carcinogenic risk values for Mn remained below 1 (Table 2). Six sampling points for NO3− had non-carcinogenic risk values HQ>1, while 4 groundwater sampling points for As also had HQ>1. For F−, 62 groundwater sampling points showed non-carcinogenic risk values with HQ>1. Notably, none of the Cl− sampling points had carcinogenic risk values above 10−6. Therefore, the risk values for As and F− in the study area exceed the acceptable levels for human health, with the carcinogenic risk value for As exceeding 10−6 at 22 groundwater sampling points.
When the total non-carcinogenic risk index is >1, the human body is considered to be at a high non-carcinogenic risk level. In the study area, the total non-carcinogenic risk values for 73 groundwater sampling points during the dry season and 62 points during the wet season exceeded 1 (Table 3). Specifically, the risk value reached 229.19 in the dry season and increased to 288.26 in the wet season. Higher total non-carcinogenic risk areas are located in the northeast, northwest, and southwest regions of the study area (Fig. 8a). This indicates a relatively high level of non-carcinogenic risk and critical groundwater pollution in these areas. During the health risk assessment, it was found that non-carcinogenic risk values for arsenic (As) exceeded 1 at nine groundwater sampling points during the dry season. Additionally, fluoride (F⁻) and nitrate (NO₃⁻) showed non-carcinogenic risk values (HQ) greater than 1 at multiple sampling points, indicating significant health risks. Furthermore, chloride (Cl⁻) levels exhibited HQ values above 1 at all sampling points, signifying a critical level of pollution. These findings underscore the urgent need for regular monitoring and management of groundwater to mitigate health risks in the affected areas. Notably, most regions exhibiting higher non-carcinogenic risk values during the dry and wet seasons do not overlap, that may be attributed to variations in rainfall and human activities.
Table 3.
Total non-carcinogenic risks at each sampling point during the dry and wet season
| SN | PI | SN | PI | SN | PI | SN | PI | ||||
|---|---|---|---|---|---|---|---|---|---|---|---|
| Dry | Wet | Dry | Wet | Dry | Wet | Dry | Wet | ||||
| K097 | 38.91 | 62.42 | S488 | 32.16 | 25.51 | S553 | 50.63 | 17.92 | S647 | 25.50 | 11.01 |
| K105 | 24.58 | 28.83 | S495 | 46.45 | 6.07 | S558 | 12.58 | 14.54 | S651 | 15.75 | 32.85 |
| K112 | 26.79 | 48.85 | S499 | 127.29 | 93.51 | S563 | 66.60 | 31.01 | S654 | 96.98 | 87.10 |
| S438 | 17.80 | 60.79 | S502 | 14.83 | 288.26 | S565 | 12.20 | 67.04 | S655 | 46.31 | 34.03 |
| S440 | 63.78 | 15.01 | S508 | 86.54 | 30.71 | S567 | 48.33 | 15.74 | S661 | 229.19 | 47.31 |
| S442 | 6.03 | 22.84 | S510 | 157.09 | 240.73 | S569 | 19.67 | 35.05 | S663 | 20.12 | 15.57 |
| S448 | 20.81 | 267.99 | S511 | 11.91 | 63.80 | S578 | 9.65 | 15.34 | S668 | 11.78 | 15.92 |
| S453 | 20.51 | 8.27 | S516 | 24.98 | 33.85 | S582 | 49.37 | 12.22 | S669 | 13.00 | 9.42 |
| S456 | 27.81 | 5.38 | S518 | 15.79 | 103.93 | S591 | 15.75 | 26.56 | S672 | 7.92 | 23.78 |
| S465 | 13.57 | 50.35 | S527 | 56.06 | 37.71 | S598 | 96.98 | 185.71 | Z162 | 34.16 | 3.56 |
| S468 | 27.37 | 10.45 | S530 | 25.69 | 17.54 | S603 | 11.43 | 26.02 | Z217 | 13.13 | 140.10 |
| S474 | 11.85 | 27.64 | S532 | 12.43 | 20.70 | S610 | 21.21 | 65.85 | Z226 | 12.12 | 38.67 |
| S477 | 42.57 | 60.67 | S538 | 10.22 | 15.81 | S612 | 32.95 | 17.69 | Z328 | 46.31 | 84.59 |
| S478 | 23.47 | 72.92 | S540 | 65.87 | 85.95 | S626 | 13.88 | 27.37 | - | - | - |
| S482 | 38.91 | 120.12 | S542 | 33.47 | 31.64 | S631 | 21.95 | 6.80 | - | - | - |
| S485 | 67.10 | 148.66 | S551 | 55.26 | 37.82 | S643 | 46.81 | 86.07 | - | - | - |
Fig. 8.

Zoning map of a non-carcinogenic and b carcinogenic risk
Arsenic is identified as the main pollutant contributing to carcinogenic health risks in the area. The cancer risk assessment distribution map is presented in Fig. 8b. During the dry and wet seasons, As concentrations in 9 and 3 groundwater sampling sources exceeded the accepted limits. The maximum value of carcinogenic risk was 0.0011, and the range of variation of the carcinogenic risk CR of groundwater As was 0.00~1.08×10⁻³, and the mean value was 5.4×10⁻⁴. Combined with the risk classification criteria (Table 4), the probabilities of acceptable, low, and intermediate carcinogenic risk of groundwater As to adults in the zone during the dry period were 5.4%, 53.42%, and 35.42%, respectively (Table 4). According to risk level classification standards, the carcinogenic risk range for groundwater As in the wet season is classified as medium. Non−carcinogenic risk values for As and F⁻ consistently exceeded acceptable levels throughout the dry and wet seasons, indicating significant potential harm to local populations. The carcinogenic risk assessment further underscores the severity of the situation, with As presenting a carcinogenic risk greater than 10⁻⁶ at 70 samples, indicating a substantial threat to public health. Notably, the carcinogenic risk assessment revealed that As concentrations exceeded standard limits at multiple sampling points, with a notable proportion of the population facing medium to high cancer risk. The total non-carcinogenic risk index exceeded 1 at numerous locations, particularly in the northeast, northwest, and southwest regions, reflecting critical areas of groundwater pollution. It highlights an urgent need for comprehensive monitoring and effective management strategies to mitigate the impacts of these pollutants on public health in the region.
Table 4.
Distribution of health risk assessment levels of single carcinogens
| Rank | Range of carcinogenic risk | Value of risk |
|---|---|---|
| Acceptable range | ≤1×10⁻⁶ | |
| I | Low risk | 1×10⁻⁶–1×10⁻⁵ |
| II | 1×10⁻⁵–5×10⁻⁵ | |
| III | Medium risk | 5×10⁻⁵–1×10⁻⁴ |
| IV | 1×10⁻⁴–5×10⁻⁴ | |
| V | High risk | 5×10⁻⁴–1×10⁻³ |
Conclusions
High F- groundwater concentrations (>1 mg/L) are widely distributed throughout the study area. The findings indicate that high concentrations of F⁻ and As pose significant health risks to local populations, with 76% of samples exceeding acceptable fluoride levels during the wet season and notable arsenic concentrations surpassing acceptable limits. The predominant hydrochemical type of high F− water is HCO3−Na, characterized by low Ca2+ levels and elevated Na+ and HCO3− concentrations. Low F− concentrations (<1 mg/L) are scattered in the eastern and central parts of the study area, mainly near the old course of the Yellow River. Weakly alkaline conditions, pH, alternating cation adsorption, evaporation, and mineral dissolution are key factors influencing F− enrichment. Evaporation favors F− enrichment in shallow groundwater in low-lying areas. Arsenic enrichment is influenced by the dissolution of lateral recharge from the river, while the weakly alkaline and strongly reducing groundwater environment facilitates As enrichment. The high concentration of HCO3− enhances competitive adsorption, promoting the desorption of As and increasing its concentration in groundwater. The strongly reducing conditions, driven by organic matter-rich river sediments and slow runoff along the Yellow River corridor, further contribute to the release and enrichment of As. Physicochemical properties, including weakly alkaline conditions, competitive adsorption dynamics, and reducing environments, influence the enrichment of F⁻ and As mobilization. Additionally, geostatistical mapping has effectively identified vulnerable areas and populations at risk, reinforcing the urgency for targeted water quality management strategies. The health risk assessment reveals substantial non-carcinogenic and carcinogenic risks associated with F⁻ and As exposure, necessitating immediate policy interventions to safeguard public health. It indicates alarming contamination levels and recommends regulating water quality monitoring in newly exposed areas. Effective remediation strategies, such as water treatment, pollution source management, and community engagement, must accompany monitoring efforts. Moreover, the exposure of F− and As through the consumption of locally cultivated crops and vegetables should be closely monitored among the residents. By quantifying the associated health risks and providing critical data, this study contributes as a vital resource for policymakers to develop effective interventions to improve groundwater safety and protect public health in the region. Continuous monitoring and proactive management are essential to mitigate the health risks posed by these geogenic contaminants and ensure the safety of drinking water sources. Future research should focus on understanding the interactions between the co-occurring contaminants and other parameters associated with these co-contaminants.
Author contributions
All authors contributed to the study conception and design. Material preparation, data collection and analysis were performed by Xianguo Wang, Md. Enamul Huq, Ge Jiang, Haifeng Liu, Chunli Su, Jiaqi Li, Haolin Li, Ahmed Abdullah Al Dughairi and Wang Chunhui. The first draft of the manuscript was written by Md. Enamul Huq and all authors commented on previous versions of the manuscript. All authors read and approved the final manuscript.
Funding
Open access funding provided by The Ministry of Higher Education Malaysia and Universiti Pendidikan Sultan Idris. The research was financially supported by the Natural Resources Research Project of Henan Province (Henan Natural Resources Letter [2024] No. 610-5) and National Natural Science Foundation of China (Grant 42177078).
Data availability
No datasets were generated or analysed during the current study.
Declarations
Conflict of interest
The authors declare no competing interests.
Footnotes
Publisher's Note
Springer Nature remains neutral with regard to jurisdictional claims in published maps and institutional affiliations.
Xianguo Wang and Md. Enamul Huq have contributed equally to this work.
References
- Abanyie, S. K., Apea, O. B., Abagale, S. A., Amuah, E. E. Y., & Sunkari, E. D. (2023). Sources and factors influencing groundwater quality and associated health implications: A review. Emerging Contaminants,9, 100207. [Google Scholar]
- Aftabtalab, A., Rinklebe, J., Shaheen, S. M., Niazi, N. K., Moreno-Jiménez, E., Schaller, J., & Knorr, K.-H. (2022). Review on the interactions of arsenic, iron (oxy)(hydr) oxides, and dissolved organic matter in soils, sediments, and groundwater in a ternary system. Chemosphere,286, 131790. [DOI] [PubMed] [Google Scholar]
- Alao, J. O., Abdo, H. G., Ayejoto, D. A., Mohammed, M. A., Danladi, E., Saqr, A. M., Almohamad, H., & Fahad, A. (2023). Evaluation of groundwater contamination and the health risk due to landfills using integrated geophysical methods and physiochemical water analysis. Case Studies in Chemical and Environmental Engineering,8, 100523. [Google Scholar]
- Alao, J. O., Fahad, A., Abdo, H. G., Ayejoto, D. A., Almohamad, H., Ahmad, M. S., Nur, M. S., Danjuma, T. T., Yusuf, M. A., & Francis, O. T. (2023). Effects of dumpsite leachate plumes on surface and groundwater and the possible public health risks. Science of the Total Environment,897, 165469. [DOI] [PubMed] [Google Scholar]
- Amiri, V., & Berndtsson, R. (2020). Fluoride occurrence and human health risk from groundwater use at the west coast of Urmia Lake Iran. Arabian Journal of Geosciences,13, 921. [Google Scholar]
- Ayejoto, D. A., Agbasi, J. C., Egbueri, J. C., & Echefu, K. I. (2024). Assessment of oral and dermal health risk exposures associated with contaminated water resources: An update in Ojoto area, southeast Nigeria. International Journal of Environmental Analytical Chemistry,104, 641–661. [Google Scholar]
- Ayejoto, D. A., & Egbueri, J. C. (2024). Human health risk assessment of nitrate and heavy metals in urban groundwater in Southeast Nigeria. Ecological Frontiers,44, 60–72. [Google Scholar]
- Chaithra, B., Sarjan, H. N., & Shivabasavaiah. (2020). A comparative analysis of fluoride-contaminated groundwater and sodium fluoride-induced reproductive toxicity and its reversibility in male rats. Biological Trace Element Research,197, 507–521. [DOI] [PubMed] [Google Scholar]
- Das, N., Sarma, K. P., Patel, A. K., Deka, J. P., Das, A., Kumar, A., Shea, P. J., & Kumar, M. (2017). Seasonal disparity in the co-occurrence of arsenic and fluoride in the aquifers of the Brahmaputra flood plains, Northeast India. Environmental Earth Sciences,76, 1–15. [Google Scholar]
- De, A., Mridha, D., Joardar, M., Das, A., Chowdhury, N. R., & Roychowdhury, T. (2022). Distribution, prevalence and health risk assessment of fluoride and arsenic in groundwater from lower Gangetic plain in West Bengal, India. Groundwater for Sustainable Development,16, 100722. [Google Scholar]
- Egbueri, J. C., Agbasi, J. C., Ayejoto, D. A., Khan, M. I., & Khan, M. Y. A. (2023). Extent of anthropogenic influence on groundwater quality and human health-related risks: An integrated assessment based on selected physicochemical characteristics. Geocarto International,38, 2210100. [Google Scholar]
- Feng, F., Jia, Y., Yang, Y., Huan, H., Lian, X., Xu, X., Xia, F., Han, X., & Jiang, Y. (2020). Hydrogeochemical and statistical analysis of high fluoride groundwater in northern China. Environmental Science and Pollution Research,27, 34840–34861. [DOI] [PubMed] [Google Scholar]
- Han, J., Kiss, L., Mei, H., Remete, A. M., Ponikvar-Svet, M., Sedgwick, D. M., Roman, R., Fustero, S., Moriwaki, H., & Soloshonok, V. A. (2021). Chemical aspects of human and environmental overload with fluorine. Chemical Reviews,121, 4678–4742. [DOI] [PMC free article] [PubMed] [Google Scholar]
- Hao, Q., & Wu, X. (2023). Health-risk assessment and distribution characteristics of fluoride in groundwater in six basins of Shanxi Province, middle China. Environmental Science And Pollution Research,30, 15911–15929. [DOI] [PubMed] [Google Scholar]
- Huq, M. E., Fahad, S., Shao, Z., Sarven, M. S., Al-Huqail, A. A., Siddiqui, M. H., Rahman, MHu., Khan, I. A., Alam, M., & Saeed, M. (2019). High arsenic contamination and presence of other trace metals in drinking water of Kushtia district, Bangladesh. Journal of Environmental Management,242, 199–209. [DOI] [PubMed] [Google Scholar]
- Huq, M. E., David, L.-C., Fahad, A., Xijun, W., & Jiang, Wu. (2024). Identifying groundwater recharge sources and mechanisms using hydrochemistry and environmental stable isotopes in high arsenic Holocene aquifers of Bangladesh. Chiang Mai Journal of Science,5, 1–15. [Google Scholar]
- Iqbal, J., Su, C., Wang, M., Abbas, H., Baloch, M. Y. J., Ghani, J., Ullah, Z., & Huq, M. E. (2023). Groundwater fluoride and nitrate contamination and associated human health risk assessment in South Punjab, Pakistan. Environmental Science And Pollution Research,30, 61606–61625. [DOI] [PubMed] [Google Scholar]
- Jha, P. K., & Tripathi, P. (2021). Arsenic and fluoride contamination in groundwater: A review of global scenarios with special reference to India. Groundwater for Sustainable Development,13, 100576. [Google Scholar]
- Jiang, J., Wang, X., Su, C., Wang, M., Ren, F., & Huq, M. E. (2023). Unraveling the impact of dissolved organic matter on arsenic mobilization in alluvial aquifer of the lower Yellow River basin, Northern China. Applied Geochemistry,158, 105781. [Google Scholar]
- Jiang, Y., Ma, X., Wang, B., Jiang, B., Wang, W., Wang, Y., & Zhang, C. (2022). Effects of environmental factors on phosphorus adsorption capacity and release risk in lake sediments. Plant, Soil & Environment. 10.17221/41/2022-PSE [Google Scholar]
- Kabir, H., Gupta, A. K., & Tripathy, S. (2020). Fluoride and human health: Systematic appraisal of sources, exposures, metabolism, and toxicity. Critical Reviews in Environmental Science and Technology,50, 1116–1193. [Google Scholar]
- Kumar, M., Goswami, R., Patel, A. K., Srivastava, M., & Das, N. (2020). Scenario, perspectives and mechanism of arsenic and fluoride co-occurrence in the groundwater: A review. Chemosphere,249, 126126. [DOI] [PubMed] [Google Scholar]
- LaFayette, G. N., Knappett, P. S., Li, Y., Loza-Aguirre, I., & Polizzotto, M. L. (2020). Geogenic sources and chemical controls on fluoride release to groundwater in the Independence basin, Mexico. Applied Geochemistry,123, 104787. [Google Scholar]
- Li, J., Wang, Y., Zhu, C., Xue, X., Qian, K., Xie, X., & Wang, Y. (2020). Hydrogeochemical processes controlling the mobilization and enrichment of fluoride in groundwater of the North China Plain. Science of The Total Environment,730, 138877. [DOI] [PubMed] [Google Scholar]
- Li, P., He, X., Li, Y., & Xiang, G. (2019). Occurrence and health implication of fluoride in groundwater of loess aquifer in the Chinese loess plateau: A case study of Tongchuan, Northwest China. Exposure and Health,11, 95–107. [Google Scholar]
- Li, Q., Tao, H., Aihemaiti, M., Jiang, Y., Su, Y., & Yang, W. (2021). Spatial distribution characteristics and enrichment factors of high-fluorine groundwater in the Kuitun River basin of Xinjiang Uygur Autonomous Region in China. Desalination and Water Treatment,223, 208–217. [Google Scholar]
- Li, X., Lu, H., Zhang, Z., & Xing, W. (2021). Spatio-temporal variations of the major meteorological disasters and its response to climate change in Henan Province during the past two millennia. PeerJ,9, e12365. [DOI] [PMC free article] [PubMed] [Google Scholar]
- Li, X., Yan, B., Wang, Y., Wang, X., Li, Y., & Gai, J. (2022). Study of the interaction between Yellow River water and groundwater in Henan Province, China. Sustainability,14, 8301. [Google Scholar]
- Lu, M.-Y., Liu, Y., Liu, G.-J., Li, Y.-L., Xu, J.-Z., & Wang, G.-Y. (2023). Spatial distribution characteristics and prediction of fluorine concentration in groundwater based on driving factors analysis. Science of The Total Environment,857, 159415. [DOI] [PubMed] [Google Scholar]
- Moore, O. C., Xiu, W., Guo, H., Polya, D. A., van Dongen, B. E., & Lloyd, J. R. (2023). The role of electron donors in arsenic-release by redox-transformation of iron oxide minerals–A review. Chemical Geology,619, 121322. [Google Scholar]
- Mukherjee, I., & Singh, U. K. (2020). Fluoride abundance and their release mechanisms in groundwater along with associated human health risks in a geologically heterogeneous semi-arid region of east India. Microchemical Journal,152, 104304. [Google Scholar]
- Parrone, D., Ghergo, S., Frollini, E., Rossi, D., & Preziosi, E. (2020). Arsenic-fluoride co-contamination in groundwater: Background and anomalies in a volcanic-sedimentary aquifer in central Italy. Journal of Geochemical Exploration,217, 106590. [Google Scholar]
- Ruidas, D., Pal, S. C., Biswas, T., Saha, A., & Islam, A. R. M. T. (2024). Extreme exposure of fluoride and arsenic contamination in shallow coastal aquifers of the Ganges delta, transboundary of the Indo-Bangladesh region. Geoscience Frontiers,15, 101725. [Google Scholar]
- Shao, Z., Huq, M. E., Cai, B., Altan, O., & Li, Y. (2020). Integrated remote sensing and GIS approach using fuzzy-AHP to delineate and identify groundwater potential zones in semi-arid Shanxi Province, China. Environmental Modelling & Software,134, 104868. [Google Scholar]
- Sohrabi, N., Kalantari, N., Amiri, V., Saha, N., Berndtsson, R., Bhattacharya, P., & Ahmad, A. (2021). A probabilistic-deterministic analysis of human health risk related to the exposure to potentially toxic elements in groundwater of Urmia coastal aquifer (NW of Iran) with a special focus on arsenic speciation and temporal variation. Stochastic Environmental Research And Risk Assessment,35, 1509–1528. [Google Scholar]
- Su, C., Wang, Y., Xie, X., & Li, J. (2013). Aqueous geochemistry of high-fluoride groundwater in Datong Basin, Northern China. Journal of Geochemical Exploration,135, 79–92. [Google Scholar]
- Su, C., Zhu, Y., Abbas, Z., & Huq, M. E. (2016). Sources and controls for elevated arsenic concentrations in groundwater of Datong Basin, northern China. Environmental Earth Sciences,75, 1–13. [Google Scholar]
- Su, H., Kang, W., Kang, N., Liu, J., & Li, Z. (2021). Hydrogeochemistry and health hazards of fluoride-enriched groundwater in the Tarim Basin, China. Environmental Research,200, 111476. [DOI] [PubMed] [Google Scholar]
- Sun, J., Yan, B., Li, Y., Sun, H., Wang, Y., & Chen, J. (2021). Characterization and cause analysis of shallow groundwater hydrochemistry in the plains of Henan Province, China. Sustainability,13, 12586. [Google Scholar]
- Wang, M., Su, C., Wang, X., Jiang, J., Ren, F., & Liu, H. (2024). Spatial pattern, hydrogeochemical controlling processes and non-carcinogenic risks of fluoride-enriched groundwater in the North Henan Plain Northern China. Applied Geochemistry,6, 105934. [Google Scholar]
- Wang, T., Sun, D., Zhang, Q., & Zhang, Z. (2021). China’s drinking water sanitation from 2007 to 2018: A systematic review. Science of The Total Environment,757, 143923. [DOI] [PubMed] [Google Scholar]
- Wang, Y., Li, J., Ma, T., Xie, X., Deng, Y., & Gan, Y. (2021). Genesis of geogenic contaminated groundwater: As, F and I. Critical Reviews In Environmental Science And Technology,51, 2895–2933. [Google Scholar]
- WHO. (2022): Guidelines for drinking-water quality: incorporating the first and second addenda. World Health Organization [PubMed]
- Xu, N., Liu, L., Mengjiao, T., Tao, X., Li, L., Wang, H., & Gong, J. (2024). Co-occurrence, sources and co-enrichment mechanism of arsenic, fluoride in groundwater from Huaihe River Basin, China. Emerging Contaminants,10, 100276. [Google Scholar]
- Zeng, Y., Lu, H., Zhou, J., Zhou, Y., Sun, Y., & Ma, C. (2024). Enrichment mechanism and health risk assessment of fluoride in groundwater in the Oasis zone of the Tarim Basin in Xinjiang, China. Exposure and Health,16, 263–278. [Google Scholar]
- Zhang, B., Zeng, F., Wei, X., Khan, U., & Zou, Y. (2022). Three-dimensional hierarchical hydrogeological static modeling for groundwater resource assessment: A case study in the eastern Henan Plain, China. Water (Basel),14, 1651. [Google Scholar]
- Zhang, H., Zhang, F., Song, J., Tan, M. L., & Johnson, V. C. (2021). Pollutant source, ecological and human health risks assessment of heavy metals in soils from coal mining areas in Xinjiang, China. Environmental Research,202, 111702. [DOI] [PubMed] [Google Scholar]
- Zhang, J., Su, C., Xie, X., Peng, L., & Huq, M. E. (2020). Enhanced visible light photocatalytic degradation of dyes in aqueous solution activated by HKUST-1: Performance and mechanism. RSC Advances,10, 37028–37034. [DOI] [PMC free article] [PubMed] [Google Scholar]
- Zhang, J., Lv, D., Chen, H., Yu, C., Zhao, K., Liu, X., Liu, Y., Zhang, H., Liu, B., & Qiang, X. (2024). Evolution of sedimentary environment in the Eastern Henan Basin since the Late Pliocene. Palaeogeography, Palaeoclimatology, Palaeoecology,633, 111896. [Google Scholar]
- Zhang, J., Wang, P., Liu, S., & Yu, J. (2024). Mechanism controlling groundwater chemistry in the hyper-arid basin with intermittent river flow: Insights from long-term observations (2001–2023) in the lower Heihe River, Northwest China. Frontiers in Environmental Science,12, 1376443. [Google Scholar]
- Zhang, Y., Ma, R., & Li, Z. (2014). Human health risk assessment of groundwater in Hetao Plain (Inner Mongolia Autonomous Region, China). Environmental Monitoring And Assessment,186, 4669–4684. [DOI] [PubMed] [Google Scholar]
- Zhang, Z., Guo, H., Liu, S., Weng, H., Han, S., & Gao, Z. (2020). Mechanisms of groundwater arsenic variations induced by extraction in the western Hetao Basin, Inner Mongolia, China. Journal Of Hydrology,583, 124599. [Google Scholar]
- Zhao, S., Huq, M. E., Fahad, S., Kamran, M., & Riaz, M. (2024). Boron toxicity in plants: Understanding mechanisms and developing coping strategies; a review. Plant Cell Reports,43, 238. [DOI] [PubMed] [Google Scholar]
- Zheng, H., Huang, J., & Chen, J. (2021). Climate-induced yield losses for winter wheat in Henan Province, North China and their relationship with circulation anomalies. Water (Basel),13, 3341. [Google Scholar]
Associated Data
This section collects any data citations, data availability statements, or supplementary materials included in this article.
Data Availability Statement
No datasets were generated or analysed during the current study.