Abstract
We investigated the effects that sequences of reinforcers obtained from the same response key have on local preference in concurrent variable-interval schedules with pigeons as subjects. With an overall reinforcer rate of one every 27 s, on average, reinforcers were scheduled dependently, and the probability that a reinforcer would be arranged on the same alternative as the previous reinforcer was manipulated. Throughout the experiment, the overall reinforcer ratio was 1:1, but across conditions we varied the average lengths of same-key reinforcer sequences by varying this conditional probability from 0 to 1. Thus, in some conditions, reinforcer locations changed frequently, whereas in others there tended to be very long sequences of same-key reinforcers. Although there was a general tendency to stay at the just-reinforced alternative, this tendency was considerably decreased in conditions where same-key reinforcer sequences were short. Some effects of reinforcers are at least partly to be accounted for by their signaling subsequent reinforcer locations.
Keywords: choice, concurrent schedules, reinforcer sequences, conditional probability of reinforcer location, local analyses, key peck, pigeons
The generalized matching law (Baum, 1974) provides an accurate description of choice behavior in concurrent schedules (see Davison & McCarthy, 1988, for a review). In its logarithmic form, the law is expressed as follows:
 |
where Bi and Ri are the numbers of responses and reinforcers obtained on Alternative i, respectively. The parameter a is called sensitivity to reinforcement (Lobb & Davison, 1975) and describes the extent to which variations in the log reinforcer ratio change the log response ratio. In standard concurrent-schedule procedures, sensitivity values typically range between 0.7 to 1.0, with the most common values being around 0.8 (Baum, 1979; Taylor & Davison, 1983; Wearden & Burgess, 1982). Log c measures any constant response bias toward one alternative.
Recently, investigations into choice behavior in highly variable environments have shown that preference can change very quickly. Davison and Baum (2000) arranged a procedure in which sessions consisted of seven components that each arranged a different concurrent variable-interval (VI) VI reinforcer ratio. Depending on the experimental condition, each component was in effect until the subject had received 4, 8, 10, or 12 reinforcers. The order of the components was arranged randomly without replacement, and components were separated by a 10-s blackout period. After four to five reinforcers in a component, sensitivity values appeared to stabilize at about 0.6. Davison and Baum concluded that acquisition of preference can occur much more rapidly than previously reported when the experimental procedure arranges rapid changes in environmental contingencies.
Nonetheless, Davison and Baum (2000) found that varying the lengths of components from 4 to 12 reinforcers per component did not affect the speed of preference change. Using the same procedure with 10 reinforcers per component, Landon and Davison (2001) showed that the speed of preference change is affected by the extent of environmental changes within sessions, rather than by the frequency of changes. Across conditions, they varied the range of reinforcer ratios in the seven components. Sensitivity to reinforcement increased more rapidly and to higher values when the range of reinforcer ratios was greater. In their Experiment 2, Landon and Davison arranged a constant range of component reinforcer ratios (27:1 to 1:27), and varied the number of intermediate reinforcer ratios (e.g., 9:1, 3:1, 1:1, 1:3, 1:9). The inclusion of intermediate reinforcer ratios did not appear to have a systematic effect on sensitivity values. Overall, therefore, it appears that preference increases more rapidly when the range of reinforcer-ratio changes is larger regardless of whether intermediate reinforcer ratios are included or not.
Davison and Baum (2002) reported local effects of reinforcers on preference. Immediately after a reinforcer, preference was strongly biased towards the just-reinforced alternative, and gradually moved towards indifference over about 20 to 25 s. Landon, Davison, and Elliffe (2002) showed that this effect was not limited to experiments using Davison and Baum's (2000) procedure, but that these preference pulses also occur in standard concurrent VI VI schedules (see also Menlove, 1975). Moreover, the preference pulses were larger and lasted longer following a reinforcer on the richer of the two concurrent-schedule alternatives.
Davison and Baum (2003) showed that preference pulses mainly reflect changes in the lengths of the first two visits after a reinforcer with increases in visit lengths (pecks per visit) and visit durations (time) at the just-reinforced alternative and decreases in visit lengths at the other alternative. After the second changeover after a reinforcer, visit lengths usually returned to a relatively stable pattern. Buckner, Green, and Myerson (1993) reported changes in visit duration using a concurrent variable-time (VT) VT schedule. The two alternatives that arranged response-independent food could be changed via a switching key (Findley, 1958). Preference in terms of relative time allocation to the two alternatives was well described by the generalized matching law (Equation 1). At a local level, reinforcers increased the length of staying at the same alternative, so that the length of the stay after the reinforcer was significantly longer than the stay at the same alternative immediately prior. However, there was no detectable effect on visit length in any subsequent visits at either alternative.
Preference appears to be best described as jointly determined by both short- and long-term processes. Landon et al. (2002) showed that the level at which preference pulses stabilized was determined by the alternatives on which a series of prior reinforcers had been obtained. The most recent reinforcer had the largest effect on current preference, whereas reinforcers up to eight prior had smaller, but still measurable and consistent, effects. Sequences of successive reinforcers on the same key (“continuations”) progressively increased preference for that key, albeit according to a negatively accelerated function (Davison & Baum, 2000). Discontinuations of sequences shifted log response ratios towards the just-reinforced alternative, and the longer the sequence that was discontinued, the less preference moved to the just-reinforced alternative. Landon and Davison (2001) found that discontinuations had a stronger effect when the component reinforcer ratios were always either 27:1 or 1:27 than when intermediate reinforcer ratios were present. In the former case, preference shifted to the just-reinforced alternative regardless of the length of the preceding same-key reinforcer sequence. Also, preference after the first reinforcer in a component appeared to increase more when only 27:1 and 1:27 components were arranged. Landon and Davison argued that this indicated greater local control.
Davison and Baum (2003) identified sequences of same-key reinforcers as a possible source of control over preference. In their Experiment 1, seven different reinforcer-magnitude ratios were arranged in different components of a Davison and Baum (2000) procedure, while component reinforcer-rate ratios were always 1:1. In their Experiment 2, magnitude ratios were kept constant within conditions, while relative reinforcer ratios were varied across components from 27:1 to 1:27. Preference pulses usually were longer in Experiment 2, whereas preference following reinforcers in Experiment 1 rapidly reversed to the other alternative. Davison and Baum (2003) argued that these differences could indicate control by differential probabilities of same-key reinforcer sequences. In Experiment 1, the reinforcer ratios in all components were 1:1, and thus long sequences of reinforcers on one alternative were relatively unlikely. In Experiment 2, however, the unequal reinforcer-rate ratios resulted in a higher probability of continuations than discontinuations. Davison and Baum (2003) concluded that “reinforcer sequences are a potent controlling variable for both mean preference between reinforcers and for preference pulses and visits following reinforcers” (p. 118).
In a standard concurrent-schedule procedure, changes in overall reinforcer ratios directly change the average length of same-key reinforcer sequences. When the reinforcer ratio is extreme, a reinforcer on the rich alternative is highly predictive of further reinforcers on the same alternative, so that long sequences of reinforcers on the richer alternative are likely. Sequences of reinforcers on the leaner alternative are clearly likely to be very short, usually consisting of only one reinforcer. When the reinforcer ratio is close to 1.0, however, both alternatives will sometimes produce sequences of a small number of same-key reinforcers. Reinforcer ratio and length of reinforcer sequence are therefore confounded in standard concurrent VI schedules.
In the present experiment, we aimed to isolate the effects of sequences of same-key reinforcers from the effects of the overall reinforcer ratio. Throughout the experiment, the arranged reinforcer ratio was always 1:1, and the average length of same-key reinforcer sequences was varied across conditions. We did this by invoking different conditional probabilities, p(Rx|Rx), that the next reinforcer would be arranged on Alternative x given that the previous reinforcer had been delivered at that alternative.
METHOD
Subjects
Five pigeons, numbered 62 to 66, were housed in individual cages and were maintained at 85% ± 15 g of their free-feeding body weights by postsession supplementary feeding of mixed grain. Water and grit were accessible at all times. Room lights were extinguished daily at 4:00 p.m. and turned on at 12:30 a.m. All pigeons had prior experience on various concurrent VI schedule procedures. Pigeon 64 died 2 weeks prior to completion of Condition 7.
Apparatus
The experiment was conducted in the pigeons' home cages. Each cage measured 380 mm high, 380 mm wide, and 380 mm deep. The back, left, and right walls were constructed of sheet metal, and the top, floor, and door consisted of metal bars. Two wooden perches were mounted 50 mm above the cage floor and 95 mm from, and parallel to, the right wall and the door. The right wall contained three response keys, 20 mm in diameter, centered 100 mm apart and 205 mm above the perches. The left and right keys could be transilluminated yellow and, when lit, were operated by pecks exceeding about 0.1 N. A hopper containing wheat was located behind a 50-mm square aperture centered 125 mm below the center key. During reinforcement, the hopper was raised and illuminated for 3 s and the keylights extinguished. Ambient illumination was provided by the room lighting, and there was no sound attenuation. An IBM® PC-compatible computer running MED-PC® software controlled the experiment and recorded the times at which all experimental events occurred, to 10 ms resolution.
During pretraining, Pigeon 64 often pecked the bottom edge of the response keys, and these pecks were not reliably recorded by the computer. To overcome this, a plastic protrusion was attached around the bottom half of all response keys in Pigeon 64's cage. This directed Pigeon 64's responses to the middle of the keys and resulted in reliable data recording.
Procedure
Because all subjects had prior experience with pecking on concurrent VI VI schedules (Landon, Davison, & Elliffe, 2003), only very brief pretraining was required. All subjects initially were exposed to a concurrent VI 10-s VI 10-s schedule. Over the course of several sessions, the schedule requirements were gradually increased to concurrent VI 54 s VI 54 s. Condition 1 then began.
Daily sessions began at 1:00 a.m. and were conducted successively starting with Pigeon 62. Reinforcers for pecking the left and right response keys were scheduled dependently (Stubbs & Pliskoff, 1969) by a single VI 27-s schedule. Once a reinforcer had been arranged, the timer stopped, and no further reinforcer could be arranged until this reinforcer had been obtained. The location of a reinforcer was determined by the conditional probability p(Rx|Rx) that a reinforcer would be arranged on Alternative x given that the immediately preceding reinforcer also had been on that alternative. Across conditions, the average reinforcer-sequence lengths were varied by varying this conditional probability from 0 to 1 (Table 1). Condition 1, for example, was a standard concurrent VI 54-s VI 54-s schedule with p(Rx|Rx) set at .5, and Condition 7 arranged strict alternations of reinforcers between keys [p(Rx|Rx) = 0]. In Conditions 1 to 7b and Condition 9, the location of the first reinforcer in a session was determined randomly with a probability of .5. In Condition 8, where p(Rx|Rx) was 1, the first reinforcer in a session had special significance because the remaining reinforcers of that session were always arranged on the same key. Rather than being randomly allocated, the location of the first reinforcer in a session was determined according to a 63-step pseudorandom binary sequence (Hunter & Davison, 1985).
Table 1. Order of experimental conditions, showing the conditional probabilities of a reinforcer's being arranged on Alternative x given an immediately preceding reinforcer on that alternative, p(Rx|Rx). Because the conditional probabilities were the same on both alternatives, the arranged relative reinforcer ratio was 1:1 throughout. In Condition 8, the first reinforcers in a session were arranged by a 63-step, pseudorandom binary sequence.
| Condition | p(Rx|Rx) |
| 1 | .5 |
| 2 | .7 |
| 3 | .2 |
| 4 | .9 |
| 5 | .35 |
| 6 | .8 |
| 7 | 0 |
| 7b | .5 |
| 8 | 1.0 |
| 9 | .7 |
During the entire experiment, a 2-s changeover delay (COD; Herrnstein, 1961) was in effect, which arranged that a response on a key could only be reinforced after at least 2 s had elapsed since the first response on that key following responses to the other key. Sessions lasted until either the subjects obtained 80 reinforcers or 50 min had elapsed, whichever came first. Fifty sessions per condition were arranged in Conditions 1 and 2, and 65 in subsequent conditions, with the exception of Condition 7b where there were 49 sessions, and Condition 8 where there were 63 sessions. The length of the latter was determined by the pseudorandom binary sequence.
RESULTS
We excluded the first 15 sessions of each experimental condition from the analyses. The exception was Condition 8 where the pseudorandom binary sequence was arranged, and the data from all 63 sessions were included.
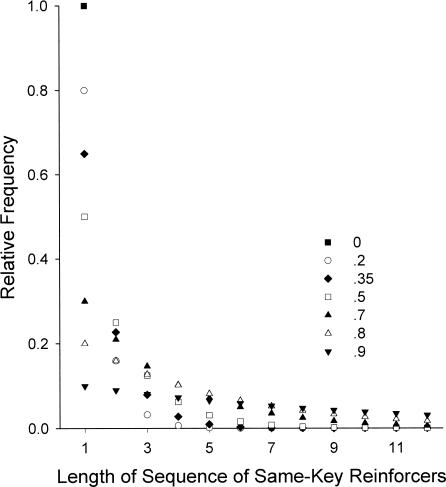
Because we used dependent schedules (Stubbs & Pliskoff, 1969), differential allocation of responses to the two alternatives could not affect the sequence of reinforcers obtained. Figure 1 shows predicted relative frequencies of sequences of same-key reinforcers for different values of conditional probabilities. In Condition 1, with p(Rx|Rx) = .5, half of the reinforcers were expected to be on the same alternative, and half preceded and followed by a reinforcer on the other location. The probability of a sequence of two same-key reinforcers was .25, and the probability of three same-key reinforcers in a row was .125. The lower the arranged conditional probability, the greater was the difference between the probabilities of sequences of Length 1 and 2: When p(Rx|Rx) was .2 (Condition 3), 80% of same-key reinforcer sequences were expected to be of Length 1 and 16% of Length 2, compared to Condition 4 (conditional probability of .9) where 10% of same-key reinforcer sequences were of Length 1 and 9% of Length 2. In Condition 7, [p(Rx|Rx) = 0], reinforcer locations alternated strictly, so all sequences were one reinforcer long. Condition 8 arranged a conditional probability of 1, and here all reinforcers in a session occurred on the same alternative. Hence, in this condition, the length of same-key reinforcer sequences was the total number of reinforcers obtained in a session.
Fig. 1. Predicted values of relative frequency of the lengths of sequences of same-key reinforcers for conditional probabilities 0 to .9.
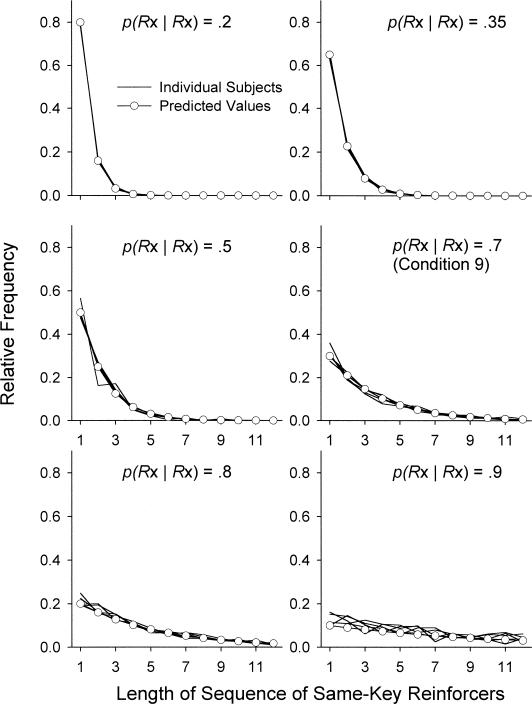
Figure 2 shows the relative frequencies of different obtained same-key reinforcer sequences for all individual subjects for conditional probabilities .2 to .9, as indicated by the solid lines without symbols. To avoid truncation by session ends, the final sequences in a session were discarded from this analysis. The lines of the obtained relative frequencies usually were superimposable on the lines joined by unfilled circles representing the expected values. When the conditional probability was .5 (Condition 1), Pigeon 64 exhibited a low response rate and as a consequence tended not to receive the maximum number of reinforcers obtainable per session. Overall, the total number of sequences per session became increasingly lower with higher conditional probabilities, and therefore the relative frequencies of obtained reinforcer sequences increasingly deviated from predicted values as p(Rx|Rx) increased. This obviously does not apply to Condition 8, where p(Rx|Rx) was zero, and each session arranged reinforcers exclusively on one alternative.
Fig. 2. Relative frequency of the lengths of sequences of same-key reinforcers for all subjects for conditional probabilities .2 to .9.
For conditional probability .7, data from Condition 9 are shown.
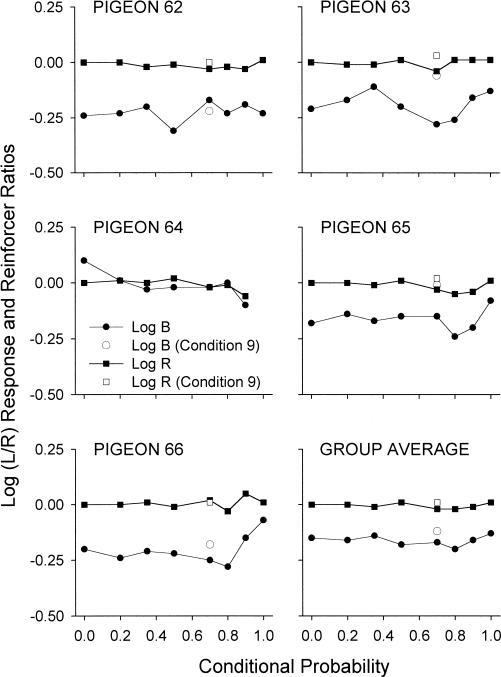
Figure 3 shows overall reinforcer ratios as a function of conditional probabilities ranging from 0 to 1 (filled squares). The unfilled squares refer to log reinforcer ratios in Condition 9, the replication of Condition 2, which arranged a conditional probability of .7. The overall log reinforcer ratios remained constant and close to zero across all experimental conditions. Figure 3 also shows the overall log response ratios for each conditional probability. The unfilled circles refer to the log response ratios for Condition 9, the replication of Condition 2. Pigeon 64 did not complete Conditions 8 and 9, and hence no data are shown for these conditions. Varying the conditional probabilities across conditions did not systematically affect overall preference. A Kendall's (1955) nonparametric test for monotonic trend showed that there was no significant trend (z = −0.81). Note that the trend test was conducted for conditional probabilities 0 to .9 excluding Condition 9 (conditional probability .7) and Condition 8 (conditional probability 1), because Pigeon 64 did not complete these conditions. Because the overall log reinforcer ratio was approximately zero throughout the experiment, the overall log response ratio measures the inherent bias (log c) in terms of the generalized matching law (Baum, 1974). Apart from Pigeon 64, all pigeons exhibited a right-key bias of around −0.20 (see Landon et al., 2003).
Fig. 3. Overall log (Left/Right) response (Log B) and reinforcer (Log R) ratios as a function of conditional probability of reinforcers for Pigeons 62 to 66 and the group average.
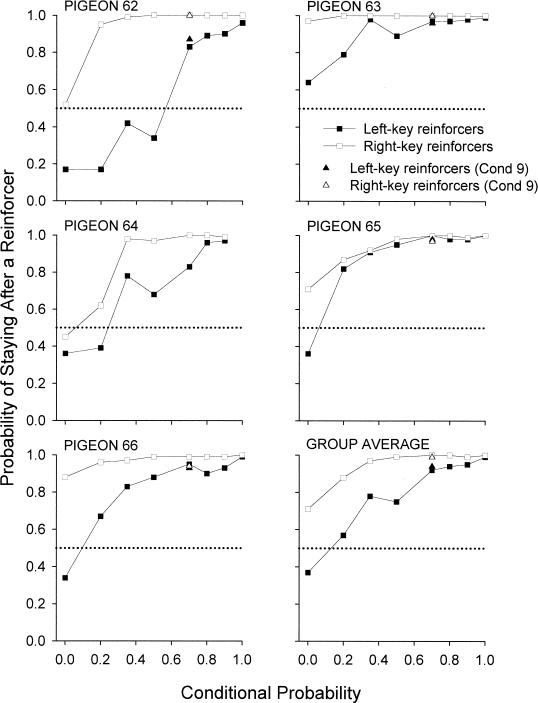
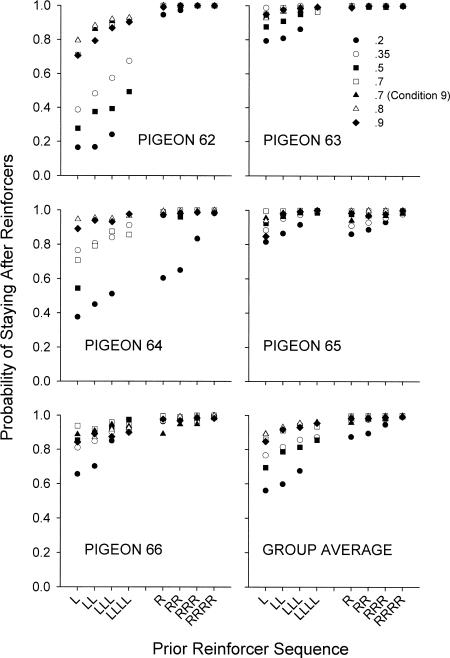
Increasing the average length of reinforcer sequences across conditions usually increased the probabilities of emitting the first peck after a reinforcer at the just-reinforced alternative (Figure 4). The group average shown in Figure 4 provides a good representation of the probabilities of staying for the individual subjects. There were strong differences between the left and right alternatives. The mean probability of staying after reinforcers was generally greater than .5, except after left-key reinforcers when the conditional probability was 0 (Condition 7). For conditions arranging conditional probabilities above .35, the probability of staying after right-key reinforcers was usually above .9. Even when the conditional probability was 0 and reinforcer locations strictly alternated between keys (Condition 7), 3 of 5 subjects still were more likely to stay on the right key than to change over to the left. In contrast, after a reinforcer on the left key, the pigeons were much more likely to change over to the right key. When the conditional probability was above .7, however, the probability of staying after a left-key reinforcer was above .9.
Fig. 4. Probabilities of staying on the left key after left-key reinforcers and probability of staying on the right key after right-key reinforcers as a function of conditional probability for all subjects and the group average.
During the analyses and discussion of the present experiment, the symbol L will refer to a left-key reinforcer that was immediately preceded by at least one right-key reinforcer, whereas R will refer to a right-key reinforcer that was immediately preceded by at least one left-key reinforcer. L and R are thus discontinuations of right- and left-key reinforcer sequences, respectively, and also signify the beginning of a new sequence of left- and right-key reinforcers, respectively. The continuations of the sequences L and R are referred to as LL and RR, and so on.
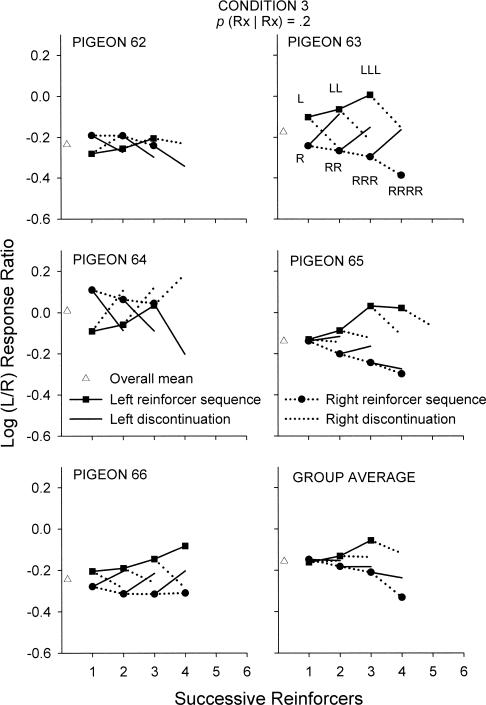
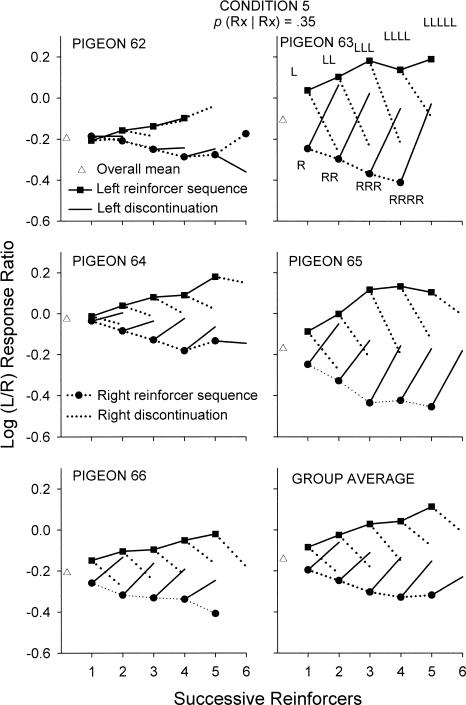
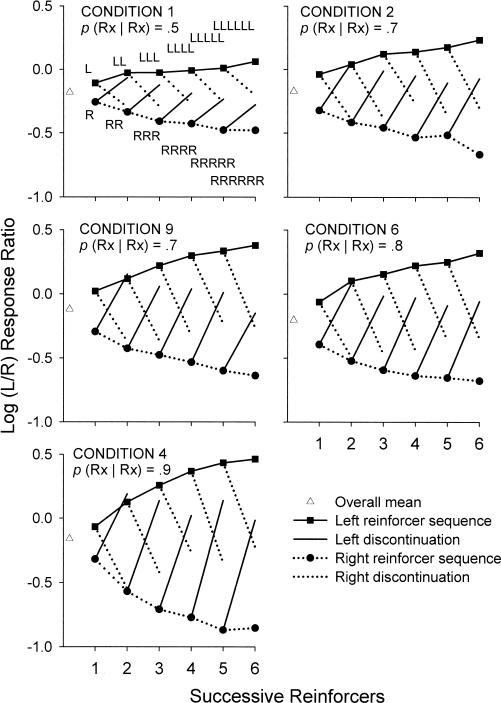
The following analyses investigated the effects of runs of same-key reinforcers of specific lengths, a run being defined as a sequence of one or more reinforcers on an alternative preceded by at least one reinforcer on the other alternative. Figures 5 to 7 show log response ratios after each successive reinforcer of the sequences L to LLLLL and R to RRRRR, analyzed separately according to whether the next reinforcer occurred on the same or the other alternative. Thus, for instance, log response ratios after LLL sequences were compared with those after LLR sequences. For individual subject analyses, log response ratios for such reinforcer sequences are shown only when at least 300 responses had occurred after that sequence. Data for responding after a particular sequence consisted of all responses up until the occurrence of a subsequent reinforcer. In Condition 3, in particular, where the conditional probability was .2, short sequences were very likely, and for all pigeons sequences longer than four reinforcers did not occur often enough for this criterion to be met. The mean response ratios were calculated irrespective of whether 300 responses had occurred, but were not shown if at least 1 subject did not emit a response for a reinforcer sequence.
Fig. 5. Log (Left/Right) response ratios after each successive reinforcer for sequences L to LLLLLL reinforcers and R to RRRRRR reinforcers and discontinuations for Pigeons 62 to 66 and the group average in Condition 3.
Reinforcers that occurred on the left alternative are joined to the previous reinforcer by a solid line, and reinforcers that occurred on the right alternative by a dotted line. Discontinuations of the sequences are joined to no symbol, whereas reinforcers that occurred on the left key are joined to filled squares, and reinforcers that occurred on the right key are joined to filled circles. The unfilled triangles signify the overall condition mean log response ratio.
Fig. 6. Log (Left/Right) response ratios after each successive reinforcer for sequences L to LLLLLL reinforcers and R to RRRRRR reinforcers and discontinuations for Pigeons 62 to 66 and the group average in Condition 5.
Reinforcers that occurred on the left alternative are joined to the previous reinforcer by a solid line, and reinforcers that occurred on the right alternative by a dotted line. Discontinuations of the sequences are joined to no symbol, whereas reinforcers that occurred on the left key are joined to filled squares, and reinforcers that occurred on the right key are joined to filled circles. The unfilled triangles signify the overall condition mean log response ratio.
Fig. 7. Log (Left/Right) response ratios after each successive reinforcer for sequences L to LLLLLL reinforcers and R to RRRRRR reinforcers and discontinuations for the group average for conditions arranging conditional probabilities of .5, .7, .8, and .9.
Reinforcers that occurred on the left alternative are joined to the previous reinforcer by a solid line, and reinforcers that occurred on the right alternative by a dotted line. Discontinuations of the sequences are joined to no symbol, whereas reinforcers that occurred on the left key are joined to filled squares, and reinforcers that occurred on the right key are joined to filled circles. The unfilled triangles signify the overall condition mean log response ratio.
Figure 5 shows log response ratios after sequences of reinforcers when the conditional probability was .2 (Condition 3). There were clear differences in the preference changes across pigeons. For Pigeons 63, 65, and 66, a continuation of a sequence of reinforcers generally produced an increasing preference for that key. A discontinuation of such a sequence generally moved preference towards the just-reinforced alternative. For Pigeons 62 and 64, a reinforcer at the beginning of a sequence on one key (R or L) produced a preference for the other key. That is, after a reinforcer on the left key, preference was more towards the right alternative than after a reinforcer on the right key, and vice versa. Unlike the other subjects, discontinuations of same-key reinforcer sequences usually also shifted preference away from the just-reinforced alternative. However, after two reinforcers on the same alternative, preference started to move towards that alternative (Figure 5).
Differences between subjects were less apparent at higher conditional probabilities. In Condition 5, where the conditional probability was .35, the beginning of a new sequence of same-key reinforcers (a single R or L reinforcer) produced a preference towards the just-reinforced alternative for all pigeons, with the exception of Pigeon 62 (Figure 6). For that pigeon, preference after one left-key reinforcer (L) resulted in slightly more extreme preference for the right-key than after one right-key reinforcer (R). Discontinuations of same-key reinforcer sequences moved preference clearly towards the alternative where the discontinuation had occurred for Pigeons 63 to 66, but less clearly so for Pigeon 62. Figure 6 also shows that discontinuations resulted in less extreme preference for the just-reinforced alternative when the preceding sequence of same-key reinforcers was longer.
Figure 7 shows the above analyses for group mean data for conditions that arranged a conditional probability of .5 and above. For these conditions, the group means provided a very good representation of the individual results. For all conditions, both continuations of sequences of same-key reinforcers and discontinuations resulted in more extreme preference for that alternative, but more so when the conditional probability was higher. The longer the sequence of same-key reinforcers before the discontinuation, the less extreme was the new level of preference for the just-reinforced alternative (Figure 7).
In Condition 9, which arranged a conditional probability of .7, the extent to which preference became more extreme with continuations of same-key reinforcer sequences appeared to be larger than in Condition 2, which Condition 9 replicated (Figure 7). Note that Condition 9 included 50 sessions of data for the analyses and was preceded by Condition 8 with a conditional probability of 1, whereas Condition 2 included only 35 sessions of data and was preceded by Condition 1, which arranged a probability of .5.
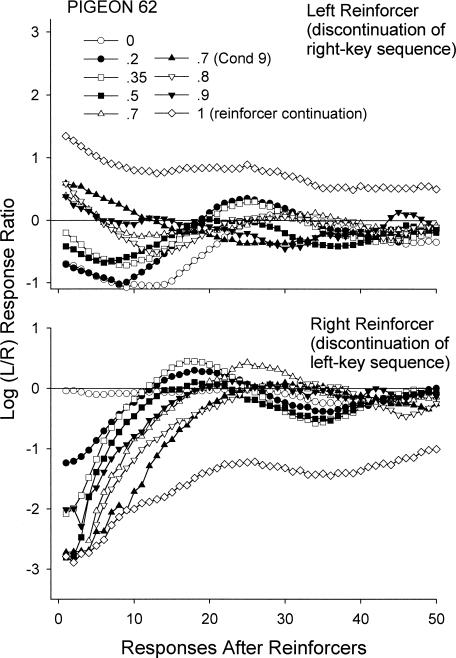
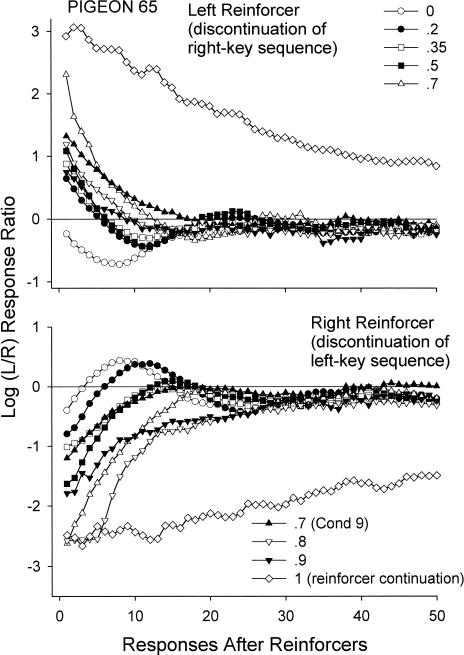
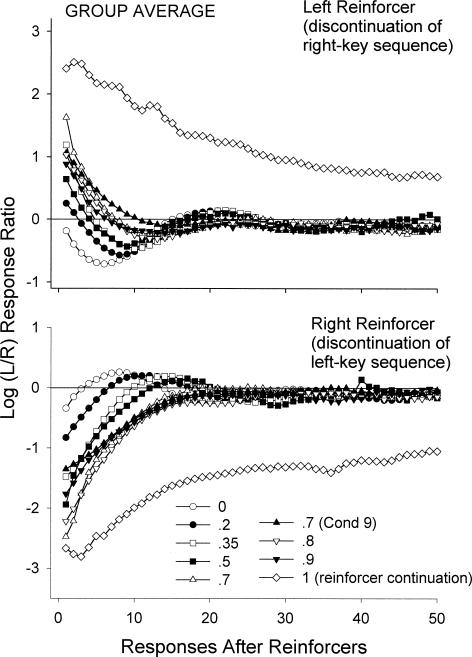
The following analyses investigated local changes in preference after a reinforcer was obtained. Figures 8 and 9 show, for Pigeons 62 and 65, respectively, log response ratios for every response following a left and right reinforcer that discontinued a sequence of reinforcers on the other alternative (L and R). Data for Pigeons 62 and 65 are shown because these subjects showed the most dissimilar results across all subjects. As can be seen from Figures 8 and 9, the general pattern of postreinforcement responding nevertheless was similar across these subjects and the mean (Figure 10). Because Condition 8 (conditional probability = 1) arranged reinforcers exclusively on one of the alternatives in each session, only same-key reinforcer-sequence continuations are shown for this condition. Overall, changes in conditional probabilities strongly affected local preference after a reinforcer was obtained. Preference for the just-reinforced alternative became more extreme with increases in the conditional probabilities. The data for the different conditions typically followed their respective conditional probabilities.
Fig. 8. Log (Left/Right) response ratios for successive responses after left- and right-key same-key reinforcer-sequence discontinuations for conditional probabilities p(Rx|Rx) ranging from 0 to 1 for Pigeon 62. For Condition 8, reinforcer-sequence continuations are shown.
Fig. 9. Log (Left/Right) response ratios for successive responses after left- and right-key same-key reinforcer-sequence discontinuations for conditional probabilities p(Rx|Rx) ranging from 0 to 1 for Pigeon 65. For Condition 8, reinforcer-sequence continuations are shown.
Fig. 10. Log (Left/Right) response ratios for successive responses after left- and right-key same-key reinforcer-sequence discontinuations for conditional probabilities p(Rx|Rx) ranging from 0 to 1 for the group data.
For Condition 8, reinforcer-sequence continuations are shown.
Figure 10 shows group mean log response ratios as a function of number of responses after a reinforcer. Because there were several instances where a pigeon emitted no responses on one alternative for a given sequential response position, these means were calculated by taking the mean proportion of responses on the left key at each response position across pigeons and then converting those means into log left/right response ratios. When no response was emitted on either alternative, the means were not calculated for that response number. Because Pigeon 64 did not complete Conditions 8 and 9, the averages for these conditions were calculated using the results from the other subjects. The log response ratios calculated for the first response after a reinforcer show the probabilities of staying on the just-reinforced alternative, and hence show the same patterns as in Figure 4. The log response ratios after right-key reinforcers generally reached more extreme values than those after left-key reinforcers, reflecting the general right-key bias that 4 of the 5 subjects exhibited (Figure 3).
Across conditions, the period of increased preference to the just-reinforced alternative was of different duration (Figure 10). Higher conditional probabilities gave longer pulse durations with preference reversing to the other alternative later. Except for Condition 8 (p(Rx|Rx) = 1), where only continuations can be shown, preference eventually stabilized at a level reflecting the overall response bias in that condition (Figure 3). When the conditional probability was less than .7, changes in local preference produced an oscillating pattern where there was a tendency for preference to move away from the just-reinforced alternative and eventually to move back.
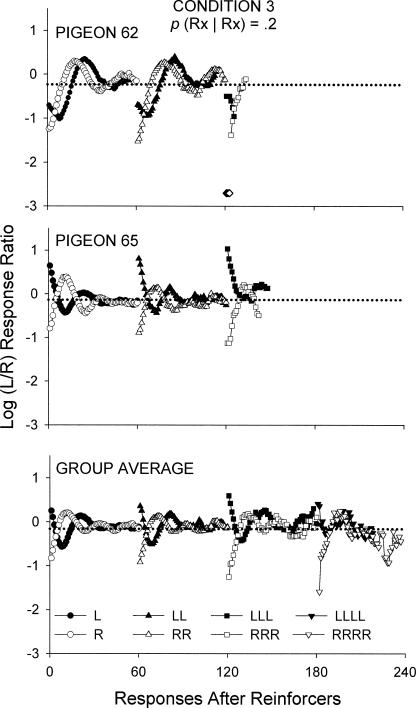
The following analyses investigated changes in local preferences after successive reinforcers in same-key reinforcer sequences. Figure 11 shows, for Pigeons 62, 65, and for the group mean data, log response ratios for the first 60 responses after the first left- and right-key reinforcer in a new sequence on that alternative (L or R) and for the sequences LL, LLL, LLLL, RR, RRR, RRRR in Condition 3, which arranged a conditional probability of .2. For individual subject analyses, log response ratios were not included when fewer than 40 responses occurred for that response number on any alternative. Compared to the analyses shown in Figures 5 and 6 where at least 300 responses had to be emitted for log response ratios to be calculated, we could afford to use a less stringent criterion in the present analysis because it contained many more data points that all constituted estimates of the same function. Therefore, for the first response after a particular reinforcer sequence to be included, this reinforcer sequence would have had to occur at least 40 times. Same-key reinforcer sequences longer than three were unlikely in Condition 3, and not enough responses were emitted for those data to be shown. For the mean data, log response ratios were averaged in the same manner as for Figure 10, and data were not shown if at least 1 subject did not emit a single response for that response bin.
Fig. 11. Log (Left/Right) response ratios for successive responses after sequences of left- and right-key reinforcers for Condition 3 for Pigeons 62, 65, and the group average.
The dotted line indicates the overall log response ratio for the respective subject and their average in that experimental condition. The unfilled diamonds show instances where Pigeon 62 exhibited exclusive preference for the right response key.
Around 80% of same-key reinforcer sequences in Condition 3 were of Length 1, and hence the preference pulses shown in Figures 8 to 10 were very similar to the pulses after one left- (L) or one right-key (R) reinforcer as shown in Figure 11. For Pigeon 62, a strong right-key bias was evident in terms of probability of staying at the just-reinforced alternative. After a reinforcer on the left alternative, this subject was very likely to shift to the right alternative, whereas after a reinforcer on the right alternative it was very likely to stay (see also Figure 4). Around 10 responses after one left-key (L) reinforcer, Pigeon 62 exhibited the strongest level of preference for the right key. This reflects the fact that, on occasions when the pigeon did stay after a left-key reinforcer, it moved to the right key after around eight responses. On occasions when Pigeon 62 shifted to the right key immediately after a left-key reinforcer, it tended to stay around 16 responses on the right key. Therefore, regardless of whether the animal stayed or shifted immediately following a left-key reinforcer, after around 10 responses it was most likely to be found responding to the right alternative. Following a right-key reinforcer, however, Pigeon 62 was most likely to stay on the right alternative and only after around 13 responses was it likely to be found at the left alternative. After a sequence of three right-key reinforcers (RRR), Pigeon 62 exhibited exclusive preference for that alternative (unfilled diamonds). Later, analyses will be presented that explore pecks per visit following reinforcers in more detail to corroborate these claims.
Pigeon 65 did not exhibit as pronounced a key bias in terms of staying at the just-reinforced alternative (Figure 11, middle panel). Following both left- and right-key reinforcers, it was very likely to stay at the just-reinforced alternative, and after around 10 responses it was very likely to have changed over to the other alternative.
Successive same-key reinforcers appeared to increase the probability of staying at the just-reinforced alternative. Each successive same-key reinforcer resulted in more extreme preference for the first sequential response following that reinforcer (Figure 11). In addition, preference reversal to the not-reinforced alternative tended to be less extreme after more successive reinforcers in sequence.
The group-average results show the same directional changes in preference that were detectable in Pigeons 62 and 65 (Figure 11, bottom panel). The overall strong right-key bias was evident in that the probability of staying after a left-key reinforcer was lower than after a right-key reinforcer (see also Figure 4). Following a left-key reinforcer, preference shifted away from the just-reinforced alternative sooner than after a right-key reinforcer. Sequences of four same-key reinforcers in Condition 3 were very rare, and therefore the data after four successive continuations were very variable.
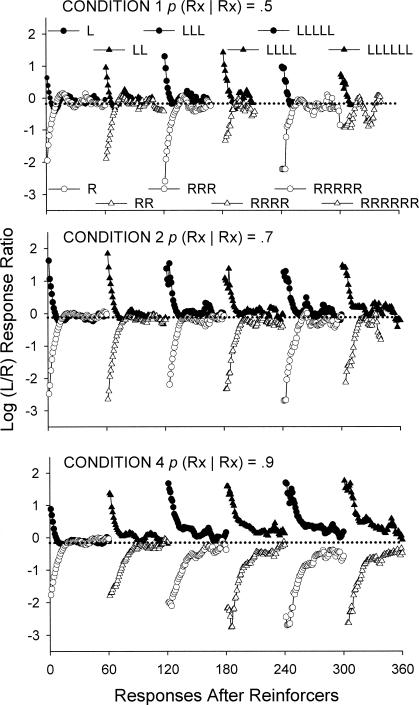
Figure 12 shows the same analyses for group mean data in experimental conditions that arranged a conditional probability of .5, .7, and .9. Preference immediately after a right-key reinforcer usually was more extreme than after a left-key reinforcer. Additionally, for all three conditions shown in Figure 12, preference following a left-key reinforcer moved away from the just-reinforced alternative sooner than after a right-key reinforcer. These changes in preference after reinforcers appeared to oscillate when the conditional probability was .5, whereas in the conditions where the conditional probability was .7 and .9, preference after the initial period of extreme preference for the just-reinforced alternative appeared to move monotonically towards the overall log response ratio of the particular condition. When the conditional probability was .7 and .9, the level at which preference pulses stabilized became increasingly more extreme in favor of the just-reinforced alternative with successive reinforcers.
Fig. 12. Log (Left/Right) response ratios for successive responses after sequences of left- and right-key reinforcers for conditional probabilities .5, .7 and .9 (Conditions 1, 2, & 4, respectively) for group mean data. The dotted line indicates the overall mean log response ratio in that experimental condition.
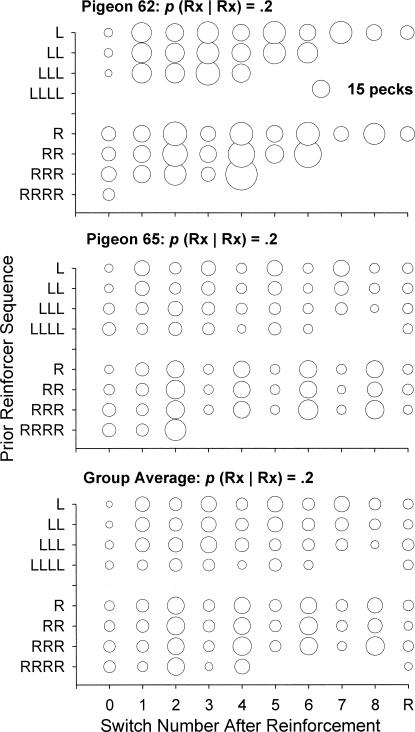
Figure 13 shows analyses of successive visit lengths after reinforcerment as a function of prior sequences of same-key reinforcers. The diameter of the symbols denotes the mean visit length in terms of number of responses. Visits were omitted if they were truncated by a reinforcer. The x axis shows the number of switches after reinforcers. Thus Switch 0 after a left-key reinforcer refers to postreinforcer stay visits on the left alternative, and Switch 1 after a right-key reinforcer refers to the first visit at the left alternative. If the subject switched to the previously not-reinforced alternative immediately after the reinforcer, no data were recorded for Switch Number 0. Switch Number R is the average length of visits after nine switches and beyond. Figure 13 shows visit lengths after same-key reinforcer sequences in Condition 3 (conditional probability = .2) for Pigeons 62, 65, and group averages. Overall, postreinforcer stay visits were often shorter than subsequent visits, especially after the first reinforcer in a new sequence (L and R). Subsequent visit lengths appeared relatively unaffected by both prior reinforcer sequences and number of switches after a reinforcer.
Fig. 13. Bubble plots of successive visit lengths (pecks per visit: indicated by the diameter of the symbols) for successive continuations of same-key reinforcer sequences for Pigeons 62, 65, and the group averages in Condition 3 (p(Rx|Rx) = .2).
Switch R is the average length of visits after nine switches and beyond.
Probabilities of staying at the just-reinforced alternative after successive continuations of same-key reinforcer sequences are shown for conditional probabilities .2 to .9 in Figure 14. Data were not included when there were fewer than 40 instances of a specific reinforcer-sequence type. This criterion was chosen as a compromise between minimizing variability and maximizing the inclusion of data. For conditions with lower conditional probabilities, this criterion was less likely to be exceeded for longer same-key sequences than when the conditional probability was higher. As also shown in Figure 4, all pigeons except for Pigeon 65 exhibited clear right-key biases in that the probability of staying after right-key reinforcers was generally above .85, whereas probabilities of staying after left-key reinforcers tended to be lower and more variable. With successive continuations of left-key reinforcer sequences, however, the probability of staying at the left alternative increased.
Fig. 14. Probability of staying at the just-reinforced alternative for successive continuations of same-key reinforcer sequences for conditional probabilities .2 to .9 for Pigeons 62 to 66 and the group average.
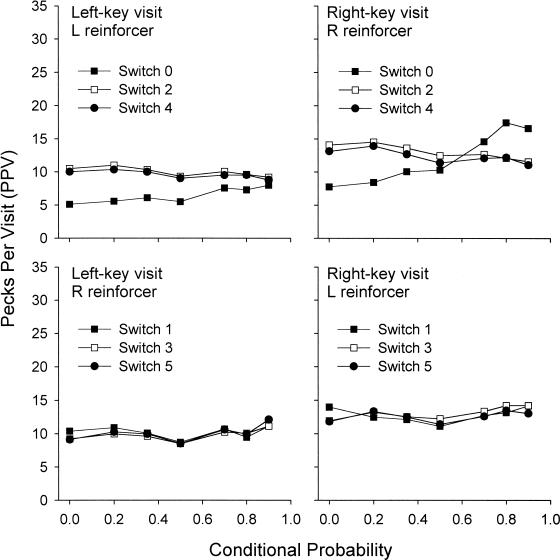
Figure 15 shows the mean visit lengths at the left and right response key after the first left- and right-key reinforcer in a new sequence (L and R) as a function of the conditional probability arranged across different conditions. For conditional probability .7, the mean value of Condition 2 is shown, as Pigeon 64 did not complete Condition 9 (also conditional probability .7). Note that no data could be shown for Condition 8, as no discontinuations occurred in that condition. The top left panel shows the mean number of pecks per visit at the left alternative for different switch numbers after an L reinforcer. Switch 0 in the top left panel thus denotes the length of a stay-visit at the left key, and Switch 2 denotes a visit at the left alternative after the subject returned from a visit at the right key. The bottom right panel shows the mean pecks per visit at the right key given a reinforcer had occurred at the left alternative. Switch 1 refers to the first visit at the right key after a left-key reinforcer, and Switch 3 refers to the second visit at the right alternative. A Kendall's (1955) nonparametric test for monotonic trend showed that there were significant increases in stay-visit lengths immediately after both L and R reinforcers with increases in the conditional probability (respectively, p < .01, z = 2.69; and p < .01, z = 5.37; two-tailed). Subsequent visits at the just-reinforced alternative (Switches 2 and 4) decreased slightly in length when the conditional probability was increased. These trends were all significant at p < .01. Visits at the not-reinforced alternative appeared relatively constant with changes in the conditional probabilities (bottom panels of Figure 15). Trends were significant only after Switch 5 after R reinforcers (p < .01) and after Switch 3 after L reinforcers (p < .01).
Fig. 15. Mean pecks per visit at the left and right key after L and R reinforcers (sequences of left- and right-key reinforcers, respectively, of Length 1 that were preceded by a reinforcer on the other alternative) by numbers of switches after reinforcers as a function of conditional probabilities of reinforcer location. Data from Condition 8 are not shown because no discontinuations occurred in this condition.
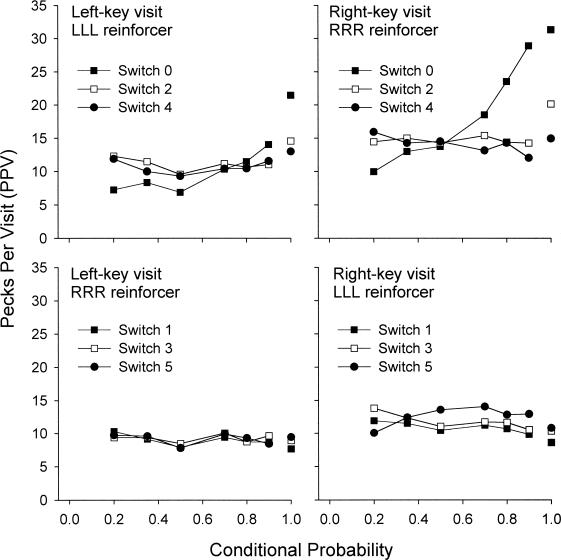
Figure 16 shows the same analyses for visits after LLL and RRR reinforcers. Recall that these designations refer to sequences of three same-key reinforcers that were preceded by a right- and left-key reinforcer, respectively. No data could be shown for Condition 7, as this condition arranged strict alternations of reinforcer locations. Condition 8 (conditional probability of 1) arranged only same-key reinforcer sequences in a session; the data shown for this condition are average visit lengths after left- and right-key reinforcers. Postreinforcer stay visits increased substantially with increases in the conditional probability. A Kendall's (1955) trend test showed that, for stay visits after both LLL and RRR reinforcers, these trends were significant at p < .01 (z = 4.20 and z = 6.05, respectively). For Switches 4 and 5, no trend tests could be conducted, as no data were available for some individual subjects for some visits. For visits after Switch 2 after both LLL and RRR reinforcers, there were no significant trends across conditional probabilities (z = −0.67 and z = 0.00, respectively).
Fig. 16. Mean pecks per visit at the left and right key after LLL and RRR reinforcers (sequences of left- and right-key reinforcers, respectively, of Length 3 that were preceded by a reinforcer on the other alternative) by numbers of switches after reinforcers as a function of conditional probabilities of reinforcer location.
Condition 8 arranged a conditional probability of 1, and the data shown for this condition are pecks per visit after left- and right-key reinforcers. The symbols for Condition 8 are not joined to lines.
DISCUSSION
After a reinforcer was received, there typically was a period of strong preference for the just-reinforced alternative (Figures 8 to 10), as reported by a series of previous studies (e.g., Davison & Baum, 2002; Landon et al., 2002). Apart from these short-term effects of reinforcers, extended effects also were noticeable. With successive continuations of same-key reinforcers, the level at which preference pulses stabilized appeared to become more extreme (Figure 12), and log response ratios approached more extreme levels according to a negatively accelerated function (Figure 7). All of these results replicated previous reports from our laboratory (e.g., Davison & Baum, 2002; Landon et al., 2002).
There was clear control of local preference by conditional probabilities of reinforcers. Preference pulses to the just-reinforced alternative were more extreme and lasted longer at higher conditional probabilities (Figures 8 to 10). These figures show preference pulses after L and R reinforcers, and thus discontinuations of sequences of right- and left-key reinforcers, respectively. With greater conditional probabilities, these preceding sequences of same-key reinforcers usually were longer than with smaller conditional probabilities, resulting in more extreme preference to the other alternative before the start of a new sequence (Figures 7 and 12). However, despite the fact that preference prior to L and R reinforcers was more strongly biased in the other direction when the conditional probabilities were higher, preference pulses were nevertheless larger at larger values of conditional probabilities. This is strong evidence for local control by conditional probabilities.
The results support Davison and Baum's (2003) suggestion that sequences of reinforcers exert control over local preference. The fact that preference pulses were larger when reinforcer ratios were varied across components (their Experiment 2) than when reinforcer magnitude ratios were varied (their Experiment 1) can thus be explained by differences in the probability of sequences of reinforcers on the same alternative. In Davison and Baum's Experiment 1, reinforcer ratios were 1:1 across all components, a conditional probability p(Rx|Rx) of .5. In their Experiment 2, however, reinforcer ratios were varied from 27:1 to 1:27, so, in the six components that did not arrange a 1:1 component, the conditional probability p(Rx|Rx) was greater than .5 on the richer alternative and less than .5 on the leaner alternative.
Differences in probabilities of same-key reinforcer sequences also can explain why preference pulses after a reinforcer on the rich alternative usually are larger than preference pulses after a reinforcer on the lean alternative (Landon et al., 2002). On the rich alternative, a reinforcer signals a high probability that the next reinforcer will be on the same alternative, whereas on the lean alternative, a reinforcer signals that the next reinforcer is unlikely to be on this alternative. Testing this suggestion would require arranging unequal conditional probabilities on both alternatives. Although Krägeloh and Davison (2003) confirmed Landon et al.'s finding that preference pulses were larger after a reinforcer was obtained at the rich alternative than after a reinforcer at the lean alternative, Davison and Baum (2003) reported no effect of different reinforcer ratios on probability of staying at the just-reinforced alternative.
The results of the present experiment also can explain Landon and Davison's (2001) report that larger ranges of reinforcer ratios in the Davison-Baum (2000) procedure produce faster changes in preference. In conditions where the range of the component reinforcer ratios is more extreme, conditional probabilities are more extreme on the richer alternative. Preference after reinforcers therefore favors the just-reinforced alternative to a larger extent, thus giving rise to faster and larger changes in preference.
The subjects in the present experiment, however, only partly tracked local probabilities of reinforcer locations, and exhibited a general tendency to stay at the just-reinforced alternative. Only in Condition 7, where reinforcer locations alternated strictly, were the pigeons more likely to shift immediately after reinforcers (Figure 4). In Condition 3, where the conditional probability was .2, local preference changes of Pigeons 62 and 64 appeared distinctly different from those of the other subjects (Figure 5). After L and R reinforcers, log response ratios of these 2 subjects favored the not-reinforced alternative, thus appearing to track the overall local reinforcer probabilities in that condition. As illustrated in Figures 8 to 10, all subjects exhibited a period in which preference moved in the direction of the just-reinforced alternative. For Pigeons 62 and 64, this shift in preference was not large enough to produce an overall preference for the just-reinforced alternative. However, there was a consistent general pattern of changes in preference across all subjects both immediately after reinforcement and across successive responses. The patterns of postreinforcer visit lengths also were similar across subjects (Figure 13). The fact that the response patterns of Pigeons 62 and 64 in Condition 3 were different from the other subjects can only stem from their strong bias to shift away from the left key immediately after left-key reinforcers. As illustrated in Figures 4 and 14, both of these subjects were more likely to shift away from the left alternative than stay after left-key reinforcers, as opposed to the other subjects that were more likely to stay.
The shape of preference pulses of Pigeons 62 and 64 in Condition 3 can be reconstructed from the probabilities of staying after reinforcers (Figures 4 and 14) and lengths of postreinforcer visits (Figure 13). Pigeon 62, for example, was very likely to shift after a left-key reinforcer, and if it did, it tended to emit around 16 responses at the right alternative. On occasions when Pigeon 62 did stay at the left key, however, it tended to emit around eight pecks. At around 10 pecks after a left-key reinforcer, therefore, overall log response ratios were most strongly biased to the right response key. After right-key reinforcers, however, Pigeon 62 was very likely to stay and emit around 13 responses before moving to the left alternative. Overall, the general patterns of visit lengths did not differ from those of other subjects, and the short period of time of more extreme preference for the right key after left-key reinforcers was caused by large differences in probabilities of staying at the left and right keys after reinforcers.
In Condition 8, in which reinforcers were arranged exclusively on one alternative in a session, both the discriminative effect of reinforcement and the short-term reinforcer effects should have shifted preference strongly towards the just-reinforced alternative. As Figures 10 and 16 show, however, subjects still often visited the extinction alternative. This could be due to a variety of factors, such as relatively weak control by reinforcer sequences or a strong effect of longer-term reinforcer ratios, such as carryover effects from the previous session. This occasional responding at the extinction alternative also could be interpreted as the result of a history effect of continued exposure to dependent schedules, which force the animal to change over frequently, or might indicate an underlying fix-and-sample pattern (Baum, Schwendiman, & Bell, 1999). Alternatively, this could indicate misallocation of reinforcers between alternatives, as predicted by the contingency-discriminability model (Davison & Jenkins, 1985).
Krägeloh and Davison (2003) demonstrated that discriminative stimuli in Davison and Baum's (2000) procedure can exert stimulus control over preference. When components were signaled by differential flash durations on both response keys, preference at the start of a component and before the first reinforcer already was strongly biased to the rich alternative. Davison and Baum (2003), however, reported that reinforcer magnitude differences failed to control preference discriminatively. When components arranged different reinforcer magnitudes on the two alternatives, preference following the first reinforcer in a component did not result in large preference shifts. Although the first reinforcer signaled the alternative on which large or small reinforcers would be obtained, control did not develop. As mentioned above, Davison and Baum (2003) attributed this result to control by sequences of reinforcers. Because reinforcer ratios were 1:1 in every component, conditional probabilities of reinforcement were .5 on both alternatives. These findings indicate that although reinforcers can acquire signaling functions and control preference locally, different aspects of reinforcers can acquire this function to a greater or lesser extent such that the location of the reinforcer might be a more powerful controlling variable than its magnitude.
The lengths of stay visits determine the height and length of the preference pulses, whereas the subsequent visits determine the level at which preference stabilizes. Figures 15 and 16 show that the main effect of conditional probabilities of reinforcer locations was on the length of the first postreinforcer stay visits, whereas subsequent visits were generally shorter and unaffected by variations in the conditional probabilities. This could explain why the size of the preference pulses changed with conditional probabilities, whereas the level at which preference stabilized was unaffected (Figure 10).
Compared with other visits, the length of the postreinforcer stay visits changed most with increasing numbers of successive reinforcer continuations. Compared with visit lengths after L and R reinforcers (Figure 15), stay visit lengths after LLL and RRR showed the largest increases (Figure 16). Hence the increases in preference shown in Figures 5 to 7 are largely due to changes in stay visits rather than any other visits. Changes in probabilities of staying after successive reinforcers (Figure 14) did not appear to be a major contributing factor to the increasing preference. The way in which preference changed with successive continuations was similar for both left- and right-key reinforcer sequences (Figure 7), despite the differences in probabilities of staying at the left and right key.
No COD requirement operated if the pigeon stayed at the just-reinforced alternative, and the first response at that alternative after a reinforcer could be reinforced. The presence of a 2-s COD most likely was a contributing factor to the differences in the lengths of postreinforcer stay visits as compared with any subsequent visits. This, however, would only predict that the lengths of the stay visits are generally shorter than the lengths of subsequent visits, but cannot explain why their lengths changed when the conditional probabilities were varied.
The contribution of the period of time immediately after reinforcement to the overall measure of preference has been pointed out previously by Krägeloh and Davison (2003). When they excluded the first 20 s following a reinforcer delivery, approximately the length of a preference pulse, values of overall sensitivity to reinforcement decreased. The present experiment adds to this finding by highlighting the importance of the first postreinforcer visit (see also Baum & Davison, 2004; Davison & Baum, 2003). It appears, therefore, that stay visits are sensitive to local probabilities of reinforcer locations, whereas subsequent visit patterns might reflect overall preference as determined by the overall reinforcer ratio and any inherent key bias. In terms of the behavior systems approach (Timberlake, 1993), an animal responding on concurrent schedules could be assumed to exhibit a predatory feeding sequence. The first two visits after reinforcers might then indicate a focal-search mode, whereas subsequent behavior might reflect a general-search mode.
One possible confound in the present experiment may be the different variabilities in the obtained reinforcer ratios across sessions for different conditions. In Condition 7, where reinforcer locations strictly alternated, the obtained reinforcer ratios in a session were always 1:1, provided the subject had obtained all 80 reinforcers or an even number of reinforcers. As conditional probabilities were increased, average reinforcer sequence lengths increased together with increasing across-session variability in the obtained reinforcer ratios. Perhaps the clear effects of changes in conditional probability that we have shown are effects of between-session reinforcer-ratio variability along the lines of the within-session effects reported by Landon and Davison (2001). Our data cannot answer this challenge, but such an explanation would suggest that sensitivity to reinforcement in pseudorandom binary sequence arrangements (Hunter & Davison, 1985) would be higher than in concurrent VI VI schedule performance arranged for many sessions per condition. This is not the case for concurrent VI VI performance (Hunter & Davison, 1985) or for concurrent-chains performance (Grace, Bragason & McLean, 2003). Thus we doubt this explanation.
Two different kinds of key bias could be identified in the present experiment. As shown in Figures 4 and 14, Pigeon 64 had a high probability of staying after right-key reinforcers, but a low probability of staying after left-key reinforcers. As shown in Figure 3, however, Pigeon 65 exhibited a consistent bias towards the right key in terms of overall log response ratios, but did not show substantial differences in the probabilities of staying after left- and right-key reinforcers (Figure 14). All the other subjects showed a combination of these two types of bias.
We can only speculate about the origin of the general right-key bias. There is a possibility that the general right-key preference could stem from the way in which the wooden perches were arranged. One wooden perch ran in parallel to the experimental panel and was intersected by another perch at a point that was closer to the right response key than to the left response key. It is possible that this arrangement allowed for slightly more comfortable standing on the right side of the perch that was parallel to the experimental panel. In addition to that, the right key was closer to the front of the cage than the left key, and so the key bias could be a result of these differences in visual stimulation. Overall, however, key bias did not appear to have influenced the way in which local preference was affected by conditional probabilities of reinforcer locations. Even though the levels at which preference stabilized after a reinforcer differed for left and right responses, the sizes and lengths of the preference pulses clearly were affected by the conditional probabilities (Figure 10).
This experiment identified sequences of reinforcers as an important controlling variable in choice. Unlike in standard concurrent VI schedules, where conditional probabilities of reinforcer locations vary with changes in the arranged overall reinforcer ratios, this study isolated the effects of average lengths of same-key reinforcer sequences from the effects of the overall reinforcer ratios. Preference after reinforcers was strongly controlled by conditional probabilities, with a tendency to move towards the alternative where the subsequent reinforcer was most likely to be. In concurrent VI schedules, a complete description of the effects of reinforcers should thus include reference to the discriminative function of reinforcers signaling the location of subsequent reinforcers.
Acknowledgments
This research was carried out by the first author in partial fulfillment of the requirements for his doctoral degree at the University of Auckland. Further data can be found on the JEAB website, http://seab.envmed.rochester.edu/jeab/. We would like to thank the members of the Experimental Analysis of Behaviour Research Unit for their help in conducting this experiment, and Mick Sibley for looking after the subjects.
REFERENCES
- Baum W.M. On two types of deviation from the matching law: Bias and undermatching. Journal of the Experimental Analysis of Behavior. 1974;22:231–242. doi: 10.1901/jeab.1974.22-231. [DOI] [PMC free article] [PubMed] [Google Scholar]
- Baum W.M. Matching, undermatching, and overmatching in studies of choice. Journal of the Experimental Analysis of Behavior. 1979;32:269–281. doi: 10.1901/jeab.1979.32-269. [DOI] [PMC free article] [PubMed] [Google Scholar]
- Baum W.M, Davison M. Choice in a variable environment: Visit patterns in the dynamics of choice. Journal of Experimental Analysis of Behavior. 2004;81:85–127. doi: 10.1901/jeab.2004.81-85. [DOI] [PMC free article] [PubMed] [Google Scholar]
- Baum W.M, Schwendiman J.W, Bell K.E. Choice, contingency discrimination, and foraging theory. Journal of the Experimental Analysis of Behavior. 1999;71:355–373. doi: 10.1901/jeab.1999.71-355. [DOI] [PMC free article] [PubMed] [Google Scholar]
- Buckner R.L, Green L, Myerson J. Short-term and long-term effects of reinforcers on choice. Journal of the Experimental Analysis of Behavior. 1993;59:293–307. doi: 10.1901/jeab.1993.59-293. [DOI] [PMC free article] [PubMed] [Google Scholar]
- Davison M, Baum W.M. Choice in a variable environment: Every reinforcer counts. Journal of the Experimental Analysis of Behavior. 2000;74:1–24. doi: 10.1901/jeab.2000.74-1. [DOI] [PMC free article] [PubMed] [Google Scholar]
- Davison M, Baum W.M. Choice in a variable environment: Effects of blackout duration and extinction between components. Journal of the Experimental Analysis of Behavior. 2002;77:65–89. doi: 10.1901/jeab.2002.77-65. [DOI] [PMC free article] [PubMed] [Google Scholar]
- Davison M, Baum W.M. Every reinforcer counts: Reinforcer magnitude and local preference. Journal of the Experimental Analysis of Behavior. 2003;80:95–129. doi: 10.1901/jeab.2003.80-95. [DOI] [PMC free article] [PubMed] [Google Scholar]
- Davison M, Jenkins P.E. Stimulus discriminability, contingency discriminability, and schedule performance. Animal Learning & Behavior. 1985;13:77–84. [Google Scholar]
- Davison M, McCarthy D. The matching law: A research review. Hillsdale, NJ: Erlbaum; 1988. [Google Scholar]
- Findley J.D. Preference and switching under concurrent scheduling. Journal of the Experimental Analysis of Behavior. 1958;1:123–144. doi: 10.1901/jeab.1958.1-123. [DOI] [PMC free article] [PubMed] [Google Scholar]
- Grace R.C, Bragason O, McLean A.P. Rapid acquisition of preference in concurrent chains. Journal of the Experimental Analysis of Behavior. 2003;80:235–252. doi: 10.1901/jeab.2003.80-235. [DOI] [PMC free article] [PubMed] [Google Scholar]
- Herrnstein R.J. Relative and absolute strength of response as a function of frequency of reinforcement. Journal of the Experimental Analysis of Behavior. 1961;4:267–272. doi: 10.1901/jeab.1961.4-267. [DOI] [PMC free article] [PubMed] [Google Scholar]
- Hunter I, Davison M. Determination of a behavioral transfer function: White-noise analysis of session-to-session response-ratio dynamics on concurrent VI VI schedules. Journal of the Experimental Analysis of Behavior. 1985;43:43–59. doi: 10.1901/jeab.1985.43-43. [DOI] [PMC free article] [PubMed] [Google Scholar]
- Kendall M.G. Rank correlation methods. London: Charles Griffin; 1955. [Google Scholar]
- Krägeloh C.U, Davison M. Concurrent-schedule performance in transition: Changeover delays and signaled reinforcer ratios. Journal of the Experimental Analysis of Behavior. 2003;79:87–109. doi: 10.1901/jeab.2003.79-87. [DOI] [PMC free article] [PubMed] [Google Scholar]
- Landon J, Davison M. Reinforcer-ratio variation and its effects on rate of adaptation. Journal of the Experimental Analysis of Behavior. 2001;75:207–234. doi: 10.1901/jeab.2001.75-207. [DOI] [PMC free article] [PubMed] [Google Scholar]
- Landon J, Davison M, Elliffe D. Concurrent schedules: Short- and long-term effects of reinforcers. Journal of the Experimental Analysis of Behavior. 2002;77:257–271. doi: 10.1901/jeab.2002.77-257. [DOI] [PMC free article] [PubMed] [Google Scholar]
- Landon J, Davison M, Elliffe D. Choice in a variable environment: Effects of unequal reinforcer distributions. Journal of the Experimental Analysis of Behavior. 2003;80:187–204. doi: 10.1901/jeab.2003.80-187. [DOI] [PMC free article] [PubMed] [Google Scholar]
- Lobb B, Davison M.C. Performance in concurrent interval schedules: A systematic replication. Journal of the Experimental Analysis of Behavior. 1975;24:191–197. doi: 10.1901/jeab.1975.24-191. [DOI] [PMC free article] [PubMed] [Google Scholar]
- Menlove R.L. Local patterns of responding maintained by concurrent and multiple schedules. Journal of the Experimental Analysis of Behavior. 1975;23:309–337. doi: 10.1901/jeab.1975.23-309. [DOI] [PMC free article] [PubMed] [Google Scholar]
- Stubbs D.A, Pliskoff S.S. Concurrent responding with fixed relative rate of reinforcement. Journal of the Experimental Analysis of Behavior. 1969;12:887–895. doi: 10.1901/jeab.1969.12-887. [DOI] [PMC free article] [PubMed] [Google Scholar]
- Taylor R, Davison M. Sensitivity to reinforcement in concurrent arithmetic and exponential schedules. Journal of the Experimental Analysis of Behavior. 1983;39:191–198. doi: 10.1901/jeab.1983.39-191. [DOI] [PMC free article] [PubMed] [Google Scholar]
- Timberlake W. Behavior systems and reinforcement: An integrative approach. Journal of the Experimental Analysis of Behavior. 1993;60:105–128. doi: 10.1901/jeab.1993.60-105. [DOI] [PMC free article] [PubMed] [Google Scholar]
- Wearden J.H, Burgess I.S. Matching since Baum (1979). Journal of the Experimental Analysis of Behavior. 1982;38:339–348. doi: 10.1901/jeab.1982.38-339. [DOI] [PMC free article] [PubMed] [Google Scholar]


