Abstract
The relation between the rate of a response (B) and the rate of its reinforcement (R) is well known to be approximately hyperbolic: B = kR/(R + Ro), where k represents the maximum response rate, and Ro indicates the rate of reinforcers that will engender a response rate equal to half its maximum value. A review of data reported in 17 published papers revealed that, under variable-interval schedules of reinforcement, Ro was usually lower when pigeons were the subjects than when rats were the subjects. The value of k, in contrast, did not differ consistently between pigeons and rats. Some accounts interpret Ro as the rate of alternative, unscheduled reinforcers in the situation, expressed in units of the scheduled reinforcer. So interpreted, the difference in Ro implies that less alternative reinforcement (relative to the scheduled reinforcement) typically is available to pigeons in their operant conditioning chambers than it is to rats in theirs. Whether or not that interpretation of Ro is valid, the pigeon–rat difference in Ro ensures that for reinforcer rates above about 10 per hour, response rate will be noticeably less sensitive to changes in reinforcer rate (and presumably to changes in other incentive and motivational operations) with pigeons than with rats as subjects, at least with the experimental conditions typically employed.
Keywords: Herrnstein's hyperbola, variable-interval schedule, reinforcer effectiveness, response strength, pigeons, rats
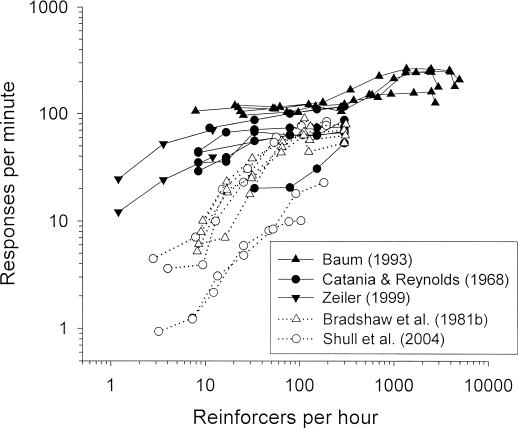
Figure 1 illustrates the phenomena that are the focus of this paper. Response rate is plotted as a function of the reinforcer rate obtained from variable-interval (VI) schedules of reinforcement. The data come from previously published studies in which a particular VI schedule of reinforcement was in effect for a sufficiently large block of daily sessions to generate stable performance. Each subject was exposed to a number of different VI schedules (i.e., different reinforcer rates) over a sequence of such blocks. Some of the plots (solid symbols) show data from individual pigeons that obtained food reinforcers by pecking a key (Baum, 1993; Catania & Reynolds, 1968; Zeiler, 1999); other plots (open symbols) show data from individual rats that obtained food reinforcers by pressing a lever (Bradshaw, Ruddle, & Szabadi, 1981b) or by poking a key (Shull, Grimes, & Bennett, 2004).
Fig. 1. Response rate plotted as a function of the rate of reinforcers provided by VI schedules of reinforcement.
Each plot represents the data from an individual subject from the study indicated (with data from replications averaged); plots are shown for all the subjects in the study. Solid symbols indicate data from pigeons; open symbols indicate data from rats. Note the logarithmic scaling of the axes.
Three features of this set of data stand out. First, the range of reinforcer rates in these studies seldom extended below five per hour and never below one per hour. Second, over the range of reinforcer rates below about 100 per hour, the response rates were usually higher for the pigeons than for the rats. And third, over the range of reinforcer rates between about 10 per hour and 100 per hour, the slopes of the plots tended to be less steep for the pigeons than for the rats. Because the axes are logarithmic, the slope can be interpreted as measuring the sensitivity of response rate to changes in reinforcer rate (after Baum, 1974)—that is, as measuring the proportional change in response rate due to a given proportional change in reinforcer rate. In this sense, the pigeons' response rates were typically less sensitive than the rats' response rates to changes in reinforcer rates. For example, an approximately tenfold (i.e., one log unit) increase in reinforcer rate, from about 10 to about 100 reinforcers per hour, seldom produced as much as a twofold increase in response rate from the pigeons but often produced more than a sixfold increase from the rats.
The remainder of this paper focuses on the difference between pigeons and rats in the sensitivity of response rate to reinforcer rate. First to be considered is the extent to which this difference, apparent in the limited data set of Figure 1, also is apparent in a more extensive data set. Next, sensitivity differences are interpreted within the framework of Herrnstein's (1970) hyperbolic equation relating response and reinforcer rates. Finally, some implications are considered regarding the importance of incentive and motivational variables (i.e., reinforcer effectiveness variables) as determiners of response rate.
To assess the generality of the effects apparent in Figure 1, I obtained a larger sample of data from 17 previously published studies with pigeons and rats as subjects. Several considerations guided the selection of these data. First, I wanted enough data points from each subject to provide meaningful fits of equations containing two free parameters. Thus, with one exception (Zeiler, 1999), I only included data from studies that arranged at least five different VI schedules for each subject and only if response and reinforcer rates were available for individual subjects, either from tables or graphs. Although Zeiler's study provided just three data points per pigeon, those data seemed worth including because of the unusually low reinforcer rates examined (as low as 1.2 per hour). Second, I tried to ensure some variety in the data set in such features as the laboratory that generated the data, the decade in which the study was published, and the response and reinforcer type. Third, I wanted to ensure that each subject contributed only one response rate–reinforcer rate relation to the data set so that no individual subject would have its data disproportionately represented. Some studies (all but one involving rats as subjects) examined the relation between response and reinforcer rates repeatedly with the same subjects, with factors such as the deprivation level or the reinforcer amount varied between series. For those studies (with the exception of Petry & Heyman, 1994) I used the data from only one series—namely, the one for which the reinforcer was likely to have been most potent. Thus, for example, if the study examined the relation between response and reinforcer rates under two different deprivation levels, I selected the series carried out under the more severe deprivation level. For reasons that should become apparent shortly, this restriction was conservative in the sense of working against finding a difference between pigeons and rats. The rats in Petry and Heyman's (1994) study experienced the same series of VI schedules under water deprivation, with water as the reinforcer, and also under food deprivation with food (sucrose) as the reinforcer. It seemed useful to sample data with both reinforcer types, so the data from both series were included.
The studies examined the relation between response and reinforcer rates in two different ways. In one, each VI schedule was in effect for a block of consecutive sessions. The different VI schedules thus occurred over a sequence of blocks. This method will be called the single-schedule procedure. In the other method, all or most of the VI schedules occurred during every session, with each VI in effect for 5 min or so and correlated with a particular discriminative stimulus. This method will be called the multiple-schedule procedure.
Table 1 identifies the 18 data sets from 17 published papers. For each set, the table provides brief descriptions summarizing aspects of the procedure and indicating the source of the data, including whether the data came from a table or from a graph. To extract the data from a graph, I first created a digital picture by scanning the published graph. Then I loaded the picture into Microsoft Paint® and used the pixel coordinates, given in the lower right corner of the Paint window, to determine the coordinate values of the data points and the x- and y-axis scale values.
Table 1. A list of the data sets, grouped by categories (i.e., Pigeon–single VIs, Rat–single VIs, and Rat–multiple VIs) and ordered by publication date within categories. From left to right, the first three columns identify the publication, the particular condition used, and whether the data were obtained from a table or figure. The next three columns list the number of subjects in the data set, the type of operandum, and the type of reinforcer used—whether dry food (Food), liquid food such as milk or sucrose (Food-L), or water. The last column identifies the location of the published estimates of k and Ro that were compared with those derived from the Microsoft Excel Solver® fits in the present study (see Appendix).
| Published paper | Condition selected | Data source | Number of subjects | Operandum | Reinforcer | Compare |
| Pigeon–single VIs | ||||||
| Catania & Reynolds (1968) | All | Scanned Fig. 1 | 6 | Key | Food | dV&Ha |
| Dougan & McSweeney (1985) | No water deprivation | Table 3 | 10 | Key | Food | Table 3 |
| Baum (1993) | VI components | Fig. 7<sup>b</sup> | 4 | Key | Food | None |
| Zeiler (1999) | Open economy | Scanned Fig. 6 | 2 | Key | Food | None |
| Rat–single VIs | ||||||
| de Villiers & Herrnstein (1976) | All | Scanned Fig. 2 | 3 | Lever? | Food-L | Fig. 2 |
| Bradshaw et al. (1978) | 0.32 M sucrose | Scanned Fig. 1 | 4 | Lever | Food-L | Table 2 |
| Bradshaw et al.(1981a) | 0.10 ml | Scanned Fig. 1 | 3 | Lever | Food-L | Table 1 |
| Bradshaw et al. (1981b) | Control | Table 2 | 4 | Lever | Food-L | Table 3 |
| Shull et al. (2004) | All VIs | Fig. 1 & 6<sup>c</sup> | 4 | Key | Food | Yesd |
| Rat–multiple VIs | ||||||
| Snyderman (1983) | 70% weight | Table 1 | 5 | Key | Food | Table 1 |
| Heyman (1983) | Baseline | Tables 1 & 3 | 7 | Lever | Food-L | Tables 2 & 4 |
| Heyman & Monaghan (1994) | 0.64 M sucrose | Table (Appendix) | 7 | Lever | Food-L | Table 2 |
| Petry & Heyman (1994) | 11.5% sucrose | Table (Appendix) | 7 | Lever | Food-L | Table 1 |
| Petry & Heyman (1994) | Water | Table (Appendix) | 7e | Lever | Water | Table 1 |
| Belke & Heyman (1994) | Single-VI (mean of 2) | Table (Appendix) | 6 | Lever | Food-L | None |
| Petry & Heyman (1997) | 7-component baseline | Table 1 | 7 | Lever | Food-L | Table 2 |
| McDowell & Dallery (1999) | 47 h water deprivation | Table (Appendix B) | 5 | Lever | Water | Table 2 |
| Dallery et al. (2000) | 0.64 M sucrose | Table (Appendix) | 8 | Lever | Food-L | Table 3 |
aParameter estimates given in de Villiers & Herrnstein's (1976)Fig. 1.
bBaum (personal communication, 2003) provided a table listing the data.
cThe data were obtained from a table that I have.
dComparisons were fits with Wilkinson's method as described by McDowell (1981).
eThese were the same 7 rats studied with the 11.5% sucrose reinforcer, immediately above.
Recall that a distinctive feature of Figure 1 was the difference between pigeons and rats in the slopes of the plots over the range of reinforcer rates below about 100 reinforcers per hour. This difference (given the logarithmic axes) indicates that response rate was less sensitive for the pigeons than for the rats to changes in reinforcer rate over that range. One index of this sensitivity is simply the slope (in logarithmic coordinates) of the function relating response and reinforcer rates—that is, as the value of a in the equation,
where B represents response rate, R represents reinforcer rate, a is the slope (sensitivity), and c is a constant indicating the intercept. The value of a will be a serviceable index of sensitivity to the extent that the log–log relation is at least roughly linear. Most of the plots in Figure 1, as well as most of those in the larger data set, did, indeed, appear sufficiently linear over the range of reinforcer rates below about 300 reinforcers per hour. Accordingly, Equation 1 was fit (Pearson's least squares method) to the data from each subject in the 18 data sets—in all, 22 pigeons and 70 rats. These fits included all the response rate–reinforcer rate pairs (including replication values) for reinforcer rates below 350 reinforcers per hour; they included none of the pairs for reinforcer rates above 350 per hour. (Because the functions tended to flatten as reinforcer rate increased above about 100 per hour, fitting the function over the range of reinforcer rates through 350 per hour was, again, a conservative approach in the sense of tending to reduce differences between pigeons and rats.)
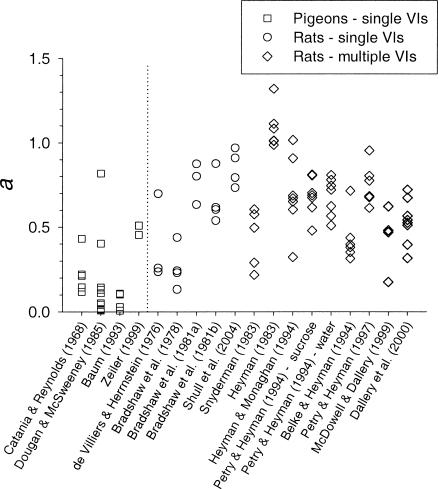
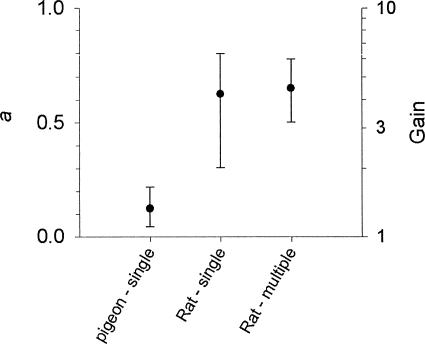
Figure 2 shows the value of a for each subject in the 18 data sets. Although there was some overlap, the values of a tend to be lower for the pigeons (left of the vertical line) than for the rats (right of the vertical line). That is, response rate tended to be less sensitive for pigeons than for rats to changes in reinforcer rate over the range examined below about 300 reinforcers per hour. Figure 3 summarizes this difference by displaying median and interquartile range values separately for the pigeons and for the rats studied under the single-schedule and multiple-schedule procedures.
Fig. 2. The values of a from the fits of Equation 1 to the data from the studies indicated. Each point represents the value from an individual subject. Points to the left of the vertical line are from pigeons; those to the right are from rats.
Fig. 3. Median and interquartile range values of a, calculated separately for the groupings listed along the x axis from the data in Figure 2. The right y axis (Gain) scales these values as the proportional increase in response rate due to a log unit increase in reinforcer rate.
As an index of sensitivity, a can be taken as indicating the proportion of a log unit increase in response rate that is produced by a log unit increase in reinforcer rate. For example, an a value of 0.1 indicates that a one-log unit increase in reinforcer rate produces a one-tenth log unit increase in response rate. With a base-10 log unit, a one-tenth log unit increase is equivalent to an increase of 1.26:1 (i.e., the antilog of 0.1 = 100.1 = 1.26). These antilog values of a, which might be called the gain in response rate due to a tenfold increase in reinforcer rate, can be read in Figure 3 from the numbers on the right y axis. For the pigeons, a tenfold increase in reinforcer rate produced a median 1.3-fold increase in response rate; for the rats, it produced a median 4.2-fold (single-schedule) or 4.5-fold (multiple-schedule) increase in response rate.
As Herrnstein (1970) emphasized, the sensitivity of response rate to changes in reinforcer rate is interpretable within the framework of his hyperbolic equation relating response and reinforcer rates:
where, again, B and R refer, respectively, to response and reinforcer rates; k and Ro are curve-fitting constants, with k indicating the maximum response rate, and Ro indicating the reinforcer rate that will generate a response rate that is half of its maximum value. This function is increasing, negatively accelerated. Thus, as reinforcer rate increases, response rate becomes progressively less sensitive as it approaches its asymptotic (maximum) level. The value of Ro is relevant to sensitivity because it determines how rapidly the response-rate function rises toward its asymptotic level: The lower the value of Ro, the lower the rate of reinforcement along the x axis before the function begins to flatten noticeably. Indeed, once the reinforcer rate has been increased to a value equivalent to Ro, response rate will be half of its maximum value. Thus further increases in reinforcer rate beyond that point can no more than double the response rate.
In order to obtain estimates of Ro, Equation 2 was fit to each subject's data in the 18 data sets. These fits were carried out with Microsoft Excel Solver®, a nonlinear optimizing program, set to adjust the values of k and Ro so as to minimize the sum of squared deviations between obtained and predicted values (residuals) at each obtained reinforcer rate (see Appendix for comments about the reliability of these fits). For these fits, I included all the response rate–reinforcer rate pairs (including replication values) except for those with reinforcer rates above 1000 reinforcers per hour from Baum's (1993) study. Baum reported an apparent discontinuity in the function—an abrupt increase in response rate above a reinforcer rate of about 1000 reinforcers per hour. This increase may be evident in some of the plots of Baum's data in Figure 1. (Note that Baum's procedure differed from the others in the data set because of arranging a multiple schedule with a variable-ratio schedule in one component and a VI in the other component; the intervals of the VI were yoked to those obtained in the variable-ratio component.)
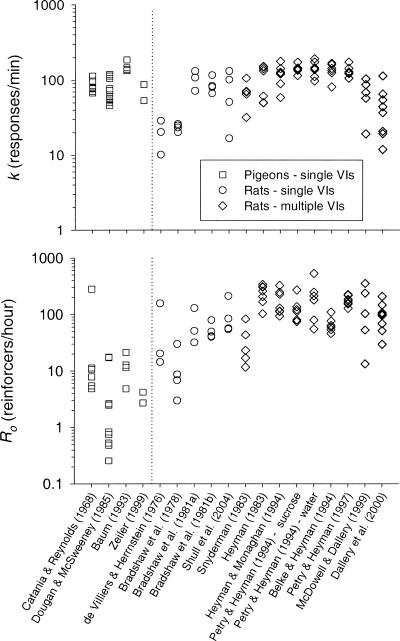
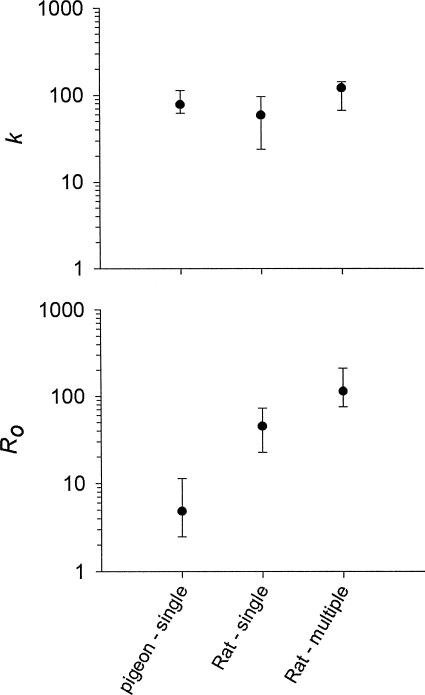
Figure 4 shows the values of k and Ro for each subject in the data set; and Figure 5 shows median and interquartile range values, separately for the pigeons and for the rats trained under the single-schedule and the multiple-schedule procedures. The values of k do not appear to differ systematically across these groupings. The values of Ro, however, tend to be lower for the pigeons (median = 4.8 reinforcers per hour) than for the rats under both the single-schedule (median = 45 reinforcers per hour) and the multiple-schedule (median = 114 reinforcers per hour) procedure. The median value of Ro for the rats under the single-schedule procedure was more than 9 times higher than that for the pigeons.
Fig. 4. The values of k (top panel) and Ro (bottom panel) from the fits of Equation 2 to the data from the studies indicated.
Each point represents the value from an individual subject. Points to the left of the vertical line are from pigeons; those to the right are from rats.
Fig. 5. Median and interquartile range values of k (top panel) and Ro (bottom panel) calculated separately for the groupings listed on the x axis from the data in Figure 4.
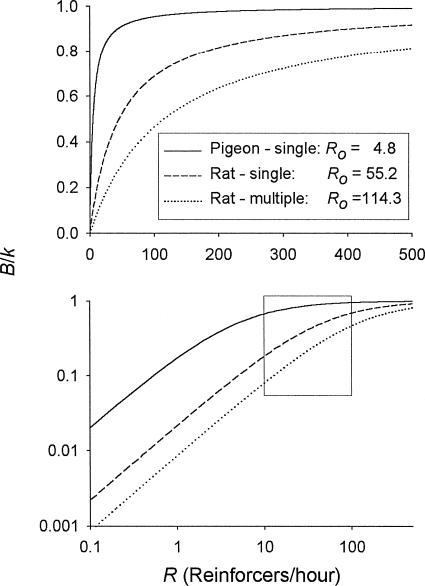
Figure 6 is intended to highlight the relation between Ro and the sensitivity of response rate to changes in reinforcer rate. Response rate, expressed as a proportion of its maximum value (i.e., B/k), is plotted as a function of reinforcer rate. The plots are derived from Equation 2 (i.e., B/k = R/(R + Ro), with the values of k and Ro being the median values obtained from the pigeons and from the rats under both the single-schedule and multiple-schedule procedure. The upper panel plots these functions in linear coordinates, which is the way that these functions usually have been plotted. The lower panel plots these functions in coordinates that have been logarithmically scaled to better display the effect of Ro and the range of reinforcer rates on the sensitivity of response rate to reinforcer rate. For reinforcer rates below about 10 per hour and above about 100 per hour, there is not much difference in the sensitivity (slope) between the median pigeon and the median rats. For both species, below about 10 reinforcers per hour response rate is highly sensitive to reinforcer rate, and above about 100 per hour it is rather insensitive. Between about 10 per hour and 100 per hour, however, response rate is noticeably less sensitive to reinforcer rate for the median pigeon than for the median rats.
Fig. 6. Response rate as a proportion of the maximum response rate (B/k) plotted as a function of the reinforcer rate (R) for pigeons and for the two groupings of rats.
The plots were generated from Equation 2 after dividing each side of the equation by k—that is, B/k = R/(R + Ro). The k and Ro values for these three plots are the median values for the groupings indicated. The axes in the top panel are linearly scaled; those in the bottom panel are logarithmically scaled. The rectangle in the bottom panel encloses the region over the range of reinforcer rates between 10 per hour and 100 per hour.
It is significant, therefore, that only two of the studies reviewed here (Dougan & McSweeney, 1985; Zeiler, 1999) scheduled reinforcer rates as low as a half log unit below 10 per hour (i.e., as low as 3.2 per hour), and none scheduled reinforcer rates below 1 per hour (Zeiler's study being the only one to arrange reinforcer rates as low as 1.2 per hour). In other words, most of the studies examined reinforcer rates primarily within the range over which a difference in sensitivity between pigeons and rats is particularly evident.
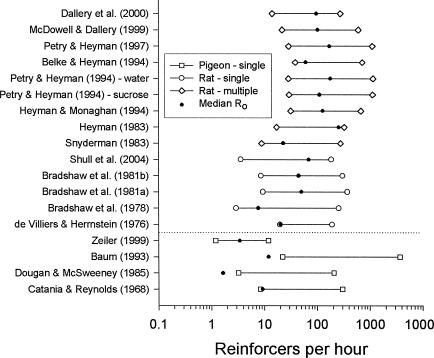
Figure 7 shows, for each of the 18 data sets, the median low and high reinforcer rates in the study (i.e., the range of reinforcer rates in the study based on medians). Also marked by a dot on each range bar is the median Ro value obtained from that data set. The importance of the Ro value in relation to the reinforcer rate range is, again, that increasing reinforcer rate above the value specified by Ro can produce no more than a twofold increase in response rate because response rate is already at one half of its maximum value. Thus, to the extent that the dot representing Ro is toward the left end of the range of reinforcer rates, response rate will necessarily be rather insensitive to changes in reinforcer rate. For all but one (Zeiler, 1999) of the data sets with pigeons, Ro is near to or to the left of the left end of the reinforcer rate range. Thus, for most of the studies with pigeons, response rate could change no more than twofold over the range of reinforcer rates examined. (Zeiler's study is an exception, and it is revealing that the a values for his 2 pigeons are higher than those for most of the pigeons in the other studies.) For most of the studies with rats, in contrast, the dot tends to be near the middle of the range. Thus there was room for response rate to vary more than twofold with changes in reinforcer rate over the range examined. In short, the low sensitivity of response rate to reinforcer rate that is characteristic of most of the data from pigeons (Figures 1, 2, and 3) is a result of the particular range of reinforcer rates employed in these studies combined with low values of Ro (Figures 4 and 5). Over the commonly examined range of reinforcer rates, the pigeons' response rates are usually close to their ceiling levels (k) and are relatively insensitive to changes in reinforcer rate.
Fig. 7. The range of reinforcer rates for the studies indicated (based on median low and high reinforcer rates from the study).
Studies with pigeons are shown below the horizontal line; those with rats are above the line. The solid dot on each line indicates the median value of Ro for the corresponding data set. All reinforcer rates are obtained values except for those from Catania and Reynolds (1968) and Zeiler (1999), which are scheduled values.
Implications
This insensitivity, apparent in the data from pigeons over a particular range of reinforcer rates, could be problematic if it is taken as evidence that the rate of operant behavior is generally insensitive to quantitative variations in the reinforcer along such dimensions as its rate and amount—that is, to variations in what might be called incentive and motivational variables. In the context of Equation 2 these variables could be represented by changes in the effective value of R (or, more precisely, as a scaling shift in R/Ro). Imagine, for example, introducing some treatment—perhaps a drug—that reduces the potency of the reinforcer. If the subjects are pigeons and the baseline reinforcement schedule provides about 60 reinforcers per hour, then the treatment will likely have little effect on response rate even if it has a substantial effect on reinforcer potency. With pigeons, under typical experimental conditions, 60 reinforcers per hour usually generate a response rate that is in the relatively flat (insensitive) segment of the response-rate function (Figure 6) so that relatively large changes along the reinforcement dimension generate relatively small changes in response rate. The problematic conclusion from these data would be that the treatment generally has little effect on response rate. The results and the conclusion could well have been different if the training schedule had provided, say, 6 reinforcers per hour instead of 60 per hour—or if the subjects had been rats instead of pigeons. Under those conditions, the baseline response rate would have been at a point on the response-rate function (Figure 6) where the slope is steep enough for changes along the reinforcement dimension to produce noticeable changes in response rate.
Morse (1966, p. 78) expressed a similar concern in noting that “this insensitivity of rate of responding to frequency of reinforcement probably weakens our interest in the concept of strength of responding.” Morse saw the problem as procedural. That is, the insensitivity was specific to certain experimental preparations rather than being a general characteristic of operant response rate. Shortly afterward, Herrnstein (1970) offered an interpretation of at least one relevant feature of these preparations. In deriving his hyperbolic response-rate equation (Equation 2), Herrnstein interpreted Ro as representing the rate of background reinforcers available in the experimental chamber for activities other than the measured response—that is, reinforcers, such as odors to sniff and itches to scratch, that are only incidentally provided by the experimenter. (Ro is scaled so that a unit of Ro is equivalent in reinforcing effectiveness to a unit of the scheduled reinforcer, R.) The insensitivity of response rate to variations in dimensions of the reinforcer resulted, Herrnstein argued, from experimenters' efforts to ensure low levels of background reinforcement relative to the scheduled reinforcement:
This explains, at least partly, why for over three decades, interesting functional relations between reinforcement and responding have been so scarce. Experimenters have naturally tried to make the behavior they were observing important to the subject, and they have probably succeeded. . . . Investigators have made a tacit decision in favor of stability, but at the cost of sensitivity to the independent variable. (p. 258)1
The one additional point suggested by the present analysis is that the procedural constraints have applied with greater force to preparations with pigeons than to those with rats. Under Herrnstein's interpretation of Ro, pigeons apparently obtain less alternative reinforcement, scaled relative to the potency of the scheduled reinforcer, in their chambers than rats do in theirs—at least as the chambers are typically constructed and with the deprivation levels and reinforcer amounts commonly employed. From the perspective of Herrnstein's interpretation, this difference could indicate either that the scheduled reinforcer typically is more potent for pigeons than for rats (perhaps due to differences in reinforcer magnitude or to differences in the effective deprivation level), that the typical experimental chamber provides a richer source of alternative reinforcement for rats than for pigeons, or some combination of the two.
Acknowledgments
This research was supported by a grant from the National Science Foundation (IBN-0125093).
Appendix
As a check on the reliability of the estimates of k and Ro reported in Figures 5 and 6, I was able to compare my estimates, generated with Microsoft Excel Solver®, with estimates calculated by the authors of the studies (or by a proxy) for 15 of the data sets (see Table 1 under “Compare”). For each subject in these data sets, I calculated a deviation score for the two estimates of k and for the two estimates of Ro. This deviation score is the logarithm of the ratio of my estimate to the published estimate—that is, log(k/k′) and log(Ro/Ro′), where k and Ro are my estimates obtained with Solver, and k′ and Ro′ are the estimates reported in the relevant published paper. A score of zero indicates that the two estimates are equal (i.e., log of 1 = 0). Negative values indicate that my estimate of the parameter is lower than the published estimate; positive values indicate that my estimate is higher than the published estimate.
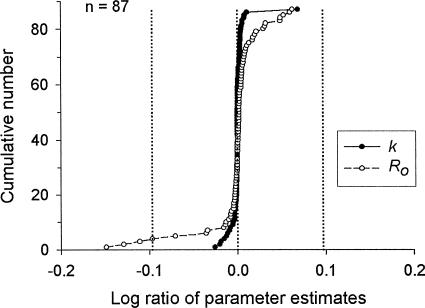
Figure 8 shows the cumulative frequency distribution of these deviation scores, ranked from lowest to highest, for both k and Ro. The vertical dashed lines show log values of −0.0969 and +0.0969, which correspond to ratios of 8:10 and 10:8. These values seemed useful as markers because they correspond to deviations from zero that are approximately equivalent to the width of a data point in Figure 4. Thus, as long as the deviations are in the zone bounded by the vertical lines, plotting the published estimates instead of mine would shift the points in Figure 4 upward or downward by a distance no larger than the width of a data point. A shift that small would have no practical effect on the conclusions.
Fig. 8. Frequency distribution of deviations between my estimates of k and Ro and those listed in the relevant publications (see Table 1, “Compare”). The vertical lines indicate deviations approximately equal to the width of a data point in Figure 4.
The large majority of deviations are, indeed, well within the zone defined by the vertical lines. Only four deviations, all estimates of Ro, are large enough to fall outside or on the boundary of that zone. Three of those are from the Bradshaw, Szabadi, and Bevan (1978) study (Rats 1, 2, and 4), and one is from Catania and Reynolds' (1968) study (Pigeon 3). For Bradshaw et al.'s study, the response rates were atypically low, and the response rates had to be extracted from scanned graphs. For Catania and Reynolds' study, the estimates of k and Ro were provided by de Villiers and Herrnstein (1976), who averaged replication values before fitting Equation 2 and who did not specify the fitting method. In any case, none of those four deviations is as large as twice the width of a data point in Figure 4. The one noticeable deviation for the estimates of k—the point in the upper right of the plot for k—probably is the result of an error in the published table (McDowell & Dallery, 1999, Rat R2). A plot of Equation 2 based on the k value listed in the published table lies consistently below data points from that rat. In short, in the large majority of cases, my estimates using Solver were very similar to those reported in the published papers. None of the deviations was large enough to affect the conclusions.
Footnotes
In the same section, Herrnstein (1970, p. 258) showed how his interpretation of the parameters of the hyperbolic response rate-equation could lead to an account of the “peculiar discrepancy between single and multiple response [i.e., concurrent] situations . . . with the one stubbornly insensitive and the other gratifyingly orderly and interesting.” This “discrepancy” was strikingly evident in Catania's (1963) demonstration that the response rate of pigeons on a single-key VI 2-min schedule was virtually insensitive to the magnitude of the reinforcer (feeder duration), whereas the relative response rate of those same pigeons under a choice procedure (i.e., a concurrent VI 2-min VI 2-min schedule) was highly sensitive to the magnitude of the reinforcer.
REFERENCES
- Baum W.M. On two types of deviation from the matching law: Bias and undermatching. Journal of the Experimental Analysis of Behavior. 1974;22:231–242. doi: 10.1901/jeab.1974.22-231. [DOI] [PMC free article] [PubMed] [Google Scholar]
- Baum W.M. Performances on ratio and interval schedules of reinforcement: Data and theory. Journal of the Experimental Analysis of Behavior. 1993;59:245–264. doi: 10.1901/jeab.1993.59-245. [DOI] [PMC free article] [PubMed] [Google Scholar]
- Belke T.W, Heyman G.M. Increasing and signaling background reinforcement: Effect on the foreground response-reinforcer relation. Journal of the Experimental Analysis of Behavior. 1994;61:65–81. doi: 10.1901/jeab.1994.61-65. [DOI] [PMC free article] [PubMed] [Google Scholar]
- Bradshaw C.M, Ruddle H.V, Szabadi E. Relationship between response rate and reinforcement frequency in variable-interval schedules: II. Effect of the volume of sucrose reinforcement. Journal of the Experimental Analysis of Behavior. 1981a;35:263–270. doi: 10.1901/jeab.1981.35-263. [DOI] [PMC free article] [PubMed] [Google Scholar]
- Bradshaw C.M, Ruddle H.V, Szabadi E. Relationship between response rate and reinforcement frequency in variable-interval schedules: III. The effect of d-amphetamine. Journal of the Experimental Analysis of Behavior. 1981b;36:29–39. doi: 10.1901/jeab.1981.36-29. [DOI] [PMC free article] [PubMed] [Google Scholar]
- Bradshaw C.M, Szabadi E, Bevan P. Relationship between response rate and reinforcement frequency in variable-interval schedules: The effect of concentration of sucrose reinforcement. Journal of the Experimental Analysis of Behavior. 1978;29:447–452. doi: 10.1901/jeab.1978.29-447. [DOI] [PMC free article] [PubMed] [Google Scholar]
- Catania A.C. Concurrent performances: A baseline for the study of reinforcement magnitude. Journal of the Experimental Analysis of Behavior. 1963;6:299–300. doi: 10.1901/jeab.1963.6-299. [DOI] [PMC free article] [PubMed] [Google Scholar]
- Catania A.C, Reynolds G.S. A quantitative analysis of the responding maintained by interval schedules of reinforcement. Journal of the Experimental Analysis of Behavior. 1968;11:327–383. doi: 10.1901/jeab.1968.11-s327. [DOI] [PMC free article] [PubMed] [Google Scholar]
- Dallery J, McDowell J.J, Lancaster J.S. Falsification of matching theory's account of single-alternative responding: Herrnstein's k varies with sucrose concentration. Journal of the Experimental Analysis of Behavior. 2000;73:23–43. doi: 10.1901/jeab.2000.73-23. [DOI] [PMC free article] [PubMed] [Google Scholar]
- de Villiers P.A, Herrnstein R.J. Toward a law of response strength. Psychological Bulletin. 1976;83:1131–1153. [Google Scholar]
- Dougan J.D, McSweeny F.K. Variation in Herrnstein's ro as a function of alternative reinforcement rate. Journal of the Experimental Analysis of Behavior. 1985;43:215–223. doi: 10.1901/jeab.1985.43-215. [DOI] [PMC free article] [PubMed] [Google Scholar]
- Herrnstein R.J. On the law of effect. Journal of the Experimental Analysis of Behavior. 1970;13:243–266. doi: 10.1901/jeab.1970.13-243. [DOI] [PMC free article] [PubMed] [Google Scholar]
- Heyman G.M. A parametric evaluation of the hedonic and motoric effects of drugs: Pimozide and amphetamine. Journal of the Experimental Analysis of Behavior. 1983;40:113–122. doi: 10.1901/jeab.1983.40-113. [DOI] [PMC free article] [PubMed] [Google Scholar]
- Heyman G.M, Monaghan M.M. Reinforcer magnitude (sucrose concentration) and the matching law theory of response strength. Journal of the Experimental Analysis of Behavior. 1994;61:505–516. doi: 10.1901/jeab.1994.61-505. [DOI] [PMC free article] [PubMed] [Google Scholar]
- McDowell J.J. Wilkinson's method of estimating the parameters of Herrnstein's hyperbola. Journal of the Experimental Analysis of Behavior. 1981;35:413–414. doi: 10.1901/jeab.1981.35-413. [DOI] [PMC free article] [PubMed] [Google Scholar]
- McDowell J.J, Dallery J. Falsification of matching theory: Changes in the asymptote of Herrnstein's hyperbola as a function of water deprivation. Journal of the Experimental Analysis of Behavior. 1999;72:251–268. doi: 10.1901/jeab.1999.72-251. [DOI] [PMC free article] [PubMed] [Google Scholar]
- Morse W.H. Intermittent reinforcement. In: Honig W.K, editor. Operant behavior: Areas of research and application. New York: Appleton-Century-Crofts; 1966. pp. 52–108. [Google Scholar]
- Petry N.M, Heyman G.M. Effects of qualitatively different reinforcers on the parameters of the response-strength equation. Journal of the Experimental Analysis of Behavior. 1994;61:97–106. doi: 10.1901/jeab.1994.61-97. [DOI] [PMC free article] [PubMed] [Google Scholar]
- Petry N.M, Heyman G.M. Rat toys, reinforcers, and response strength: An examination of the Re parameter in Herrnstein's equation. Behavioural Processes. 1997;39:39–52. doi: 10.1016/s0376-6357(96)00043-5. [DOI] [PubMed] [Google Scholar]
- Shull R.L, Grimes J.A, Bennett J.A. Bouts of responding: The relation between bout rate and the rate of variable-interval reinforcement. Journal of Experimental Analysis of Behavior. 2004;81:65–83. doi: 10.1901/jeab.2004.81-65. [DOI] [PMC free article] [PubMed] [Google Scholar]
- Snyderman M. Body weight and response strength. Behavior Analysis Letters. 1983;3:255–265. [Google Scholar]
- Zeiler M.D. Reversed schedule effects in closed and open economies. Journal of the Experimental Analysis of Behavior. 1999;71:171–186. doi: 10.1901/jeab.1999.71-171. [DOI] [PMC free article] [PubMed] [Google Scholar]


