

Abstract
The evaluation of nitrosamine drug substance-related impurities (NDSRIs) has become a regulatory priority due to potential carcinogenicity. Previously, we evaluated mutagenicity and genotoxicity of NDSRIs using the enhanced Ames Test (EAT) and human TK6 cells. In this study, we investigated the genotoxicity of ten of these NDSRIs using metabolically competent human HepaRG cells. DNA damage and micronucleus (MN) formation were evaluated in both 2D and 3D models using the CometChip and flow-cytometry-based MN assays, respectively. After 24-h exposure, five EAT-positive NDSRIs, N-nitroso-duloxetine, N-nitroso-fluoxetine, N-nitroso-lorcaserin, N-nitroso-nortriptyline, and N-nitroso-varenicline, significantly induced DNA damage in both 2D and 3D models and increased MN and γH2A.X formation in 3D spheroids. Only three EAT-positive NDSRIs, N-nitroso-duloxetine, N-nitroso-fluoxetine, and N-nitroso-nortriptyline, increased MN frequency in 2D cultures. The five EAT-negative NDSRIs, N-nitroso-diclofenac, N-nitroso-folic acid, N-nitroso-paroxetine, N-nitroso-desvaleryl-valsartan, and N-nitroso-desvaleryl-valsartan methyl ester, showed no DNA damage or MN formation in either model. Quantitative comparisons showed that N-nitroso-nortriptyline was the most potent genotoxicant in HepaRG cells. Overall, the ten NDSRIs exhibited the same positive/negative genotoxicity outcomes in both the EAT and 3D HepaRG spheroids. These findings support the use of 3D HepaRG spheroids as an alternative in vitro model for detecting NDSRI-induced genotoxicity and confirming NDSRI responses in the EAT.
Keywords: N-Nitrosamine impurities, Nitrosamine drug substance-related impurities (NDSRIs), HepaRG cells, Genotoxicity, Benchmark concentration
1. Introduction
The detection of unacceptable levels of N-nitrosamine impurities in human drug products has raised safety concerns, leading to drug recalls (Bharate, 2021; Wichitnithad et al., 2023). Due to their mutagenic and carcinogenic potential, N-nitrosamines are classified as a “cohort of concern” under the ICH M7(R2) guideline (ICH, 2023). In response, guidance on N-nitrosamine impurities in pharmaceutical products has been provided by regulatory agencies, including the European Medicines Agency (EMA), the U.S. Food and Drug Administration (FDA), and Health Canada (EMA, 2020; EMA, 2023; FDA, 2023; FDA, 2024; Health-Canada, 2023). The guidance classifies N-nitrosamines into two general categories: small-molecule nitrosamines and nitrosamine drug substance-related impurities (NDSRIs).
Unlike small-molecule nitrosamines, such as N-nitrosodiethylamine (NDEA) and N-nitrosodimethylamine (NDMA), NDSRIs share structural similarity with the active pharmaceutical ingredient (API) with which they are associated. NDSRIs can form through the nitrosation of APIs or fragments of APIs that contain potentially reactive secondary amines. Nitrosation can occur at various stages of a drug’s lifecycle, including during manufacturing and storage, which make their control particularly challenging (Jolly et al., 2024). During the last few years, several drug recalls have been issued due to the presence of API-derived NDSRIs above acceptable levels, e.g., recalls of N-nitroso-varenicline, N-nitroso-propranolol, N-nitroso-orphenadrine, N-nitroso-quinapril, N-nitroso-nortriptyline, and N-nitroso-duloxetine (Nudelman et al., 2023; Vikram et al., 2025).
Due to the absence or limited availability of robust mutagenicity and carcinogenicity data for NDSRIs, it has been difficult to set compound-specific acceptable intake (AI) limits using conventional approaches. Recently, regulatory agencies have adopted the Carcinogenic Potency Categorization Approach (CPCA) to establish AIs for NDSRIs. AIs are based on structural features of the NDSRI: specifically, the number and distribution of α-hydrogens at the N-nitroso center, along with other activating and deactivating structural features that affect the α-hydroxylation metabolic activation pathway (EMA, 2023; FDA, 2023; Kruhlak et al., 2024).
The CPCA is based on the observation that the most potent N-nitrosamines exert their carcinogenic effects via the cytochrome P450 (CYP)-mediated α-hydroxylation pathway and subsequent formation of DNA-reactive species (Li and Hecht, 2022). Accordingly, the CPCA classifies N-nitrosamine impurities into five potency categories, PC1‒PC5, with PC1 and PC5 being the most and least potent, respectively (Kruhlak et al., 2024; Ponting et al., 2025). Among a training set of 81 N-nitrosamines, 66 % were assigned to PC1 (AI limit of 18 ng/day by EMA or 26.5 ng/day by FDA) or PC2 (AI limit of 100 ng/day) and 16 % were categorized into PC4 or PC5 (AI limit of 1500 ng/day) (Kruhlak et al., 2024). The same study also mapped 263 hypothetical NDSRIs generated from drug substances containing secondary amine or dimethyl tertiary amine centers, with 39 % assigned to PC1 or PC2 and 48 % placed in PC4 or PC5. This suggests that NDSRIs often have lower predicted carcinogenic potency compared to the most highly potent carcinogenic small-molecule nitrosamines, likely due to their structural complexity and greater diversity of functional groups. However, regulatory agencies generally recommend conservative AI limits for NDSRIs because of the lack of compound-specific carcinogenicity data and the absence of a suitable surrogate for read-across analysis (Bercu et al., 2024; FDA, 2025).
Because the CPCA approach relies solely on structural features, the CPCA categorization may not fully capture the biological responses of NDSRIs. Given that their carcinogenic potential can be significantly affected by variations in their metabolic activation, DNA reactivity, and detoxification pathways (Li and Hecht, 2022; Reed et al., 2018), in vitro and in vivo studies are desirable for validating predictive approaches and aiding accurate regulatory decision-making for NDSRIs.
Recently, we assessed 17 NDSRIs for mutagenicity using the EAT where eight of the seventeen were identified as mutagenic (Heflich et al., 2024). Our follow-up mammalian-cell study evaluated 15 of the same group of NDSRIs for mutagenicity and genotoxicity using human TK6 cells, with and without hamster liver S9 activation (Li et al., 2024). This study showed that the seven EAT-positive (EAT+) NDSRIs, including N-nitrosodesmethyl-diphenhydramine, N-nitroso-duloxetine, N-nitroso-fluoxetine, N-nitroso-lorcaserin, N-nitroso-nortriptyline, N-nitroso-sertraline, and N-nitroso-varenicline, also tested positive in the thymidine kinase (TK) and hypoxanthine-guanine phosphoribosyltransferase (HPRT) gene mutation assays. Whereas the eight EAT-negative (EAT‒) NDSRIs, including N-nitroso-bumetanide, N-nitroso-ciprofloxacin, N-nitroso-dabigatran etexilate, N-nitrosodiclofenac, N-nitroso-paroxetine, N-nitroso-phenylephrine, N-nitroso-desvaleryl-valsartan, and N-nitroso-desvaleryl-valsartan methyl ester, were non-mutagenic in hamster S9-mediated TK6 cell assays, confirming the consistent mutagenicity profiles across bacterial and in vitro mammalian systems. In addition, the seven EAT+ NDSRIs induced concentration-dependent increases in micronucleus (MN) formation in TK6 cells after hamster S9 bioactivation (Li et al., 2024).
HepaRG cells express an array of Phase I and Phase II metabolic enzymes similar to those found in primary human hepatocytes (PHHs) (Antherieu et al., 2010; Seo et al., 2020). Additionally, 3D spheroid cultures exhibit enhanced metabolic activity that more closely mimics those found in vivo in humans (Seo et al., 2022, 2023a). HepaRG cells, unlike CYP-transduced TK6 cells (Li et al., 2020, 2023, 2024), do not lend themselves to the identification of specific CYP enzymes involved in the bioactivation of N-nitrosamines. They do, however, offer a valuable in vitro system with a near-full-complement of endogenous metabolic activation, making them a human-based model for screening N-nitrosamine-induced genotoxicity and mutagenicity. We previously evaluated the genotoxicity of eight small-molecule nitrosamines, including the mutagenicity of one small-molecule nitrosamine, NDMA, using metabolically competent human HepaRG cells. The results demonstrated that 3D HepaRG spheroids were more sensitive than 2D cultures in detecting the genotoxic and mutagenic potential of small-molecule nitrosamines (Seo et al., 2023b, 2024).
Expanding on our previous investigation, the present study assessed the genotoxicity of ten NDSRIs, including five EAT+ NDSRIs (N-nitroso-duloxetine, N-nitroso-fluoxetine, N-nitroso-lorcaserin, N-nitroso-nortriptyline, and N-nitroso-varenicline) and five EAT‒ NDSRIs (N-nitrosodiclofenac, N-nitroso-folic acid, N-nitroso-paroxetine, N-nitroso-desvaleryl-valsartan, and N-nitroso-desvaleryl-valsartan methyl ester) (Fig. 1). DNA and chromosomal damage induced by these NDSRIs were evaluated in both 2D and 3D HepaRG cell models using the high-throughput CometChip and flow-cytometry-based MN assays, respectively. The MultiFlow DNA damage assay was used to further assess DNA damage responses in 3D HepaRG spheroids. Quantitative comparisons of the responses produced by the NDSRIs in both 2D and 3D HepaRG cell models were conducted using the benchmark concentration (BMC) approach.
Fig. 1. Structures of ten nitrosamine drug substance-related impurities (NDSRIs) tested in the study.
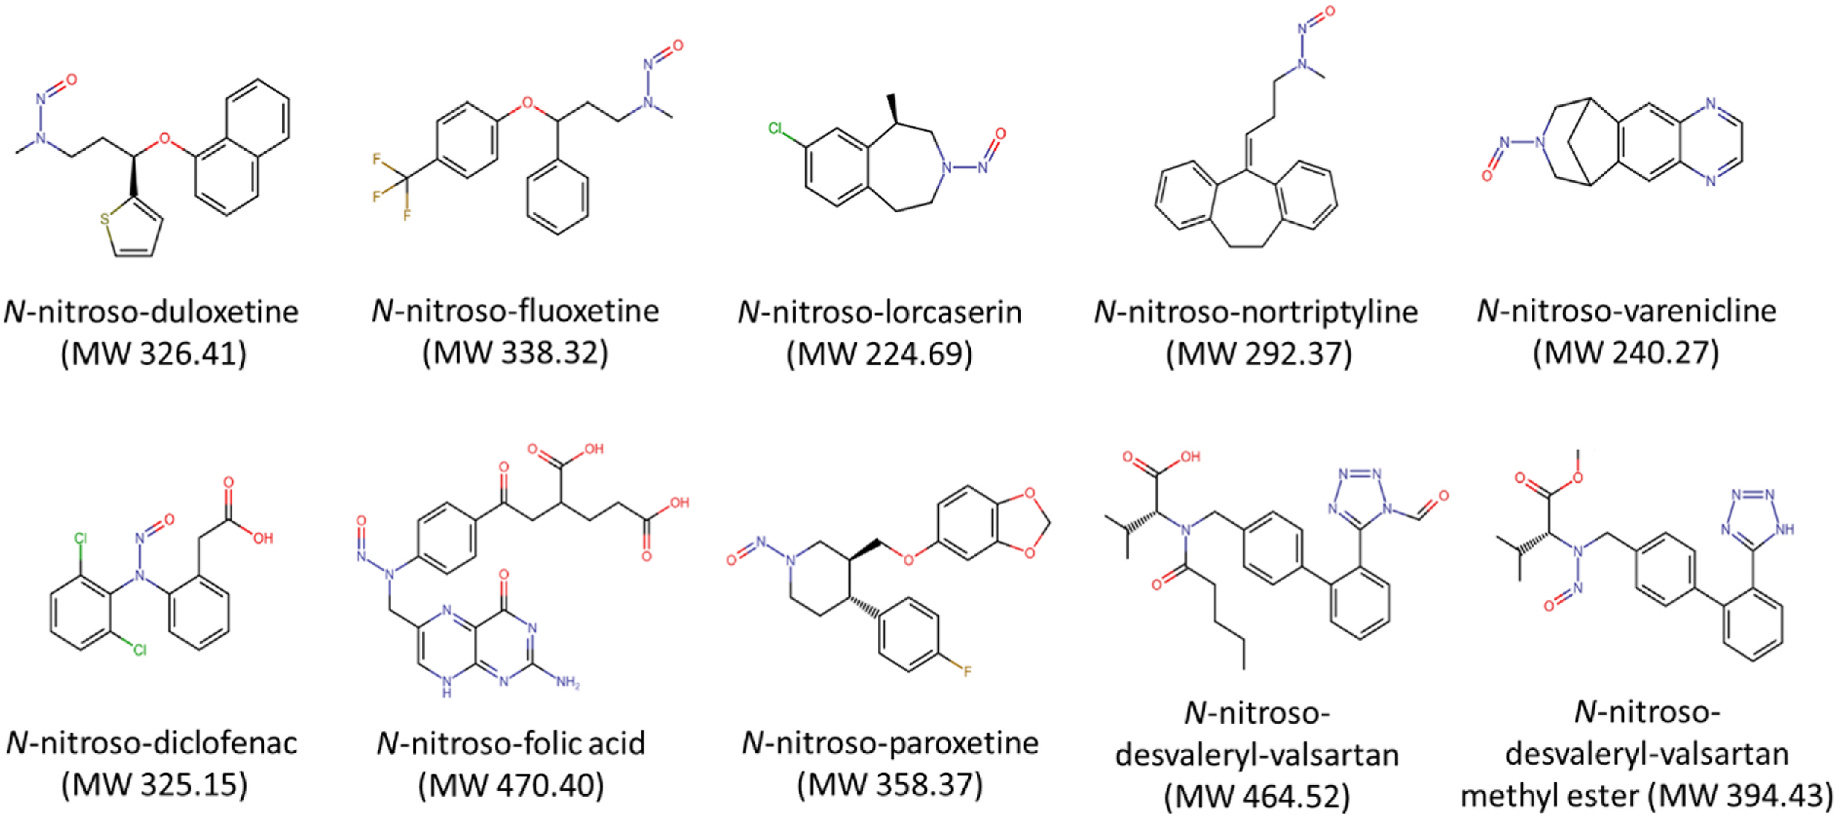
MW, molecular weight.
2. Materials and methods
2.1. Chemicals
N-Nitroso-diclofenac (CAS# 66505–80-4), N-nitroso-duloxetine (CAS# 2680527–91-5), N-nitroso-fluoxetine (CAS# 150494–06-7), N-nitroso-folic acid (CAS# 26360–21-4), N-nitroso-lorcaserin (CAS# 2518136–84-8), N-nitroso-nortriptyline (CAS# 55855–42-0), N-nitroso-paroxetine (CAS# 2361294–43-9), and N-nitroso-varenicline (CAS# 2755871–02-2) were obtained from Clearsynth (Ontario, Canada). N-Nitroso-desvaleryl-valsartan (CAS# 2254485–68-0) and N-nitroso-desvaleryl-valsartan methyl ester (CAS# 2851532–34-6) were purchased from LKT Lab (St. Paul, MN). These ten NDSRIs were the same compounds used in our previous EAT and TK6 cell studies (Heflich et al., 2024; Li et al., 2024). All chemicals were stored as suggested by the supplier. Stock solutions of all NDSRIs were prepared by dissolving them in dimethyl sulfoxide (DMSO) except for N-nitroso folic acid. N-Nitroso-folic acid was dissolved in deionized water because the NDSRI produced weakly positive or equivocal results in the EAT when tested as an aqueous suspension but was negative when DMSO was used as a solvent (Heflich et al., 2024). Although the stock solution exhibited low solubility, N-nitroso-folic acid fully dissolved in the medium over time, with no precipitation observed.
2.2. 2D and 3D HepaRG cultures
Undifferentiated, proliferative HepaRG cells were obtained from Biopredic International (Saint Grégoire, France). The cells were seeded into 100-mm cell-culture dishes (Corning Inc.; Corning, NY) at a density of 1 × 10⁴ cells/cm2 and cultured in Williams’ medium E (Thermo Fisher Scientific; Waltham, MA) supplemented with 10 % HyClone™ FetalClone™ II Serum (Cytiva Life Sciences; Marlborough, MA), 5 μg/mL insulin (Sigma-Aldrich; St Louis, MO), 50 μM hydrocortisone hemisuccinate (Sigma-Aldrich), 2 mM GlutaMax™ (Thermo Fisher Scientific) and 100 μg/mL primocin (InvivoGen; San Diego, CA) for 14 days. HepaRG cells were differentiated in the same growth medium supplemented with 1.7 % DMSO (differentiation medium) for additional 14 days. Fully differentiated HepaRG cells were dissociated using TrypLE™ Express (Thermo Fisher Scientific) and were replated for 2D cultures into 96-well flat-bottomed plates at a density of 5 × 10⁴ cells/well. For 3D spheroid formation, dissociated cells were seeded into 384-well ultra-low attachment (ULA) plates (Corning) at a density of 5 × 10³ cells/well, creating spheroids containing 5000 cells each. The plates were maintained at 37 °C in a humidified atmosphere of 5 % CO2 in air. The differentiation medium was renewed every 2–3 days. For 3D cultures, half of the medium was replaced with fresh medium using VIAFLO 96/384 Electronic Pipettes (INTEGRA Biosciences; Hudson, NH). All experiments were conducted using cells at passages 14–19 and involved no more than 5 additional passages in total.
2.3. Treatments with NDSRIs
Working solutions for the two highest concentrations were prepared by diluting stock solutions in differentiation medium, followed by a serial dilution for other concentrations in Nunc™ 96-Well Polypropylene 1-mL DeepWell™ plates. For 3D cultures, approximately 7–8 HepaRG spheroids were transferred from 384-well ULA plates into each well of 96-well round-bottom plates (TPP; Switzerland) one day prior to the treatment. Both 2D HepaRG cells at Day 3 and 3D spheroids at Day 10 were exposed to various concentrations of the ten NDSRIs in 100 μL of treatment medium for 24 h at 37 °C in a humidified atmosphere with 5 % CO2. The experiments were repeated independently at least three times.
2.4. Cell viability assay
The ATP assay was conducted to assess the cytotoxicity induced by NDSRIs. Cellular ATP levels were measured using the CellTiter-Glo Luminescent Cell Viability Assay kit (Promega; Madison, WI) for 2D cells and the CellTiter-Glo 3D Cell Viability Assay kit (Promega) for 3D spheroids. The treatment medium was replaced with 100 μL of ATP dilutions in phosphate-buffered saline (PBS) at a ratio of 1:10, and the plate incubated in the dark for 10 min at room temperature. The ATP-dependent luminescence signal was measured using a Cytation 5 Cell Imaging Multi-Mode Reader (BioTek; Winooski, VT). Relative viability was determined as the percent intensity of treated cells compared to that of vehicle controls.
2.5. CometChip fabrication
Molten 1 % OmniPur Agarose (Sigma-Aldrich) in PBS was poured onto the hydrophilic side of GelBond® film (Lonza; Walkersville, MD) placed on the lid of a rectangular plate. A polydimethylsiloxane (PDMS) stamp (7.5 cm wide × 11.5 cm long × 5 mm thick) with an array of circular micropillars (35 μm in diameter, 50 μm high, with 240 μm space between the pillars) was immediately overlayed on top of the molten agarose and held at room temperature for 15 min. After adding PBS around the edges, the stamp was gently lifted off, leaving an array of micropores in the agarose gel. The gel on the GelBond® film was transferred onto a 96-well glass plate and then placed into the 96-Well CometChip® System to form the 96-well configuration.
2.6. Alkaline CometChip assay
Following a 24-h treatment, 2D HepaRG cells and 3D spheroids were dissociated into single-cell suspensions using TrypLE Express. The single cells were then transferred into the wells of a 96-well CometChip® System, where they were loaded into the micropores by gravity for 50 min at 37 °C. The CometChip was then gently rinsed with PBS and covered with a layer of 1 % low-melting-point agarose in PBS. After sitting for 3 min at room temperature and 10 min at 4 °C for complete solidification, the CometChip was submerged in lysis solution (R&D Systems; Minneapolis, MN) for 1 h at 4 °C and incubated in alkaline buffer (0.2 M NaOH, 1 mM EDTA, 0.1 % Triton X-100, pH > 13) for 40 min at 4 °C to unwind the DNA. Electrophoresis then was performed in the alkaline buffer at 22 V and 300 mA for 50 min at 4 °C, followed by submersion of the CometChip in neutralization buffer (0.4 M Trizma® HCl at pH 7.4), equilibration buffer (2 mM Trizma® HCl at pH 7.4), and overnight staining with 0.2X SYBR Gold (Invitrogen; Carlsbad, CA) in equilibration buffer at 4 °C. After incubating the CometChip in fresh equilibration buffer for 1 h at room temperature, images of the comets were automatically captured using a Cytation 5 Cell Imaging Multi-Mode Reader (BioTek) and analyzed using CometAssay Analysis Software (R&D Systems) to quantify the percentage of DNA in the comet tail (% tail DNA).
2.7. In vitro micronucleus (MN) assay
Following 24-h of treatment, the treatment medium in the 96-well round-bottom plate was carefully replaced with 200 μL of fresh differentiation medium supplemented with 100 ng/mL recombinant human epidermal growth factor (hEGF). Cell division was stimulated by incubating 2D HepaRG cells for an additional 3 days and 3D spheroids were incubated for 6 days, at which time the cultures had undergone 1.5- to 2-fold increases in cell population (Guo et al., 2020; Seo et al., 2023a). Flow-cytometry-based MN analysis was performed using the In Vitro MicroFlow kit (Litron Laboratories; Rochester, NY). Briefly, 2D cells and 3D spheroids were stained with 50 μL of ethidium monoazide under visible light for 30 min on ice. After aspirating the solution, 100 μL of Complete Lysis Solution 1 containing SYTOX Green was added to each well to label the chromatin. The plate was then incubated on an orbital shaker for 1 h in the dark at 37 °C, with mixing by pipetting midway through the incubation to lyse both 2D cells and 3D spheroids. Subsequently, 100 μL of Complete Lysis Solution 2 containing SYTOX Green was added. MN events were scored using a FACSCanto II flow cytometer equipped with a high-throughput sampler (HTS, BD Biosciences; San Jose, CA), with the stopping gate set at 10,000 intact nuclei or 2.5 min. The MN frequency (%MN) was calculated as the ratio of MN events to the total number of nucleated events. Relative survival (% of control) was determined by comparing the ratio of intact nucleated events in treated cells to those in vehicle controls at the specified time point during MN measurement. Additionally, an ATP assay was performed on one hEGF-stimulated 3D spheroid per well to further assess the cytotoxicity in spheroids.
2.8. MultiFlow DNA damage assay
DNA damage was evaluated using the MultiFlow DNA Damage Kit – P53, γH2A.X, Phospho-Histone H3 kit (Litron Laboratories). Briefly, 7–8 3D spheroids were exposed to the test substance for 24 h in 200 μL of treatment medium followed by an incubation for 5 days in fresh differentiation medium containing 100 ng/mL hEGF, or for 72 h in 200 μL of treatment medium with 100 ng/mL hEGF. Spheroids were then dissociated to single cells using Accutase solution (Thermo Fisher Scientific), with mixing by pipetting. The cells were labelled with anti-γH2A.X-Alexa Fluor 647, anti-phospho-histone H3-PE, and anti-P53-FITC antibodies to detect DNA double-strand breaks, mitotic cells, and genotoxic stress, respectively. After a 1-h incubation at room temperature, flow cytometric analysis was performed using a FACSCanto II flow cytometer equipped with a HTS. Flow cytometric gating and data analysis were conducted according to the manufacturer’s instructions. γH2A.X and nuclear P53 responses were based on median fluorescence intensities and expressed as fold-changes relative to the vehicle control.
2.9. Quantitative analysis
Genotoxic responses for NDSRIs testing positive were quantified by benchmark concentration (BMC) analysis using the Netherlands National Institute for Public Health and the Environment (RIVM) PROAST web-based software (version 70.1); ‘compound’ was used as a covariate for the analyses. BMC50 values, representing a 50 % increase in DNA damage, chromosomal damage, or γH2A.X responses over background (vehicle controls), and the lower (BMCL) and upper (BMCU) bounds of their 90 % confidence intervals (CIs) were calculated using exponential and Hill models. The lowest BMCL and highest BMCU from the fitted models were used for comparing the relative genotoxic responses of NDSRIs, with responses considered significantly different from each other if their BMCU and BMCL intervals did not overlap.
2.10. Statistical analysis
Data are presented as the mean ± standard deviation (SD) from at least three independent experiments. Statistical analyses were conducted using SigmaPlot 13.0 (Systat Software; San Jose, CA). One-way analysis of variance (ANOVA) followed by Dunnett’s post hoc test was used to identify significant increases, with the lowest effective concentrations (LECs) determined for treatment groups compared to the vehicle control. A p-value of <0.05 was considered statistically significant.
3. Results
3.1. NDSRI-induced cytotoxicity and DNA damage in 2D and 3D HepaRG cell models
DNA damage was measured after a 24-h exposure to ten NDSRIs in 2D and 3D HepaRG cell models using the high-throughput CometChip assay. The maximum treatment concentrations were set to ensure a relative cell viability of at least 70 %, as determined by the ATP assay (Fig. 2). All five EAT+ NDSRIs and two EAT− NDSRIs (N-nitroso-diclofenac and N-nitroso-paroxetine) had lower maximum concentrations in 3D than in 2D HepaRG cells, with N-nitroso-nortriptyline having much lower maximum concentrations in 3D (25 μM) compared to 2D (200 μM) (Table 1A). The other three EAT‒ NDSRIs had the same maximum concentrations in CometChip assays conducted in 2D and 3D HepaRG cultures.
Fig. 2. NDSRI-induced DNA damage and cytotoxicity in 2D and 3D HepaRG cells.

2D and 3D HepaRG cultures were exposed to five EAT+ (enhanced Ames test-positive) NDSRIs (A) and five EAT− (EAT-negative) NDSRIs (B) for 24 h. DNA damage was detected using the CometChip assay. The red line indicates relative viability (% of control; right y-axis), and the black bars indicate the percentage of tail DNA (left y-axis). The data are presented as the mean ± SD (n ≥ 3). Significant difference was determined by one-way ANOVA followed by Dunnett’s test (*p < 0.05, **p < 0.01, and ***p < 0.001 vs. vehicle control). (For interpretation of the references to color in this figure legend, the reader is referred to the Web version of this article.)
Table 1.
Comparison of cytotoxicity and genotoxicity induced by nitrosamine drug substance-related impurities (NDSRIs) between 2D and 3D HepaRG cultures after a 24-h exposure.
| A. CometChip assay | |||||||||||
|---|---|---|---|---|---|---|---|---|---|---|---|
|
| |||||||||||
| NDSRIs | Max Conc. (μM)a |
ATP (%)b |
LECc |
Fold increased |
Outcomee |
||||||
| 2lD | 3D | 2D | 3D | 2D | 3D | 2D | 3D | 2D | 3D | ||
|
| |||||||||||
| EAT+ | N-nitroso-duloxetine | 250 | 100 | 78.3 | 74.3 | 25 | 3.1 | 13.5 | 18.0 | +++ | +++ |
| N-nitroso-fluoxetine | 80 | 50 | 71.2 | 80.7 | 10 | 2.5 | 13.3 | 17.2 | +++ | +++ | |
| N-nitroso-lorcaserin | 400 | 200 | 75.6 | 75.8 | 100 | 100 | 3.5 | 6.7 | + | ++ | |
| N-nitroso-nortriptyline | 200 | 25 | 79.6 | 72.6 | 6.3 | 1.6 | 16.2 | 16.8 | +++ | +++ | |
| N-nitroso-varenicline | 800 | 400 | 88.8 | 74.2 | 200 | 200 | 3.3 | 5.0 | + | ++ | |
|
|
|
|
|
|
|
|
|
|
|
|
|
| EAT− | N-nitroso-diclofenac | 2000 | 1000 | 77.7 | 75.7 | − | − | 1.4 | 1.6 | − | − |
| N-nitroso-folic acid | 4000 | 4000 | 90.1 | 87.0 | − | − | 0.9 | 1.3 | − | − | |
| N-nitroso-paroxetine | 200 | 100 | 72.4 | 73.4 | − | − | 0.9 | 0.7 | − | − | |
| N-nitroso-desvaleryl-valsartan | 2000 | 2000 | 72.0 | 77.5 | − | − | 1.0 | 1.1 | − | − | |
| N-nitroso-desvaleryl-valsartan methyl ester | 200 | 200 | 70.7 | 76.5 | − | − | 1.1 | 1.2 | − | − | |
|
| |||||||||||
| B. Micronucleus (MN) assay | |||||||||||
|
| |||||||||||
| NDSRIs | Max Conc. (μM)a |
RS (%) [%ATP]b |
LECc |
Fold |
increased |
Outcomee |
|||||
| 2D | 3D | 2D | 3D | 2D | 3D | 2D | 3D | 2D | 3D | ||
|
| |||||||||||
| EAT+ | N-nitroso-duloxetine | 200 | 20 | 43.9 | 44.6 [42.5] | 25 | 7.5 | 3.3 | 3.0 | + | + |
| N-nitroso-fluoxetine | 100 | 50 | 54.1 | 43.6 [43.1] | 80 | 25 | 2.0 | 3.1 | + | + | |
| N-nitroso-lorcaserin | 500 | 250 | 74.8 | 58.5 [46.2] | − | 125 | 1.2 | 1.8 | − | + | |
| N-nitroso-nortriptyline | 200 | 20 | 43.8 | 44.8 [41.5] | 12.5 | 7.5 | 3.5 | 3.1 | + | + | |
| N-nitroso-varenicline | 1000 | 1000 | 86.1 | 58.7 [51.1] | − | 1000 | 1.5 | 1.7 | − | + | |
|
|
|
|
|
|
|
|
|
|
|
|
|
| EAT− | N-nitroso-diclofenac | 2000 | 2000 | 49.5 | 69.7 [55.1] | − | − | 0.9 | 1.2 | − | − |
| N-nitroso-folic acid | 4000 | 4000 | 98.0 | 105.8 [106.6] | − | − | 1.2 | 1.0 | − | − | |
| N-nitroso-paroxetine | 200 | 200 | 79.3 | 89.9 [74.1] | − | − | 1.2 | 1.2 | − | − | |
| N-nitroso-desvaleryl-valsartan | 3000 | 3000 | 85.4 | 95.3 [88.2] | − | − | 1.2 | 1.4 | − | − | |
| N-nitroso-desvaleryl-valsartan methyl ester | 200 | 200 | 75.0 | 77.7 [75.4] | − | − | 1.5 | 1.1 | − | − | |
EAT, enhanced Ames test.
The highest concentration tested in the CometChip and MN assays.
%ATP and RS (relative survival, %) are used as indicators for cytotoxicity, relative to the vehicle control.
LEC, the lowest effective concentration, determined by one-way ANOVA followed by Dunnett’s test, is the lowest concentration that induced a significant response in the assay.
The fold increase of chemical-induced DNA damage or MN formation over the vehicle control at the maximum concentration shown in the table.
−, The ratio <1.5 -fold or p≥0.05 vs. vehicle control; +, 1.5 ≤ ratio <5; ++, 5 ≤ ratio <10; and +++, ratio >10 (and p <0.05).
Under the test conditions, all five EAT+ NDSRIs induced significant levels of DNA damage in both 2D and 3D HepaRG cells, whereas five EAT‒ NDSRIs did not induce statistically significant levels of DNA damage in either 2D HepaRG cells or 3D spheroids (Fig. 2 and Table 1A). The maximum fold-changes for N-nitroso-lorcaserin and N-nitroso-varenicline were 3.3–3.5 times in 2D and 5.0–6.7 times in 3D HepaRG spheroids. For N-nitroso-duloxetine, N-nitroso-fluoxetine, and N-nitroso-nortriptyline, the maximum fold-changes were 13.3–16.2 times in 2D and 16.8–18.0 times in 3D HepaRG spheroids. Overall, the five EAT+ NDSRIs showed stronger DNA damage responses in 3D spheroids compared to 2D HepaRG cells.
3.2. NDSRI-induced MN formation and cytotoxicity in 2D and 3D HepaRG cell models
MN formation was measured after a 24-h treatment followed by an additional incubation with hEGF to stimulate cell proliferation. Maximum treatment concentrations were set to ensure ≥40 % relative survival (RS); relative cell viability was measured by the ATP assay (Fig. 3 and Supplementary Fig. 1). Three EAT+ NDSRIs, N-nitroso-duloxetine, N-nitroso-fluoxetine, and N-nitroso-nortriptyline, produced positive MN formation in both 2D and 3D HepaRG cell models, with % MN increases of 2.0–3.3-fold over the vehicle control (Table 1B). The other two EAT+ NDSRIs, N-nitroso-lorcaserin and N-nitroso-varenicline, showed a significant increase in %MN in 3D spheroids (1.8- and 1.7-fold, respectively), but not in 2D cultures. Additionally, all the five EAT+ NDSRIs exhibited greater cytotoxicity in 3D spheroids compared to 2D cells, as evidenced by significantly lower maximum concentrations and LECs observed in 3D HepaRG spheroids compared to 2D cells.
Fig. 3. NDSRI-induced MN formation and relative survival in 2D and 3D HepaRG cells.
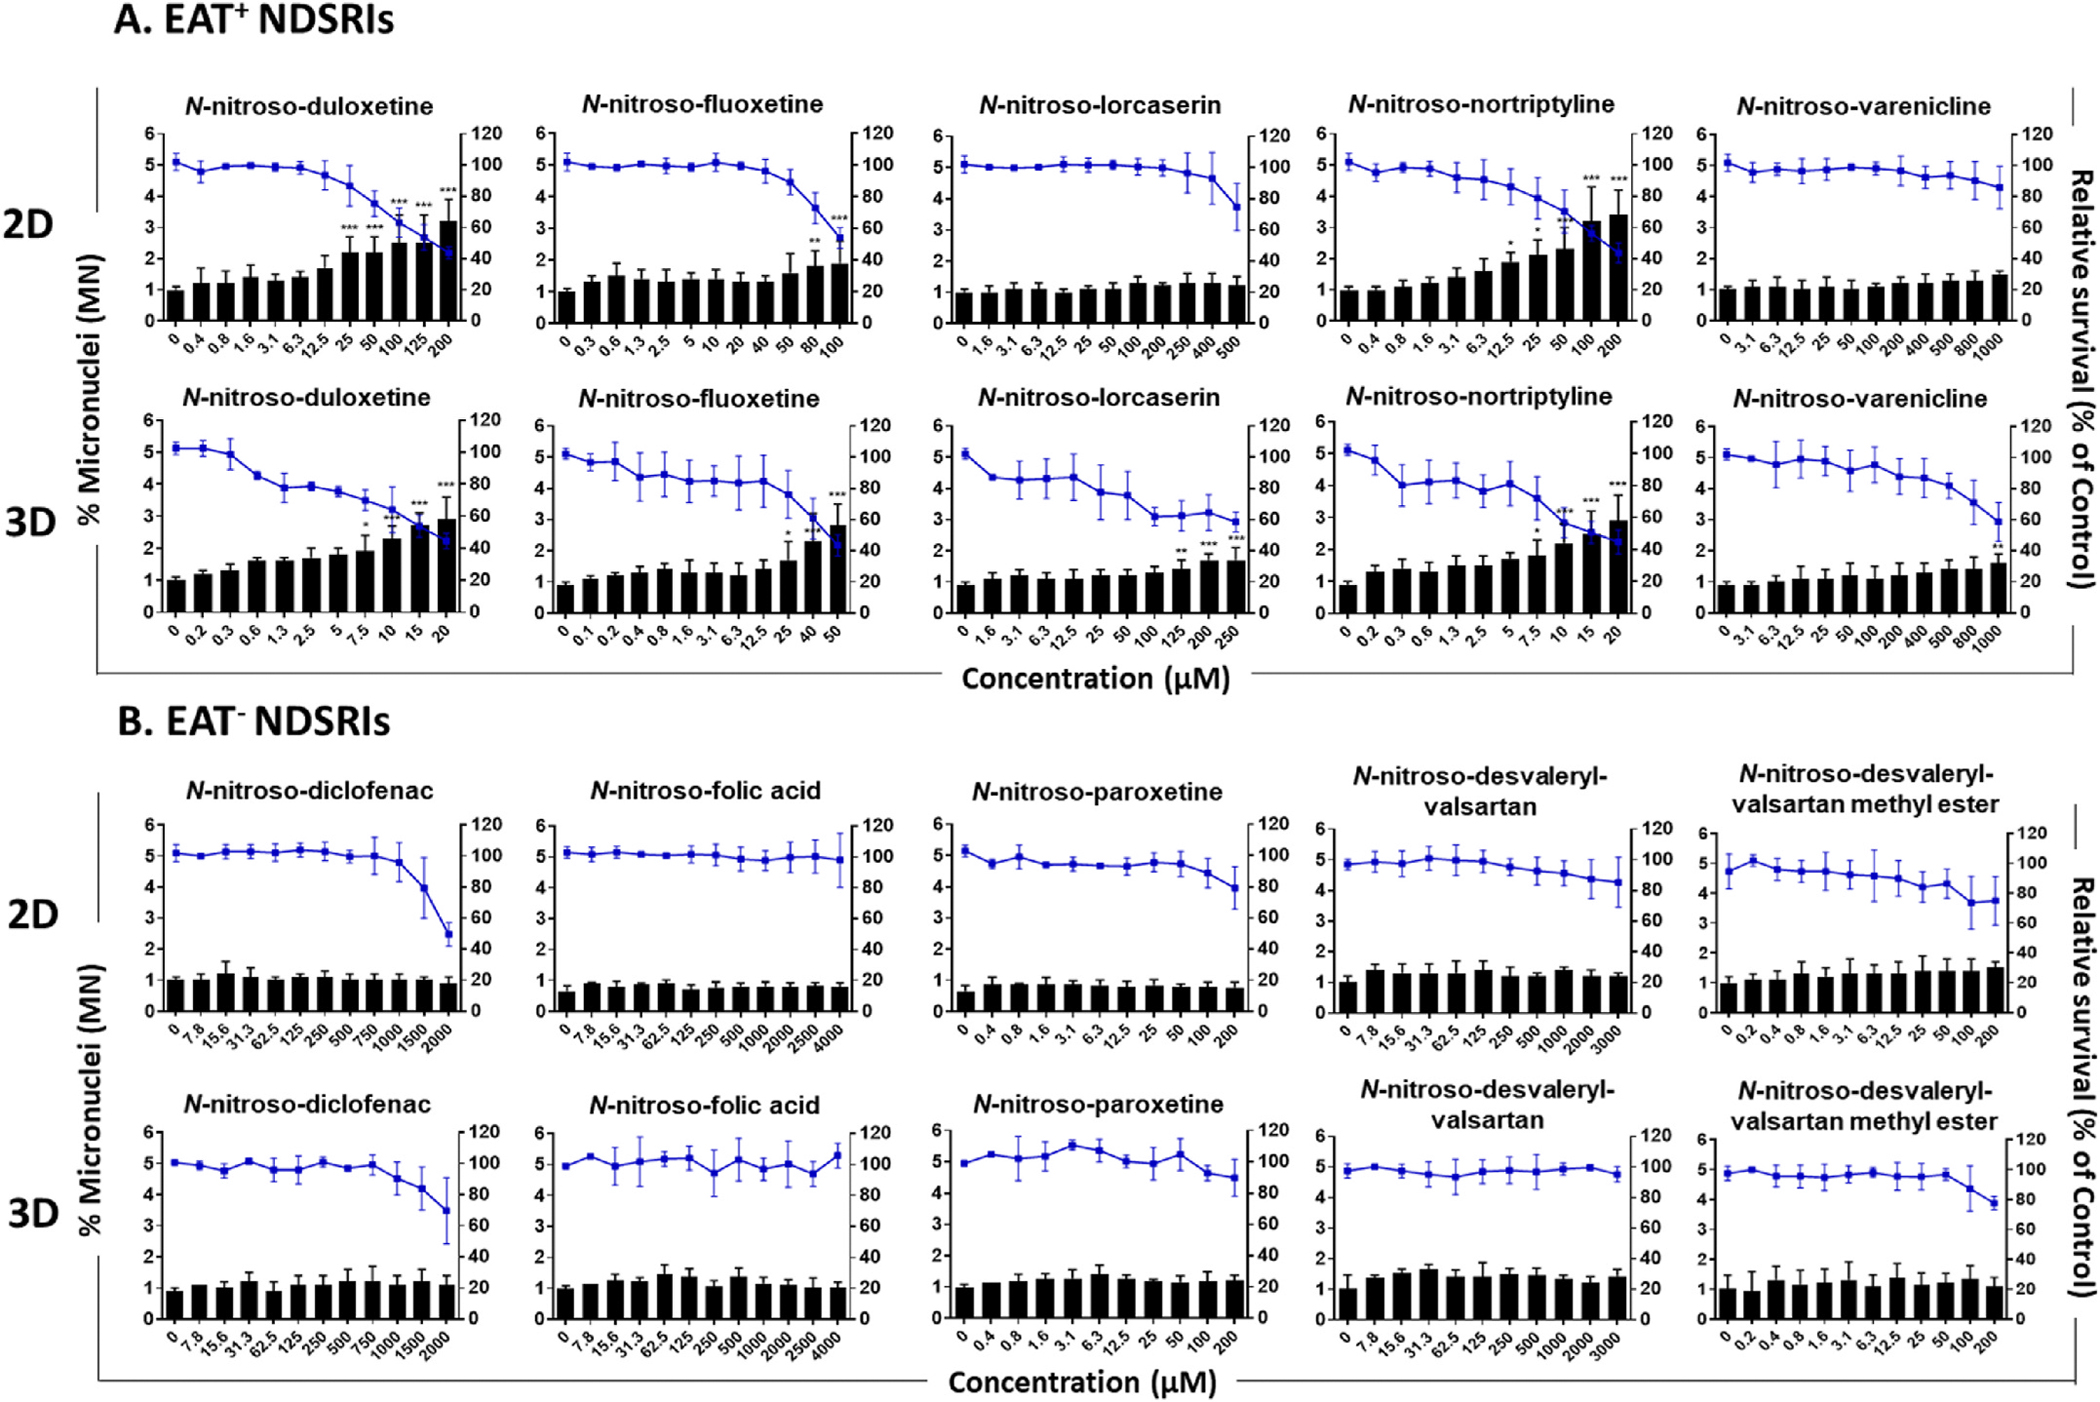
2D and 3D HepaRG cultures were exposed to five EAT+ (enhanced Ames test-positive) NDSRIs (A) and five EAT− (EAT-negative) NDSRIs (B) for 24 h, followed by an additional 3- or 6-day incubation with hEGF (100 ng/mL). MN formation was determined by the high-throughput MN assay using flow cytometry. The blue line indicates relative survival (% of control; right y-axis), and the black bars indicate the percentage of micronuclei relative to intact nuclei (left y-axis). The data are presented as the mean ± SD (n ≥ 3). Significant difference was determined by one-way ANOVA followed by Dunnett’s test (*p < 0.05, **p < 0.01, and ***p < 0.001 vs. vehicle control). (For interpretation of the references to color in this figure legend, the reader is referred to the Web version of this article.)
In contrast, the five EAT− NDSRIs had the same maximum concentrations in 2D and 3D HepaRG cells and none produced positive responses for MN formation in either of the cell models (Table 1B). Overall, 3D spheroids showed higher sensitivity in detecting MN formation by these NDSRIs.
3.3. NDSRI-induced γH2A.X and nuclear P53 activation in 3D HepaRG spheroids
γH2A.X formation and nuclear P53 activation were assessed using the MultiFlow flow-cytometry-based assay in hEGF-stimulated 3D HepaRG spheroids using two different protocols: (1) exposure to NDSRIs with hEGF for 24 h, followed by an additional 5-day culture in fresh differentiation medium with hEGF (referred to hereafter as the 24-h exposure) and (2) continuous exposure to NDSRIs with hEGF for 72 h (referred to as the 72-h exposure) (Fig. 4). The ATP assay was used to determine maximum treatment concentrations, ensuring that measurements were made in cells having at least 40 % relative viability (Supplementary Figs. 1 and 2). All five EAT+ NDSRIs exhibited positive γH2A.X responses in 3D spheroids using both the 24-h and 72-h exposures. At the maximum concentrations tested, N-nitroso-duloxetine, N-nitroso-fluoxetine, and N-nitroso-nortriptyline resulted in 2.1–2.8-fold increases after the 24-h exposure and slightly weaker 1.7–1.8-fold increases after the 72-h exposure (Fig. 4A). In contrast, N-nitroso-lorcaserin and N-nitroso-varenicline produced 1.3–1.4-fold increases in γH2A.X responses after the 24-h exposure and slightly stronger increases after the 72-h exposure.
Fig. 4. NDSRI-induced γH2A.X and nuclear P53 activation in 3D HepaRG spheroids.

3D spheroids were exposed to five EAT+ (enhanced Ames test-positive) NDSRIs (A) and five EAT− (EAT-negative) NDSRIs (B) for 24 h with human epidermal growth factor (hEGF, 100 ng/mL), followed by an additional 5-day incubation with hEGF or for 72 h with hEGF. γH2A.X shift (red circles and lines) and nuclear P53 shift (black squares and lines) were determined by the in vitro MultiFlow DNA damage assay. The data are presented as the mean ± SD (n ≥ 3). Significant difference was determined by one-way ANOVA followed by Dunnett’s test (*p < 0.05, **p < 0.01, and ***p < 0.001 vs. vehicle control). (For interpretation of the references to color in this figure legend, the reader is referred to the Web version of this article.)
None of the five EAT‒ NDSRIs increased γH2A.X expression after the 24-h exposure. However, two EAT− NDSRIs, N-nitroso-folic acid and N-nitroso-desvaleryl-valsartan methyl ester, increased γH2A.X responses by 1.3–1.4-fold after the 72-h exposure (Fig. 4B).
Three EAT+ NDSRIs, N-nitroso-duloxetine, N-nitroso-fluoxetine, and N-nitroso-nortriptyline, were positive for nuclear P53 activation after the 24-h exposure (Fig. 4). None of these NDSRIs showed positive responses following the 72-h exposure.
3.4. Relative genotoxicity of NDSRIs in HepaRG cells
The relative genotoxicity of NDSRIs were compared using BMC50 values derived from positive response data on DNA damage, MN formation, and γH2A.X responses in 2D and/or 3D HepaRG cell models (Supplementary Table 1). The lowest BMCL and highest BMCU from the fitted models, along with the averaged BMC estimates were used for quantitative comparisons between 2D and 3D HepaRG cell models (Fig. 5). In 3D spheroids, the genotoxic potency of the five EAT+ NDSRIs followed the same rank order for inducing DNA strand breakage, MN, and γH2A.X formation. N-Nitroso-nortriptyline consistently exhibited the lowest BMC50 estimates across the three genotoxicity endpoints, followed by N-nitroso-duloxetine, N-nitroso-fluoxetine, N-nitroso-lorcaserin, and N-nitroso-varenicline (Fig. 5). Notably, the BMC50 values for N-nitroso-lorcaserin, and N-nitroso-varenicline were one to two orders of magnitude higher than those for N-nitroso-nortriptyline (Supplementary Table 1).
Fig. 5. Comparison of benchmark concentration (BMC) values of EATþ (enhanced Ames test-positive) NDSRIs with their 90 % confidence intervals (CIs).

BMC50 values and their CIs were calculated using CometChip data (A) and MN data (B) in 2D and 3D HepaRG cells, and γH2A.X responses in 3D spheroids (C) using PROAST software. The bars represent the CIs of BMC50 estimates. (A and B), Black, 2D HepaRG cells; Red, 3D HepaRG spheroids. (C), Black, 24-h exposure with human epidermal growth factor (hEGF, 100 ng/mL), followed by an additional 5-day culture in fresh differentiation medium with hEGF; Red, continuous 72-h exposure with hEGF. (For interpretation of the references to color in this figure legend, the reader is referred to the Web version of this article.)
In 2D cells, N-nitroso-nortriptyline also had the lowest BMC50 estimate for inducing DNA damage and MN formation. N-Nitroso-fluoxetine and N-nitroso-duloxetine ranked 2nd and 3rd for DNA damage potency and MN induction. N-Nitroso-lorcaserin and N-nitroso-varenicline, which failed to induce MN formation in 2D cells, had the weakest DNA damage potencies (Fig. 5A and B, Supplementary Table 1).
When the genotoxic potency was compared between 2D and 3D cell models, three NDSRIs, N-nitroso-duloxetine, N-nitroso-lorcaserin, and N-nitroso-nortriptyline, produced significantly lower BMC50 CIs in the CometChip assay in 3D spheroids compared to 2D cells (Fig. 5A). For the three NDSRIs that produced positive %MN responses in both 2D and 3D cell models, the BMC50 estimate for N-nitroso-fluoxetine in 3D cultures was significantly lower than the estimate observed in 2D cultures, while the BMC50 CIs overlapped each other for N-nitroso-duloxetine and N-nitroso-nortriptyline (Fig. 5B).
3.5. In vitro mutagenicity and genotoxicity evaluation of ten NDSRIs
Genotoxicity data derived in this study from both 2D and 3D HepaRG cell models were further compared with the mutagenicity and MN results derived from our previous studies conducted in various bacterial strains (the EAT) and human lymphoblastoid TK6 cells (Heflich et al., 2024; Li et al., 2024). The ten NDSRIs showed the same positive or negative calls for the EAT, 2D and 3D HepaRG CometChip assay, and 3D HepaRG MN and γH2A.X assays (Table 2). Although data for N-nitroso-folic acid in TK6 cells were unavailable, both the five EAT+ and the other four EAT‒ NDSRIs produced consistent positive and negative results in the TK and HPRT gene mutation assays conducted in TK6 cells (both using hamster S9 activation and in CYP-expressing TK6 cells) (Li et al., 2024). All five EAT+ NDSRIs significantly increased %MN in the hamster-S9-mediated MN assay conducted in TK6 cells, while the four EAT− NDSRIs had negative responses.
Table 2.
Mutagenicity and genotoxicity evaluation of ten nitrosamine drug substance-related impurities (NDSRIs).
| NDSRIs | Mutation |
MN |
Comet |
γH2A.X |
|||||
|---|---|---|---|---|---|---|---|---|---|
| Enhanced Amesa | TK/HPRT b | TK6 no S9b | TK6 + 2 % hamster S9b | 2D HepaRG | 3D HepaRG | 2D HepaRG | 3D HepaRG | 3D HepaRG | |
|
| |||||||||
| N-nitroso-duloxetine | + | + | + | + | + | + | + | + | + |
| N-nitroso-fluoxetine | + | + | + | + | + | + | + | + | + |
| N-nitroso-lorcaserin | + | + | − | + | − | + | + | + | + |
| N-nitroso-nortriptyline | + | + | + | + | + | + | + | + | + |
| N-nitroso-varenicline | + | + | − | + | − | + | + | + | + |
| N-nitroso-diclofenac | − | − | + | − | − | − | − | − | − |
| N-nitroso-folic acid | − | N/A | N/A | N/A | − | − | − | − | −c |
| N-nitroso-paroxetine | − | − | − | − | − | − | − | − | − |
| N-nitroso-desvaleryl-valsartan | − | − | − | − | − | − | − | − | − |
| N-nitroso-desvaleryl-valsartan methyl ester | − | − | + | − | − | − | − | − | −c |
The Ames responses were obtained from Heflich et al. (2024).
The responses in TK6 cells were obtained from Li et al. (2024).
Positive/equivocal when 3D spheroids were exposed to NDSRIs with hEGF for 72 h (Fig. 4).
4. Discussion
Regulatory agencies recommend the EAT to evaluate the mutagenic risks of N-nitrosamines (FDA, 2023; Health-Canada, 2023). Besides a negative finding in the EAT, the FDA currently recommends additional data to support increasing a CPCA-derived AI limit to 1500 ng/day including a second in vitro mammalian cell mutation assay and in vitro metabolism data (including using human hepatocytes or microsomes) (FDA, 2025).
HepaRG cells are human-derived and possess an endogenous metabolic activation system (Cerec et al., 2007; Guillouzo et al., 2007). Unlike Ames tests, which rely on an exogenous metabolic activation system, such as rat or hamster liver S9 fractions, for bioactivation, HepaRG cells offer an endogenous system more physiologically relevant to human for both CYP-mediated bioactivation and Phase II enzyme detoxification compared to other tests (Antherieu et al., 2010; Anthérieu et al., 2012). Our group has successfully employed HepaRG cells for genotoxicity assessments of small-molecule nitrosamines using several assays, including the comet assay, MN assay, MultiFlow DNA Damage assay, and the error-corrected next generation sequencing (ecNGS) mutagenesis assay (Seo et al., 2023b, 2024). Thus, HepaRG assays may be useful for further studying the genotoxicity and mutagenicity of nitrosamine drug impurities that have been evaluated in the EAT.
The present study expanded upon our previous work by assessing the genotoxicity of ten NDSRIs in both 2D and 3D HepaRG cell models. One of the most notable findings of the study was that, using a 24-h exposure protocol, both the five EAT+ and five EAT‒ NDSRIs showed identical positive or negative calls across three genotoxicity assays in 3D HepaRG spheroids, i.e., the CometChip assay, MN assay, and γH2A.X assay (Table 2). Additionally, 3D spheroids exhibited greater sensitivity in detecting EAT+ NDSRIs compared to 2D cultures, as evidenced by significantly lower LEC values in the 3D comet and MN assays, along with higher fold increases in responses using 3D versus 2D cultures (Fig. 2, Tables 1A and 1B). The results also indicated that these NDSRIs were more cytotoxic in 3D HepaRG spheroids and may have undergone enhanced biotransformation into genotoxic metabolites compared to 2D HepaRG cells.
Our previous studies using CYP-transduced TK6 cells indicated that N-nitroso-duloxetine, N-nitroso-fluoxetine, and N-nitroso-nortriptyline were bioactivated mainly by CYP2C19 and CYP2B6; that N-nitroso-lorcaserin was bioactivated by CYP2B6 and CYP2A6; and that CYP3A4 appeared to be the most effective CYP for activating N-nitroso-varenicline (Li et al., 2024). In 3D spheroids, mRNA expression levels of four key enzymes (CYP2C19, CYP2B6, CYP2A6, and CYP3A4) responsible for the bioactivation of the five EAT+ NDSRIs were increased by 2.0–8.2-fold; in addition, HepaRG spheroids had 1.2–11.6-fold higher enzymatic activity for CYP2C19, CYP2B6, and CYP3A4 compared to 2D cells (Seo et al., 2022, 2023a, 2023b). Given that both the 2D and 3D cell models have comparable levels of Phase II enzymes, we conclude that the greater sensitivity for NDSRI genotoxicity observed in 3D HepaRG spheroids is due to their enhanced CYP enzyme metabolic capacity.
Overall, the CometChip assay (comet assay) demonstrated greater sensitivity than the MN assay in detecting the genotoxic potential of both small-molecule nitrosamines and NDSRIs in HepaRG cells. This conclusion is based on larger fold-increases and lower LEC and BMC50 values in the comet assay compared to the MN assay (Seo et al., 2023b). The mutagenic and carcinogenic potential of the most potent N-nitrosamines is known to involve CYP-mediated α-hydroxylation, which generates reactive diazonium ions that lead to DNA alkylation and the formation of DNA adducts (Kruhlak et al., 2024; Li and Hecht, 2022). Even though neither the comet nor the MN are mutation assays, the comet assay can directly detect early DNA damage, such as DNA strand breaks and alkali-labile sites, resulting from DNA adducts formed by N-nitrosamines. In contrast, the MN assay requires cell division to detect chromosomal damage in the form of micronuclei. Because differentiated HepaRG cells have a low proliferation rate, additional incubation along with hEGF stimulation has been used to conduct the MN assay in HepaRG cells (Guo et al., 2020; Josse et al., 2012). This additional culture period with fresh medium also may activate DNA repair mechanisms, potentially reducing the relative sensitivity of the MN assay for detecting DNA damage (Andrieux et al., 2007; Josse et al., 2012).
In addition to the CometChip and flow-cytometry-based MN assays, we used the in vitro MultiFlow DNA damage assay to access γH2A.X responses by flow cytometry. The MultiFlow DNA damage assay is commonly performed with TK6 cells following a 4-h and/or 24-h exposure; however, no standardized protocols exist for conducting the assay in 3D HepaRG spheroids. In the present study, we explored the application of the in vitro MultiFlow DNA damage assay in 3D HepaRG spheroids using two different protocols (Fig. 4). The first involved a 24-h exposure followed by an additional 5-day culture in fresh differentiation medium with hEGF, a protocol that replicated the treatment conditions used in the MN assay. This approach was based on observations that the 24-h exposure did not significantly alter γH2A.X levels for detecting genotoxicants or carcinogens in 2D HepaRG cells and that meaningful increases in γH2A.X levels were detected in 3D HepaRG spheroids after a 24-h treatment with small-molecule nitrosamines, followed by an additional 5-day incubation in the presence of hEGF (Guo et al., 2020; Seo et al., 2023b). The second protocol involved continuous exposure to NDSRIs with hEGF for 72 h, a protocol designed as a HepaRG-cell version of the 24-h timepoint used in TK6 cells. The 72-h (rather than 24-h) was chosen to account for the slower proliferation rate of HepaRG cells compared to TK6 cells.
Two EAT+ NDSRIs, N-nitroso-lorcaserin and N-nitroso-varenicline, both feature a bicyclic structure and increased γH2A.X responses, leading to significantly lower BMC50 values after the 72-h treatment compared to 24-h exposure protocol (Fig. 5C). Two EAT‒ NDSRIs, N-nitroso-folic acid and N-nitroso-desvaleryl-valsartan methyl ester, produced marginally but statistically significant increases in γH2A.X levels following the 72-h (but not 24-h) exposure (Fig. 4B). According to the CPCA classification scheme, N-nitroso-folic acid has a lower carcinogenic potency (assigned to PC4) (EMA, 2025; FDA, 2023), and experimentally it was weakly carcinogenic in the neonatal mouse assay (Wogan et al., 1975). N-Nitroso-desvaleryl-valsartan methyl ester was negative for MN induction following a 4-h treatment with S9 in TK6 cells but was weakly positive after a 24-h treatment in the absence of S9 activation (Li et al., 2024). These findings suggest that treatment duration may influence the fold-increase and/or the LEC of NDSRIs.
Among the five EAT+ NDSRIs, N-nitroso-nortriptyline and N-nitroso-lorcaserin have been classified in PC1 (AI limit of 26.5 ng/day), while N-nitroso-varenicline is classified in PC3 (AI limit of 400 ng/day) (Bercu et al., 2024; EMA, 2023; EMA, 2025; FDA, 2025). Recommended AI limits of 100 ng/day have been established for both N-nitroso-duloxetine and N-nitroso-fluoxetine by the FDA by read across using the structurally similar surrogate 4-(methylnitrosamino)-1-(3-pyridyl)-1-(butanone) (NNK). In the present study, N-nitroso-nortriptyline demonstrated the highest genotoxic potency, followed by N-nitroso-duloxetine, N-nitroso-fluoxetine, and N-nitroso-lorcaserin, while N-nitroso-varenicline was the least potent in 3D HepaRG spheroids (Fig. 5 and Supplementary Table 1). Notably, the EMA initially assigned N-nitroso-nortriptyline an AI limit of 8 ng/day based on the published AI for its surrogate, N-methyl-N-nitrosophenylethylamine (NMPEA). However, this limit was recently adjusted to 18 or 26.5 ng/day based on the CPCA approach (Bercu et al., 2024; EMA, 2023; FDA, 2025). The potency ranking in the present study aligned with the CPCA classifications, with NDSRIs showing the lowest BMCs corresponding to PC1, and those with higher BMCs assigned to higher CPCA categories.
NDSRIs have been suggested to have lower mutagenic and carcinogenic potential than small-molecule nitrosamines because of their structural complexity and reduced ability to form reactive diazonium metabolites in vivo (Aishwarya et al., 2025; Bercu et al., 2024; Cheung et al., 2024; Cioc et al., 2023; Kruhlak et al., 2024; Nudelman et al., 2023; Simon et al., 2025). It is worth noting that our current findings provide further evidence that the structural complexity of NDSRIs often contributes to their lack of mutagenic and genotoxic potential, as none of the five EAT− NDSRIs showed any detectable genotoxic response across the evaluated endpoints. In a previous in vivo study of EAT+ NDSRIs, benchmark dose analysis based on liver mutation data for N-nitroso-duloxetine and N-nitroso-fluoxetine showed that their NOEL (no-observed-effect level) and BMDL values were 10- to 100-fold higher than those for NDMA or NDEA, indicating lower mutagenic potency compared to small-molecule nitrosamines (Jolly et al., 2024). In contrast, based on our in vitro genotoxicity results in HepaRG cell models, three NDSRIs, N-nitroso-nortriptyline, N-nitroso-duloxetine, and N-nitroso-fluoxetine, exhibited higher genotoxic potency than NDMA and NDEA. Compared to NDMA, NDEA, and NDBA, these three NDSRIs also exhibited greater cytotoxicity in 3D spheroids, which was consistent with their lower BMC50 values for DNA damage, MN formation, and γH2A.X responses (Supplementary Fig. 3). Due to factors such as low CYP2E1 expression, limited absorption, distribution, metabolism, and excretion (ADME) capacity, and the absence of full physiological complexity in the HepaRG models, the genotoxic/mutagenic potency observed in vitro may somewhat differ from in vivo results. Nonetheless, our findings support the theory that the larger nitrosamines are predicted to be more cytotoxic than smaller nitrosamines due to the larger sized DNA adducts, while smaller DNA adducts generally have higher mutagenic potency than larger DNA adducts (Fine et al., 2023).
The genotoxic and mutagenic potentials of several NDSRIs have been evaluated using computational, in vitro, and in vivo methods (Cheung et al., 2024; Gandhi et al., 2024; Heflich et al., 2024; Jolly et al., 2024; Kruhlak et al., 2024; Li et al., 2023, 2024). Confirming the positive and negative EAT findings of NDSRIs in both in vitro and in vivo studies is important for ensuring robust safety evaluations for these drug impurities. Our results provide new information on the in vitro genotoxicity of ten NDSRIs using metabolically competent human liver cells. The human cell line study demonstrated that 3D HepaRG spheroids were more sensitive for detecting NDSRI-induced genotoxicity compared to 2D HepaRG cells, a result that was likely due to the greater metabolic capacity of the 3D spheroid cultures. The genotoxicity findings in 3D spheroids were consistent with the mutagenicity and genotoxicity results for these ten NDSRIs in our previous EAT and TK6 cell studies. Given the importance of generating in vitro genotoxicity and mutagenicity data in metabolically competent human cell models, further genotoxicity testing for additional small-molecule nitrosamines and NDSRIs, as well as in vitro mutagenicity assessment using ecNGS in HepaRG cells, may provide a more comprehensive quantitative comparison of their genotoxic and mutagenic potential.
Supplementary Material
Appendix A. Supplementary data
Supplementary data to this article can be found online at https://doi.org/10.1016/j.yrtph.2025.105906.
Acknowledgments
H.X. was supported by appointments to the Postgraduate Research Program administered for CDER by the Oak Ridge Institute for Science Education through an interagency agreement between the U.S. Department of Energy and the U.S. FDA. The authors thank Robert Dorsam and Sruthi King for their continuing support and helpful suggestions and thank Drs. Tao Chen and Yuhan Wang for their critical review of this manuscript.
Funding information
This study was supported by a Regulatory Science Research grant from the FDA Center for Drug Evaluation and Research (CDER), Office of New Drugs (SARITA project 4189) and institutional funding from FDA’s National Center for Toxicological Research (project S00904).
Footnotes
Declaration of competing interest
The authors declare that they have no known competing financial interests or personal relationships that could have appeared to influence the work reported in this paper.
CRediT authorship contribution statement
Ji-Eun Seo: Writing – original draft, Visualization, Methodology, Investigation, Data curation, Conceptualization. Hannah Xu: Writing – review & editing. Xilin Li: Writing – review & editing. Aisar H. Atrakchi: Writing – review & editing, Funding acquisition. Timothy McGovern: Writing – review & editing, Funding acquisition. Karen L. Davis Bruno: Writing – review & editing, Funding acquisition. David A. Keire: Writing – review & editing, Funding acquisition. Nan Mei: Writing – review & editing, Funding acquisition. Robert H. Heflich: Writing – review & editing, Supervision, Funding acquisition, Conceptualization. Xiaoqing Guo: Writing – review & editing, Writing – original draft, Supervision, Methodology, Conceptualization.
Disclaimer
This manuscript reflects the views of the authors and does not necessarily reflect those of the U.S. Food and Drug Administration. Any mention of commercial products is for clarification only and is not intended as approval, endorsement, or recommendation.
Data availability
Data will be made available on request.
References
- Aishwarya D, et al. , 2025. Nitrosamine drug substance-related impurities (NDSRIs) in pharmaceuticals: formation, mitigation strategies, and emphasis on mutagenicity risks. Pharm. Res. 42, 547–578. [DOI] [PubMed] [Google Scholar]
- Andrieux LO, et al. , 2007. GATA-1 is essential in EGF-mediated induction of nucleotide excision repair activity and ERCC1 expression through ERK2 in human hepatoma cells. Cancer Res. 67, 2114–2123. [DOI] [PubMed] [Google Scholar]
- Antherieu S, et al. , 2010. Stable expression, activity, and inducibility of cytochromes P450 in differentiated HepaRG cells. Drug Metab. Dispos. 38, 516–525. [DOI] [PubMed] [Google Scholar]
- Anthérieu S, et al. , 2012. Optimization of the HepaRG cell model for drug metabolism and toxicity studies. Toxicol. Vitro 26, 1278–1285. [DOI] [PubMed] [Google Scholar]
- Bercu J, et al. , 2024. N-Nitrosamine drug substance related impurities (NDSRIs) - a proposal for the addition of subcategories to carcinogenic potency categorization approach categories 1 and 2 for NDSRIs with a molecular weight > 200 Da. Regul. Toxicol. Pharmacol. 154, 105704. [DOI] [PubMed] [Google Scholar]
- Bharate SS, 2021. Critical analysis of drug product recalls due to nitrosamine impurities. J. Med. Chem. 64, 2923–2936. [DOI] [PubMed] [Google Scholar]
- Cerec V, et al. , 2007. Transdifferentiation of hepatocyte-like cells from the human hepatoma HepaRG cell line through bipotent progenitor. Hepatology 45, 957–967. [DOI] [PubMed] [Google Scholar]
- Cheung J, et al. , 2024. Evaluation of the nitrosamine impurities of ACE inhibitors using computational, in vitro, and in vivo methods demonstrate no genotoxic potential. Environ. Mol. Mutagen. 65, 203–221. [DOI] [PubMed] [Google Scholar]
- Cioc RC, et al. , 2023. Formation of N-Nitrosamine drug substance related impurities in medicines: a regulatory perspective on risk factors and mitigation strategies. Org. Process Res. Dev. 27, 1736–1750. [Google Scholar]
- EMA, 2020. Nitrosamine impurities in human medicinal products. https://www.ema.europa.eu/en/documents/opinion-any-scientific-matter/nitrosamines-emea-h-a53-1490-assessment-report_en.pdf (assessed February, 2025).
- EMA, 2023. Appendix 2 to questions and answers for marketing authorisation holders/applicants on the CHMP Opinion for the Article 5(3) of Regulation (EC) no 726/2004 referral on nitrosamine impurities in human medicinal products. https://www.ema.europa.eu/en/documents/other/appendix-2-carcinogenic-potency-categorisation-approach-n-nitrosamines_en.pdf (assessed February, 2025).
- EMA, 2025. Appendix 1: acceptable intakes established for N-nitrosamines. https://www.ema.europa.eu/en/documents/other/appendix-1-acceptable-intakes-established-n-nitrosamines_en.xlsx (Rev.8, assessed February, 2025).
- FDA, 2023. Recommended acceptable intake limits for Nitrosamine Drug SubstanceRelated Impurities (NDSRIs): Guidance for industry. https://www.fda.gov/media/170794/download (assessed February, 2025).
- FDA, 2024. Control of nitrosamine impurities in human drugs. Guidance for Industry. https://www.fda.gov/media/141720/download (assessed February, 2025). [Google Scholar]
- FDA, 2025. Recommended acceptable intake (AI) limits, implementation timelines, emerging scientific and technical issues, and testing methods. Recommended Safety Testing Methods for Nitrosamine Impurities. https://www.fda.gov/regulatory-information/search-fda-guidance-documents/cder-nitrosamine-impurity-acceptable-intake-limits#safety. February, 2025. [Google Scholar]
- Fine J, et al. , 2023. Nitrosamine acceptable intakes should consider variation in molecular weight: the implication of stoichiometric DNA damage. Regul. Toxicol. Pharmacol. 145, 105505. [DOI] [PubMed] [Google Scholar]
- Gandhi RD, et al. , 2024. Escaping the cohort of concern: in vitro experimental evidence supports non-mutagenicity of N-nitroso-hydrochlorothiazide. Arch. Toxicol. 98, 4159–4172. [DOI] [PMC free article] [PubMed] [Google Scholar]
- Guillouzo A, et al. , 2007. The human hepatoma HepaRG cells: a highly differentiated model for studies of liver metabolism and toxicity of xenobiotics. Chem. Biol. Interact. 168, 66–73. [DOI] [PubMed] [Google Scholar]
- Guo X, et al. , 2020. Performance of HepaRG and HepG2 cells in the high-throughput micronucleus assay for in vitro genotoxicity assessment. J. Toxicol. Environ. Health 83, 702–717. [DOI] [PMC free article] [PubMed] [Google Scholar]
- Health-Canada, 2023. Guidance on nitrosamine impurities in medications. https://www.canada.ca/en/health-canada/services/drugs-health-products/compliance-enforcement/information-health-product/drugs/nitrosamine-impurities/medications-guidance.html. February, 2025. [Google Scholar]
- Heflich RH, et al. , 2024. Optimizing the detection of N-nitrosamine mutagenicity in the ames test. Regul. Toxicol. Pharmacol. 153, 105709. [DOI] [PMC free article] [PubMed] [Google Scholar]
- ICH, 2023. M7(R2) assessment and control of DNA reactive (mutagenic) impurities in pharmaceuticals to limit potential carcinogenic risk. https://www.fda.gov/media/170461/download (assessed February, 2025).
- Jolly RA, et al. , 2024. Estimation of acceptable daily intake values based on modeling and in vivo mutagenicity of NDSRIs of fluoxetine, duloxetine and atomoxetine. Regul. Toxicol. Pharmacol. 152, 105672. [DOI] [PubMed] [Google Scholar]
- Josse R, et al. , 2012. An adaptation of the human HepaRG cells to the in vitro micronucleus assay. Mutagenesis 27, 295–304. [DOI] [PubMed] [Google Scholar]
- Kruhlak NL, et al. , 2024. Determining recommended acceptable intake limits for N-nitrosamine impurities in pharmaceuticals: development and application of the carcinogenic potency categorization approach (CPCA). Regul. Toxicol. Pharmacol. 150, 105640. [DOI] [PubMed] [Google Scholar]
- Li X, et al. , 2020. Development and application of TK6-derived cells expressing human cytochrome P450s for genotoxicity testing. Toxicol. Sci. 175, 251–265. [DOI] [PMC free article] [PubMed] [Google Scholar]
- Li X, et al. , 2024. Mutagenicity and genotoxicity evaluation of 15 nitrosamine drug substance-related impurities in human TK6 cells. Regul. Toxicol. Pharmacol. 154, 105730. [DOI] [PMC free article] [PubMed] [Google Scholar]
- Li X, et al. , 2023. Revisiting the mutagenicity and genotoxicity of N-nitroso propranolol in bacterial and human in vitro assays. Regul. Toxicol. Pharmacol. 141, 105410. [DOI] [PMC free article] [PubMed] [Google Scholar]
- Li Y, Hecht SS, 2022. Metabolic activation and DNA interactions of carcinogenic N-Nitrosamines to which humans are commonly exposed. Int. J. Mol. Sci. 23. [DOI] [PMC free article] [PubMed] [Google Scholar]
- Nudelman R, et al. , 2023. The nitrosamine “Saga”: lessons learned from five years of scrutiny. Org. Process Res. Dev. 27, 1719–1735. [Google Scholar]
- Ponting DJ, et al. , 2025. Control of N-nitrosamine impurities in drug products: progressing the current CPCA framework and supporting the derivation of robust compound specific acceptable intakes. Regul. Toxicol. Pharmacol. 156, 105762. [DOI] [PubMed] [Google Scholar]
- Reed L, et al. , 2018. The role of cytochrome P450 enzymes in carcinogen activation and detoxication: an in vivo-in vitro paradox. Carcinogenesis 39, 851–859. [DOI] [PMC free article] [PubMed] [Google Scholar]
- Seo JE, et al. , 2022. Evaluation of an in vitro three-dimensional HepaRG spheroid model for genotoxicity testing using the high-throughput CometChip platform. ALTEX 39, 583–604. [DOI] [PubMed] [Google Scholar]
- Seo JE, et al. , 2024. Evaluating the mutagenicity of N-nitrosodimethylamine in 2D and 3D HepaRG cell cultures using error-corrected next generation sequencing. Arch. Toxicol. 98, 1919–1935. [DOI] [PMC free article] [PubMed] [Google Scholar]
- Seo JE, et al. , 2023a. High-throughput micronucleus assay using three-dimensional HepaRG spheroids for in vitro genotoxicity testing. Arch. Toxicol. 97, 1163–1175. [DOI] [PMC free article] [PubMed] [Google Scholar]
- Seo JE, et al. , 2020. Performance of high-throughput CometChip assay using primary human hepatocytes: a comparison of DNA damage responses with in vitro human hepatoma cell lines. Arch. Toxicol. 94, 2207–2224. [DOI] [PubMed] [Google Scholar]
- Seo JE, et al. , 2023b. Genotoxicity assessment of eight nitrosamines using 2D and 3D HepaRG cell models. Arch. Toxicol. 97, 2785–2798. [DOI] [PMC free article] [PubMed] [Google Scholar]
- Simon S, et al. , 2025. Deriving safe limits for N-nitroso-bisoprolol by error-corrected next-generation sequencing (ecNGS) and benchmark dose (BMD) analysis, integrated with QM modeling and CYP-docking analysis. Arch. Toxicol. [DOI] [PMC free article] [PubMed] [Google Scholar]
- Vikram PRH, et al. , 2025. NDSRIs crisis in pharmaceuticals; insights on Formation pathways, root causes, risk management, and novel analytical techniques. Curr. Med. Chem. 32, 1065–1081. [DOI] [PubMed] [Google Scholar]
- Wichitnithad W, et al. , 2023. An update on the current status and prospects of nitrosation pathways and possible root causes of nitrosamine formation in various pharmaceuticals. Saudi Pharm. J. 31, 295–311. [DOI] [PMC free article] [PubMed] [Google Scholar]
- Wogan GN, et al. , 1975. Carcinogenicity of nitrosation products of ephedrine, sarcosine, folic acid, and creatinine. Cancer Res. 35, 1981–1984. [PubMed] [Google Scholar]
Associated Data
This section collects any data citations, data availability statements, or supplementary materials included in this article.
Supplementary Materials
Data Availability Statement
Data will be made available on request.