

Abstract
A mixed phenotype is characteristic of de novo Mixed Phenotype Acute Leukemia (MPAL) but can also be seen in other leukemias. It poses substantial classification and management dilemmas. Herein, we report a large cohort of acute leukemia with a mixed phenotype and define Acute Myeloid Leukemia with Mixed Phenotype (AML-MP) and MPAL as two distinct groups by characterizing the clinical, genetic, and transcriptomic features. Clinically, patients with AML-MP and MPAL were both treated with either AML- or acute lymphoblastic leukemia (ALL)-directed induction regimens. AML-MP shows inferior responses (HR, 12.5; 95% CI, 2.72–57.8; p=.001), while MPAL shows better responses to ALL-directed treatment. Genetically, AML-MP harbors more frequent RUNX1 (23/52, 44%) and TP53 (12/52, 23.1%) mutations. In contrast, RUNX1 mutations are less frequent in MPAL (8/35, 23%, p=.01 vs AML-MP) and TP53 mutations as a driver are virtually absent in MPAL. Transcriptionally, AML-MP shows enrichment for stemness signatures, and a relative deficit of transcription factors critical for myeloid and lymphoid differentiation. Furthermore, AML-MP rarely switches to a lymphoid immunophenotype after treatment, in contrast to MPAL (1/40, 2.5%, vs. 10/28, 35.7%, p=.0003). Lastly, a genomic classification framework is proposed for future studies. Together, these data support the designation of AML-MP as a diagnosis distinct from MPAL and provide novel insights into the pathogenesis and therapies of acute leukemia with a mixed phenotype.
Keywords: Mixed phenotype, acute myeloid leukemia, therapy-related, myelodysplasia related, RUNX1, genomics, transcriptome, immunophenotype, lineage switch, lineage plasticity
INTRODUCTION
In acute leukemia, a mixed phenotype (MP) is defined by the presence of two or more lineage distinct blast populations or a single blast population with lineage ambiguity/promiscuity. As a defining feature of de novo Mixed Phenotype Acute Leukemia (MPAL), MP can also be seen in other types of acute leukemia. Excluding fusion driven acute leukemias, MP is infrequently identified in AML with myelodysplasia-related gene mutations and/or cytogenetic abnormalities (AML-MR) or therapy-related AML (t-AML), referred as AML-MP hereafter. While the WHO classification of haematolymphoid tumours 5th edition (WHO 5th edition) and International Consensus Classification (ICC) empirically recommend that the diagnosis of AML-MP supersedes MPAL1,2, there is a lack of studies comparing the clinical, genetic and biologic features of AML-MP and MPAL. 3,4 Several retrospective studies support the use of Acute Lymphoblastic Leukemia (ALL)-directed chemotherapy regimens for MPAL, however there are no strong evidence based guidelines for treatment other than seeking clinical trials and treatment at a major academic center 5–10. For patients with AML-MR and t-AML, a liposomal formula of cytarabine and daunorubicin shows modest benefit over traditional intensive chemotherapy but whether this can be extrapolated to AML-MP or not is unknown.11 Due to the lack of consensus, the treatment of AML-MP patients, similar to MPAL is often empirically selected based on the predominant blast component. It remains uncertain if this is the optimal approach for AML-MP (or even MPAL). Better biological characterization of both MPAL and AML-MP would greatly benefit the development of formal treatment guidelines for both and aid in the development of novel agents and regimens.
Genetically, MPAL often harbors fusions/alterations involving BCR::ABL1, KMT2A, ZNF384, BCL11B and PICAML::MLLT102,12 and mutations in PHF6, DNMT3A, NOTCH1 and WT1. 13–17 AML-MR is defined by MR-related cytogenetic abnormalities (MR-CG) and MR gene mutations (SRSF2, SF3B1, U2AF1, ZRSR2, ASXL1, EZH2, BCOR, and STAG2 with or without RUNX1).18,19 TP53 mutations and monosomal/complex karyotypes are frequent in t-AML.20 In contrast, the genetic landscape of AML-MP remains elusive. Due to the obvious differences between WHO 5th edition and ICC as well as the removal of t-AML as a diagnostic entity2,21, the molecular border of AML-MP with MPAL remains to be refined.
Herein, we present the first comprehensive study of AML-MP integrating clinical, immunophenotypic, genetic, and transcriptomic features of this disease in comparison to MPAL. We demonstrate that 1) AML-MP has inferior responses to ALL-directed treatment; 2) AML-MP, despite mixed phenotype, has limited lymphoid lineage plasticity compared to MPAL; 3) AML-MP has frequent RUNX1 mutations and is enriched for stemness signatures; 4) RUNX1 mutations and complex karyotype do not impact the outcome of MPAL; 5) AML-MP shows downregulated expression of critical myeloid lineage transcription factors.
METHODS
Patient cohorts
The MSKCC pathology database was searched from January 2014 to December 2022 for a new diagnosis of “acute leukemia” or “acute myeloid leukemia” and/or “mixed phenotype”. A second search was performed on flow cytometry reports with “abnormal myeloid blast” and/or “abnormal immature T cells” and/or “abnormal immature B cells”. In this study, flow cytometric evaluation was used, and the lineage assignment was based on the criteria listed by the WHO Classification of Haematolymphoid Tumours revised 4th edition (revised WHO 4th edition)22 and independently confirmed by at least 2 of the participating board-certified hematopathologists (P.G., A.C., M.R. and W.X.). Following the guidance of the revised WHO 4th edition22, all cases of chronic myeloid leukemia in blast crisis, myeloproliferative neoplasm in blast crisis, myeloid and lymphoid neoplasms with eosinophilia and gene rearrangement, and B-lymphoblastic leukemia/lymphoma with isolated myeloperoxidase expression were excluded. AML with recurrent genetic abnormalities (excluding two provisional entities: AML with BCR::ABL1 fusion and AML with RUNX1 mutation) that did not have a history of myelodysplastic syndrome (MDS), myelodysplastic/myeloproliferative neoplasm (MDS/MPN), and/or cytotoxic treatment were also excluded from further analysis. AML-MP was defined by a diagnosis of t-AML or AML with myelodysplasia-related changes (AML-MRC, a terminology used by WHO revised 4th edition22) but with a mixed phenotype, immunophenotypically indistinguishable from MPAL. The diagnostic workflow to distinguish AML-MP from MPAL is illustrated in Figure S1 and detailed in supplemental methods. An age-matched cohort of 100 patients newly diagnosed as AML-MRC or t-AML without MP was also included for comparison. The clinical, morphologic, immunophenotypic, cytogenetic and molecular results of all patients at initial diagnosis were manually re-annotated. This study was approved by the institutional review board (IRB) at MSKCC, and informed consents were obtained from all patients.
Detailed methods including patient cohorts, diagnostic criteria, chromosome and FISH analysis, flow cytometry (Table S1) and cell sorting, RNA sequencing and statistical analysis are included in supplemental data. For original data not included, please contact xiaow@mskcc.org.
RESULTS
AML-MP and MPAL show different patterns of extramedullary involvement
A total of 135 newly diagnosed patients with ≥20% blasts and mixed phenotype were initially identified and confirmed. Patients with a diagnosis of blast phase of chronic myeloid leukemia (CML) (18, 13%), blast phase of BCR::ABL1 negative myeloproliferative neoplasms (MPN) (3, 2.2%), B-lymphoblastic leukemia/lymphoma (B-ALL) with isolated myeloperoxidase expression (7, 5.2%), and myeloid/lymphoid neoplasms with eosinophilia and gene rearrangement (2, 1.5%) were excluded (Figure 1A and Figure S1). Five patients with AML with recurrent genetic abnormalities (2 AML with core binding factor (CBF) fusions, 3 AML with inv(3), 3.7%) were also excluded due to lack of history of MDS, MDS/MPN or cytotoxic treatment. Of note, AML with NPM1 or in-frame bZIP /biallelic CEBPA mutations were not observed in this cohort. The remaining 100 patients with acute leukemia with a mixed phenotype were included in this study: 55 (40.7%) patients of AML-MP (Table S2) and 45 (33.3%) patients of MPAL (Figure 1A-B and Table S3). Therefore, only a third of acute leukemia with a mixed phenotype is bona fide MPAL. The frequency of mixed phenotype in AML-MRC and t-AML was 3.3% (55/1679) overall, with 2.8% (40/1429) in AML-MRC and 6% (15/250) in t-AML, respectively.
FIGURE 1: Diagnostic algorithm and clinical features for AML-MP and MPAL.
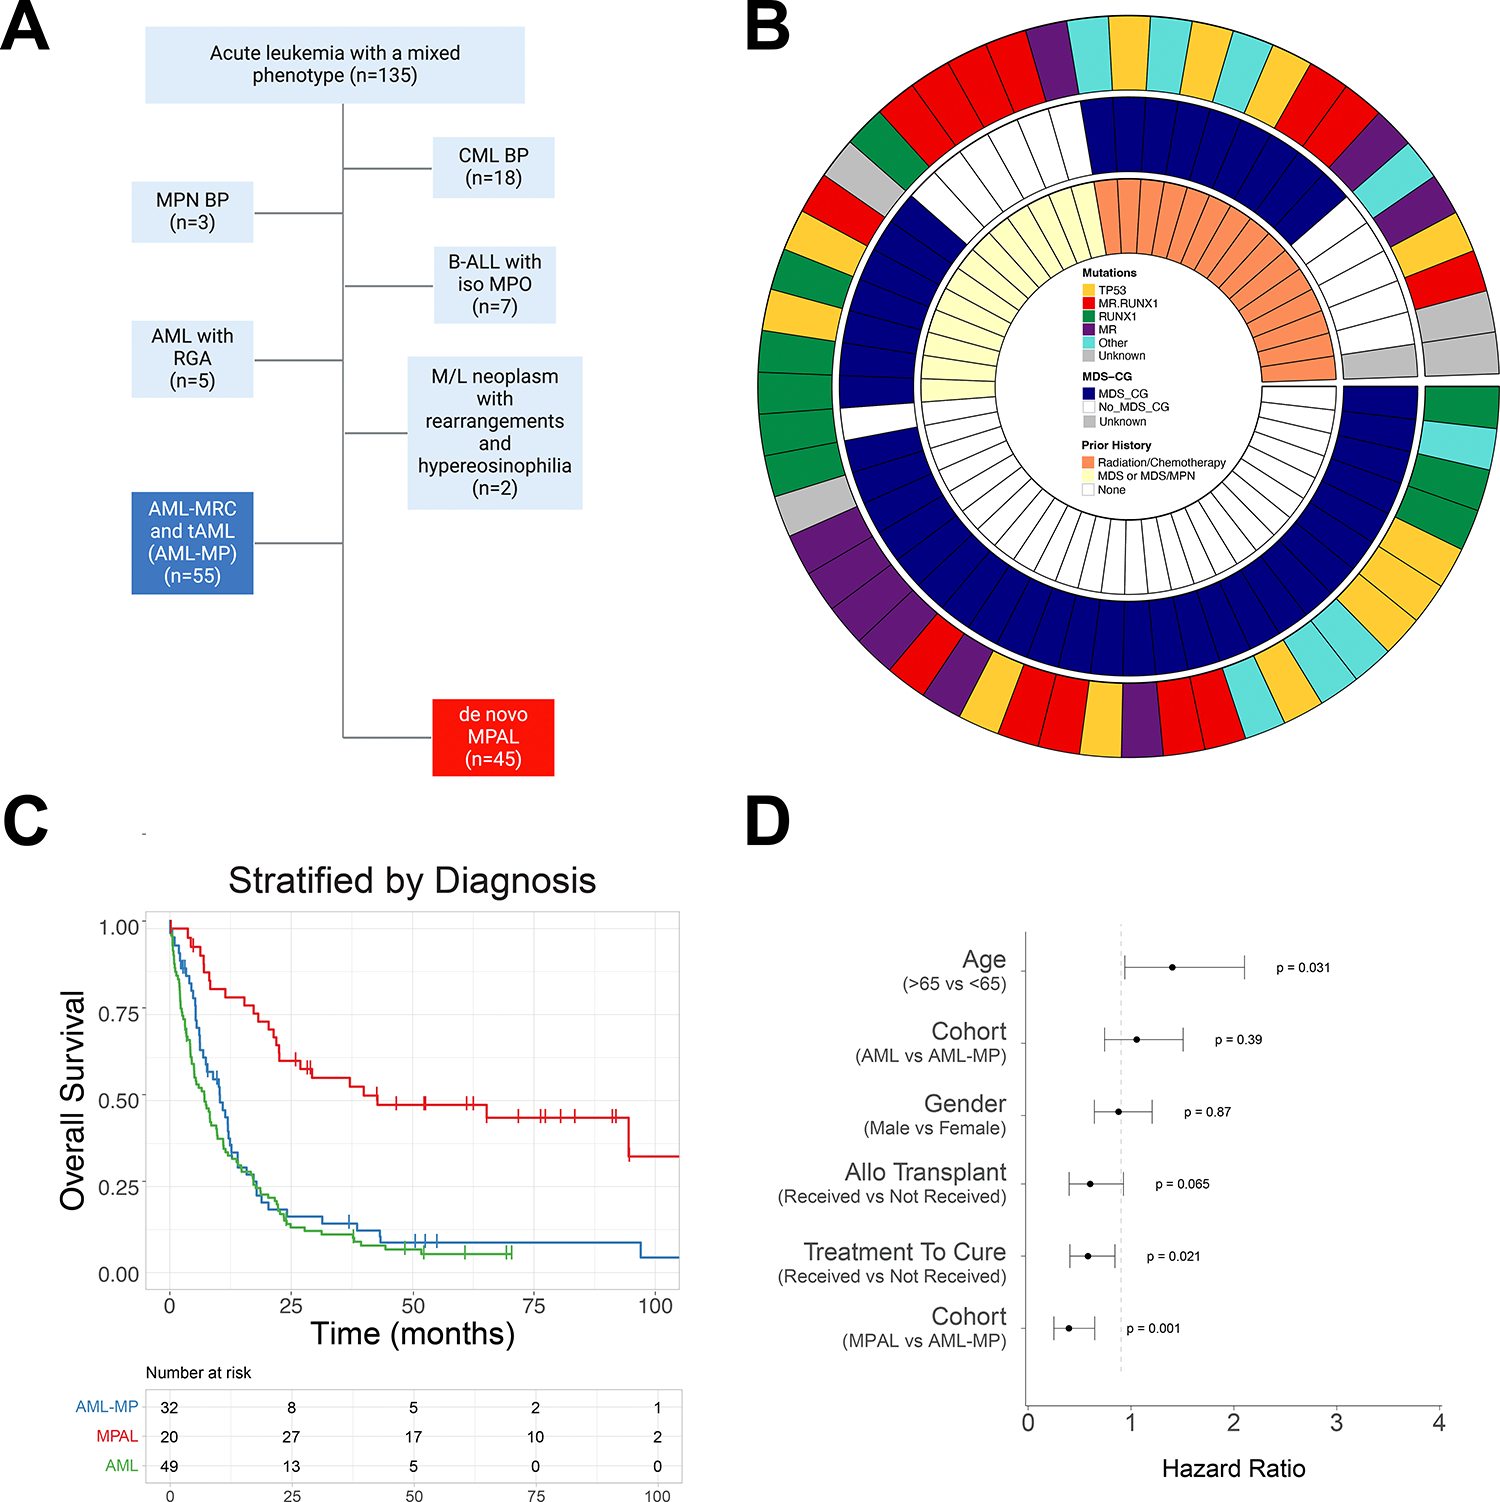
A. Inclusion and exclusion criteria of AML-MP and MPAL cohorts. Only 1/3 of patients presented with acute leukemia with a mixed phenotype had bona fide MPAL. Abbreviations: CML BP, chronic myeloid leukemia with blast phase; MPN BP, myeloproliferative neoplasm with blast phase; B-ALL with iso MPO, B-acute lymphoblastic leukemia with isolated myeloperoxidase expression; AML with RGA, acute myeloid leukemia with recurrent genetic abnormalities; M/L, myeloid and lymphoid; AML-MR, acute myeloid leukemia with myelodysplasia-related changes; t-AML, therapy-related AML; MPAL, mixed phenotype acute leukemia. B. Circos plot of the AML-MP cohort detailing the inclusion criteria namely prior history of cytotoxic chemotherapy and/or radiotherapy administered for a non-myeloid neoplastic or non-neoplastic disorder for t-AML (15 cases) and prior history of MDS and/or MDS/MPN and/or the presence of MDS defining cytogenetic abnormalities for AML-MR (39 cases; 6 cases with prior history of MDS and/or MDS/MPN only, 26 cases with MDS defining cytogenetic abnormalities only, and 7 cases with both). 1 case lacking both history of MDS and/or MDS/MPN and MDS defining cytogenetic abnormalities had met morphologic dysplasia criteria and had mutational profile typical for AML and was classified as AML-MRC. MR.RUNX1 represents patients with MR and RUNX1 comutations. MR represents patients with MR mutations (not including RUNX1). RUNX1 represents patients with RUNX1 mutations while no other MR mutations. MR mutations include mutations in any of these genes: ASXL1, BCOR, EZH2, STAG2, SF3B1, SRSF2, U2AF1, and ZRSR2. MDS-CG, MDS related cytogenetic abnormalities which included complex karyotype (≥ 3 abnormalities), 5q deletion or loss of 5q due to unbalanced translocation, monosomy 7, 7q deletion, or loss of 7q due to unbalanced translocation, 11q deletion, 12p deletion or loss of 12p due to unbalanced translocation, monosomy 13 or 13q deletion, 17p deletion or loss of 17p due to unbalanced translocation, isochromosome 17q and idic(X)(q13)12. Abbreviations: MDS, myelodysplastic syndrome/neoplasm; MDS/MPN, myelodysplastic and myeloproliferative overlap syndrome. C. Kaplan-Meier curves of overall survival stratified by disease types. Red line, MPAL; green line, AML without mixed phenotype; blue line, AML-MP. D. Multivariate cox proportional hazards analysis showing the influence of individual features on clinical outcomes. These include age over 65, gender, disease type (either AML-MP or MPAL with AML as the reference), treatment with intension to cure (intensive vs. non-intensive treatment), and receipt of an allogeneic stem cell transplant.
We compared the clinical features of AML-MP to that of MPAL and an age-matched cohort of AML without MP (Table 1). There were no statistical differences between AML and AML-MP in terms of age, blast percentage, CBC, distribution of t-AML vs AML-MRC, adverse cytogenetics, proportion of patients receiving intensive chemotherapy and allo-HSCT. The median age at diagnosis of AML-MP was 66.5 years, significantly higher than that of MPAL (42 years, p<.0001). All 3 cohorts had male preponderance. Both AML cohorts (with or without MP) had fewer peripheral/bone marrow blasts but more severe leukopenia and thrombocytopenia than MPAL. The AML-MP cohort included 30 (54.5%) B/Myeloid (B/M), 20 (36.4%) T/M and 5 (9.1%) B/T/M phenotype, similar to MPAL [26 (57.8%), 16 (35.6%), and 2 (4.4%), respectively]. One patient with MPAL had a rare T/B phenotype. Fourteen (25.5%) cases of AML-MP revealed extramedullary involvement (7 involving skin and 7 lymph node), higher than that seen in AML without MP cases (8%, 5 skin and 3 lymph node involvement, p=.007). While the MPAL cohort demonstrated similarly high numbers of cases with extramedullary involvement (12/45, 26.7%) the distribution was significantly different from AML-MP as nearly all MPAL patients revealed nodal and only 1 patient had skin involvement (p=.03, Table S4).
Table 1.
Clinicopathological Characteristics of patients with AML-MP, MPAL and AML without MP
| MPAL (n=45) |
AML-MP (n=55) |
AML (n=100) |
|
|---|---|---|---|
|
| |||
| Age, median years (Range) | 42 (0–85.5)* | 66.5 (8.5–85) | 70 (14–87) |
| Male/Female (ratio) | 27/18 (1.5) | 33/22 (1.5) | 65/35 (1.8) |
| CBC prior to induction | |||
| WBC, median X 10^9/L (Range) | 12.9 (0.7–323)* | 2.9 (0.4–75.8) | 2.4 (0.1–89) |
| Hb, median g/dL (Range) | 9.1 (6–15.1) | 8.5 (6.3–12.8) | 8.7 (5.8–15.7) |
| PLT, median X 10^9/L (Range) | 93 (13–403)* | 51 (2–350) | 46.5 (7–893) |
| Blasts, median % (Range) | 27 (0–94)* | 11.5 (0–87) | 7 (0–88.3) |
| Bone Marrow findings | |||
| Blasts, median % (Range) | 75 (1–100)* | 48 (8–88) | 30 (7–92) |
| Extramedullary involvement | |||
| Lymph node | 11* | 7 | 3 |
| Skin | 1 | 7 | 5 |
| WHO classification (revised 4th edition) | |||
| MPAL with t(v;11q23.3) | 5 | 0 | 0 |
| MPAL with t(9;22) | 6 | 0 | 0 |
| MPAL, B/myeloid, NOS | 15 | 0 | 0 |
| MPAL, T/myeloid, NOS | 16 | 0 | 0 |
| MPAL, NOS | 3 | 0 | 0 |
| t-AML | 0 | 15 | 37 |
| AML-MRC | 0 | 40 | 63 |
| Blast population | |||
| Orthogonal Bilineal Blasts | 35 | 47 | NA |
| Biphenotypic Blasts | 3 | 6 | NA |
| Not available for review | 7 | 2 | NA |
| History of Prior Myeloid Neoplasm | 0 | 21 | 67 |
| History of Chemotherapy | 0 | 15 | 37 |
| Cytogenetics (CG) | |||
| CK with chr 5, 7, 17 aberrancies | 2 | 21 | 38 |
| CK without chr 5, 7, 17 aberrancies | 7 | 4 | 8 |
| Chr 5, 7, 17 aberrancies without CK | 0 | 17 | 18 |
| Other AML-MRC defining aberrancies | 0 | 2 | 2 |
| Mutations | |||
| TP53 mutations | 0* | 12 | 34 |
| RUNX1 mutations | 8* | 23 | 20 |
| MR gene mutations (WHO 5th edition) | 3* | 26 | 36 |
| PHF6 mutations | 5 | 2 | 4 |
| Therapeutic regimens | 44/45 | 51/55 | 83/100 |
| Intensive myeloid | 14* | 21 | 43 |
| Intensive lymphoid | 29 | 7 | NA |
| Hypomethylating agent + Venetoclax | 0 | 9 | 4 |
| Hypomethylating agent | 0 | 11 | 21 |
| Others | 1 | 3 | 15 |
| Complete remission | 38/42 (90.5%)* | 18/48 (37.5%) | 30/83 (36.1%) |
| Persistent Disease | 4/42 (9.5%)* | 29/48 (60.4%) | 62/83 (74.6%) |
| Hematopoietic Stem Cell Transplant | 28 (62%)* | 18 (32.7%) | 33 (33%) |
p<0.05 between MPAL and AML-MP, or MPAL and AML.
AML-MP has worse outcomes than MPAL
The overall survival (OS) was significantly worse in patients with AML-MP in comparison to MPAL (HR, 2.3, 95% CI, 1.4–4.0, p=.002; median OS: 10.3 vs 42.8 months, p<.0001; Figure 1C) but comparable to those with AML without MP (median: 7.1 months, p=0.3; Figure 1C). Among the patients receiving intensive induction therapy, AML-MP patients were also less likely to achieve complete remission (CR) in comparison to MPAL (37.5% vs 90%, p<.001, Table 1). On a cox proportional hazards analysis after adjusting the influence on clinical outcomes of other individual features including age over 65, gender, treatment with intension to cure and allotransplant, MPAL was still independently associated with better OS (HR, 0.4, 95% CI, 0.25–0.74, p=.002, Figure 1D). Among all the patients receiving allo-HSCT, although MPAL showed a trend towards better OS, only age was still an independent risk factor for OS (HR, 3.69, 95% CI, 1.79–7.58, p = .0004, Figure S2).
AML-MP and MPAL show differential responses to AML- vs. ALL-directed chemotherapy regimens
Only 28/51 (54.9%) AML-MP patients received intensive chemotherapies while 43/44 (97.7%) MPAL patients did (p=.0001, Figure 2A, Table 1 and Table S3). Both AML and ALL directed regimens were administrated. The selection of induction regimens was significantly correlated with the proportion of myeloid vs lymphoid lineage blasts in both AML-MP and MPAL patients (Figure 2B). However, a clear cutoff of proportion was not evidently applied to treatment decision. Although the majority AML-MP patients (21/28, 75%) received AML-directed regimens, a significant portion (7/28, 25%) received ALL-directed regimens. Reversely, 29/44 (65.9%) patients with MPAL received ALL-directed regimens and 14/44 (31.8%) AML-directed regimens (Figure 2A). Therefore, AML-directed regimens were preferentially used to treat AML-MP (p=.008), while ALL-directed regimens to MPAL. However, these data also clearly highlight the lack of consensus on how to appropriately treat acute leukemia with a mixed phenotype including both AML-MP and MPAL.
FIGURE 2: Differential clinical responses of AML-MP and MPAL.

A. Treatment regimens received by patients who screened into the cohort broken down by disease type and labeled according to the type of treatment regimen received. Intensive therapies are broken down into myeloid- and lymphoid targeted regimens. Low intensity regimens were predominantly myeloid based using a hypomethylating agent backbone (HMA) with or without the addition of venetoclax. Other lower intensity regimens are aggregated into the ‘Other’ category. B. Comparison of lymphoid blast proportion in patients treated with AML- vs ALL-directed regimens. C-D. Survival analyses of patients with AML-MP (C) and MPAL (D) treated with either AML (intensive myeloid)- or ALL (intensive lymphoid)-directed induction therapy.
Next, we evaluated the differential responses to AML- vs ALL-directed regimens. First, 28/29 (96.6%) MPAL patients treated with ALL-directed regimen achieved CR, as compared to 1/7 (14.3%) AML-MP patients (p=.0001), suggesting inferior responses of AML-MP to ALL-directed regimens. We then performed multivariate OS analyses of AML-MP and MPAL treated with these regimens (Figure S3). Among AML-MP patients treated with intensive regimens, age and adverse cytogenetics were not associated with worse OS; however, treatment with ALL-directed regimens was significantly associated with inferior OS (HR, 5.68; 95% Cl, 1.39–23.4; P = .016, Figure 2C). In contrast, patients with MPAL had significantly better OS when treated with ALL-directed regimens (p=.0001, Figure 2D). Among all patients treated with ALL-directed regimens, both age and AML-MP (but not adverse cytogenetics) were significantly associated with inferior OS (age>65: HR, 9.0; 95% CI, 2.28–35.6; p=.001; AML-MP: HR, 12.5; 95% CI, 2.72–57.8; p=.001, Figure S3A). When treated with AML-directed intensive regimens, 12/20 (60%) AML-MP achieved morphologic remission (CR/complete remission with incomplete hematologic recovery (CRi)/morphologic leukemia free state (MLFS)), while none of 4 MPAL patients did (p=.09). In multivariate analysis, only age (but not type of diseases) was associated with worse outcome when treated with AML regimens (age>65: HR, 3.0; 95% CI, 1.1–8.0; p=.02, Figure S3B).
Among AML-MP patients, 11 were treated with hypomethylating agents (HMA) and 9 were treated with HMA/Venetoclax. None of these patients obtained CR/CRi. None of MPAL patients received such regimens. Among patients receiving HMA, 10/11 had unfavorable cytogenetic abnormalities, 5/11 TP53 mutations and 4/11 MR gene mutations (Table S3). Among patients receiving HMA/Venetoclax, 7/9 had unfavorable cytogenetic abnormalities, 2/9 TP53 mutations and 6/9 MR gene mutations.
Twenty-nine AML-MP patients received salvage therapies. Fifteen patients were treated with cytarabine based regimens (FLAG-IDA, n=7; high dose cytarabine, n=4; Vyxeos, n=2; cytarabine with mitoxantrone, n=1; mitoxantrone with etoposide and cytarabine, n=1), 8 patients were treated with HMA based regimens (decitabine, n=3; decitabine and venetoclax, n=2; azacitidine and venetoclax, n=2; azacitidine with mitoxantrone, n=1), 4 with clinical trials (IDH1/2 inhibitors, n=2; FLT3 inhibitor, n=1 and lomab-B, n=1), 1 with 6-Thioguanine and 1 with clofarabine/cyclophosphamide/etoposide (Table S5). Only 6/29 (21%) achieved morphologic remission (3 CR, 2 CRi and 1 MLFS).
AML-MP and MPAL have different lymphoid potential
We studied the lineage dynamics after treatment. At diagnosis, the proportion of myeloid blasts in AML-MP was higher than that in MPAL (71%±26% vs 50%±34%, p=.008, Wilcox test), while the portion of lymphoid blasts was reverse (AML-MP: 29%±26% vs MPAL: 50%±34%, p=.008). A subset of patients exhibited lineage shift from diagnosis either post-treatment or at a relapse event (Figure 3A-C). After treatment, 7 AML-MP and 13 MPAL patients with persistent disease exhibited lineage shifts after induction therapy. Of the 24 patients who obtained CR but later relapsed, 8 (5 AML-MP, 3 MPAL) switched immunophenotypes between diagnosis and relapse and 6 of them became myeloid only. Interestingly, 2 patients had second relapse and the immunophenotype returned from myeloid only back to the original mixed phenotype. Altogether, among the patients remaining positive for disease after treatment (either post induction or relapse), comparable portion of MPAL and AML-MP patients displayed a myeloid-only immunophenotype (4/28, 14.2% vs 9/40, 22.5%, p=.5, Figure 3A). Unexpectedly, MPAL patients frequently shifted to lymphoid (either B- or T-lineage)-only blasts (10/28, 35.7%), while patients with AML-MP rarely did (1/40, 2.5%, p=.0003), suggesting a biological difference in bona fide lymphoid differentiation potential between AML-MP and MPAL.
FIGURE 3: Lineage dynamics in MPAL and AML-MP.

A. Bar graph comparing lineage shift post treatment (either post induction or relapse) split according to disease type. myeloid: myeloid lineage only blasts; lymphoid, lymphoid lineage only blasts. B-C. Alluvial plots of AML-MP (B) and MPAL (C) lineage dynamics between diagnosis, treatment, and relapse time points. Dx, diagnosis; B, B lineage blasts; B/M, blasts with B/myeloid mixed lineage phenotype; B/T, blasts with B/T mixed lineage phenotype; T, T lineage blasts; T/B/M, blasts with T/B/myeloid mixed lineage phenotype; T/M, blasts with T/myeloid mixed lineage phenotype; M, myeloid lineage blasts; NEG, no abnormal blasts detected; unknown, no information available.
AML-MP and MPAL have different mutational profiles
Mutational profiles were revealed by targeted NGS sequencing studies in 52 of 55 AML-MP, 37 of 45 MPAL and 99 of 100 AML without MP (Figure 4A, B). Mutations in TET2, FLT3, KRAS, PTPN11, IDH1, IDH2, and CEBPA showed no statistical difference among the 3 cohorts. Notably, mutations in TP53 were absent from MPAL. MR gene mutations including SRSF2, U2AF1, BCOR, EZH2, STAG2 and SETBP1, while variably common in both AML cohorts, were notably absent from MPAL. Mutations in other MR genes such as ASXL1 and SF3B1 were also rare in MPAL. Conversely, MPAL was enriched for mutations in PHF6 and fusions in KMT2A, BCR::ABL1 and PICALM::MLLT10. RUNX1 mutations, although common in all 3 cohorts, were significantly more frequent in AML-MP (23/52, 44% vs 20/99, 20% in AML without MP, p=.02; and vs 8/35, 23% in MPAL, p=.01). RAS pathway mutations including NRAS, PTPN11 and CBL were more frequently present in AML-MP (e.g., NRAS 15.7% vs 4% AML without MP, p=.02).
FIGURE 4: Landscape of gene mutations and cytogenetic abnormalities in AML-MP and MPAL.
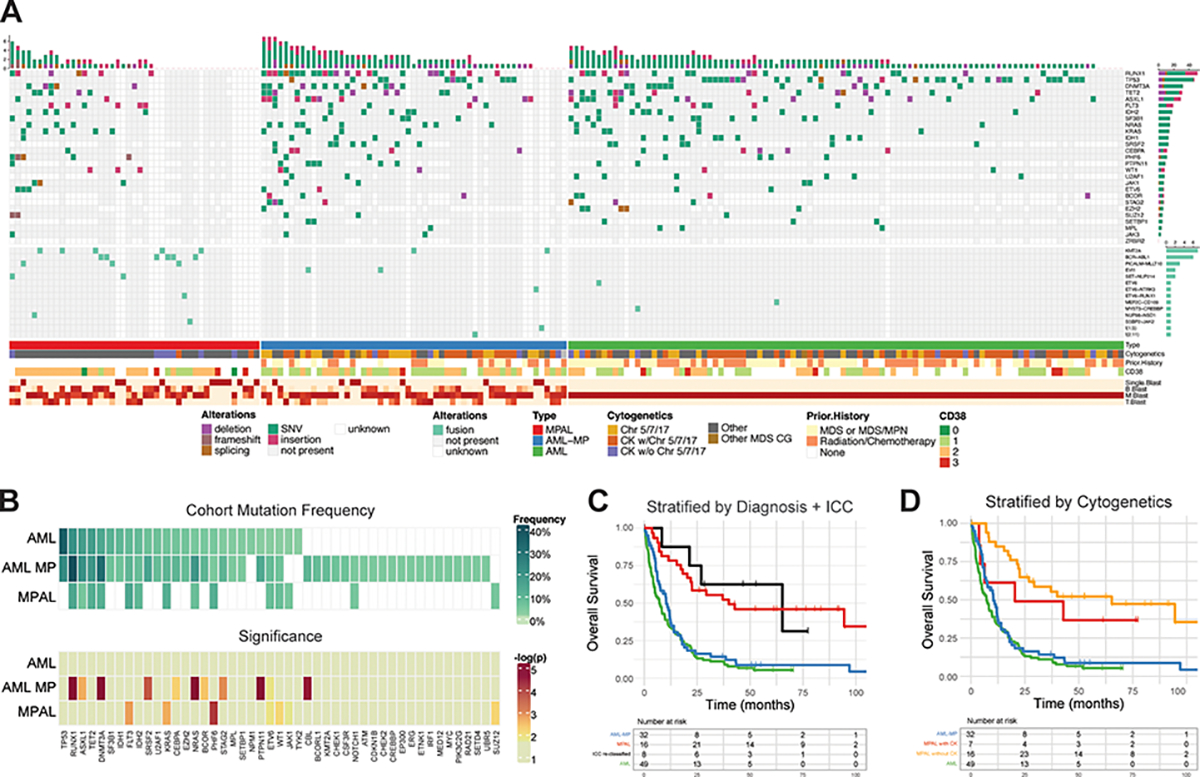
A. The oncoplot tabulates mutations, fusions, cytogenetics, prior history of cytotoxic chemotherapy and/or radiotherapy, prior history of MDS and/or MDS/MPN for all the 3 cohorts (AML-MP, MPAL and AML without MP) along with the blast lineage and CD38 expression intensity annotated on the bottom bar. The genes not included in the NGS panel during sequencing were marked as blank. B blasts, B-lineage blasts; M blasts, myeloid lineage blasts; T-blasts, T-lineage blasts. SNV, single nucleotide variant. Chr5/7/17, MDS-cytogenetic abnormalities involving chromosomes 5, 7 or 17 but not qualifying for complex karyotype; CK w/ Chr5/7/17, complex karyotype with MDS defining cytogenetic abnormalities involving chromosomes 5, 7 or 17; CK w/o Chr5/7/17, complex karyotype but not involving chromosomes 5, 7 or 17. B. Mutation frequency within the cohort and significance. The upper heatmap shows the frequency of each mutation within the cohort and the bottom panel shows the significance of the enrichment in each disease relative to the overall cohort using a one tailed Fisher’s exact test. The AML subset notably is does not have any mutations that are uniquely distinct from the combined non-AML cases in the cohort. D. Kaplan-Meier curves of overall survival after re-classifying MPAL cases according to the presence of RUNX1 with or without MR gene mutations. The black line (‘ICC reclassified’) contains MPAL patients harboring RUNX1 (with or without MR) mutations. The red line contains MPAL patients with no RUNX1 mutations. AML (green) and AML-MP (blue) are defined as before. E. Kaplan-Meier curves of overall survival after stratifying MPAL cases according to the presence or absence of complex karyotype. MPAL patients with complex karyotypes are shown in yellow and MPAL patients without complex karyotypes are shown in red.
Myelodysplasia related cytogenetic abnormalities (MR-CG) was frequent in AML-MP (80%) and AML without MP (66%) (Table 1). In contrast, only 9/45 (20%) patient with MPAL had complex karyotypes (CK, Table S6): 1 had a T/B (no myeloid) phenotype, 1 had a PICALM::MLLT10 translocation with isochromosome 17q(10), and 5 had other balanced translocations (BCR::ABL1 or KMT2A and CK not involving chr. 5, 7 or 17. The remaining 2 had a hyper-diploid clone. Thus, despite of atypical complex karyotypes, these 9 patients were classified as MPAL.
Refinement of the classification border of AML-MP with MPAL
As both WHO 5th edition and ICC expand the AML-MR category by including patients harboring MR/RUNX1 gene mutations regardless of history and/or cytogenetics12,23, we investigated if the newly included MR/RUNX1 gene mutations in otherwise MPAL would confer an inferior outcome and thus would suggest reclassifying it as AML-MP. Eight patients of MPAL harbored RUNX1 gene mutations: 1 RUNX1/ASXL1, 1 RUNX1/SF3B1, and 6 RUNX1. Interestingly, these 8 patients had similar OS to the remaining MPAL patients but superior to AML-MP (median survival: 65 vs 10 months, p=.014; Figure 4C). There were only 3 patients in MPAL cohort harboring the WHO 5th edition MR gene mutations, underpowered for outcome analysis.
To examine if complex karyotypes are associated with inferior outcome in MPAL, overall survival was compared between MPAL patients with or without complex karyotype (Figure 4D), which showed no difference. Therefore, complex karyotype may not confer inferior outcome in bona fide MPAL patient.
Both WHO 5th edition and ICC have moved towards a genomic classification; hence we asked if a similar genomic approach would separate AML-MP from MPAL. The hierarchical algorithm is shown in Figure 5A: Balanced translocations/fusions>TP53 mutations>MDS-defining cytogenetic abnormalities>MR gene mutations (not including RUNX1 gene). To this end, the concordance between WHO revised 4th edition and the newly proposed genomic approach was 90% (Figure 5B and Table S7) and the inferior outcome of the newly classified AML-MP similarly remained (HR, 2.8, 95% CI 1.6–5.1, p=.0005, Figure 5C). Among 10 inconsistent cases, 2 were reclassified from MPAL to AML-MP: one had MR gene mutation, and the other had atypical complex karyotype. There were 8 cases reclassified from AML-MP to MPAL: 1 had KMT2A rearrangements post cytotoxic treatment, 2 had other balanced translocations/fusions, 4 had history of MDS or post cytotoxic treatment but no class defining genetic abnormalities, and the remaining 1 had morphologic dysplasia.
FiGURE 5. Genomic classification of AML-MP vs MPAL.

A. Comparison between revised WHO 4th edition classification and newly proposed genomic classification approaches. Of note, this is after exclusion of well-defined entities listed in Fig 1A and Fig S1 such as CML BP, MPN BP, BALL with iso MPO, AML with RGA and M/L neoplasms with tyrosine kinase rearrangements and eosinophilia. B. Concordance of the two approaches. C. Overall survival of AML-MP vs MPAL classified by genomic approach.
AML-MP and MPAL show different transcriptomic signatures
To further identify the genetic programs differentiating MPAL from AML-MP cases, gene-expression analysis was performed on flow sorted myeloid- vs T-lineage leukemic blasts using RNA-seq. Principal component analysis revealed two distinct lineage-based groups: one primarily consisting of MPAL samples and the other with both AML without MP and AML-MP (Figure 6A). Interestingly, myeloid- and T-lineage blasts from the same patient clustered closely. This was further confirmed when unsupervised clustering was performed on RNA-seq data, resulting in two groups akin to the PCA (Figure S4). Flow marker annotations indicated higher CD38 and lower CD34 levels in the MPAL cluster compared to the AML-MP/AML group, suggesting a more differentiated immunophenotype of MPAL (Figure S4).
FIGURE 6: Enriched stemness transcriptomic signatures in AML-MP.

A. Principal component analysis (PCA) conducted on RNA-seq of flow sorted leukemic blasts, colored by disease type. B. Gene set enrichment tests on transcriptome of flow sorted leukemic blasts comparing AML-MP and MPAL cases. The mean statistic for gene contrasts (in both positive and negative directions) is displayed per stage, with statistical significance (p= < 0.05) of the enrichment test indicated. Enrichment was conducted using contrived gene sets per hematopoietic lineage stage, indicating high HSC enrichment in AML-MP samples and high monocytic and CD4 positive T-cell lineage enrichment in myeloid and T- blasts in MPAL samples. HSC, hematopoietic stem cells; MPP, multipotent progenitors; LMPP, lymphoid myeloid potent progenitors; CMP, common myeloid progenitors; GMP, granulocytic and monocytic progenitors; MEP, megakaryocytic and erythroid progenitors; CLP, common lymphoid progenitors; Ery, erythroid; NK, nature killer cells; CD4, CD4 positive T cells; CD8, CD8 positive T cells; B, B cells. C. Gene set variation analysis (GSVA) clustered using hierarchical analysis (Euclidean distance, Ward’s method). AML-MP2 (a ~75–79-year-old female), clustering with MPAL, had therapy related history for breast cancer but presented with T-ALL in lymph nodes and T/myeloid leukemia in the marrow. Genetics showed normal karyotype and JAK3/NRAS mutations, and therefore best classified as MPAL rather than (AML-MP/t-AML). D. Selected RNA-seq gene expression stratified by disease type. Among the genes upregulated in AML-MP and AML without MP samples were several master regulators of HSC such as MEIS1, HOXB2, and HOXB3. RNA sequencing studies were performed on 4 cases each of AML-MP (flow sorted myeloid and T-lineage blast populations), MPAL (flow sorted myeloid and T-lineage blast populations), and AML without MP (flow sorted myeloid lineage blast population).
To determine the specific lineage features separating MPAL from AML-MP, pathway analysis was performed using custom hematopoietic lineage gene sets derived from a published set of flow sorted hematopoietic stages derived from normal bone marrow samples24. Genes which were characteristic of each stage were identified using the Kruskal Wallis test statistic. Enrichment analysis using these sets revealed a significant HSC gene set enrichment in the AML-MP samples compared to MPAL in both myeloid (p< 0.001) and T blasts (p< 0.001) (Figure 6B). In comparison, monocytic and CD4 T-cell lineages were enriched in myeloid blasts (p<0.001) and T-blasts (p<0.001) sorted from MPAL, respectively.
GSEA using published gene sets in MSigDB25,26 revealed significant enrichment in gene sets characterized by leukemic stem cells (Figure S5). GSVA scores were calculated for these gene sets and compared: the results highlighted a separation between MPAL and AML samples both with and without MP (Figure 6C). Among stem cell expression gene-sets, AML-MP samples had higher GSVA scores compared to MPAL cases. When comparing GSVA scores, AML-MP samples aggregated with AML without MP samples rather than MPAL. Sample-specific pathway enrichments using selected AML and hematopoietic stem cell gene sets revealed a greater enrichment of hematopoietic stem cells,27 Valk cluster 1528, upregulation of targets of NUP89/HOXA9 fusion in CD34+ hematopoietic cells,29 and upregulated genes in leukemic stem cells30 in AML and AML-MP samples. Unsupervised analysis of these enrichment scores identified two main sample groups: one composed entirely of AML and AML-MP samples, and the other composed almost entirely of MPAL samples (Figure 6C). To identify the genes driving this separation, the genes composing these pathways were examined individually (Figure S6). Among the genes identified were several master regulators of hematopoiesis such as MEIS1, HOXB2, and HOXB3 (Figure 6D). Notably, one patient of AML-MP clustered with MPAL, displaying that at transcriptomic level it was closer to MPAL than AML-MP (Figure 6C-D). Therefore, this patient was biologically closer to MPAL despite technically meeting criteria of t-AML.
AML-MP and MPAL shows different expression patterns of myeloid and lymphoid transcription factors
To provide mechanistic insights into diminished lymphoid differentiation potential in AML-MP, we evaluated mRNA expression levels of a comprehensive list of transcription factors that are critical for myeloid versus lymphoid lineage commitment (Figure S7). Consistent with an enrichment for stemness signatures as shown by pathway analysis (see Figure S5), expression of MEIS1, TAL1 and GATA2, all critical for HSC functions 31–34, was significantly higher in AML and AML-MP than in MPAL (Figure 7). SPI1 expression (encoding PU.1), a transcription factor indispensable for both myeloid and lymphoid commitment35,36, was comparable among 3 groups. IRF8 mRNA, a master regulator for monocytic and dendritic lineage differentiation37,38, was higher in MPAL than AML-MP, consistent with the upregulated monocytic signatures (see Figure 6B). Notably, CEBPA and RUNX1 mRNA, both critical for myeloid differentiation39,40, was higher in AML while both low in AML-MP and MPAL. In contrast, mRNA expression of DNTT and LEF1, both involved in lymphoid commitment41,42, were significantly higher in MPAL than that in AML or AML-MP. In summary, AML-MP has higher levels of HSC transcription factors, while MPAL expresses higher levels of lymphoid transcription factors. Furthermore, expression of myeloid transcription factors appears downregulated in AML-MP.
FIGURE 7: Comparison of gene expression for master regulators of lineage commitment in AML, AML-MP, and MPAL.
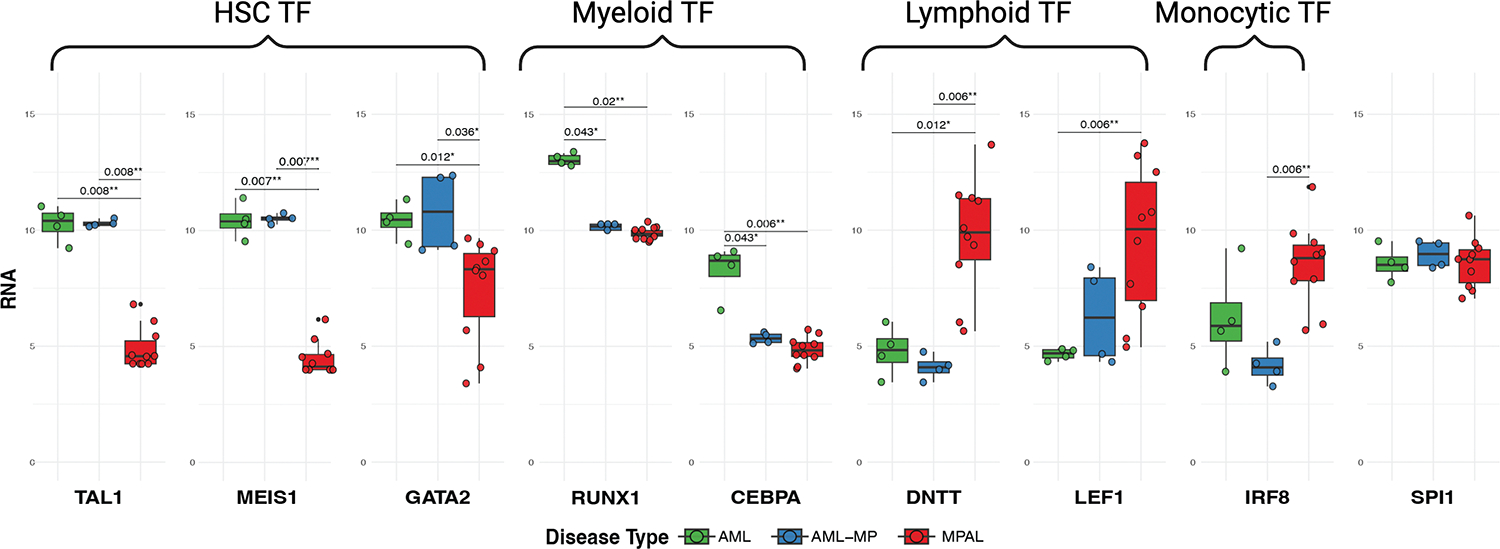
Significance values are adjusted p-values resulting from pairwise comparisons using DESeq2. HSC, hematopoietic stem cells; TF, transcription factor.
DISCUSSION
A genomic classification framework for acute leukemia with a mixed phenotype
Our study is the first to comprehensively compare the features of AML-MP and MPAL in a well-curated clinical cohort. The combined clinical, molecular, and transcriptomic analysis provides evidence that AML-MP clinically and biologically resembles its AML counterpart and differs from MPAL. Our study also better defines the boundary between AML-MP and MPAL, showing that patients with RUNX1 (with or without other MR) mutations have similar clinical outcomes to other MPAL patients in our cohort. Similarly, we find that adverse features of AML such as a complex karyotype may not confer inferior outcome in bona fide MPAL, in contrast to a recent report.43
Acute leukemias with a mixed phenotype in patients with a history of prior chemotherapy or radiation treatment warrant scrutiny. Our cohort demonstrates that TP53 mutations as a genetic driver are virtually absent in MPAL in keeping with the expectation that the majority of t-AML with a mixed phenotype and TP53 mutations will now be classified as AML-MP rather than MPAL. However, some of these patients may be classified as MPAL if the diagnostic criteria are met. The data from our study indicate that the presence of nodal disease and/or mutations enriched for T-ALL (e.g., NOTCH, JAK3) favors a diagnosis of MPAL than AML-MP in the setting of post-cytotoxic treatment.
We proposed a genomic classification framework to separate AML-MP from MPAL with a hierarchy of a cascade of genetic abnormalities: Translocation/fusions, TP53 mutations, MR cytogenetic abnormalities, and MR gene mutations (excluding RUNX1). Future studies are needed to clarify: 1) whether post-cytotoxic treatment KMT2A rearranged cases should be treated as AML or MPAL particularly in the era of MENIN directed targeted therapy44; 2) how cases with MR gene mutations should be best classified (e.g. if mutation numbers and/or combinations matter); 3) whether prior history particularly MDS or MDS/MPN may further help the classification of patients lack of any such class defining genetic abnormalities. While data presented here suggest not to reclassify MPAL into AML-MP solely based on RUNX1 mutations, our study is not poised to address whether RUNX1 mutations should be included in MR gene mutation list (a discrepancy between WHO 5th edition and ICC), which remains to be investigated by future studies.
Therapeutic approaches to acute leukemias with mixed phenotype
Although there is no consensus on MPAL treatment, several retrospective studies have shown that induction therapy with ALL-directed regimens is associated with superior outcomes.6–10 In contrast to the ALL-directed regimens recommended for MPALs, the standard induction regimen for AML-MP remains uncertain. Our study highlights a few unexpected but critical points. First, more than half of AML-MP patients were treated with intensive induction therapy. Second, a quarter of these AML-MP patients received ALL-directed regimens likely due to predominant proportion of lymphoid blasts. More importantly, our data show that AML-MP has inferior responses to ALL-directed treatment. Therefore, we provide the first line of evidence that AML-MP may be treated as AML regardless of the proportion of lymphoid vs myeloid components.
Mechanisms of lineage plasticity in MPAL and AML-MP
Our study implies that AML-MP and MPAL differ in biology despite share immunophenotypic heterogeneity. AML-MP differs from MPAL at mutational and transcriptomic levels. The primitive/HSC differentiation program is a shared feature between AML-MP and AML without MP, further supporting classifying AML-MP as AML rather than MPAL. In contrast, MPAL showed increased expression of lymphoid genes. Furthermore, MPAL but not AML-MP evolves to lymphoid lineage only phenotype during disease monitoring, suggesting different mechanisms for lineage plasticity between these two groups. Of note, expression of transcription factors involving in both myeloid and lymphoid lineage commitment is downregulated in AML-MP, a finding consistent with a recent report45. Loss of function RUNX1 mutations, enriched in AML-MP, may lead to these changes and result in lineage promiscuity46,47. Several studies have shown that immunophenotypically distinct blast compartments of MPAL harbor nearly identical genetic profile within a patient, and that cells from one lineage can reconstitute the alternate lineage in xenograft models,13,14suggesting that other factors beyond genetics may also contribute to phenotypic heterogeneity45. Future studies combining lineage tracing and single cell multi-omic technology will provide better insights into this intriguing biological process.48,49
Limitations of this study
Our study, conducted retrospectively at a single tertiary cancer center, may introduce inherent bias towards patients with more adverse risk profiles. While treatment approaches varied among subjects, we meticulously documented induction therapy details for most cases. Our multivariate analysis revealed that AML-MP shows poorer responses to ALL-directed regimens, underscoring the need for independent multi-centric validation studies. Although larger multicenter prospective studies to confirm the clinical implications of these findings are logistically challenging, they can be used immediately in the design of phase I and II trials as pre-specified subgroups. For agents targeting stem-like cells in particular, AML-MP is a particularly appealing target given the stem-like biology leading to the multilineage phenotype. In summary, our findings illuminate novel aspects of the pathogenesis and treatment of acute leukemias with a mixed phenotype, and provide a genomic framework for classification, prompting further exploration of this complex and clinically challenging area.
Supplementary Material
Key points:
AML-MP and MPAL are biologically distinct despite sharing features of mixed phenotype.
AML-MP and MPAL show differential responses to therapies.
Acknowledgement:
This study was funded in part through the NIH/NCI Cancer Center Support Grant P30 CA008748. P.G. and A.C. are supported by grants from Department of Pathology and Laboratory Medicine at MSKCC. R.L.L. is supported by a Cycle for Survival Innovation Grant and National Cancer Institute R35 CA197594. J.L.G. is supported by a National Cancer Institute grant K08CA230172 and Equinox Cycle for Survival. WX is supported by Alex’s Lemonade Stand Foundation and the Runx1 Research Program, a Cycle for Survival’s Equinox Innovation Award in Rare Cancers, MSK Leukemia SPORE (Career Enhancement Program, NIH/NCI P50 CA254838) and a National Cancer Institute grant K08CA267058.
Footnotes
Conflict of Interest:
M.A served as consultant for Janssen Global Services, Bristol-Myers Squibb, AstraZeneca, and Roche; and has received honoraria from Biocartis, Invivoscribe, physician educational resources (PER), Peerview Institute for medical education, clinical care options, RMEI medical education. RLL is on the supervisory board of Qiagen and is a scientific advisor to Imago, Mission Bio, Syndax. Zentalis, Ajax, Bakx, Auron, Prelude, C4 Therapeutics and Isoplexis for which he receives equity support. RLL receives research support from Ajax and Abbvie and has consulted for Incyte, Janssen, Morphosys and Novartis. He has received honoraria from Astra Zeneca and Kura for invited lectures and from Gilead for grant reviews. M.R. is on the scientific advisory board in Auron Pharmaceutical for which he received equity support. He receives research funding from Celularity, Roche-Genentech, Beat AML and NGM and travel fund from BD Biosciences. J.L.G. received consulting fees from GLG.W.X. has received research support from Stemline Therapeutics. P.G. has received research support from Paige.AI. M.B.G. has received research support from Sanofi, Amgen, and Actinium Pharmaceuticals, Inc., and has consulted for Novartis and Sanofi.
Part of this work was presented at USCAP 109th Annual Meeting 2020, Society for Hematopathology/ European Association for Hematopathology workshop 2020, American Society of Hematopathology Annual meeting 2021 and the first Workshop on Lineage infidelity/plasticity and cell of origin of hematologic malignancies 2022.
A preprint format is available at https://www.medrxiv.org/content/10.1101/2023.11.01.23297696v1
Data Availability statement
The RNA seq datasets generated and/or analyzed during the current study are available at GEO GSE275859.
References:
- 1.Weinberg OK et al. The International Consensus Classification of acute leukemias of ambiguous lineage. Blood 141, 2275–2277 (2023). 10.1182/blood.2022019493 [DOI] [PubMed] [Google Scholar]
- 2.Haematolymphoid Tumours. WHO Classification of Tumours. 5th edn, Vol. 11 (2024). [Google Scholar]
- 3.Kajal B & Chang H Acute myeloid leukemia with myelodysplasia-related changes demonstrating mixed-lineage phenotype. Blood 128, 1663–1663 (2016). 10.1182/blood-2016-06-723098 [DOI] [PubMed] [Google Scholar]
- 4.Klairmont MM, Cheng J & Gradowski JF AML with MDS-related changes and blasts of mixed lineage: time for a new provisional entity? Leuk Lymphoma 59, 2752–2754 (2018). 10.1080/10428194.2018.1443451 [DOI] [PubMed] [Google Scholar]
- 5.Matutes E et al. Mixed-phenotype acute leukemia: clinical and laboratory features and outcome in 100 patients defined according to the WHO 2008 classification. Blood 117, 3163–3171 (2011). 10.1182/blood-2010-10-314682 [DOI] [PubMed] [Google Scholar]
- 6.Hrusak O et al. International cooperative study identifies treatment strategy in childhood ambiguous lineage leukemia. Blood 132, 264–276 (2018). 10.1182/blood-2017-12-821363 [DOI] [PubMed] [Google Scholar]
- 7.Duong VH et al. Favorable outcomes of acute leukemias of ambiguous lineage treated with hyperCVAD: a multi-center retrospective study. Ann Hematol 99, 2119–2124 (2020). 10.1007/s00277-020-04179-z [DOI] [PubMed] [Google Scholar]
- 8.Orgel E et al. Mixed-phenotype acute leukemia: A cohort and consensus research strategy from the Children’s Oncology Group Acute Leukemia of Ambiguous Lineage Task Force. Cancer 126, 593–601 (2020). 10.1002/cncr.32552 [DOI] [PMC free article] [PubMed] [Google Scholar]
- 9.Rasekh EO et al. Acute lymphoblastic leukemia-like treatment regimen provides better response in mixed phenotype acute leukemia: a comparative study between adults and pediatric MPAL patients. Ann Hematol 100, 699–707 (2021). 10.1007/s00277-020-04354-2 [DOI] [PubMed] [Google Scholar]
- 10.Lazzarotto D et al. Multicenter retrospective analysis of clinical outcome of adult patients with mixed-phenotype acute leukemia treated with acute myeloid leukemia-like or acute lymphoblastic leukemia-like chemotherapy and impact of allogeneic stem cell transplantation: a Campus ALL study. Ann Hematol 102, 1099–1109 (2023). 10.1007/s00277-023-05162-0 [DOI] [PubMed] [Google Scholar]
- 11.Lancet JE et al. Phase 2 trial of CPX-351, a fixed 5:1 molar ratio of cytarabine/daunorubicin, vs cytarabine/daunorubicin in older adults with untreated AML. Blood 123, 3239–3246 (2014). 10.1182/blood-2013-12-540971 [DOI] [PMC free article] [PubMed] [Google Scholar]
- 12.Khoury JD et al. The 5th edition of the World Health Organization Classification of Haematolymphoid Tumours: Myeloid and Histiocytic/Dendritic Neoplasms. Leukemia 36, 1703–1719 (2022). 10.1038/s41375-022-01613-1 [DOI] [PMC free article] [PubMed] [Google Scholar]
- 13.Alexander TB et al. The genetic basis and cell of origin of mixed phenotype acute leukaemia. Nature 562, 373–379 (2018). 10.1038/s41586-018-0436-0 [DOI] [PMC free article] [PubMed] [Google Scholar]
- 14.Xiao W et al. PHF6 and DNMT3A mutations are enriched in distinct subgroups of mixed phenotype acute leukemia with T-lineage differentiation. Blood Adv 2, 3526–3539 (2018). 10.1182/bloodadvances.2018023531 [DOI] [PMC free article] [PubMed] [Google Scholar]
- 15.Takahashi K et al. Integrative genomic analysis of adult mixed phenotype acute leukemia delineates lineage associated molecular subtypes. Nat Commun 9, 2670 (2018). 10.1038/s41467-018-04924-z [DOI] [PMC free article] [PubMed] [Google Scholar]
- 16.Wang Q et al. Integrative genomic and transcriptomic profiling reveals distinct molecular subsets in adult mixed phenotype acute leukemia. Am J Hematol 98, 66–78 (2023). 10.1002/ajh.26758 [DOI] [PubMed] [Google Scholar]
- 17.Peretz CAC et al. Multiomic Single Cell Sequencing Identifies Stemlike Nature of Mixed Phenotype Acute Leukemia and Provides Novel Risk Stratification. bioRxiv, 2023.2005.2015.540305 (2023). 10.1101/2023.05.15.540305 [DOI] [Google Scholar]
- 18.Lindsley RC et al. Acute myeloid leukemia ontogeny is defined by distinct somatic mutations. Blood 125, 1367–1376 (2015). 10.1182/blood-2014-11-610543 [DOI] [PMC free article] [PubMed] [Google Scholar]
- 19.McCarter JGW et al. Interaction between myelodysplasia-related gene mutations and ontogeny in acute myeloid leukemia. Blood Adv 7, 5000–5013 (2023). 10.1182/bloodadvances.2023009675 [DOI] [PMC free article] [PubMed] [Google Scholar]
- 20.Boddu P et al. Treated secondary acute myeloid leukemia: a distinct high-risk subset of AML with adverse prognosis. Blood Adv 1, 1312–1323 (2017). 10.1182/bloodadvances.2017008227 [DOI] [PMC free article] [PubMed] [Google Scholar]
- 21.Arber DA et al. International Consensus Classification of Myeloid Neoplasms and Acute Leukemias: integrating morphologic, clinical, and genomic data. Blood 140, 1200–1228 (2022). 10.1182/blood.2022015850 [DOI] [PMC free article] [PubMed] [Google Scholar]
- 22.Swerdlow SH et al. WHO Classification of Tumours of Haematopoietic and Lymphoid Tissues, (2017). [Google Scholar]
- 23.Arber DA et al. International Consensus Classification of Myeloid Neoplasms and Acute Leukemias: integrating morphologic, clinical, and genomic data. Blood 140, 1200–1228 (2022). 10.1182/blood.2022015850 [DOI] [PMC free article] [PubMed] [Google Scholar]
- 24.Corces MR et al. Lineage-specific and single-cell chromatin accessibility charts human hematopoiesis and leukemia evolution. Nat Genet 48, 1193–1203 (2016). 10.1038/ng.3646 [DOI] [PMC free article] [PubMed] [Google Scholar]
- 25.Subramanian A et al. Gene set enrichment analysis: a knowledge-based approach for interpreting genome-wide expression profiles. Proc Natl Acad Sci U S A 102, 15545–15550 (2005). 10.1073/pnas.0506580102 [DOI] [PMC free article] [PubMed] [Google Scholar]
- 26.Liberzon A et al. Molecular signatures database (MSigDB) 3.0. Bioinformatics 27, 1739–1740 (2011). 10.1093/bioinformatics/btr260 [DOI] [PMC free article] [PubMed] [Google Scholar]
- 27.Jaatinen T et al. Global gene expression profile of human cord blood-derived CD133+ cells. Stem Cells 24, 631–641 (2006). 10.1634/stemcells.2005-0185 [DOI] [PubMed] [Google Scholar]
- 28.Valk PJ et al. Prognostically useful gene-expression profiles in acute myeloid leukemia. N Engl J Med 350, 1617–1628 (2004). 10.1056/NEJMoa040465 [DOI] [PubMed] [Google Scholar]
- 29.Takeda A, Goolsby C & Yaseen NR NUP98-HOXA9 induces long-term proliferation and blocks differentiation of primary human CD34+ hematopoietic cells. Cancer Res 66, 6628–6637 (2006). 10.1158/0008-5472.Can-06-0458 [DOI] [PubMed] [Google Scholar]
- 30.Gentles AJ, Plevritis SK, Majeti R & Alizadeh AA Association of a leukemic stem cell gene expression signature with clinical outcomes in acute myeloid leukemia. Jama 304, 2706–2715 (2010). 10.1001/jama.2010.1862 [DOI] [PMC free article] [PubMed] [Google Scholar]
- 31.Shivdasani RA, Mayer EL & Orkin SH Absence of blood formation in mice lacking the T-cell leukaemia oncoprotein tal-1/SCL. Nature 373, 432–434 (1995). 10.1038/373432a0 [DOI] [PubMed] [Google Scholar]
- 32.Robb L et al. Absence of yolk sac hematopoiesis from mice with a targeted disruption of the scl gene. Proc Natl Acad Sci U S A 92, 7075–7079 (1995). 10.1073/pnas.92.15.7075 [DOI] [PMC free article] [PubMed] [Google Scholar]
- 33.Ling KW et al. GATA-2 plays two functionally distinct roles during the ontogeny of hematopoietic stem cells. J Exp Med 200, 871–882 (2004). 10.1084/jem.20031556 [DOI] [PMC free article] [PubMed] [Google Scholar]
- 34.Suzuki N et al. Combinatorial Gata2 and Sca1 expression defines hematopoietic stem cells in the bone marrow niche. Proc Natl Acad Sci U S A 103, 2202–2207 (2006). 10.1073/pnas.0508928103 [DOI] [PMC free article] [PubMed] [Google Scholar]
- 35.Rosenbauer F et al. Lymphoid cell growth and transformation are suppressed by a key regulatory element of the gene encoding PU.1. Nat Genet 38, 27–37 (2006). 10.1038/ng1679 [DOI] [PubMed] [Google Scholar]
- 36.Nerlov C & Graf T PU.1 induces myeloid lineage commitment in multipotent hematopoietic progenitors. Genes Dev 12, 2403–2412 (1998). 10.1101/gad.12.15.2403 [DOI] [PMC free article] [PubMed] [Google Scholar]
- 37.Kurotaki D et al. IRF8 inhibits C/EBPα activity to restrain mononuclear phagocyte progenitors from differentiating into neutrophils. Nat Commun 5, 4978 (2014). 10.1038/ncomms5978 [DOI] [PubMed] [Google Scholar]
- 38.Sichien D et al. IRF8 Transcription Factor Controls Survival and Function of Terminally Differentiated Conventional and Plasmacytoid Dendritic Cells, Respectively. Immunity 45, 626–640 (2016). 10.1016/j.immuni.2016.08.013 [DOI] [PubMed] [Google Scholar]
- 39.Avellino R & Delwel R Expression and regulation of C/EBPα in normal myelopoiesis and in malignant transformation. Blood 129, 2083–2091 (2017). 10.1182/blood-2016-09-687822 [DOI] [PubMed] [Google Scholar]
- 40.Gerritsen M et al. RUNX1 mutations enhance self-renewal and block granulocytic differentiation in human in vitro models and primary AMLs. Blood Advances 3, 320–332 (2019). 10.1182/bloodadvances.2018024422 [DOI] [PMC free article] [PubMed] [Google Scholar]
- 41.Klein F et al. Dntt expression reveals developmental hierarchy and lineage specification of hematopoietic progenitors. Nat Immunol 23, 505–517 (2022). 10.1038/s41590-022-01167-5 [DOI] [PMC free article] [PubMed] [Google Scholar]
- 42.Travis A, Amsterdam A, Belanger C & Grosschedl R LEF-1, a gene encoding a lymphoid-specific protein with an HMG domain, regulates T-cell receptor alpha enhancer function [corrected]. Genes Dev 5, 880–894 (1991). 10.1101/gad.5.5.880 [DOI] [PubMed] [Google Scholar]
- 43.Kirtek T et al. Acute leukemias with complex karyotype show a similarly poor outcome independent of mixed, myeloid or lymphoblastic immunophenotype: A study from the Bone Marrow Pathology Group. Leukemia Research 130, 107309 (2023). 10.1016/j.leukres.2023.107309 [DOI] [PubMed] [Google Scholar]
- 44.Issa GC et al. The menin inhibitor revumenib in KMT2A-rearranged or NPM1-mutant leukaemia. Nature 615, 920–924 (2023). 10.1038/s41586-023-05812-3 [DOI] [PMC free article] [PubMed] [Google Scholar]
- 45.Mulet-Lazaro R et al. Epigenetic alterations affecting hematopoietic regulatory networks as drivers of mixed myeloid/lymphoid leukemia. Nature Communications 15, 5693 (2024). 10.1038/s41467-024-49811-y [DOI] [PMC free article] [PubMed] [Google Scholar]
- 46.Xiao W et al. Plasmacytoid dendritic cell expansion defines a distinct subset of RUNX1-mutated acute myeloid leukemia. Blood 137, 1377–1391 (2021). 10.1182/blood.2020007897 [DOI] [PMC free article] [PubMed] [Google Scholar]
- 47.Wang C et al. A Critical Role of RUNX1 in Governing Megakaryocyte-Primed Hematopoietic Stem Cell Differentiation. Blood Adv (2023). 10.1182/bloodadvances.2022008591 [DOI] [PMC free article] [PubMed] [Google Scholar]
- 48.Goyal Y et al. Diverse clonal fates emerge upon drug treatment of homogeneous cancer cells. Nature (2023). 10.1038/s41586-023-06342-8 [DOI] [PMC free article] [PubMed] [Google Scholar]
- 49.Zeller C et al. Adverse stem cell clones within a single patient’s tumor predict clinical outcome in AML patients. J Hematol Oncol 15, 25 (2022). 10.1186/s13045-022-01232-4 [DOI] [PMC free article] [PubMed] [Google Scholar]
Associated Data
This section collects any data citations, data availability statements, or supplementary materials included in this article.
Supplementary Materials
Data Availability Statement
The RNA seq datasets generated and/or analyzed during the current study are available at GEO GSE275859.