

ABSTRACT
Study Design
Cross‐sectional retrospective cohort study.
Objectives
Chronic low back pain (cLBP) is a major cause of disability worldwide, significantly affecting return to work (RTW). This study aimed to assess the biopsychosocial factors influencing occupational functioning in workers with cLBP using artificial intelligence (AI) data‐driven patient phenotyping.
Methods
Data of workers affected by cLBP were collected through a comprehensive assessment of demographic, clinical, and occupational factors. Hierarchical clustering was employed to identify distinct phenotypes based on patient‐reported outcome measures (PROMs), including the Oswestry Disability Index (ODI), Visual Analog Scale (VAS), Work Ability Index (WAI), Nordic score, and Patient Health Questionnaire‐2 (PHQ‐2). Independent t tests and Mann–Whitney U tests were used for phenotype profiling, distinguishing between continuous and categorical responses, respectively, to assess the most discriminative queries and highlight the most significantly different features (p < 0.05).
Results
A total of 304 patients were included in the analysis. The AI‐driven phenotyping approach identified two distinct clusters, representing 51% (Cluster 1) and 49% (Cluster 2) of the dataset. Compared to Cluster 1, Cluster 2 exhibited significantly higher absenteeism (17.00 vs. 5.22 days, p < 0.05), lower WAI (33.34 ± 6.84 vs. 38.96 ± 4.31, p < 0.05), worse pain‐related outcomes in terms of higher VAS (5.98 ± 2.06 vs. 4.48 ± 2.48, p < 0.05) and ODI (33.52 ± 16.56 vs. 20.08 ± 13.59, p < 0.05), more frequent occupational exposure to manual handling of loads (84% vs. 16%) and higher psychological distress assessed through PHQ‐2 (70% vs. 30%).
Conclusion
Our study identified the most relevant PROMs differentiating between cLBP clusters of patients, emphasizing different levels of absenteeism and pain‐related outcomes.
These findings contributed to unravel the data‐driven AI potential in suggesting personalized interventions targeting specific biopsychosocial profiles, which may improve clinical outcomes and occupational functioning in workers with cLBP, ultimately enhancing their overall well‐being.
Keywords: artificial intelligence, biopsychosocial model, chronic low back pain, clustering, phenotyping, PROMs, return‐to‐work, work‐related low back pain
This study aims to assess the biopsychosocial factors influencing occupational functioning in workers with chronic low back pain (cLBP) using AI data‐driven patient phenotyping. Demographic, clinical, and occupational factors were considered with hierarchical clustering to identify distinct phenotypes. Two distinct clusters of workers with cLBP were identified, with one group exhibiting significantly higher levels of absenteeism and more severe pain‐related outcomes. These findings may improve clinical outcomes and occupational functioning in workers with cLBP, ultimately enhancing their overall well‐being.
1. Introduction
Chronic low back pain (cLBP) is a prevalent musculoskeletal disorder and the leading cause of disability worldwide, affecting approximately 619 million people globally—an increase of 60% since 1990 [1]. Work‐related cLBP, acknowledged by the World Health Organization (WHO) as one of the top three occupational health concerns, constitutes a significant portion of global cLBP cases [2] and contributes to both high direct medical costs and substantial indirect costs from disability [3]. Approximately 37% of the total cLBP cases are attributed to occupational risk factors, particularly exposures to ergonomic stressors such as rapid work pace, repetitive motion patterns, inadequate recovery time, heavy lifting, non‐neutral body postures, application of mechanical pressure, vibration, or low temperature [4]. The economic burden of work‐related cLBP is further exacerbated by absenteeism, leading to productivity losses and financial burdens for employers, employees, and the healthcare system [5]. The socioeconomic impact of prolonged absenteeism due to cLBP is significant. Findings from a previous systematic review and meta‐analysis indicated that nearly one‐fifth of individuals in the workforce experiencing cLBP were absent from work for 6 months or more [6]. Moreover, as the duration of work absence and disability increased, the likelihood of returning to work decreased. Return to work (RTW) rates for patients with short‐term absence due to an acute LBP episode were reported to be between 80% and 90%. However, in cases of occupational cLBP, sustainable RTW rates ranged from 22% to 62% after a 2‐year period [6]. Given these factors, effective management of cLBP is essential to maintain and prevent any decline in workers' overall well‐being. However, the complexity of cLBP requires a comprehensive approach that goes beyond traditional methods focusing solely on physical factors [7]. The biopsychosocial model emphasizes the interplay of biological, psychological, and social elements in shaping cLBP outcomes, highlighting the need for tailored treatment strategies through stratified care, which categorizes patients based on key clinical characteristics to optimize treatment benefits while minimizing harm and enhancing cost‐effectiveness in healthcare [8, 9].
Recent advances in artificial intelligence (AI) offer new opportunities for managing cLBP by enabling deeper insights into the complex, multidimensional nature of patient data [10]. Among these, clustering, a well‐established unsupervised learning technique, has proven effective in identifying hidden patterns and subgroups within data without requiring manual annotations. In healthcare, clustering is commonly used to reveal patient phenotypes or disease subtypes and to suggest discriminative biomarkers [11]. While prior studies have primarily applied clustering to psychological, behavioral, or social dimensions of cLBP [12, 13, 14, 15, 16, 17], our study introduces a novel application of this method by exploring its potential to uncover phenotypes associated with occupational risk factors, a dimension that has received limited attention [18].
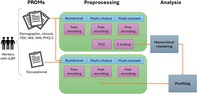
This study aimed to assess the biopsychosocial factors influencing the occupational functioning in workers with cLBP using AI‐driven patient phenotyping. A complete overview of the processing pipeline was reported in Figure 1. By applying clustering techniques to multidimensional PROMs, we seek to identify distinct subgroups of workers with varying levels of disability and specific characteristics that may contribute to work‐related disability. This data‐driven approach not only helps identify potential risk factors for long‐term absenteeism but also facilitates the development of targeted interventions to enhance treatment outcomes in cLBP and related musculoskeletal conditions. Gaining a comprehensive understanding of the biological, psychological, and social factors affecting occupational ability could contribute to refining clinical practice and supporting the personalization of treatment plans.
FIGURE 1.
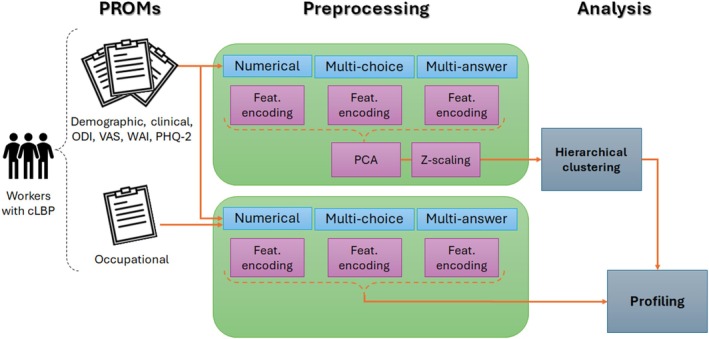
Workflow overview: PROMs were collected from workers suffering from cLBP during the first visit. Each questionnaire was preprocessed separately for features encoding, reduction, and normalization. Two slightly different preprocessing modalities were employed before clustering and profiling. The encoded questionnaire was ultimately employed for patient profiling according to the predicted cluster labels. Occupational queries were used for profiling only. CLBP, chronic low back pain; PCA, principal component analysis; PHQ‐2, Patient Health Questionnaire 2; PROM, patient‐reported outcome measure; ODI, Oswestry Disability Index; VAS, Visual Analog Scale; WAI, Work Ability Index.
2. Methods
2.1. Study Design
This observational study was conducted in accordance with the Declaration of Helsinki and approved by the Ethics Committee of Campus Bio‐Medico University of Rome (approval number: 76/19 OSS ComEt CBM).
2.2. Study Population
Workers affected by cLBP were recruited from the Fondazione Policlinico Universitario Campus Bio‐Medico outpatient clinic between January 2020 and April 2022. Eligible patients were those presenting a diagnosis of cLBP without signs of radiculopathy. Only information from the first medical examination was considered.
Patients were excluded if they had a history of spinal surgery, trauma, tumors, infections, or if their questionnaire data were incomplete.
2.3. Clinical Variables
Data collection was conducted through a multidimensional assessment during the initial medical examination. The assessment covered demographic and employment data, occupational exposure, and clinical history. Demographic and employment data included age, sex, educational level, job type, and work environment characteristics, including shift patterns and commuting methods. The section on occupational exposure focused on potential workplace risk factors, including manual handling of loads, awkward postures, and sedentary conditions, as well as any related medical prescriptions or restrictions. The clinical history section gathered information about the onset and cause of back pain, treatment history, and relevant physical and neurological assessments conducted during the examination.
Patient‐reported outcomes were assessed using a set of validated tools, including the Oswestry Disability Index (ODI) for evaluating functional disability; the Visual Analog Scale (VAS) for measuring pain intensity; the Work Ability Index (WAI) for assessing work capacity; the WHO Well‐Being Index (WHO‐WBI) for assessing overall well‐being; the Pittsburgh Sleep Quality Index (PSQI) for evaluating sleep quality; the Nordic score for assessing musculoskeletal health; and the Patient Health Questionnaire‐2 (PHQ‐2) for screening depressive symptoms.
2.4. Dataset Preprocessing
Each questionnaire was preprocessed separately for feature encoding. Two slightly different encoding procedures were employed before cluster identification and statistical description (Figure 1). In general, three different types of questions were identified and manually labeled as open‐ended, multiple‐choice, or multiple‐answer. The open‐ended queries were divided into numerical and free‐text questions: the former were regarded as discrete numerical features, while the latter were discarded due to excessive variability and subjectivity of the answers. The multiple‐choice questions were treated as categorical features, assigning to each possible answer a numerical code, which preserved, where applicable, the order relationship of the relative answers (e.g., 1—“I do not carry out any kind of exercise/physical activity”; 5—“I do exercise/physical activity daily for more than 30 min”). Besides, the missing values of some multiple‐choice queries were handled by assigning them a specific code as well, if they were informative about the absence of a certain clinical condition, such as comorbidities. Regarding multiple‐answer questions, the one‐hot encoding approach was employed, assigning a binary column to each of the possible answers. This method allowed the subsequent AI algorithms to focus on the relevance of each single answer in detecting the underlying clusters.
After the encoding step, principal component analysis (PCA) was applied for feature reduction, guaranteeing 95% of the variance to be explained, and each feature column was then normalized through z‐scaling, ensuring zero‐mean and unit variance distributions, to avoid bias effects due to different scales of variations. Furthermore, as both WHO‐WBI and PSQI questionnaires began to be administered halfway through the data collection phase, they presented an excessive percentage of missing values (i.e., 44%) and were discarded for further analysis.
The preprocessing steps adopted before profiling slightly differed from the previous ones; in particular, the one‐hot encoding was employed for both multi‐choice and multi‐answer questions, to achieve a more fine‐grained statistical description addressing each single answer, rather than the overall distribution of answers within each question. Besides, neither feature reduction nor normalization was applied to preserve the consistency of the distribution of numerical features in the statistical description.
2.5. Agglomerative Clustering
To explore the hidden patterns within seemingly uniform datasets, clustering is the most suitable AI approach [19]. Among the several clustering algorithms available, the hierarchical approach stands out for its versatility and adaptability. Unlike other methods, the hierarchical approach needs no prior knowledge about the number of clusters to group data into; besides, dendrograms are easy to interpret. This feature proves invaluable, especially when dealing with complex datasets where the optimal number of clusters is not readily apparent. Instead, hierarchical clustering enables the iterative organization of data points into clusters, refining the partitioning based on chosen optimization metrics [11]. We employed the Silhouette score and the Calinski–Harabasz Index (CHI), accounting for internal coherence and separation between clusters in terms of distance and variance, respectively.
The Silhouette score is a commonly used metric to evaluate clustering quality without requiring ground truth labels. It assesses how similar a data point is to its own cluster compared to other clusters. For a given sample x i , it uses:
: the average distance to other points within the same cluster (intra‐cluster distance)
: the average distance to points in the nearest neighboring cluster (nearest‐cluster distance).
The Silhouette score is then defined as:
This score ranges from −1 to 1. A score near 1 indicates that the sample is well clustered, while a score near −1 suggests a misclassification. Silhouette plots provide a graphical representation of these scores, grouped and sorted by cluster.
The CHI measures clustering performance by evaluating the ratio of between‐cluster dispersion to within‐cluster dispersion. It is defined as:
where N is the total number of data points, k is the number of clusters, c̄ i is the centroid of cluster i, c is the overall data centroid, n i is the number of points in cluster i, d(·, ·) is the distance metric (e.g., Euclidean).
A higher CHI value indicates better‐defined and more distinct clusters. This metric is typically used alongside others to compare clustering performance.
We clustered our data using the Euclidean metric and Ward's linkage method, excluding the occupational section of the questionnaire to avoid bias. Notably, occupational variables were explicitly excluded from the clustering input to avoid circular reasoning and ensure that the resulting groups would emerge from biopsychosocial characteristics alone. This strategy allowed us to explore whether spontaneous patterns in PROMs and clinical features would reflect real‐world differences in work ability and exposure. The fact that such occupational distinctions emerged ex post across clusters strengthens the interpretability and translational relevance of our findings, supporting the validity of our unsupervised, data‐driven approach. Following hierarchical clustering, we iteratively pruned the dendrogram at various heights to generate clusters ranging in number from two to seven. The optimal number of clusters was determined by selecting the solution that yielded the best metric scores.
2.6. Statistical Analysis
The statistical characterization of the underlying clusters was achieved by selecting the queries most sensitive to group distinction based on p values. For each question throughout the questionnaire, we assessed the significance of the differences in terms of answer distribution within the clusters. In particular, for continuous responses of open queries, we performed an independent t‐test. For categorical responses, we used a Mann–Whitney U test in two different ways: for multiple‐choice questions with single answers, we compared the distributions of the encoded responses, while for multiple‐choice questions with multiple answers, we compared the binary distributions of each possible response selection through one‐hot coding (e.g., whether each of the possible comorbidities was a cluster‐ distinguishing feature).
The answers to the questions whose distribution passed the hypothesis test (p < 0.05) were reported. The mean values within each cluster were reported to describe continuous variables. With regard to categorical one‐hot encoded answers, we reported the percentages of patients who selected that response while belonging to a specific cluster in two ways: as a percentage over the cluster and as a percentage over the entire dataset. In more detail, on the left side of Figures 5, 6, 7, 8, 9, we displayed the percentage of patients across clusters relative to the total number of patients who provided a given response. On the right side of these panels, the same cluster counts were shown, but relative to the total number of patients in the dataset, thereby highlighting the overall proportion of subjects who selected each response.
FIGURE 5.
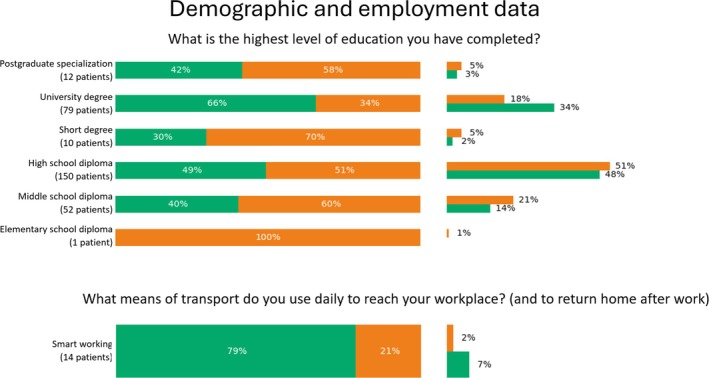
Percentage values of categorical features pertaining demographic and employment data which were significantly relevant for phenotyping. For each answer, we reported the percentage over the number of patients who selected that option (left), as well as the percentage over the number of patients belonging to the cluster (right).
FIGURE 6.
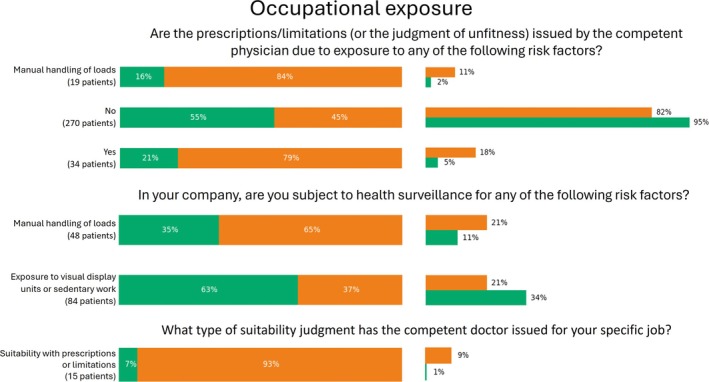
Percentage values of categorical features pertaining occupational exposure which were significantly relevant for phenotyping. For each answer, we reported the percentage over the number of patients who selected that option (left), as well as the percentage over the number of patients belonging to the cluster (right).
FIGURE 7.
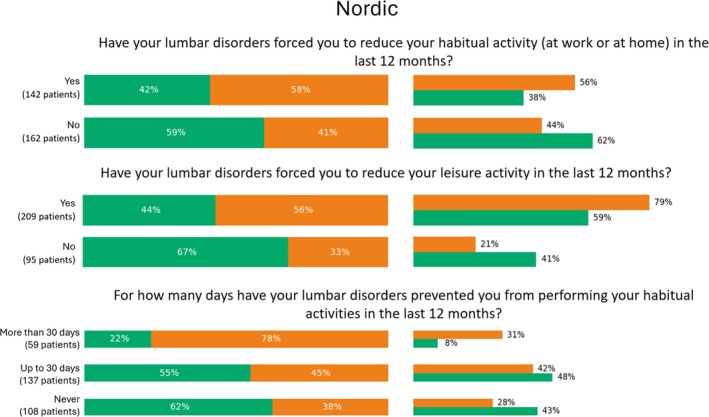
Percentage values of categorical features pertaining the Nordic score which were significantly relevant for phenotyping. For each answer, we reported the percentage over the number of patients who selected that option (left), as well as the percentage over the number of patients belonging to the cluster (right).
FIGURE 8.
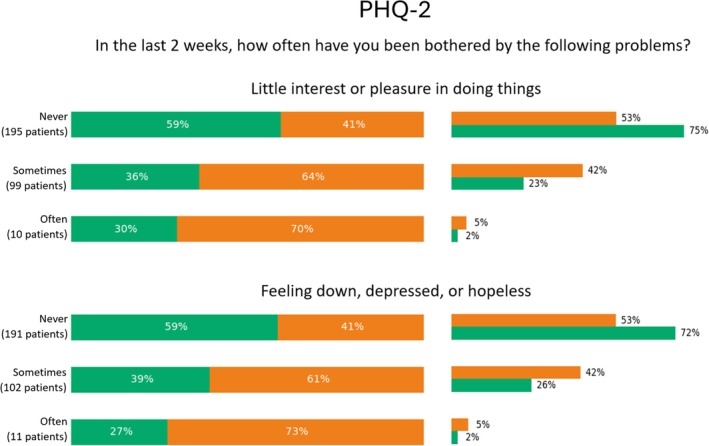
Percentage values of categorical features pertaining the Patient Health Questionnaire (PHQ)‐2 section which were significantly relevant for phenotyping. For each answer, we reported the percentage over the number of patients who selected that option (left), as well as the percentage over the number of patients belonging to the cluster (right).
FIGURE 9.
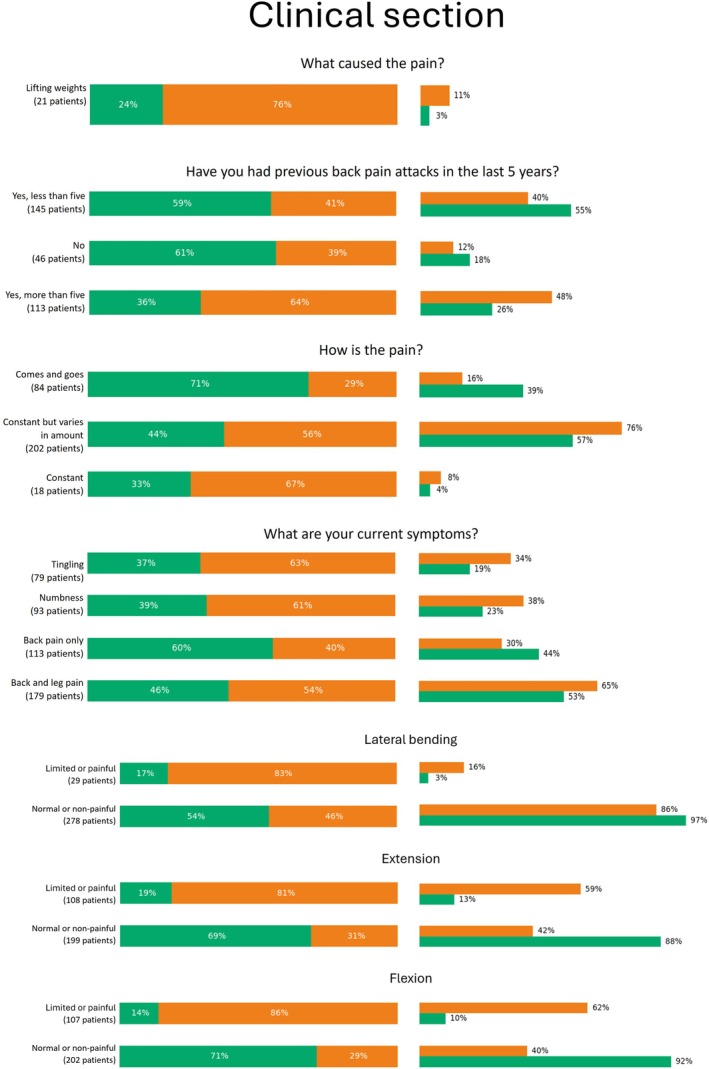
Percentage values of categorical features pertaining clinical section which were significantly relevant for phenotyping. For each answer, we reported the percentage over the number of patients who selected that option (left), as well as the percentage over the number of patients belonging to the cluster (right).
3. Results
A total of 304 patients affected by cLBP were included in the study. The mean age of the patients was 47.6 ± 9.5 years. Of these, 40.5% were female (n = 123) and 59.5% were male (n = 181). The average BMI was 25.8 ± 4.4, with 42.4% classified as having a healthy weight (n = 129), 38.2% as overweight (n = 116), 17.1% as obese (n = 52), and 2.3% as underweight (n = 7). Regarding marital status, 62.8% were married or in a common‐law marriage (n = 191), while 37.2% were not married, divorced, or widowed (n = 113). In terms of education, 49.4% (n = 150) had completed high school, 33.2% (n = 101) had a university degree or postgraduate education, and 17.4% (n = 53) had lower or middle school education. The main demographic characteristics of the included patients are summarized in Table 1.
TABLE 1.
Demographic and social characteristics of the participants.
| Characteristics | Total n (%) |
|---|---|
| Sex | |
| Female | 123 (40.5) |
| Male | 181 (59.5) |
| Age | |
| < 25 | 6 (2.0) |
| 25–34 | 27 (8.9) |
| 35–44 | 72 (23.7) |
| 45–54 | 122 (40.1) |
| 55+ | 77 (25.3) |
| Marital status | |
| Married or common‐law marriage | 191 (62.8) |
| Not married, divorced or widowed | 113 (37.2) |
| Education | |
| Lower/middle school | 53 (17.4) |
| High school | 150 (49.4) |
| University graduate or postgraduate | 101 (33.2) |
| BMI (kg/m2) | |
| Underweight (< 18.0) | 7 (2.3) |
| Healthy weight (18.0–25.0) | 129 (42.4) |
| Overweight (25.0–30.0) | 116 (38.2) |
| Obese (> 30.0) | 52 (17.1) |
Abbreviation: BMI, body mass index.
Table 2 reports the number of variables obtained for each questionnaire section following feature encoding and before the application of PCA.
TABLE 2.
Clustering feature count.
| Questionnaire section | Number of features |
|---|---|
| Demographic and employment | 29 |
| Clinical history | 71 |
| Nordic score | 10 |
| WAI | 58 |
| PHQ‐2 | 2 |
| ODI | 11 |
| VAS | 1 |
Abbreviations: ODI, Oswestry Disability Index; PHQ‐2, Patient Health Questionnaire 2; VAS, Visual Analog Scale; WAI, Work Ability Index.
Using hierarchical agglomerative clustering, two distinct clusters of patients were identified as the optimal grouping, accounting for 51 (n = 155) and 49% (n = 149) of the total sample, respectively (Figure 2). The detailed metric scores obtained for different numbers of clusters were reported as Supporting Information. The spatial distribution of these clusters was visualized using the uniform manifold approximation and projection (see Ref. [20]) method, to visualize potential local structures and to provide a more intuitive 2D representation of the clustering results (see Figure 3). UMAP visualization, unlike PCA, attempts to preserve the local neighborhood relationships in the high‐dimensional space (including all PCA components used), which may reveal structures not visible in linear projections. As can be seen, the vertical axis of Figure 3 shows some separation of data points, which, despite not being directly interpretable, motivated further analyses to assess which features contributed most to cluster distinction.
FIGURE 2.
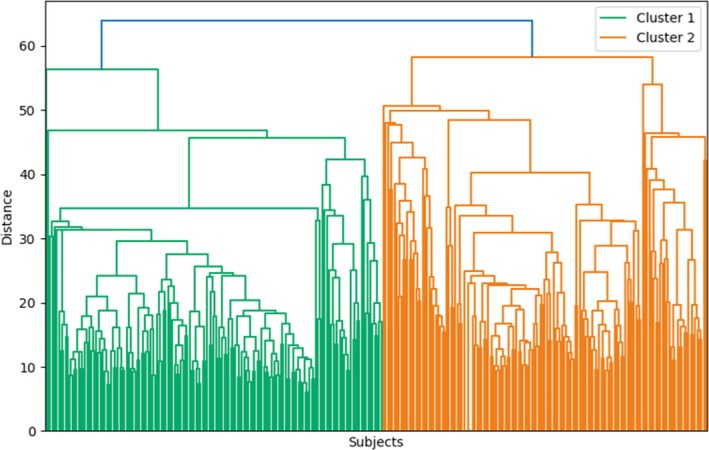
Hierarchical clustering dendrogram.
FIGURE 3.

Uniform manifold approximation and projection bidimensional scatterplot.
The main significant differences between the two clusters are listed in Table 3, while the main demographic characteristics of the two clusters, despite not being significant for group distinction, are reported in Table 4.
TABLE 3.
Chronic low back pain phenotype profiling.
| Cluster 1 | Cluster 2 | |
|---|---|---|
| Disability level | Low | High |
| Pain intensity | Low | High |
| Pain frequency | Transient | Constant |
| Work ability | High | Low |
| Work environment | Sedentary | Active |
| Education level | High | Low |
| Psychological impact | Minor | Major |
| Symptoms | Localized | Widespread |
| Functionality | Normal | Impaired |
| Occupational functioning | High | Low |
TABLE 4.
Demographic and social characteristics of the two clusters.
| Characteristics | Mean cluster 1 | Mean cluster 2 | p |
|---|---|---|---|
| Sex (%) | |||
| Female | 0.37 | 0.44 | 0.272 |
| Male | 0.63 | 0.56 | 0.272 |
| Age (years) | 47.30 | 47.92 | 0.572 |
| Marital status (%) | |||
| Single | 0.31 | 0.26 | 0.704 |
| Married or cohabiting | 0.59 | 0.65 | 0.704 |
| Separated/divorced/widowed | 0.09 | 0.09 | 0.704 |
| Education (%) | |||
| Primary school | 0.01 | 0.01 | 0.885 |
| Middle school | 0.04 | 0.04 | 0.885 |
| Secondary school diploma | 0.41 | 0.42 | 0.885 |
| Bachelor's degree | 0.17 | 0.18 | 0.885 |
| Master's degree or higher | 0.36 | 0.35 | 0.885 |
| Weight (kg) | 77.59 | 77.31 | 0.882 |
| Height (cm) | 173.73 | 172.03 | 0.154 |
Participants in Cluster 2 demonstrated higher absenteeism rates compared to those in Cluster 1. On average, they reported more absences across different timeframes, including the past week (1.15 vs. 0.34 days), past month (4.36 vs. 1.50 days), past 3 months (7.52 vs. 2.63 days), and past 12 months (17 vs. 5.22 days).
Cluster 2 was also associated with higher levels of disability, as demonstrated by significantly different outcomes in pain levels, global disability, and work ability (p < 0.05). Figure 4 shows that patients in Cluster 2 exhibited higher VAS (5.98 ± 2.06 vs. 4.48 ± 2.48), higher ODI (33.52 ± 16.56 vs. 20.08 ± 13.59), and lower WAI scores (33.34 ± 6.84 vs. 38.96 ± 4.31) compared to Cluster 1. In addition, WAI and ODI appeared to be inversely proportional, consistent with previous analyses [21].
FIGURE 4.
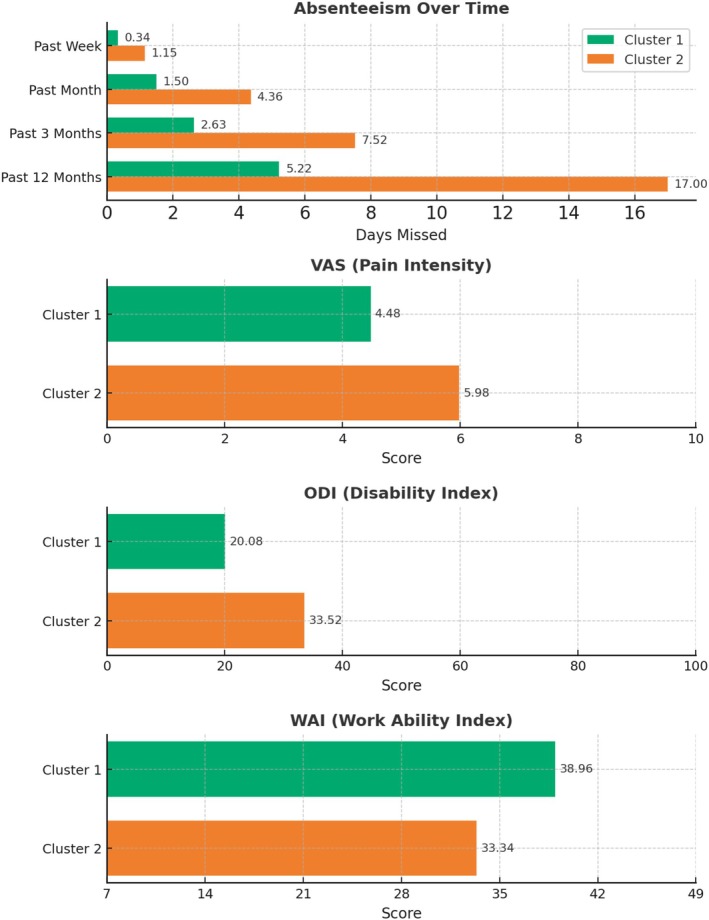
Mean values of numerical features significantly relevant for phenotyping. The top panel shows the occupational exposure items related to absenteeism. The second, third, and fourth panels from the top display the mean values of pain intensity, disability, and work ability scores, in both clusters, respectively.
Education level also played a role in cluster differentiation. As illustrated in Figure 5, there was a trend showing that patients with higher educational levels were more likely to be classified in Cluster 1. However, this trend was not uniform, with some discontinuities observed for short degrees and postgraduate degrees, likely due to small sample sizes in these subgroups (e.g., 10 and 12 patients, respectively).
Regarding work environment, patients in Cluster 1 were more likely to engage in sedentary or remote work activities, with 79% working remotely without commuting to the workplace (Figure 5), and 63% reporting exposure to video terminals and/or sedentary work (Figure 6). In contrast, patients in Cluster 2 were predominantly prescribed medications or work limitations due to occupational risk factors. Notably, 79% of patients receiving such prescriptions or deemed unsuitable for specific tasks by an occupational physician were found in Cluster 2. Manual handling of loads emerged as a significant risk factor distinguishing the two clusters (p < 0.05), with 84% of patients in Cluster 2 exposed to this risk, compared to only 16% in Cluster 1.
Health surveillance also differed between the clusters. Patients in Cluster 2 were more likely to be monitored for risks associated with manual handling of loads, while patients in Cluster 1 were more frequently monitored for risks related to sedentary work. Among patients who identified weightlifting as the primary cause of their pain, 76% were classified in Cluster 2 (Figure 9). Moreover, 93% of patients who received partial, temporary, or permanent suitability for work, with associated limitations prescribed by an occupational physician, were also found in Cluster 2.
According to the Nordic score results (Figure 7), patients in Cluster 2 reported greater limitations in their daily routines due to cLBP over the past 12 months. Among those who experienced reduced work or leisure activities in the last year, 58% and 56% belonged to Cluster 2, while 42% and 44% were part of Cluster 1. While statistically significant, this imbalance was moderate, suggesting that these questions might not strongly differentiate between the two clusters. In addition, 78% of workers reporting functional limitations due to lumbar discomfort for more than 30 days in the past year were classified in Cluster 2, while those with limitations lasting up to 30 days or no significant limitations were more frequently found in Cluster 1 (55% and 62%, respectively).
The PHQ‐2 results (Figure 8) highlighted a greater psychological impact on patients in Cluster 2. Specifically, 70% of patients who frequently reported little interest or pleasure in activities and 64% who sometimes reported these feelings belonged to Cluster 2. Similarly, 73% of patients who frequently felt depressed and 61% who sometimes felt depressed over the past 2 weeks were part of Cluster 2. In contrast, 59% of those who never reported such psychological symptoms were classified in Cluster 1.
In terms of clinical symptoms, Figure 9 shows that Cluster 1 had fewer patients reporting previous episodes of LBP (59% and 61%, respectively), whereas Cluster 2 had more patients reporting over five episodes. Pain intensity and frequency also differed, with Cluster 2 associated with more constant pain and Cluster 1 with transient pain. Patients reporting additional symptoms such as tingling or numbness were more likely to belong to Cluster 2 (> 60%). Conversely, those reporting only LBP were more frequently found in Cluster 1 (60% vs. 40%). Movement limitations were more common in Cluster 2, particularly in lateral bending (83%), extension (81%), and flexion (86%). Normal movement capacity was more frequently observed in Cluster 1. Approximately 60% of patients in Cluster 2 reported impairments in both extension and flexion. Reflexes were normal across clusters, but pain tenderness of the spinal processes and sacroiliac joints were more common in Cluster 2 (53% and 66%, respectively).
4. Discussion
cLBP poses a complex challenge in occupational health as it is the leading cause of disability and work absenteeism globally, characterized by significant variability in its impact on individuals [22]. Our study aimed to uncover the underlying phenotypes within a seemingly homogeneous cohort of workers with cLBP using clustering techniques on PROMs to assess the biopsychosocial factors influencing the occupational aspects. The results revealed two distinct clusters, each associated with different levels of disability, working conditions, and psychological impact [18, 23, 24, 25].
Patients in Cluster 1 reported fewer sick leaves and exhibited higher WAI scores, indicating a lower degree of work disability. This group also had lower levels of reported pain and functional disability, as evidenced by better scores on both the VAS and the ODI. This suggests a higher potential for RTW due to better functional capacity and less interference from pain‐related issues. Moreover, Cluster 1 displayed higher educational attainment. There was a noticeable trend showing that patients with higher levels of education were more likely to be classified in Cluster 1. Specifically, individuals with university degrees or postgraduate education were predominantly found in this cluster. This aligns with previous research [18], suggesting that higher education levels are associated with better health outcomes. Higher educational attainment may contribute to increased health literacy, better access to healthcare resources, and occupations that are less physically demanding, all of which can support recovery and enhanced work ability [20].
In contrast, Cluster 2 displayed significantly worse outcomes. Higher absenteeism rates in this group were accompanied by lower work ability compared to Cluster 1. Patients in Cluster 2 also reported more intense and constant pain, as reflected by worse VAS and ODI scores. These patients were more likely to be involved in physically demanding jobs, such as manual labor, which could exacerbate their condition, leading to prolonged work absences and greater difficulty returning to work. Educational attainment in Cluster 2 was generally lower, with a higher proportion of patients having only completed lower or middle school education. This lower educational level may be associated with employment in more physically demanding jobs, such as manual labor, which increases exposure to ergonomic risk factors and can exacerbate cLBP symptoms [26, 27]. The physical demands and poorer ergonomic conditions at work may contribute to prolonged work absences and greater difficulty returning to work.
Our data revealed a significant discrepancy between the two clusters in terms of pain intensity and frequency. Patients in Cluster 2 reported experiencing constant pain, unlike the transient pain observed in Cluster 1. This difference was particularly noteworthy as it suggested that the nature of pain in these patients may have been closely linked to their lifestyle and work environment, potentially serving as indicators of the type of worker and the specific conditions that healthcare providers need to address. The constant pain experienced by Cluster 2 patients indicated a more severe and persistent condition, possibly exacerbated by continuous exposure to physical stressors and poor ergonomic practices, which are common in manual labor roles [26]. This chronicity not only highlighted the need for intensive medical and ergonomic interventions but also suggested a broader spectrum of contributing factors, including psychological and social elements.
In contrast, the transient pain reported by Cluster 1 patients was likely influenced by less frequent exposure to such stressors, possibly due to more sedentary or remote work, which might facilitate quicker recovery and less frequent pain episodes. Besides, within Cluster 2, some patients were characterized by constant but variable‐intensity pain. The literature suggested that pain flares are best understood as a multidimensional experience characterized by domains other than pain [28]. To better understand this variability, it would be beneficial to include answer options that inquire whether the experienced pain fluctuations were toward higher or lower intensities. This approach could help to better understand the nature and impact of pain fluctuations.
Another significant distinction between the two clusters lies in the type of symptoms reported. Patients in Cluster 1 predominantly experienced isolated LBP, suggesting a more localized issue. In contrast, Cluster 2 patients exhibited a broader range of symptoms, including tingling or numbness, reported by more than half of this group. While the co‐occurrence of both back and leg pain was observed in both clusters, it did not distinctly favor one cluster over the other, indicating that this particular symptom pattern was less effective for differentiating between the identified phenotypes. Functional limitations or discomfort during movement were more prevalent in Cluster 2. Specifically, patients in this cluster reported significant difficulties with lateral bending, extension, and flexion. In contrast, Cluster 1 had a higher incidence of normal movement, indicating fewer functional impairments. Interestingly, pain elicited by digital pressure on the spinal processes and sacroiliac joints was similarly distributed across both clusters. However, deficits were more common in Cluster 2, indicating a higher prevalence of localized tenderness in this group. Despite these increased pain reports and movement limitations, neurological function remained within normal limits for Cluster 2.
Specific PROMs such as ODI, VAS, WAI, and PHQ‐2 were particularly effective in distinguishing between clusters. Higher ODI scores in Cluster 2 indicated greater functional impairment, while higher VAS scores reflected more intense pain experiences, confirming findings reported in the literature [29]. The WAI scores were notably lower in this group, suggesting diminished work capacity, which corroborated the higher rates of absenteeism observed. Psychological distress, as measured by the PHQ‐2, was more prominent in Cluster 2, with 70% of these patients reporting symptoms of depression. This aligned with findings by Tsuji et al. [30], who demonstrated that patients with cLBP and concurrent depression experienced markedly higher pain severity, reduced quality of life, and increased healthcare utilization. The significant psychological component identified in Cluster 2 highlighted the importance of a biopsychosocial approach in managing cLBP, which was in line with other studies [31, 32]. Addressing psychological issues alongside physical symptoms is crucial for improving patient well‐being and enhancing occupational functioning. Future research should focus on exploring the interplay between psychological factors and chronic pain to develop more effective, holistic treatment strategies.
The distinct phenotypes suggest that a generalized treatment approach is insufficient for effectively managing cLBP. Instead, interventions should be stratified based on the specific needs of each cluster. For Cluster 1, strategies could focus on maintaining work ability and preventing pain recurrence through ergonomic adjustments and regular physical activity. For Cluster 2, comprehensive management involving physical rehabilitation and psychological support is critical to address the multifaceted nature of their condition. This could include cognitive behavioral therapy, pain management programs, and workplace modifications to reduce exposure to risk factors. However, it is important to recognize that the identification of distinct phenotypic profiles—while a promising step toward personalized care—does not provide evidence that these profiles will predict differential treatment response. As emphasized by Hodges et al. [33], phenotyping approaches can suggest plausible treatment targets, but the predictive nature of a specific biomarker profile must be formally evaluated in randomized controlled trials before it can be used to inform clinical decisions. In particular, the distinction between a predictive biomarker that is an “effect modifier” (i.e., modifies the treatment effect) versus a “treatment target” (i.e., the characteristic that is actively addressed by the treatment) is critical. For instance, pain severity or psychological distress may appear as defining features of a phenotype, but it remains unknown whether they influence treatment efficacy or are simply markers of a worse overall prognosis. Therefore, while the current phenotypic stratification provides a rationale for tailored intervention development, further research is essential to test whether these subgroups benefit from matched treatments in practice. The complexity of cLBP, and the diversity of contributing biopsychosocial factors, underscore the necessity of large, collaborative datasets and innovative trial designs—such as adaptive platform trials or SMART designs—to accelerate clinical validation and implementation of predictive biomarkers in care pathways [33].
Nonetheless, this study further underlined the escalating potential of AI applications in orthopedic care and research. Previous evidence has demonstrated the capacity of AI to integrate and analyze complex, multidimensional data, ranging from PROMs and imaging to text and biomechanics, to uncover latent phenotypes and therapeutic targets. In a previous systematic review of AI‐based decision support systems for degenerative lumbar spine disorders, a remarkably high diagnostic and prognostic performance was found across tasks such as clinical score generation, patient assessment, and eligibility prediction [34]. Meanwhile, natural language processing techniques have begun to automate the extraction of clinically meaningful features from unstructured text (e.g., clinical notes, patient narratives), although available spine‐focused studies remain preliminary, with small cohorts and heterogeneous methodologies that limit generalizability [35]. Similarly, AI‐driven computer‐aided diagnosis and computer vision in cLBP have shown the unprecedented capacity to automatically and reliably identify and segment spinal structures from different imaging modalities, with a high degree of accuracy and promising translational potential [10, 36]. However, these successes must be balanced against real‐world challenges. Many high‐performing models are “black boxes,” impeding clinician trust and regulatory approval [37]. Training datasets often underrepresent key demographic groups, introducing bias that can exacerbate health disparities [38]. Ethical and legal issues, including patient consent for data reuse, secure handling of sensitive health information, and responsibility for AI‐driven decisions, demand rigorous frameworks before widescale deployment [39]. Ultimately, AI should complement—not replace—the orthopedic surgeon's expertise, serving as a catalyst for hypothesis generation, risk stratification, and personalized care.
While our study offered valuable insights into the distinct phenotypes of cLBP and their implications for personalized treatment strategies, several limitations should be acknowledged. First, the cross‐sectional design of the study prevented us from drawing conclusions about causal relationships between psychological factors, pain severity, and work capacity. Longitudinal studies would be required to better understand the dynamic interactions between these variables over time. Second, the relatively small sample size may have limited the generalizability of our findings. The imbalance in the distribution of responses across certain questionnaire items further underscored the need for a larger, more diverse cohort in future research to achieve stronger and more representative evidence.
5. Conclusions
Our study identified two distinct clusters of workers with cLBP, emphasizing a subset of PROMs that most effectively differentiated between these groups. These targeted measures not only support more efficient assessments and accurate patient classification but also underscore the value of focused PROMs in enhancing patient phenotyping. By disentangling the complex interactions among physical, psychological, and social factors in cLBP, our findings contribute to the development of more individualized treatment strategies. Specifically, we propose a distinction between preventive and comprehensive therapeutic approaches tailored to the needs of different cLBP phenotypes. The use of an AI‐driven methodology allowed for a nuanced evaluation of the biopsychosocial impact of cLBP on occupational functioning, offering insights to inform more precise and effective clinical decision‐making.
Supporting information
Data S1: Supporting Information.
Acknowledgments
Open access publishing facilitated by Universita Campus Bio‐Medico di Roma, as part of the Wiley ‐ CRUI‐CARE agreement.
Giaccone P., de Rinaldis E., D'Antoni F., et al., “Exploring the Biopsychosocial Impact of Chronic Low Back Pain in Workers Through Artificial Intelligence‐Driven Phenotyping,” JOR Spine 8, no. 3 (2025): e70110, 10.1002/jsp2.70110.
Funding: This work was supported by Istituto Nazionale per l'Assicurazione Contro Gli Infortuni sul Lavoro (BRIC‐2022 ID28‐ID30) and NextGenerationEU (NRRP M6C2‐PNRR‐MAD‐2022‐12376692_VADALA).
Contributor Information
Federico D'Antoni, Email: f.dantoni@unicampus.it.
Fabrizio Russo, Email: fabrizio.russo@policlinicocampus.it.
References
- 1. Wu A., March L., Zheng X., et al., “Global Low Back Pain Prevalence and Years Lived With Disability From 1990 to 2017: Estimates From the Global Burden of Disease Study 2017,” Annals of Translational Medicine 8, no. 6 (2020): 299. [DOI] [PMC free article] [PubMed] [Google Scholar]
- 2. Jegnie M. and Afework M., “Prevalence of Self‐Reported Work‐Related Lower Back Pain and Its Associated Factors in Ethiopia: A Systematic Review and Meta‐Analysis,” Journal of Environmental and Public Health 2021 (2021): 6633271. [DOI] [PMC free article] [PubMed] [Google Scholar]
- 3. GBD 2021 Low Back Pain Collaborators , “Global, Regional, and National Burden of Low Back Pain, 1990–2020, Its Attributable Risk Factors, and Projections to 2050: A Systematic Analysis of the Global Burden of Disease Study 2021,” Lancet Rheumatology 5, no. 6 (2023): e316–e329. [DOI] [PMC free article] [PubMed] [Google Scholar]
- 4. Punnett L., Prüss‐Ütün A., Nelson D. I., et al., “Estimating the Global Burden of Low Back Pain Attributable to Combined Occupational Exposures,” American Journal of Industrial Medicine 48, no. 6 (2005): 459–469. [DOI] [PubMed] [Google Scholar]
- 5. Jia N., Zhang M., Zhang H., et al., “Prevalence and Risk Factors Analysis for Low Back Pain Among Occupational Groups in Key Industries of China,” BMC Public Health 22, no. 1 (2022): 1493. [DOI] [PMC free article] [PubMed] [Google Scholar]
- 6. Wynne‐Jones G., Cowen J., Jordan J. L., et al., “Absence From Work and Return to Work in People With Back Pain: A Systematic Review and Meta‐Analysis,” Occupational and Environmental Medicine 71, no. 6 (2014): 448–456. [DOI] [PMC free article] [PubMed] [Google Scholar]
- 7. Park S. C., Kang M. S., Yang J. H., et al., “Assessment and Nonsurgical Management of Low Back Pain: A Narrative Review,” Korean Journal of Internal Medicine 38, no. 1 (2023): 16–26. [DOI] [PMC free article] [PubMed] [Google Scholar]
- 8. Mescouto K., Olson R. E., and Setchell J., “Towards an Ethical Multiplicity in Low Back Pain Care: Practising Beyond the Biopsychosocial Model,” Sociology of Health & Illness 45, no. 3 (2023): 522–541. [DOI] [PMC free article] [PubMed] [Google Scholar]
- 9. Foster N. E., Hill J. C., O'Sullivan P., et al., “Stratified Models of Care,” Best Practice & Research: Clinical Rheumatology 27, no. 5 (2013): 649–661. [DOI] [PubMed] [Google Scholar]
- 10. D'Antoni F., Russo F., Ambrosio L., et al., “Artificial Intelligence and Computer Aided Diagnosis in Chronic Low Back Pain: A Systematic Review,” International Journal of Environmental Research and Public Health 19, no. 10 (2022): 5971. [DOI] [PMC free article] [PubMed] [Google Scholar]
- 11. Loftus T. J., Shickel B., Balch J. A., et al., “Phenotype Clustering in Health Care: A Narrative Review for Clinicians,” Frontiers in Artificial Intelligence 5 (2022): 842306. [DOI] [PMC free article] [PubMed] [Google Scholar]
- 12. Hassan S., Nesovic K., Babineau J., Furlan A. D., Kumbhare D., and Carlesso L. C., “Identifying Chronic Low Back Pain Phenotypic Domains and Characteristics Accounting for Individual Variation: A Systematic Review,” Pain 164, no. 10 (2023): 2148–2190. [DOI] [PubMed] [Google Scholar]
- 13. Garcia A. N., Simon C. B., Yang Z. L., Niedzwiecki D., Cook C. E., and Gottfried O., “Classification of Older Adults Who Underwent Lumbar‐Related Surgery Using Pre‐Operative Biopsychosocial Predictors and Relationships With Surgical Recovery: An Observational Study Conducted in the United States,” Health & Social Care in the Community 30, no. 5 (2022): e1570–e1584. [DOI] [PubMed] [Google Scholar]
- 14. Heidari J., Mierswa T., Hasenbring M., et al., “Recovery‐Stress Patterns and Low Back Pain: Differences in Pain Intensity and Disability,” Musculoskeletal Care 16, no. 1 (2018): 18–25. [DOI] [PubMed] [Google Scholar]
- 15. Beales D. J., Smith A. J., O'Sullivan P. B., and Straker L. M., “Low Back Pain and Comorbidity Clusters at 17 Years of Age: A Cross‐Sectional Examination of Health‐Related Quality of Life and Specific Low Back Pain Impacts,” Journal of Adolescent Health 50, no. 5 (2012): 509–516. [DOI] [PubMed] [Google Scholar]
- 16. Rabey M., Smith A., Beales D., Slater H., and O'Sullivan P., “Differing Psychologically Derived Clusters in People With Chronic Low Back Pain Are Associated With Different Multidimensional Profiles,” Clinical Journal of Pain 32, no. 12 (2016): 1015–1027. [DOI] [PubMed] [Google Scholar]
- 17. Langenmaier A. M., Amelung V. E., Karst M., et al., “Subgroups in Chronic Low Back Pain Patients—A Step Toward Cluster‐Based, Tailored Treatment in Inpatient Standard Care: On the Need for Precise Targeting of Treatment for Chronic Low Back Pain,” GMS German Medical Science 17 (2019): Doc09. [DOI] [PMC free article] [PubMed] [Google Scholar]
- 18. Carlesso L. C., Tousignant‐Laflamme Y., Shaw W., Larivière C., and Choinière M., “Exploring Pain Phenotypes in Workers With Chronic Low Back Pain: Application of Impact Recommendations,” Canadian Journal of Pain 5, no. 1 (2021): 43–55. [DOI] [PMC free article] [PubMed] [Google Scholar]
- 19. Ahmad P., Qamar S., and Rizvi S. Q. A., “Techniques of Data Mining in Healthcare: A Review,” International Journal of Computer Applications 120, no. 15 (2015): 38–50. [Google Scholar]
- 20. Clarence S. Y. K., Smith H. E., Car L. T., Protheroe J., Wong W. C., and Bartlam B., “Health Literacy and Health Outcomes in Patients With Low Back Pain: A Scoping Review,” BMC Medical Informatics and Decision Making 21 (2021): 215. [DOI] [PMC free article] [PubMed] [Google Scholar]
- 21. Russo F., Di Tecco C., Russo S., et al., “Importance of an Integrated Assessment of Functional Disability and Work Ability in Workers Affected by Low Back Pain,” Safety and Health at Work 15, no. 1 (2024): 66–72. [DOI] [PMC free article] [PubMed] [Google Scholar]
- 22. Fatoye F., Gebrye T., Mbada C. E., and Useh U., “Clinical and Economic Burden of Low Back Pain in Low‐ and Middle‐Income Countries: A Systematic Review,” BMJ Open 13, no. 4 (2023): e064119. [DOI] [PMC free article] [PubMed] [Google Scholar]
- 23. McCarthy C. J., Roberts C., Gittins M., and Oldham J. A., “A Process of Subgroup Identification in Non‐Specific Low Back Pain Using a Standard Clinical Examination and Cluster Analysis,” Physiotherapy Research International 17, no. 2 (2012): 92–100. [DOI] [PubMed] [Google Scholar]
- 24. Beneciuk J. M., Robinson M. E., and George S. Z., “Subgrouping for Patients With Low Back Pain: A Multidimensional Approach Incorporating Cluster Analysis and the Start Back Screening Tool,” Journal of Pain 16, no. 1 (2015): 19–30. [DOI] [PMC free article] [PubMed] [Google Scholar]
- 25. Yadollahpour N., Zahednejad S., Yazdi M. J. S., and Esfandiarpour F., “Clustering of Patients With Chronic Low Back Pain in Terms of Physical and Psychological Factors: A Cross‐Sectional Study Based on the Start Back Screening Tool,” Journal of Back and Musculoskeletal Rehabilitation 33, no. 4 (2020): 581–587. [DOI] [PubMed] [Google Scholar]
- 26. Otero‐Ketterer E., Peñacoba‐Puente C., Ferreira Pinheiro‐Araujo C., Valera‐Calero J. A., and Ortega‐Santiago R., “Biopsychosocial Factors for Chronicity in Individuals With Non‐Specific Low Back Pain: An Umbrella Review,” International Journal of Environmental Research and Public Health 19, no. 16 (2022): 10145. [DOI] [PMC free article] [PubMed] [Google Scholar]
- 27. Russo F., De Salvatore S., Ambrosio L., et al., “Does Workers' Compensation Status Affect Outcomes After Lumbar Spine Surgery? A Systematic Review and Meta‐Analysis,” International Journal of Environmental Research and Public Health 18, no. 11 (2021): 6165. [DOI] [PMC free article] [PubMed] [Google Scholar]
- 28. Costa N., Smits E. J., Kasza J., Salomoni S. E., Ferreira M., and Hodges P. W., “Low Back Pain Flares: How Do They Differ From an Increase in Pain?,” Clinical Journal of Pain 37, no. 5 (2021): 313–320. [DOI] [PubMed] [Google Scholar]
- 29. Doualla M., Aminde J., Aminde L. N., et al., “Factors Influencing Disability in Patients With Chronic Low Back Pain Attending a Tertiary Hospital in Sub‐Saharan Africa,” BMC Musculoskeletal Disorders 20 (2019): 25. [DOI] [PMC free article] [PubMed] [Google Scholar]
- 30. Tsuji T., Matsudaira K., Sato H., and Vietri J., “The Impact of Depression Among Chronic Low Back Pain Patients in Japan,” BMC Musculoskeletal Disorders 17 (2016): 447. [DOI] [PMC free article] [PubMed] [Google Scholar]
- 31. Kamper S. J., Apeldoorn A. T., Chiarotto A., et al., “Multidisciplinary Biopsychosocial Rehabilitation for Chronic Low Back Pain: Cochrane Systematic Review and Meta‐Analysis,” BMJ 350 (2015): h444. [DOI] [PMC free article] [PubMed] [Google Scholar]
- 32. Schepens C., Bouche K., Braeckman L., Rombauts P., Linden P., and Parlevliet T., “The Multidisciplinary Biopsychosocial Rehabilitation Programme for Patients With Chronic Spinal Pain: Outcomes With Work Status as the Primary Focus,” Journal of Rehabilitation Medicine—Clinical Communications 7 (2024): 5250. [DOI] [PMC free article] [PubMed] [Google Scholar]
- 33. Hodges P. W., Sowa G., O'Neill C., et al., “Development and Application of Predictive Clinical Biomarkers for Low Back Pain Care: Recommendations From the ISSLS Phenotype/Precision Spine Focus Group,” European Spine Journal 34 (2025): 1309–1318. [DOI] [PubMed] [Google Scholar]
- 34. Giaccone P., D'Antoni F., Russo F., et al., “Prevention and Management of Degenerative Lumbar Spine Disorders Through Artificial Intelligence‐Based Decision Support Systems: A Systematic Review,” BMC Musculoskeletal Disorders 26, no. 1 (2025): 126. [DOI] [PMC free article] [PubMed] [Google Scholar]
- 35. Bacco L., Russo F., Ambrosio L., et al., “Natural Language Processing in Low Back Pain and Spine Diseases: A Systematic Review,” Frontiers in Surgery 9 (2022): 957085. [DOI] [PMC free article] [PubMed] [Google Scholar]
- 36. D'Antoni F., Russo F., Ambrosio L., et al., “Artificial Intelligence and Computer Vision in Low Back Pain: A Systematic Review,” International Journal of Environmental Research and Public Health 18, no. 20 (2021): 10909. [DOI] [PMC free article] [PubMed] [Google Scholar]
- 37. Ambrosio L., Schol J., La Pietra V. A., Russo F., Vadalà G., and Sakai D., “Threats and Opportunities of Using ChatGPT in Scientific Writing—The Risk of Getting Spineless,” JOR Spine 7, no. 1 (2023): e1296. [DOI] [PMC free article] [PubMed] [Google Scholar]
- 38. Hornung A. L., Hornung C. M., Mallow G. M., et al., “Artificial Intelligence and Spine Imaging: Limitations, Regulatory Issues and Future Direction,” European Spine Journal 31, no. 8 (2022): 2007–2021. [DOI] [PubMed] [Google Scholar]
- 39. Makhni E. C., Makhni S., and Ramkumar P. N., “Artificial Intelligence for the Orthopaedic Surgeon: An Overview of Potential Benefits, Limitations, and Clinical Applications,” Journal of the American Academy of Orthopaedic Surgeons 29, no. 6 (2021): 235–243. [DOI] [PubMed] [Google Scholar]
Associated Data
This section collects any data citations, data availability statements, or supplementary materials included in this article.
Supplementary Materials
Data S1: Supporting Information.