

Abstract
Purpose
Mantle cell lymphoma (MCL) remains incurable despite therapeutic advances, highlighting the need for improved preclinical models. Existing transgenic MCL mouse models have significant limitations, restricting their translational value.
Experimental Design
We generated an immunocompetent MCL model by overexpressing the key oncogenic drivers SOX11 and CCND1 under the Eμ enhancer in C57BL/6 mice, aiming to replicate human MCL’s biological and pathological features.
Results
Eμ-SOX11CCND1 mice developed lymphoma marked by clonal B1a cell expansion in lymphatic and extranodal tissues. Morphologic, immunophenotypic, and transcriptional profiling revealed strong similarity to human MCL, with pathway analysis confirming significant molecular overlap. Importantly, lymphoma cells could be adoptively transferred into wild-type recipients, enabling therapeutic testing within an intact immune system.
Conclusions
The Eμ-SOX11CCND1 mouse represents a robust and biologically relevant model that faithfully recapitulates human MCL. Its immunocompetent nature and adoptive transfer capability make it a valuable model for studying disease mechanisms and evaluating novel therapeutic approaches for MCL patients.
Statement of Translational Relevance
Our novel immunocompetent Eμ-SOX11CCND1 transgenic mouse model closely recapitulates the molecular and pathological features of human MCL, including the clonal expansion of malignant B1a cells, nodal and extranodal involvement, and morphologic heterogeneity. This model provides a clinically relevant platform to test targeted therapies, including novel small molecules, bispecific antibodies, and CAR T-cell therapies in the context of an intact immune system. Additionally, we developed an ibrutinib-resistant variant, offering a critical tool to investigate mechanisms of resistance and evaluate alternative therapeutic strategies. While this model has some limitations, it significantly advances preclinical MCL research by enabling reliable therapeutic testing and translational insights that may ultimately improve patient outcomes in this aggressive lymphoma subtype.
Introduction
Mantle cell lymphoma (MCL) is a rare subtype of B-cell Non-Hodgkin Lymphoma with a complex molecular pathogenesis which translates into a difficult-to-treat disease and incurability1 despite the progress made in the last two decades with targeted therapies, including Bruton tyrosine kinase (BTK) inhibitors, the BCL2 inhibitor venetoclax, and the CD19-targeting chimeric antigen receptor (CAR) T-cells.2-4 MCL is divided into three morphological variants: classic (C-MCL), blastoid (B-MCL), and pleomorphic (P-MCL), of which the latter two are more aggressive and associated with poorer prognosis.5, 6
Molecularly, MCL is characterized by the hallmark chromosomal translocation t(11;14)(q13;q32), juxtaposing the CCND1 gene to the IgH promoter, which leads to over-expression of Cyclin D1, cell cycle dysregulation, and uncontrolled proliferation.7, Interestingly, Eμ-CCND1 mice do not develop lymphoma and are instead characterized by a normal B-cell development, suggesting that additional genetic insults are needed for lymphomagenesis.8 SRY-Box Transcription Factor 11 (SOX11) belongs to the SOXC family of high mobility group transcription factors and is highly expressed in the vast majority of MCL patients.9 SOX11 promotes the transcriptional activation of downstream genes, including components of Wnt signaling and B-cell receptor pathways.10-13 Notbly, Eμ-SOX11 mice in C57BL/6 background expressing murine SOX11 under the control of the B-cell specific IgH-Eμ enhancer develop an oligoclonal expansion of B cells with an immunophenotype resembling human MCL (CD19+, CD5+, CD23−).14
Developing a mouse model that reflects the molecular pathogenesis of MCL has been a long-standing challenge. This has become particularly important given the recent breakthroughs in immunotherapy, including biologics and immunomodulatory agents for the treatment of MCL, as well as the well-described role of the MCL tumor microenvironment (TME) in therapy resistance.14, 15
To address this and recapitulate the molecular pathogenesis of human MCL, we crossed Eμ-SOX11 mice with Eμ-CCND1 animals to generate Eμ-SOX11CCND1 double transgenic mouse model. These mice develop a clonal expansion of B cells that morphologically, immunophenotypically, and molecularly resemble human MCL. Wild-type (WT) C57Bl/6 mice engrafted with Eμ-SOX11CCND1 malignant cells either subcutaneously or intravenously represent an ideal tool to study novel therapeutic intervention and drug resistance mechanisms, including ibrutinib failure, in this disease.
Materials and Methods
Transgenic Mouse Model
All in vivo studies were approved by the Institutional Animal Care and Use Committee (IACUC) of their respective housing location. Animals were maintained under compliance with institutional animal care at Icahn School of Medicine at Mount Sinai and at the Ohio State University (OSU). To generate the double transgenic model, Eμ-SOX11 transgenic mice14 were crossed with the Eμ-CCND1 both in C57BL/6J background strain. Single transgenic mice Eμ-SOX11 were generated by Dr. S. Parekh (Icahn School of Medicine).8 Eμ-CCND1 animals were obtained from Dr. S. Katz (Yale School of Medicine). To generate the Eμ-SOX11 mice, the BstBI/BciVI digested pEμSV-SOX11-IRES-eGFP vector containing mouse SOX11 full-length sequence was injected into fertilized oocytes from C57Bl/6J animals (RRID: IMSR_JAX:000664). Mice were screened for exogenous SOX11 and CCND1 genes by genotyping tail DNA by quantitative PCR (Transnetyx).
Primers used for genotyping.
mSOX11-Scr-F: 5′-TCATGTTCGACCTGAGCTTG-3′
mSOX11-Scr-R: 5′-GCTGTCCTTCAGCATCTTCC-3′
CCND1-F: 5′- AGTGCGTGCAGAAGGAGATT -3′
CCND1-R: 5′- CACAACTTCTCGGCAGTCAA -3′
Mice were grouped base on their genotypes as aging colony to generate the survival curve. Early removal criteria (ERC) included greater than 20% weight loss in <1-week, massive splenomegaly (spleen crossing the midline), lethargy (non-responsiveness to stimulation or unwillingness to move/feed), labored breading, scruffy appearance, hunched posture, hind limb paralysis, or tumor volume ≥ 3000mm3. Subjects not reaching the mentioned criteria where removed from the study.
Animal subject selection criteria was either ERC (for SOX11 and double transgenic model) or age match (for the WT and CCND1 mice, due to lack of lymphomagenesis). When mice reached ERC, they were euthanized, and a necropsy was performed. Notes on organ condition and any possible signs of toxicity were noted.
For the adoptive transfer experiments, the donor mouse (Eμ-SOX11/CCND1) C0003 developed disseminated lymphoma affecting multiple organ systems, including the kidney, lung, heart, lymph node liver, bone marrow, spleen, mesentery, and wall of the gastrointestinal tract, and was chosen for the adoptive transfer experiments. After reaching ERC, the donor spleen and lymph node cells were cryopreserved in FBS+10%DMSO (Sigma-Aldrich #22G096, Fisher Scientific #D128-500). One day prior to engraftment, 5-7 weeks old wild-type host (WT, C57bl/6, CD45.2+) mice were irradiated (200 cGy). On day 0, previously cryopreserved cells were thawed at 37°C in a water bath and washed once with sterile PBS. Cells were then counted and resuspended in 100uL. Initial engraftment was performed via tail vein injection of 10e6 (either spleen or lymph node) cells in sterile PBS. The mice were monitored for expansion of donor cells (CD45.1+) in the host blood (CD45.2+, CD45.1-) with flow cytometry (Supplemental Table 1). Once mice met ERC, the animals were euthanized, and cells from the spleen and lymph nodes (when possible) were collected/cryopreserved. 10% of the spleen and the rest of the mouse body were preserved in 10% formalin. The remaining spleen and any possible tumors were dissociated and stored in 90%FBS/10%DMSO at −80 °C before being stored long-term in liquid nitrogen.
The same procedure was repeated for four passages, with irradiation conditioning discontinued after passage two and the engraftment cell number reduced to 100,000.
Passage four was used for subcutaneous engraftment. Previously, aliquoted Matrigel was thawed on ice while engraftment cryopreserved cells were thawed at 37°C in a water bath and washed once with sterile PBS. Cells were resuspended at 2e6/mL in cold PBS and mixed 1:1 with the thawed Matrigel. Mice were shaved and topically disinfected with isopropanol. 100uL of solution was injected subcutaneously into the right flank of the animals. Disease progression was monitored through tumor volume and body score.
Disease detection via in vivo imaging system (IVIS)
PerkinElmer's Transferrin-Vivo 750 (cat# NEV10091) NIR-labeled probe enables in vivo imaging of transferrin receptor levels, revealing metabolic iron shifts in cancer and inflammation.
To leverage transferrin role in assessing tumor burden, transferrin-based fluorescent imaging on transgenic mice (WT, Eμ-SOX11, Eμ-CCND1, and Eμ-SOX11CCND1) using the IVIS 200 system (Caliper Life Sciences, Hopkinton, MA) with Living Image software for acquisition and analysis was performed. Each mouse received 100 μL (1.5 nmol) of TfNIR via tail vein injection, and whole-body imaging occurred every 30–60 minutes for 6 hours with 1-10 second exposure. Light emissions were captured, digitized, and displayed for quantifying regions of interest (ROIs) around tumor sites. The signal intensity was expressed as mean flux (photons per second per centimeter squared per steradian, p/s/cm2/sr).
Flow Cytometry
Flow cytometry was used to monitor tumor burden and changes in immune cell subsets in the peripheral blood and tissues. Briefly, blood was collected in EDTA tubes with a submandibular stick . 20ul of blood were then transferred to a flow tube where the master mix (Supplemental Table 1) diluted to 50ul with sterile PBS, was added. Samples were stained for 20-30 mins at room temp in the dark. Transgenic mice were monitored with GFP, CD45 (BV510), CD5 (PE), CD19 (PE-cy7), CD3 (APC-cy7), and CD11b (APC). Adoptive transfer mice were monitored with GFP, CD5 (PE or BV421), and CD19 (PE-cy7 or Alexa Fluor 700). After incubation, 400ul of 1X RBC lysis buffer was added and washed with sterile PBS, pelleted at 500g for 5 mins, resuspended in 200uL PBS, and run on a Fortessa cytometer. Results were analyzed on Kaluza software. Additional phenotyping with lineage and surface markers was performed on viably frozen splenocytes.
Immunoprofiling via spectral flow cytometry was performed on cryopreserved peripheral blood, bone marrow, or splenocytes. Cryopreserved cells were thawed at 37°C in a water bath and transferred to a 50 mL conical. Sterile PBS was added dropwise until 3 mL of total volume, 1 mL at a time until 10 mL of total volume, and 10 mL at a time to 50 mL, swirling between additions to maximize viability. Cells were then pelleted at 500g for 5min and resuspended in 10mL for quantification. 2e6 cells, when possible, were transferred to a flow cytometry tube, where they were washed one more time with 1mL of PBS. Cells were stained with live, dead fixable dye (Thermo Fisher Scientific #L23105) for 20 mins at 4 °C in the dark, using straight PBS for controls. Samples were washed with >2mL of PBS at 500g for 5 mins and centrifuged at 4 °C 300g for 10 minutes to pellet aggregates. Every sample was blocked with 0.5uL of FC block (TruStain FcX (Biolegend #101319) in 50uL of PBS+2%FBS, incubating at RT in the dark for at least 10 minutes. Master mix, FMOs, and single-color stains were added (antibodies listed in Supplemental Table 2), and samples were incubated for 30-60 mins at RT in the dark. Samples were washed twice with >2mL of PBS+2%FBS. Samples were then fixed and permeabilized according to the manufacturer protocol (eBiosciences #00-5523-00). Intracellular antibodies were incubated at RT in the dark for 30-60 mins. Samples were washed twice with >2mL of wash/perm buffer and resuspended in 200uL for control and 400uL for sample tubes. Single color and FMO controls were run each time. Samples were run within six hours of staining on a Cytek Aurora cytometer. Unmixing and compensation were performed on spectral flow and Analysis with Cytobank.
Histopathology and Immunohistochemistry (IHC)
Murine tissues (Supplemental Table 3) were processed for histopathology on a Leica Peloris Tissue Processor (Leica Biosystems, Buffalo Grove, IL), embedded in paraffin, sectioned at 4 microns, deparaffinized in xylene, and hydrated gradually in graded alcohols. Using a routine, quality-controlled protocol, batch-staining with hematoxylin and eosin (H&E) was completed on a Leica ST5020 auto stainer (Leica Biosystems) (Supplemental Table 4). For CD19 and Ki67 IHC, slides were subjected to antigen retrieval in citrate-based (pH 6.1) target retrieval solution for 20 minutes at 96°C. Slides were cooled and rinsed with deionized water, followed by incubation with 1X PBS containing 3% (v/v) H2O2 to block endogenous peroxidase activity. Slides were washed with TBS containing 0.1% (v/v) Tween-20 and transferred to the intelliPATH FLX instrument (BioCare Medical, Pacheco, CA) for IHC. Slides were prepared by a board-certified IHC technician and evaluated by two board-certified veterinary anatomic pathologists (Drs. Pray and Corps). Slides were evaluated on an Olympus BX53(Cnter Vally, PA). The mitotic index was quantified by averaging the number of mitoses in 10 high-power (400X) fields. Ki67 index was quantified by counting 500 cells at 600X and calculating the percentage of cells showing positive nuclear immunoreactivity. Photomicrographs were obtained with a C-mounted Olympus SC30 digital camera using Olympus cellSens (Version 1.18) imaging software and optimized in Adobe Photoshop (Version 25.12. San Jose, CA, RRID:SCR_014199) for color and light.
RNA sequencing and analysis
Cryo-preserved samples were revived, and RNA was extracted with TRizol (ThermoFisher, #15596026) from either whole spleen (more than 90% B cell infiltration), or B cell selected prior to RNA extraction for WT mice using EasySep mouse B cell selection kit (#19854).
RNA concentration was determined using ThermoFisher Qubit 4 Fluorometer (#Q33238), and all samples normalized to 50ng total concentration in 11ul for input to library preparation. Ribosome depletion was carried out using NEBNext® rRNA Depletion Kit (Human/Mouse/Rat) (#E6310S/L/X, #E6350S/L/X) and eluted in 5ul nuclease-free water for downstream Illumina compatible library prep. Samples were then prepared using NEBNext Ultra Directional RNA Library Prep Kit for Illumina (#E7420) according to manufacturer protocol, barcoded using NEBNext® Multiplex Oligos for Illumina (NEB #E6440S/L), and eluted to 17ul of nuclease-free water. Barcoded illuminates compatible libraries were then quantified on ThermoFisher Qubit 4 Fluorometer (#Q33238) qualified individually in Agilent TapeStation HS DNA (#5067-5585) and pooled equally in equal molarity. The final pooled libraries were re-qualified using Agilent TapeStation HS DNA (#5067-5585) and quantified using a ThermoFisher Qubit 4 Fluorometer (#Q3323).
Pooled libraries were sequenced on the Illumina NovaSeq X Plus instrument with a Paired-End 50bp run mode. Raw sequencing reads in FASTQ format were quality trimmed, and adapters were removed using Trim Galore (v0.6.6) (https://www.bioinformatics.babraham.ac.uk/projects/trim_galore/, RRID:SCR_011847). Trimmed reads were then mapped to the mouse genome (GRCm39 assembly) using HISAT2 (v. 2.1.0). 16The mapped reads in SAM format were converted into BAM format, sorted for coordinates, and indexed using samtools (v.1.6).17 Sorted BAM files were finally used as input for featureCounts (v.2.0.0)18 to count the mapped reads to the gene coordinates reported in the GTF annotation file downloaded from GENCODE (vM33). Raw counts were scaled using the Reads Per Million (RPM) formula to filter out low-expressed genes before normalization and differential expression analysis. Precisely, all the genes whose mean of the RPM was less than one across all samples were removed. Afterward, raw counts of retained genes were log2-transformed, and differential expression analysis was performed using the Limma R package.18 Genes with a ∣Log2FC∣>0.58 (∣Linear FC∣>1.5) and an adjusted p-value <0.05 (Benjamini-Hochberg correction) were considered differentially expressed. Heatmaps and volcano plots showing the differentially expressed genes have been generated using the R packages Enhanced Volcano (https://bioconductor.org/packages/release/bioc/html/EnhancedVolcano.html) and pheatmap (https://cran.r-project.org/web/packages/pheatmap/index.html, RRID:SCR_016418), respectively. The differentially expressed genes, identified as described above, were then used with their log2FC values as input to the MITHrIL algorithm19 to perform the pathway analysis. The exact pathway analysis was also performed on publicly available human MCL and B-cell datasets from healthy donors (GSE159808) to compare their dysregulated pathways with those identified in our mouse model. Finally, the mapped reads in BAM format, generated as described above, were also used to assess the clonality of B-cells in our samples using TRUST4 with default settings. All the analyses have been performed in R (v. 4.2.2) using the RStudio (v. 2022.12.0) framework.
Small Molecule Dosing and Conditioning
Treatment began on day three with PRMT5 inhibitor PRT382 (Prelude Therapeutics), BTK inhibitor ibrutinib (MedChem Express Cat# HY-10997), or BCL2 inhibitor venetoclax (MedChem Express #HY-15531). PRT382 was dosed four days on and three days off via oral gavage at either 5 or 10 mg/kg in 0.5% aqueous methylcellulose w/v (MP BioMedicals cat# 155492) with 0.1% v/v Tween 80 (Fisher cat# T164-500). The vehicle was combined and mixed and heated for approximately one hour. The solution was allowed to incubate overnight at 37 °C or until the solution appeared uniformly cloudy. Cooling the solution at 4 °C for one hour clarified the solution, after which PRT382 could be solubilized. Ibrutinib was dosed continuously as an aqueous solution (0.21 mg/mL) in sterile drinking water containing 1.0% Trapsol (w/v) at final pH of 6 - 8. Venetoclax was also dosed four days on and three days off via oral gavage at 12.5mg/kg in 10% ethanol (Sigma Aldrich cat# E7023), 30% Peg400 (Fisher cat# P167-1) and 60% Phosal 50 PG (MedChemExpress cat# HY-Y1903). The drug was dissolved in ethanol with sonication and 37 °C incubation as necessary. Once the solution was translucent, the PEG400 and Phosal were added and gently vortexed.
Immuno-blotting
Total cellular proteins were isolated from frozen cryo-preserved spleen samples from adoptive transfer experiments. Samples were thawed at 37 °C and then quickly transferred to tubes with 10 mL RPMI+10% FBS, with a centrifuge at 1500 RPM for 5 minutes. After aspirating, the supernatant cells were then washed in ice-cold PBS before lysing in ice-cold RIPA buffer (50mM Tris-HCl pH 7.4, 150mM NaCl, 1% v/v Triton X-100, 1mM EDTA pH 8.0, 0.5% w/v sodium deoxychlorate, 0.1% w/v SDS) containing 1x Protease/phosphatase Inhibitor (Halt™ Protease and Phosphatase Inhibitor Cocktail, Fisher Scientific # PI78441). Mouse brain samples were prepared from freshly trimmed WT mice, and single cells were obtained by pressing the brain through a strainer (Fisherbrand # 22-363-548) and then lysed as above. Protein concentrations were quantified using BCA assay (Pierce™ BCA Protein Assay Kits, # A55864), following manufacturer’s protocols. Equal amounts of proteins (20-50μg) were separated via SDS polyacrylamide gel electrophoresis (SDS-PAGE) using precast 4-20% gradient polyacrylamide gels (Mini-Protean TGX, Bio-Rad). Proteins were transferred onto nitrocellulose membrane (Roche) for 120V for ~2 hours. After transfer, membranes were stained with Ponceau S Staining (Thermo Scientific, # A40000279) for band visualization, then blocked with 5% non-fat dry milk (NFDM) for 1 hour at room temperature. Blocked membranes were probed with primary antibodies against SOX11 (Abcam #234996, RRID: AB_3674859), CycliD1 (cell signaling technologies #2978), and Vinculin (cell signaling technologies # 4650, RRID: AB_3674860), overnight at 4°C. Primary antibodies were detected after probing for 2 hours with HRP-linked rabbit anti-mouse IgG (RRID:AB_2099233.) or goat anti-rabbit IgG (RRID:AB_330924.) secondary antibody at room temperature using ECL Western Blotting substrate (Pierce, Pico, and Femto). Signal was detected using the Bio-rad ChemiDoc imaging system. The transferred blot for CyclinD1 antibody was imaged twice, with and without the positive control (FCMCL) due to over saturation of positive control band.
B-cell selection and activation
Dead cell removal ( Miltenyi Biotec, #130-090-101) and mouse B cell selection (STEMCELL, #19844) was performed on single cell suspension of the splenocytes. After 2 e6 cell with >80% B cell purity was cultured for starvation in RPMI (no FBA added) supplemented with 40uM BME and incubated in 37 °C incubator for 1 hour. During starvation, cells were treated with ibrutinib with final concentration of 0.1 uM and 0.5 uM . Subsequently, the cells were activated for 5 minutes at room temperature, with H2O2 (2 mM) and anti-mouse IgM (10 mg/mL,115-006-075, Jackson ImmunoResearch). Whole-cell lysates and immunoblotting analysis were performed as described previously. Following antibodies were used for protein detection: BTK (Cell Signaling technology #56044S), P-BTK (Y223) (cell signaling technology #8757S), AKT (cell signaling technologies #2920S), P-AKT (S373) (cell signaling technologies #4060S), MTAP (cell signaling technologies #62765), BCL-XL (cell signaling technologies #2764T), and α-tubulin (cell signaling technologies #3873S)
Ion torrent sequencing
The Mouse Panel (IAD258365) was used for the sequencing. Analysis of the genes included in the custom design Ampliseq Mouse Panel were performed using Next Generation Sequencer Ion GeneStudio S5 Prime System (A38195) and reagents from Life Technologies (Carlsbad, California). Libraries were prepared with Ion AmpliSeq Library kit2.0 (4475345) with custom designed panel of AmpliSeq primers IAD 258365 (attachment1).
For sequencing multiple samples, we used IonExpress barcode adapters (kit#4471250). DNA was amplified on ProFlex PCR system from Applied Biosystems by Lifetechnologies (4484073) using flowing protocol: Initial Hold 99*C-2min followed by 21cycles @99*C-15sec, 60*C-4min and final Hold 10*C inf. PCR product was purified with Agencourt AMPure XP kit ( A63881 Beckman Coulter, Indianapolis, Indiana). Library was quantified using real time PCR with Ion Library TAQMAN Quantitation kit (44688022) on (Applied Biosystems ViiA7 Real Time PCR System) instrument to allow for optimal final dilution for automated template preparation and chip loading on Ion Chef instrument (#4484177) using Ion 540 Kit-Chef (A30011) and 540 Chip Kit (A27766).
Data was collected and analyzed using Ion GS-S5 Server with Torrent Suite 5.18.1 version. Final analysis of sequence data was performed using combination of software: Variant Caller v.5.18.6–1 and IGV_2.18.1. The mouse reference sequence(GRCm38/mm10) was used for analysis. The entire length of sequences was reviewed manually using these programs to assess for deviation from reference sequence and to evaluate the quality of sequence and the depth of coverage.
Sanger sequencing
Mutation-specific primers were designed to amplify regions of the mouse BTK gene (C481) and PLCG2 gene (R665, S707, and L845) from genomic DNA. PCR amplification was performed using Phusion High-Fidelity DNA Polymerase to ensure accuracy of amplification. The resulting PCR products were assessed via agarose gel electrophoresis, and amplicons of the expected size were purified using the QIAquick PCR Purification Kit (Qiagen). Purified products were subjected to Sanger sequencing using mutation-specific forward primers to determine the mutational status of BTK and PLCG2 loci.
Primer sequences
BTK C481 Forward primer: 5’ TGGGTAGACTCCAAAGCCCT 3’
BTK C481 Reverse primer: 5’ CGCTCTATCTCCCAGCGTTC 3’
PLCG2 S707 Forward primer: 5’ GGCACCTCAGTCAGGTTGAA 3’
PLCG2 S707 Reverse primer: 5’ CCACTATCAGTCGCATGGGG 3’
PLCG2 L845 Forward primer: 5’ CAGGAGTCGAAGGCCAAGTG 3’
PLCG2 L845 Reverse primer: 5’ ATCCAGGTCTGGTAGGCACA 3’
Data Avalability
RNA-seq data and analysis are available in GEO under accession number GSE281125. For all other original data, please contact Lapo.Alinari@osumc.edu.
Statistics
Sample size was based on estimations by power analysis with a level of significance of 0.05 and a power of 0.8. Student T tests, one-way anovas, two-way anovas, simple linear regressions, and mantel cox regressions were performed as appropriate in GraphPad Prism V9 (RRID:SCR_002798). Corrections for multiple testing was used as needed. Error bars show standard deviation.
Results
Eμ-SOX11CCND1 mice develop a pathological expansion of CD5+CD19+ cells.
To study the in vivo cooperation between SOX11 and Cyclin D1, our previously published Eμ-SOX11-GFP animals14 were crossed with Eμ-CCND1 mice where the murine CCND1 8 open reading frame was placed under control of the immunoglobulin VH promoter and Eμ enhancer elements to generate double transgenic Eμ-SOX11CCND1 on C57BL/6J background (Figure 1A). The Eμ-SOX11 (n=63) and Eμ-SOX11CCND1 (n=61) colonies had significantly shorter survival compared to WT (n=53, p<0.0001, p<0.001) and Eμ-CCND1 (n=41, p<0.0001, p<0.0001) mice with median survival of 587 days for Eμ-SOX11 (range 179-718 days) and 697 days for Eμ-SOX11CCND1 (range 200-718 days) colonies (Figure 1B). The Eμ-SOX11 and Eμ-SOX11CCND1 colonies did not have significantly different survival from each other (Figure 1B). However, flow cytometric analysis of spleens and bone marrow samples from Eμ-SOX11CCND1 animals (n=3-5) obtained at ERC (~290 days) showed a significantly greater expansion of CD19+/CD5+/CD23− cells compared to age-matched single transgenic mice (n=2-8) (Figure 1C) (p<0.05, p<0.01). Similarly, Eμ-SOX11CCND1 mice showed significantly increased radiant efficiency (n=3) in the spleens compared to age-matched single transgenic mice (n=3) using IVIS imaging to capture the fluorescent-conjugated transferrin antibody (Figure 1D-E) (p<0.05).
Figure 1. SOX11 and CCND1 overexpression induces proliferation of a MCL-like population.
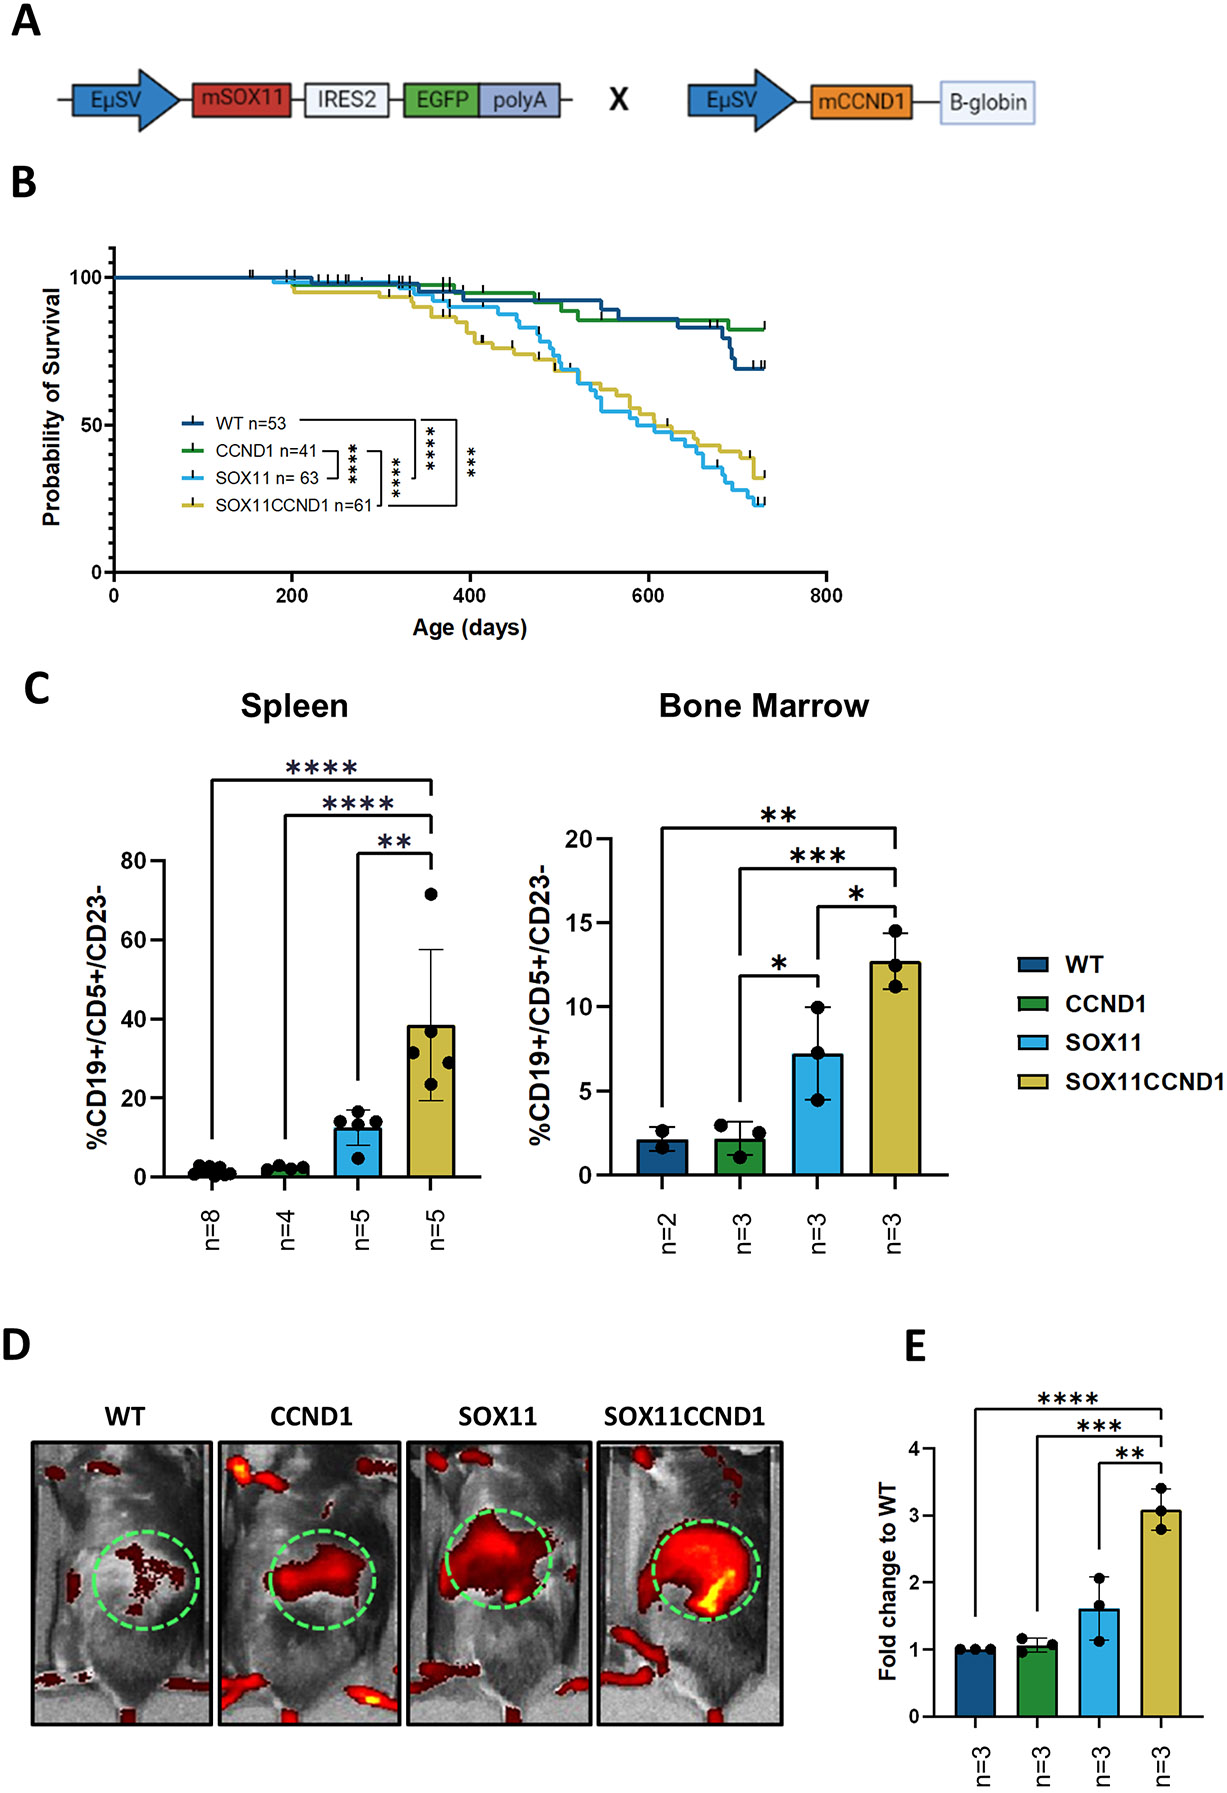
(A) Schematic illustration of gene cassettes for the co-expression of SOX11 and CCND1 transgenes. (B) Kaplan-Meier curve showing a significant survival disadvantage for the Eμ-SOX11 and Eμ-SOX11CCND1 animals compared to wild type (WT) and single transgenic CCND1 mice. (C) Histograms showing significant expansion of MCL-like CD19+/CD5+/CD23− of CD45+ in singlet-viable cells from spleen and bone marrow from Eμ-SOX11CCND1 mice from the aging colony compared to the other groups. (D) Representative images of the radiance of spleen in WT, Eμ-CCND1, Eμ-SOX11, and Eμ-SOX11CCND1 which are quantified as fold change to WT radiant efficiency, expressed as p/sec/cm2/sr/ μW/cm2 in €. To determine significance, a mantle cox regression was used in B and a one-way ANOVA was used in C and E. WT: CCND1 and SOX11:SOX11CCND1 are ns in B. Error bars show standard deviation. * p<0.05 ** p<0.01 *** p<0.001 **** p<0.0001
Flow cytometry analysis performed on the peripheral blood from each cohort showed that the Eμ-CCND1 mice closely resembled WT C57Bl/6 mice with a normal proportion of B cells in the CD45+ compartment and a small population of CD19/CD5 double-positive cells (Supplemental Figure 1A-B). The Eμ-SOX11CCND1 mice displayed a significant expansion of CD5+/CD19+ cells in comparison to age-matched Eμ-SOX11 mice (Supplemental Figure 1A-B).14 The percentage of circulating CD5+CD19+ cells was gender independent for the Eμ-SOX11 and Eμ-SOX11CCND1 colonies (Supplemental Figure 2A).
Overall, our data show that concomitant overexpression of CCND1 and SOX11 in immunocompetent mice lead to further expansion of CD5/CD19 double-positive B-cells.
Lymphoma developed in Eμ-SOX11CCND1 transgenic mice morphologically resembles human MCL.
Gross necropsy on Eμ-SOX11CCND1 at ERC revealed splenomegaly and hepatomegaly with nodularity, primarily sub mandibular and mediastinal lymphadenopathy. While we found aberrant CD5+CD19+ cells in all Eμ-SOX11CCND1 transgenic mice by flow cytometry, we analyzed histology in a small number of animals to determine penetrance in terms of histopathological changes. Consistent with published literature, no lymphoma developed in any of the Eμ-CCND1 mice evaluated in this study.8 Histologic assessment of the spleens of Eμ-SOX11CCND1 mice at ERC revealed loss of the normal splenic follicular architecture, which was replaced by a dense infiltration of the splenic white and red pulp by atypical, CD19+ B-lymphocytes (Figure 2A). Compared to WT and Eu-CCND1 spleens in which Ki67 immunoreactivity was largely confined to germinal centers and at relatively low levels, markedly increased and diffuse Ki67 immunoreactivity was present in spleens from Eu-SOX11 and Eu-SOX11CCND1 mice (Supplemental Table 5, Figure 2A). Overall, the Ki67 of the Eμ-SOX11CCND1 mice was higher than that of the Eμ-SOX11 mice with an average index of 58.4% and 32%, respectively (Supplemental Table 5).
Figure 2. SOX11 and CCND1 overexpression results in the expansion of an MCL-like population resembling human MCL.
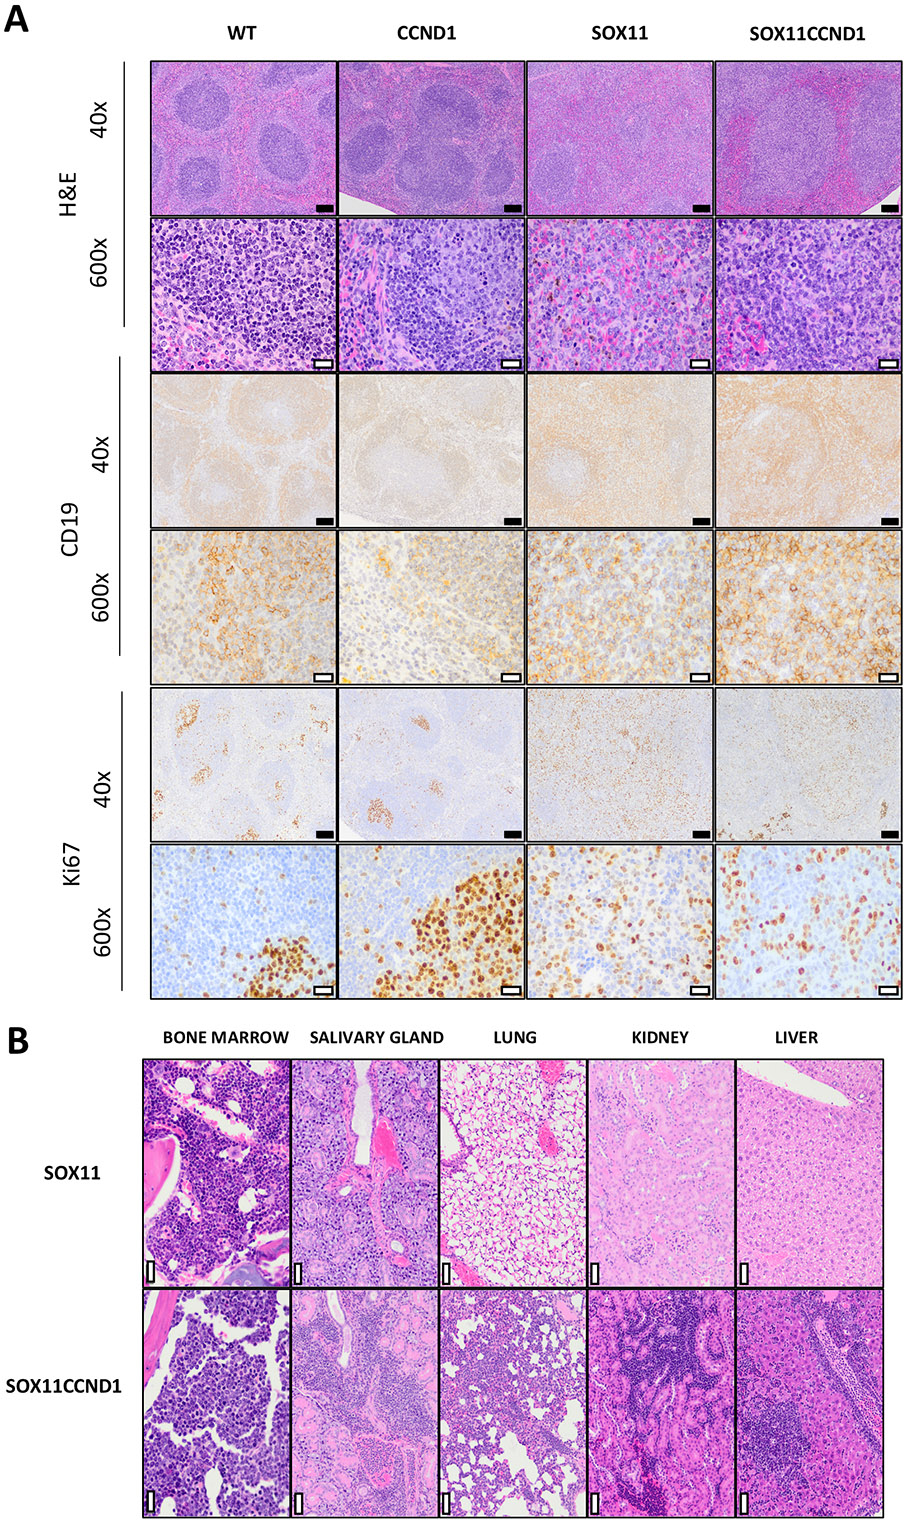
(A) Histopathologic analysis and immunohistochemical features of MCL-like disease observed in Eμ-SOX11CCND1 mice. As compared to normal splenic follicular architecture seen in the spleens of WT and Eμ-CCND1 mice with well-defined CD19+ follicles, there is widespread effacement of normal architecture by sheets of CD19+ B cells in the Eμ-SOX11 and Eμ-SOX11CCND1 mice. Additionally, compared to Ki67 immunoreactivity in the WT and Eμ-CCND1 spleens, which is confined to germinal centers, significant diffuse Ki67 immunoreactivity is noted in the spleens of Eμ-SOX11 and Eμ-SOX11CCND1 mice. (B) Extranodal involvement in a representative Eμ-SOX11CCND1 mouse (202) that reached ERC. In addition to infiltration and effacement of the spleen and lymph nodes, MCL-like infiltrates were seen in the vasculature and parenchyma of the kidney, lung, salivary gland, and bone marrow. In comparison, extranodal involvement was not observed in a representative Eμ-SOX11mouse (412) that reached ERC. For photomicrographs taken at 40x, the black scale bar = 100μM. For those taken at 600x, the white scale bar = 20μM. To determine significance, a mantle cox regression was used in A. SOX11:SOX11CCND1 are ns in A. * p<0.05 ** p<0.01 *** p<0.001 **** p<0.0001
While MCL-like disease was only seen in the spleens and lymph nodes of the Eμ-SOX11 mice, extranodal disease was observed frequently in the Eμ-SOX11CCND1 mice (Figure 2B). Within affected organs, lymphoma cells were present both in the parenchyma – resulting in displacement and/or effacement of normal tissue structures – and within the vasculature/in circulation. The most frequent sites of involvement were the liver (80%, 4 of 5 mice) and lung (80%, 4 of 5 mice). Lymphoma was noted in the kidneys of 60% of mice (3 of 5), in the bone marrow (2 of 5), and in the salivary glands (1 of 5) (Figure 2B).
The cellular morphology of these MCL-like populations varied considerably between mice (Supplemental Figure 2B), paralleling the heterogeneity observed in human MCL. 20 The lymphoid cells of the Eμ-SOX11 mice (n=2, #4474, #4412) and a subset of the Eμ-SOX11CCND1 mice (n=3, #32849, #20, #215) were small to intermediate in size with scant cytoplasm, round to irregular nuclei, lacy chromatin, inconspicuous nucleoli, and a moderate mitotic rate most closely resembling the human C-MCL (Supplemental Figure 2B). On the other hand, the lymphoid cells of one Eμ-SOX11CCND1 mouse (#202) were most reminiscent of B-MCL morphology with consistently intermediate cell size, indistinct nucleoli, and a very high mitotic rate (Supplemental Figure 2B). Lastly, in another Eμ-SOX11CCND1 mouse (#661), there was strikingly pleiomorphism amongst lymphoid cells with marked anisocytosis, multinucleation, and prominent variably sized nucleoli with a moderate degree of mitotic activity, a feature typical of P-MCL cells (Supplemental Figure 2B).
Malignant cells from double transgenic mice express P53, ATM and BCL2 using murine and human MCL cell lines as control (Supplemental Figure 3A). No mutations of TP53 and ATM loci were detected in the animals examined using a targeted sequencing approach with high coverage (Supplemental Table 6).
Altogether, morphologic evaluation of this model revealed several key similarities between the lymphoproliferative disease developed by the Eμ-SOX11CCND1 mice and human MCL.
Adoptive transfer of Eμ-SOX11CCND1 cells confers rapid lethality to recipient animals.
Given the long latency of the Eμ-SOX11CCND1 transgenic model and to provide a tool to study novel therapeutics in an immunocompetent MCL mouse, we sought to develop an adoptive transfer model (AT). Single-cell suspension (CD45.2+) from a diseased lymph node from an Eμ-SOX11CCND1 mouse that met ERC at 625 days of age was adoptively transferred into irradiated WT CD45.1+ C57Bl/6 mice via tail vein injection (106 cells/mouse, n=3) (Figure 3A)21. All engrafted mice developed lymphoma, reaching ERC between 103 and 230 days post-engraftment (Figure 3B). Splenocytes isolated from the mouse that met ERC at 103 days were then used for passage 2 (106 cells/mouse, n=5), which resulted in detectable CD5+/CD19+ B-cells in the peripheral blood by 3 weeks post-engraftment (Supplemental Figure 3B). Unselected splenocytes were further used in all subsequent passages. By passage four, 100,000 cells were engrafted into non-irradiated WT C57Bl/6 mice (n=9) with median ERC reached at day 19 (Figure 3B). Additionally, 100,000 unselected splenocytes from passage four were successfully engrafted subcutaneously (sc) into the flank of WT C57Bl/6J mice (n=5), resulting in a median survival of 22 days (sc) vs 17 days (iv) (Figure 3C). Interestingly, all the subcutaneously engrafted animals eventually developed disseminated disease. SOX11 and Cyclin D1 expression at the protein level was confirmed in the adoptive transfer mice via immunoblot using WT-isolated splenic B cells as the negative control (Supplemental Figure 3C).
Figure 3. Lymphoma cells from the Eμ-SOX11CCND1 model can be adoptively transferred into WT recipients.

(A) schematic representation of adoptive transfer (AT) experiment isolation of lymphoma cells from a Eμ-SOX11CCND1 mouse with spontaneous lymphoma at ERC to systemic engraftment after irradiation for passage 1 and 2, and engraftment without irradiation for passage 3 and 4 (Created in BioRender. Jafari, H. (2025) https://BioRender.com/r20n991). (B) Time to ERC in WT recipients with subsequent passages (from >600 days in the donor mouse to ~25 days in passage four with systemic engraftment). (C) Kaplan-Meier survival curve of AT mice based on systematic (n=9) vs. subcutaneous (n=5, Subq) engraftment. Subq engraftment delayed ERC by an average of 5 days (17 vs. 22, p<0.01) (D) Representative UMAPs from spectral flow cytometry analysis showing the major immune cell subsets in the spleen of a WT animal and two AT-SOX11CCND1 mice (subcutaneously and systemically engrafted). The subcutaneously engrafted mouse was sacrificed on day 17 and the systemically mouse on day 18. To determine significance a mantle cox regression used in C.* p<0.05 ** p<0.01 *** p<0.001 **** p<0.0001
Our data show that malignant CD5+/CD19+ B-cells mimicking human MCL can be adoptively transferred into immunocompetent WT recipients with 100% penetrance, and a highly reduced time to ERC over multiple passages providing an optimal therapeutic window for preclinical investigations.
MCL development in Eμ-SOX11CCND1 is associated with an immunosuppressive TME
Next, we aimed to utilize spectral flow cytometry to determine the immune profile of spleens from systemically and subcutaneously engrafted Eμ-SOX11CCND1 mice (n=3 per group) compared to a WT mouse (Figure 3D, Supplemental Figure 4A). Mice were taken before meeting ERC to ensure the spleen contained a proportion of normal immune cells. As expected, clustering on MCL like, dendretic cells (DC), and CD4+ T-cells populations, showed the loss of the normal B-cell (dark blue) in the subcutaneous engrafted animals and more significantly in the systemically engrafted mice (Figure 3D). The normal B-cell compartment was replaced by the expansion of kappa-restricted, B220+, surface IgM+, CD5+, and CD19+ B-cells (Supplemental Figure 4B). Of note, a small percentage of CD5+/CD19+ double-positive B cells was noted in the peripheral blood of WT animals, which likely represents normal B1 cells, as previously reported.22 T cells and myeloid cells were proportionally reduced, with exception in CD8+ T cells and total CD11b+ in the subcutaneiously engrafted mice (Supplemental Figure 4C).
Using the subcutaneous adoptive transfer model, we compared the immune environment in different compartments at ERC, specifically peripheral blood, spleen, and tumor (n=4 per group) (Supplemental Figure 5A). The tumor showed heavy dominance of the malignant cells and a small population of remaining normal B cells. The lack of T or NK cells was likely due to relative proportions compared to lymphoma cells. The spleen and peripheral blood maintained a population of normal immune cell subsets, representing the potential for a host immune response.
Assessing the peripheral blood, spleen, bone marrow, and tumor from transgenic Eμ-SOX11CCND1 mice in the aging colonies at different stages of lymphoma development (3 early lymphomas, 8-10 weeks, and 3 ERC), a significant expansion of CD8+ T cells in the peripheral blood (p<0.05) and bone marrow (p<0.05) compared to WT animals was noted (Supplemental Figure 5B). This trend was also seen in CD4+ T cells and NK cells, though it did not reach statistically significance (Supplemental Figure 5B). Interestingly, there was a significantly increased expression of PD1+ on CD8+ T cells (p<0.01) and, more specifically, in the central memory and effector populations in Eμ-SOX11CCND1 mice (p<0.5, p<0.05) (Figure 4A-B, Supplemental Figure 5C). Naïve CD4 T cells also showed an increase in the percentage of PD1+ cells however, this trend did not reach statistical significance (Supplemental Figure 5C). Of particular interest was the expression of PD1 and PDL1 on the lymphoma cells in the aging colony and adoptive transfer mice (Figure 4C-D). PDL1 expression on lymphoma cells in the blood, bone marrow, and spleen correlated with higher disease burden (R2=0.5741 p<0.01, Figure 4E), suggesting that an immunosuppressive TME contributes to MCL growth in this model.
Figure 4. Immune profiling shows PD1/PDL1 driven immunosuppression in aging Eμ-SOX11CCND1 and AT mice.

(A) PD1 expression in CD8+ T cells isolated from the peripheral blood, spleen, and bone marrow of Eμ-SOX11CCND1 animals from the aging colony compared to age-matched WT mice. (B) PD1 expression in CD4+ T cells isolated from the peripheral blood, spleen, and bone marrow of Eμ-SOX11CCND1 animals from the aging colony compared to age-matched WT mice. (C, D) PD1 and PDL1 heatmaps on UMAP diagrams from an aging Eμ-SOX11CCND1 mouse (C) and an AT mouse (D) show expression of both markers on lymphoma cells. (E) The plot of PDL1 expression intensity and its correlation with tumor burden measured as the percentage of lymphoma cells in the peripheral blood of Eμ-SOX11CCND1 mice (R2=0.5741, p<0.0011). Multiple T-tests with Holm-Šídák correction determined statistical significance for multiple comparisons in A and B. A simple linear regression was used for E. Error bars show standard deviation. * p<0.05 ** p<0.01 *** p<0.001 **** p<0.0001
Lymphoma developed in Eμ-SOX11CCND1 transgenic mice molecularly resembles human MCL.
To characterize the transcriptomic profile of the Eμ-SOX11CCND1 model, we performed bulk RNA-sequencing on splenocytes from adoptively transferred animals (passage 1, n=3). The productive frequency of IgH locus analysis23 showed a clonal expansion in two animals and an oligoclonal expansion of B cells in the third animal compared to WT controls (Figure 5A). RNA-Seq analysis confirmed significantly higher expression of SOX11 and CCND1 in Eμ-SOX11CCND1 mice compared to WT control (Figure 5B) with log2 FC>2. In addition, gene expression analysis showed genes with prognostic significance in MCL, such as BIRC5 and UBE2C, to be in the top 50 upregulated genes in the Eμ-SOX11CCND1 mice compared to WT control (Figure 5C) It is well-documented that human MCL originates from a B-cell subset identified as B1a cells.24 Interestingly, SPN (CD43), CD69, and CD93, which are known markers of B1a cells, were upregulated in Eμ-SOX11CCND1 mice supporting similarities between the lymphoma developed in the Eμ-SOX11CCND1 animals and human MCL. In further support of this, 12 out of 17 genes included in the human MCL gene proliferation signature were also significantly upregulated in our Eμ-SOX11CCND1 model (Figure 5D).25 Mirna Enriched pathway Impact analysis (MITHrIL)19, 26 using expression data of bulk RNA-Seq, showed a significant overlap between pathways activated in the Eμ-SOX11CCND1 model compared to human MCL (Supplemental Figure 6). Among these, Wnt, Foxo/PI3K/Akt/mTOR, and RAS/MAPK pathways were activated in our model.11, 27, 28
Figure 5. SOX11 and CCND1 overexpression lead to clonal expansion of B cells with a human MCL-like gene signature.

(A) IgH locus clonality analysis comparing AT-SOX11CCND1 passage 1 (P1, n=3) lymphoma cells with WT splenic CD19+ B cells (WT, n=3) showing clonal expansion of the B cells after AT in P1-4 and P1-5. (B) Volcano plot presenting the differentially expressed genes (DEGs) of P1 VS WT. SOX11 and CCND1 are shown as significantly DEGs in this comparison. (C) A heat map showing the top 50 DEGs between P1 and WT. Most of the highly DEGs in P1 are known to play a role in human MCL cell cycle dysregulation and are relevant to MCL pathogenesis/progression. (D) Heat map showing the upregulation of proliferation genes in P1 compared to WT using the human MCL proliferation gene signature.
Targeted therapies display anti-lymphoma activity in the Eμ-SOX11CCND1 mouse model.
Given our recent publications highlighting the oncogenic role of protein arginine methyltransferase 5 (PRMT5) in MCL and that inhibition of PRMT5 with the selective small molecule PRT382 (Prelude therapeutics) showed significant survival advantage in multiple MCL patient-derived xenograft (PDX) models,29, 30 we sought to determine if treatment with PRT382 provided survival benefit in the Eμ-SOX11CCND1 model. To address this, 100,000 cells were adoptively transferred into C57bl/6 mice via tail vein injection. Mice were treated 3 days post-engraftment with vehicle control, PRT382 at 5 mg/kg, or PRT382 at 10 mg/kg administered on 4 days on/3 days off schedule (n=9 vehicle control, n=10 PRT382 at 5 mg/kg, and n=10 PRT382 at 10 mg/kg). Treatment with PRT382 resulted in a significant dose-dependent survival advantage (median survival for vehicle control = 18 days (range 16-20); PRT382 5 mg/kg = 33 days (range 33-80); PRT382 10 mg/kg = 67 days (range 47-98, with n=4 mice surviving at the end of the study); P<0.0001, Figure 6A).
Figure 6. Targeting critical MCL pro-survival pathways with small molecule inhibitors provides anti-lymphoma activity in the Eμ-SOX11CCND1 mouse model.

(A) Kaplan-Meier curve showing significant and dose-dependent survival advantage for AT Eμ-SOX11CCND1 animals treated with PRT382 compared to vehicle control. (B, C) Kaplan-Meier curve showing a significant survival advantage for AT Eμ-SOX11CCND1 animals treated with venetoclax or ibrutinib compared to vehicle control. The black circle in (C) indicates the mouse used to generate an acquired ibrutinib resistance by re-passaging cells while keeping the animals on continuous ibrutinib treatment (D, E). A mantle cox regression was used for all plots to determine the significance. * p<0.05 ** p<0.01 *** p<0.001 **** p<0.0001
As part of the same experiment, additional animals were treated with FDA-approved drugs for relapsed/refractory MCL: venetoclax (n=10) and ibrutinib (n=9).31-33 Animals were treated starting on day 3 post engraftment with venetoclax at 12 mg/kg (4 days on, 3 days off) or ibrutinib at 0.21mg/mL in sterile drinking water. Both ibrutinib and venetoclax provided a marginal but significant survival benefit (P<0.05) in this model [median survival for mice treated with venetoclax = 22 days (range 11-41); ibrutinib = 19 days (range 18-61); vehicle control = 18 days (range 16-20), Figure 6B-C).
Given the unmet clinical need for MCL patients who progress on ibrutinib,5, we sought to generate an ibrutinib resistance in our Eμ-Sox11CCND1 model. A mouse that showed intermediate sensitivity to ibrutinib in the initial experiment was chosen for subsequent passages (circled in Figure 6C). 100,000 splenocytes were isolated from this animal at ERC and passaged two additional times by tail vein engraftment (Figure 6D-E), establishing an immunocompetent MCL mouse model of acquired ibrutinib resistance (median survival on ibrutinib: passage #1 = 34 days; passage #2 = 25 days; passage #3 =19 days). Mechanistically, BTK signalling is intact in these mice as shown by dose dependent decrease in BTK phosphorylation in IgM stimulated and ibrutinib-treated malignant B-cells isolatd from an ibrutinib resistant Eμ-Sox11CCND1 animal (Supplemental Figure 5E). In addition, no mutations in BTK (C481S) or PLCγ2 (R665, S707, and L845) were identified using a targeted sequence approach (Supplemental Table 7).
These results show that the Eμ-SOX11CCND1 model can be used to test novel treatment options and represents an important tool to study drug resistance in the context of an intact immune system.
Discussion
MCL is a rare and aggressive subtype of B-cell lymphoma characterized by the clonal expansion of malignant B-cells expressing CD20, CD19, and CD5. B1a cells have been identified as the putative cell of origin for MCL.24 The genetic hallmark present in > 80% of MCL patients is the t(11;14) chromosomal translocation, which juxtaposes CCND1 with an enhancer of the IgH gene, resulting in the overexpression of Cyclin D1, dysregulation of G1/S transition, and chromosome instability7. Cyclin D1 overexpression is the primary oncogenic event in the MCL pathogenesis24 though not sufficient for B-cell transformation.8 Upregulation of the transcription factor SOX11, which regulates key transcriptional programs in MCL, is considered essential for MCL pathogenesis; however, the mechanisms of its overexpression remain incompletely characterized.14, 34, 35 The fully immunocompetent Eμ-SOX11 mouse model is characterized by the (oligo)clonal expansion of B1a cells similar to human MCL but lacks the CCND1 overexpression aspect of MCL to closely recapitulate the molecular pathogenesis of this disease.14
In addition to the Eμ-SOX11 mouse model, over the past three decades, multiple approaches to develop an immunocompetent mouse model of MCL have been attempted, but all have major limitations. The first attempt to generate a Cyclin D1-driven cancer was published by Bodrug et al., in 1994.8 Although the model has high levels of Cyclin D1, this transgenic model fails to develop lymphoma unless also injected with the mitogenic stimulant pristane.8, 36 Interestingly, mice with enforced overexpression of a nuclear mutant of Cyclin D1 under Eμ control develop a mature B-cell lymphoma with blastoid morphology and high MYC expression.37 Similarly, incorporation of Eμ-MYC with either Eμ-CCND18 or IL-14 overexpression38 promotes rapid lymphomagenesis, but these models hold less biological relevance in MCL. While MYC overexpression provides prognostic significance in this disease, it only occurs in 15-20% of MCL patients and primarily in those with the blastoid variant.39, 40 A model closely mimicking human MCL is the Eμ-CCND1 Bim fl/fl on CD19 CRE background.41 The advantage of this model is that mice develop MCL-like disease with a morphologic appearance consistent with human C-MCL,41 however, biallelic deletion of BIM has been reported in only 30-40% of MCL patients.42 In addition, these mice require sheep red blood cell immunization for lymphoma development41 limiting the study of inherent immunosuppressive TME in MCL murine models. More recently, Pieters et al. demonstrated that isolated Cyclin D2 overexpresion is sufficient to drive murine MCL-like development and that it can synergize with loss of TP53.43 However, isolated Cyclin D2 overexpression is rare in MCL and primarily described in Cyclin D1 negative MCL cases limiting the clinical relvance of this model.
To overcome these limitations, we developed a novel double transgenic mouse on a C57/Bl6 background characterized by B cell-specific over-expression of SOX11 and CCND1 (Eμ-SOX11CCND1). Like its human counterpart, the MCL-like disease developed by Eμ-SOX11CCND1 animals is characterized by the clonal expansion of malignant B cells in lymphatic organs and extranodal sites. Additionally, there is a significant degree of morphologic heterogeneity in the lymphoma cells in Eμ-SOX11CCND1 animals. Most mice develop a disease that closely resembles human C-MCL, but we also observe P-MCL- and B-MCL-like morphologies, which paralleled the distribution seen in human MCL patients.44, 45
Similarly to human B1a cells, the malignant B cells isolated from Eμ-SOX11CCND1 mice express CD5 and CD19 and are negative for CD23. In addition, gene expression analysis showed upregulation of SPN, CD69, and CD93, known markers of B1a cells, in Eμ-SOX11CCND1 mice. In further support of the similarities between the lymphoma developed by the Eμ-SOX11CCND1 mice and human MCL, genes with prognostic significance in human MCL are also upregulated in our model. Lastly, there was 70% overlap when we applied our gene expression data to the published human proliferation gene signature developed for human MCL.25 Using MITHrIL analysis19, 26 , we discovered significant overlap between pathways activated in our model and known critical pro-survival signaling pathways in human MCL, such as the Wnt, FOXO/PI3K/Akt/mTOR, and RAS/MAPK pathways.27
Our data shows an increase in the percentage of PD1+ CD4 and CD8 T cells in addition to co-expression of PD1 and PDL1 on lymphoma cells in Eμ-SOX11CCND1 mice suggesting that an immunosuppressive TME may contributes to MCL growth in this model. There are conflicting reports on the degree of expression of PD1/PDL1 in human MCL. In our own published experience,46 we described variable expression of PD1 and PDL1 on a limited number of primary MCL patient samples. That said, there is substantial evidence supporting the ability of MCL cells to polarize macrophages to immunosuppressive PDL1+ TAMs2 which in turn promote MCL cell growth by creating an immunosuppressive TME.47, 48 In addition, published work shows that the presence of PDL1+ TAMs2 inversely correlates with clinical outcomes in MCL.49 Single agent checkpoint blockade has shown minimal activity in MCL clinical trials50 and further work is needed to maximize its therapeutic potential in MCL. Based on our own work and work by others, this could be achieved by modulating the expression of checkpoint molecules using targeted therapies or by combining CAR-T cells with PD1-PDL1 inhibitors where the CAR-T cells will directly target MCL cells partially removing their ability to promote an immunosuppressive TME while checkpoint inhibitors would enhance the immune-mediated antitumor response. Lastly, it has been shown in solid tumor models that a PD1 blocking antibody significantly increased the level of IFN-Ɣ which in turn promoted CAR-T cell proliferation and persistence resulting in a synergistic effect.51, 52
We took advantage of the adoptive transferability of our model to test targeted therapies, including a novel PRMT5 inhibitor and the FDA-approved small molecules venetoclax and ibrutinib. We generated an ibrutinib-resistant Eμ-SOX11CCND1 mouse model, which has clinical relevance, given that patients who progress on ibrutinib have a dismal prognosis.32 Further work is needed to understand the mechanisms of ibrutinib resistance in this model but our data points toward the activation of compensatory pro-survival signaling pathways, similar to what has been described in human MCL53. This represents an ideal tool for testing novel immunotherapies, such as bispecific antibodies and CAR T-cell products, given the disease development in a fully functional immune system without pre-conditioning.
Despite advancements in the treatment of MCL made over the last 2 decades, MCL remains an incurable disease. The double transgenic Eμ-SOX11CCND1 model was developed to overcome the limitations of other MCL mouse models and to offer a tool to advance therapeutics for this incurable disease. This model offers several key advantages: 1) it is a reliable model that closely recapitulates the molecular pathogenesis of MCL; 2) it allows for the testing of novel therapeutic interventions in the context of a fully functional immune system; 3) Eμ-SOX11CCND1 can be adoptively transferred both intravenously and subcutaneously into WT C57Bl/6J recipients for experimental therapeutic studies.
This model has also several limitation that must be considered. First, other common molecular alterations for example involving DNA damage repair proteins54 were not used in this model which may impact the biology and future therapeutic studies. Second, other mutations of CCND1 that occur in human MCL which may facilitate oncogenic cyclinD1 signaling, such as nuclear translocation, were not modeled here.55 Third, as SOX11 is not translocated in MCL, overexpression through an Eu promoter may not recapitulate the normal mechanism governing SOX11 overexpression during the evolution of MCL. Although splenic, liver, lung, kidneys, and bone marrow involvement were seen in this model, lymph node and gastrointestinal involvement was less prononced than expected and thus TME studies may be more limited in these TME niches. Lastly, further work is necessary to investigate additional biological factors or compensatory survival pathways not captured in our current analysis that can explain why the more aggressive disease developed by the Eμ-SOX11CCND1 animals with extensive extranodal involvement, higher Ki67 and mitotic index, did not translate into a statistically significant survival disadvantage compared to Eμ-SOX11 mice.
In summary, we developed an immunocompetent mouse model of MCL that recapitulates most of the molecular pathogenesis of this disease and allows for testing novel anti-MCL therapeutics in the context of a fully functional immune system.
Supplementary Material
Acknowledgments
The authors are grateful to the Ohio State University (OSU) Genomics Shared Resource and the OSU Comparative Pathology and Digital Imaging Shared Resource supported by P30CA016058 and funding 5R01CA282483-02 to LS. FBB was funded by the Pelotonia Graduate Fellowship and the OSU Presidential Fellowship.
We would like to extend our sincere gratitude to Dr. Samuel G. Katz from Yale School of Medicine for providing the CDND1 transgenic mice. We also thank the Icahn School of Medicine, the Department of Hematology and Medical Oncology, for providing resources and Alan Solo from the Institutional Biorepository Pathology Core for their assistance with tissue sections. This work was supported by the National Cancer Institute (NCI) R01CA252222, and we gratefully acknowledge the funding from the Icahn School of Medicine at Mount Sinai.
Footnotes
Disclosure of Conflicts of Interest
Employment: K.V. and P.S. are employees of Prelude Therapeutics
Stock: K.V. And P.S. have stock in Prelude Therapeutics
Research Support: R.A.B received research support from Prelude Therapeutics
S.P. has research support from Amgen, Celgene/Bristol Myers Squibb Corporation, Regeneron, Genentech, imCORE, Caribou and is a consultant for Grail (advisory board)
References
- 1.Schieber M, Gordon LI, Karmali R. Current overview and treatment of mantle cell lymphoma. F1000Research. 2018;7. [Google Scholar]
- 2.Saba NS, Liu D, Herman SE, Underbayev C, Tian X, Behrend D, et al. Pathogenic role of B-cell receptor signaling and canonical NF-κB activation in mantle cell lymphoma. Blood, The Journal of the American Society of Hematology. 2016;128(1):82–92. [Google Scholar]
- 3.Wang M, Munoz J, Goy A, Locke FL, Jacobson CA, Hill BT, et al. KTE-X19 CAR T-cell therapy in relapsed or refractory mantle-cell lymphoma. New England journal of medicine. 2020;382(14):1331–1342. [DOI] [PMC free article] [PubMed] [Google Scholar]
- 4.Martin P, Maddocks K, Leonard JP, Ruan J, Goy A, Wagner-Johnston N, et al. Postibrutinib outcomes in patients with mantle cell lymphoma. Blood, The Journal of the American Society of Hematology. 2016;127(12):1559–1563. [Google Scholar]
- 5.Dreyling M, Aurer I, Cortelazzo S, Hermine O, Hess G, Jerkeman M, et al. Treatment for patients with relapsed/refractory mantle cell lymphoma: European-based recommendations. Leukemia & lymphoma. 2018;59(8):1814–1828. [DOI] [PubMed] [Google Scholar]
- 6.Ott G, Kalla Jr, Ott MM, Schryen B, Katzenberger T, Muüller JG, et al. Blastoid variants of mantle cell lymphoma: frequent bcl-1 rearrangements at the major translocation cluster region and tetraploid chromosome clones. Blood, The Journal of the American Society of Hematology. 1997;89(4):1421–1429. [Google Scholar]
- 7.Jares P, Colomer D, Campo E. Genetic and molecular pathogenesis of mantle cell lymphoma: perspectives for new targeted therapeutics. Nat Rev Cancer. 2007. Oct;7(10):750–62. [DOI] [PubMed] [Google Scholar]
- 8.Bodrug SE, Warner BJ, Bath ML, Lindeman GJ, Harris AW, Adams JM. Cyclin D1 transgene impedes lymphocyte maturation and collaborates in lymphomagenesis with the myc gene. EMBO J. 1994. May 1;13(9):2124–30. [DOI] [PMC free article] [PubMed] [Google Scholar]
- 9.Mozos A, Royo C, Hartmann E, De Jong D, Baró C, Valera A, et al. SOX11 expression is highly specific for mantle cell lymphoma and identifies the cyclin D1-negative subtype. Haematologica. 2009. Nov;94(11):1555–62. [DOI] [PMC free article] [PubMed] [Google Scholar]
- 10.Mathur R, Sehgal L, Braun FK, Berkova Z, Romaguerra J, Wang M, et al. Targeting Wnt pathway in mantle cell lymphoma-initiating cells. J Hematol Oncol. 2015. Jun;8:63. [DOI] [PMC free article] [PubMed] [Google Scholar]
- 11.Gelebart P, Anand M, Armanious H, Peters AC, Dien Bard J, Amin HM, et al. Constitutive activation of the Wnt canonical pathway in mantle cell lymphoma. Blood. 2008. Dec 15;112(13):5171–9. [DOI] [PMC free article] [PubMed] [Google Scholar]
- 12.Sadeghi L, Arvidsson G, Merrien M, A MW, Görgens A, Smith CIE, et al. Differential B-Cell Receptor Signaling Requirement for Adhesion of Mantle Cell Lymphoma Cells to Stromal Cells. Cancers (Basel). 2020. May 2;12(5). [Google Scholar]
- 13.Merolle MI, Ahmed M, Nomie K, Wang ML. The B cell receptor signaling pathway in mantle cell lymphoma. Oncotarget. 2018. May 18;9(38):25332–25341. [DOI] [PMC free article] [PubMed] [Google Scholar]
- 14.Kuo PY, Jatiani SS, Rahman AH, Edwards D, Jiang Z, Ahr K, et al. SOX11 augments BCR signaling to drive MCL-like tumor development. Blood. 2018. May 17;131(20):2247–2255. [DOI] [PMC free article] [PubMed] [Google Scholar]
- 15.Pérez-Galán P, Dreyling M, Wiestner A. Mantle cell lymphoma: biology, pathogenesis, and the molecular basis of treatment in the genomic era. Blood. 2011. Jan 6;117(1):26–38. [DOI] [PMC free article] [PubMed] [Google Scholar]
- 16.Kim D, Paggi JM, Park C, Bennett C, Salzberg SL. Graph-based genome alignment and genotyping with HISAT2 and HISAT-genotype. Nat Biotechnol. 2019. Aug;37(8):907–915. [DOI] [PMC free article] [PubMed] [Google Scholar]
- 17.Li H, Handsaker B, Wysoker A, Fennell T, Ruan J, Homer N, et al. The Sequence Alignment/Map format and SAMtools. Bioinformatics. 2009. Aug 15;25(16):2078–9. [DOI] [PMC free article] [PubMed] [Google Scholar]
- 18.Liao Y, Smyth GK, Shi W. featureCounts: an efficient general purpose program for assigning sequence reads to genomic features. Bioinformatics. 2014. Apr 1;30(7):923–30. [DOI] [PubMed] [Google Scholar]
- 19.Alaimo S, Giugno R, Acunzo M, Veneziano D, Ferro A, Pulvirenti A. Post-transcriptional knowledge in pathway analysis increases the accuracy of phenotypes classification. Oncotarget. 2016. Aug 23;7(34):54572–54582. [DOI] [PMC free article] [PubMed] [Google Scholar]
- 20.Foshat M, Stewart J, Khoury JD, Staerkel GA, Caraway NP. Accuracy of diagnosing mantle cell lymphoma and identifying its variants on fine-needle aspiration biopsy. Cancer Cytopathol. 2019. Feb;127(1):44–51. [DOI] [PubMed] [Google Scholar]
- 21.Created in BioRender. Jafari H. schematics for SOX11/CCND1 adoptive transfer BioRender 2024. [Google Scholar]
- 22.Suchanek O, Ferdinand JR, Tuong ZK, Wijeyesinghe S, Chandra A, Clauder A-K, et al. Tissue-resident B cells orchestrate macrophage polarisation and function. Nature Communications. 2023 2023/November/04;14(1):7081. [Google Scholar]
- 23.Song L, Cohen D, Ouyang Z, Cao Y, Hu X, Liu XS. TRUST4: immune repertoire reconstruction from bulk and single-cell RNA-seq data. Nat Methods. 2021. Jun;18(6):627–630. [DOI] [PMC free article] [PubMed] [Google Scholar]
- 24.Beaudin AE. Takes one to B1a: Dismantling the origin of mantle cell lymphoma. J Exp Med. 2021. Oct 4;218(10). [Google Scholar]
- 25.Scott DW, Abrisqueta P, Wright GW, Slack GW, Mottok A, Villa D, et al. New Molecular Assay for the Proliferation Signature in Mantle Cell Lymphoma Applicable to Formalin-Fixed Paraffin-Embedded Biopsies. J Clin Oncol. 2017. May 20;35(15):1668–1677. [DOI] [PMC free article] [PubMed] [Google Scholar]
- 26.Alaimo S, Marceca GP, Ferro A, Pulvirenti A. Detecting Disease Specific Pathway Substructures through an Integrated Systems Biology Approach. Noncoding RNA. 2017. Apr 19;3(2). [Google Scholar]
- 27.Jang JY, Hwang I, Pan H, Yao J, Alinari L, Imada E, et al. A FOXO1-dependent transcription network is a targetable vulnerability of mantle cell lymphomas. J Clin Invest. 2022. Dec 15;132(24). [Google Scholar]
- 28.Smith SM. Targeting mTOR in mantle cell lymphoma: current and future directions. Best Pract Res Clin Haematol. 2012. Jun;25(2):175–83. [DOI] [PubMed] [Google Scholar]
- 29.Brown-Burke F, Hwang I, Sloan SL, Hinterschied C, Helmig-Mason J, Long ME, et al. PRMT5 Inhibition Drives Therapeutic Vulnerability to Combination Treatment with BCL-2 Inhibition in Mantle Cell Lymphoma. Blood Adv. 2023. Jun 16. [Google Scholar]
- 30.Sloan SL, Brown F, Long ME, Weigel C, Koirala S, Chung JH, et al. PRMT5 supports multiple oncogenic pathways in mantle cell lymphoma. Blood. 2023. Jun 02. [Google Scholar]
- 31.Narkhede M, Goyal G, Shea L, Mehta A, Giri S. Evaluating real-world treatment patterns and outcomes of mantle cell lymphoma. Blood Adv. 2022. Jul 26;6(14):4122–4131. [DOI] [PMC free article] [PubMed] [Google Scholar]
- 32.Rule S, Dreyling M, Goy A, Hess G, Auer R, Kahl B, et al. Ibrutinib for the treatment of relapsed/refractory mantle cell lymphoma: extended 3.5-year follow up from a pooled analysis. Haematologica. 2019. May;104(5):e211–e214. [DOI] [PMC free article] [PubMed] [Google Scholar]
- 33.Wang M, Jurczak W, Trněný M, Belada D, Wrobel T, Ghosh N, et al. Ibrutinib Combined with Venetoclax in Patients with Relapsed/Refractory Mantle Cell Lymphoma: Primary Analysis Results from the Randomized Phase 3 Sympatico Study. Blood. 2023;142(Supplement 2):LBA-2–LBA-2. [Google Scholar]
- 34.Dictor M, Ek S, Sundberg M, Warenholt J, György C, Sernbo S, et al. Strong lymphoid nuclear expression of SOX11 transcription factor defines lymphoblastic neoplasms, mantle cell lymphoma and Burkitt's lymphoma. Haematologica. 2009. Nov;94(11):1563–8. [DOI] [PMC free article] [PubMed] [Google Scholar]
- 35.Zeng W, Fu K, Quintanilla-Fend L, Lim M, Ondrejka S, Hsi ED. Cyclin D1-negative blastoid mantle cell lymphoma identified by SOX11 expression. Am J Surg Pathol. 2012. Feb;36(2):214–9. [DOI] [PubMed] [Google Scholar]
- 36.Smith MR, Joshi I, Jin F, Al-Saleem T. Murine model for mantle cell lymphoma. Leukemia. 2006. May;20(5):891–3. [DOI] [PubMed] [Google Scholar]
- 37.Gladden AB, Woolery R, Aggarwal P, Wasik MA, Diehl JA. Expression of constitutively nuclear cyclin D1 in murine lymphocytes induces B-cell lymphoma. Oncogene. 2006. Feb 16;25(7):998–1007. [DOI] [PMC free article] [PubMed] [Google Scholar]
- 38.Ford RJ, Shen L, Lin-Lee YC, Pham LV, Multani A, Zhou HJ, et al. Development of a murine model for blastoid variant mantle-cell lymphoma. Blood. 2007. Jun 1;109(11):4899–906. [DOI] [PMC free article] [PubMed] [Google Scholar]
- 39.Nadeu F, Martin-Garcia D, Clot G, Díaz-Navarro A, Duran-Ferrer M, Navarro A, et al. Genomic and epigenomic insights into the origin, pathogenesis, and clinical behavior of mantle cell lymphoma subtypes. Blood. 2020. September 17;136(12):1419–1432. [DOI] [PMC free article] [PubMed] [Google Scholar]
- 40.Hill HA, Qi X, Jain P, Nomie K, Wang Y, Zhou S, et al. Genetic mutations and features of mantle cell lymphoma: a systematic review and meta-analysis. Blood Adv. 2020. July 14;4(13):2927–2938. [DOI] [PMC free article] [PubMed] [Google Scholar]
- 41.Katz SG, Labelle JL, Meng H, Valeriano RP, Fisher JK, Sun H, et al. Mantle cell lymphoma in cyclin D1 transgenic mice with Bim-deficient B cells. Blood. 2014. Feb;123(6):884–93. [DOI] [PMC free article] [PubMed] [Google Scholar]
- 42.Tagawa H, Karnan S, Suzuki R, Matsuo K, Zhang X, Ota A, et al. Genome-wide array-based CGH for mantle cell lymphoma: identification of homozygous deletions of the proapoptotic gene BIM. Oncogene. 2005. Feb 17;24(8):1348–58. [DOI] [PubMed] [Google Scholar]
- 43.Pieters T, T'Sas S, Vanhee S, Almeida A, Driege Y, Roels J, et al. Cyclin D2 overexpression drives B1a-derived MCL-like lymphoma in mice. J Exp Med. 2021. Oct 4;218(10). [Google Scholar]
- 44.Hoster E, Pott C. Minimal residual disease in mantle cell lymphoma: insights into biology and impact on treatment. Hematology 2014, the American Society of Hematology Education Program Book. 2016;2016(1):437–445. [Google Scholar]
- 45.Shrestha R, Bhatt VR, Guru Murthy GS, Armitage JO. Clinicopathologic features and management of blastoid variant of mantle cell lymphoma. Leukemia & lymphoma. 2015;56(10):2759–2767. [DOI] [PubMed] [Google Scholar]
- 46.Harrington BK, Wheeler E, Hornbuckle K, Shana’ah AY, Youssef Y, Smith L, et al. Modulation of immune checkpoint molecule expression in mantle cell lymphoma. Leukemia & lymphoma. 2019. [Google Scholar]
- 47.Le K, Sun J, Khawaja H, Shibata M, Maggirwar SB, Smith MR, et al. Mantle cell lymphoma polarizes tumor-associated macrophages into M2-like macrophages, which in turn promote tumorigenesis. Blood Advances. 2021;5(14):2863–2878. [DOI] [PMC free article] [PubMed] [Google Scholar]
- 48.de Matos Rodrigues J, Lokhande L, Olsson LM, Hassan M, Johansson A, Janská A, et al. CD163+ macrophages in mantle cell lymphoma induce activation of prosurvival pathways and immune suppression. Blood Advances. 2024;8(16):4370–4385. [DOI] [PMC free article] [PubMed] [Google Scholar]
- 49.Rodrigues JM, Nikkarinen A, Hollander P, Weibull CE, Räty R, Kolstad A, et al. Infiltration of CD163-, PD-L1-and FoxP3-positive cells adversely affects outcome in patients with mantle cell lymphoma independent of established risk factors. British journal of haematology. 2021;193(3):520–531. [DOI] [PubMed] [Google Scholar]
- 50.Lesokhin AM, Ansell SM, Armand P, Scott EC, Halwani A, Gutierrez M, et al. Nivolumab in patients with relapsed or refractory hematologic malignancy: preliminary results of a phase Ib study. Journal of clinical oncology. 2016;34(23):2698–2704. [DOI] [PMC free article] [PubMed] [Google Scholar]
- 51.John LB, Devaud C, Duong CP, Yong CS, Beavis PA, Haynes NM, et al. Anti-PD-1 antibody therapy potently enhances the eradication of established tumors by gene-modified T cells. Clinical cancer research. 2013;19(20):5636–5646. [DOI] [PubMed] [Google Scholar]
- 52.Peng W, Liu C, Xu C, Lou Y, Chen J, Yang Y, et al. PD-1 blockade enhances T-cell migration to tumors by elevating IFN-γ inducible chemokines. Cancer research. 2012;72(20):5209–5218. [DOI] [PMC free article] [PubMed] [Google Scholar]
- 53.Ahmed M, Lorence E, Wang J, Jung D, Zhang L, Nomie K, et al. Interrogating B cell signaling pathways: A quest for novel therapies for mantle cell lymphoma. Science signaling. 2019;12(567):eaat4105. [DOI] [PubMed] [Google Scholar]
- 54.Body S, Esteve-Arenys A, Miloudi H, Recasens-Zorzo C, Tchakarska G, Moros A, et al. Cytoplasmic cyclin D1 controls the migration and invasiveness of mantle lymphoma cells. Sci Rep. 2017. Oct 24;7(1):13946. [DOI] [PMC free article] [PubMed] [Google Scholar]
- 55.Wiestner A, Tehrani M, Chiorazzi M, Wright G, Gibellini F, Nakayama K, et al. Point mutations and genomic deletions in CCND1 create stable truncated cyclin D1 mRNAs that are associated with increased proliferation rate and shorter survival. Blood. 2007. Jun 1;109(11):4599–606. [DOI] [PMC free article] [PubMed] [Google Scholar]
Associated Data
This section collects any data citations, data availability statements, or supplementary materials included in this article.