

Abstract
Cholesterol-dependent cytolysins (CDCs) constitute the largest group of pore-forming toxins and serve as critical virulence factors for diverse pathogenic bacteria. Several CDCs are known to activate the NLRP3 inflammasome, although the mechanisms are unclear. Here we discovered that multiple CDCs, which we referred to as type A CDCs, were internalized and translocated to the trans-Golgi network (TGN) to remodel it into a platform for NLRP3 activation through a unique peeling membrane mechanism. Potassium efflux was dispensable for CDC-mediated TGN remodeling and NLRP3 recruitment, but was required for the recruitment of the downstream adaptor ASC. In contrast, desulfolysin, which we referred to as type B CDC, was not internalized or translocated to the TGN due to its distinct C-terminal domain 4, despite potent pore formation on the plasma membrane, and hence could not activate NLRP3. Our discoveries uncovered the ability of CDCs to directly remodel an intracellular organelle for inflammatory response.
Bacterial cholesterol-dependent cytolysins (CDCs) represent the largest class in pore-forming toxins and major virulence arsenal in pathogenic bacteria1. CDCs are composed of four domains (D1–D4) and form large pores with diameters of 25–30 nm through D4-mediate binding to cholesterol on the plasma membrane2. During infections, CDCs are secreted at sublytic concentrations that do not directly kill host cells, but instead alter the membrane permeability and induce potassium (K+) efflux and calcium (Ca2+) influx3,4. Many CDC-encoding Gram-positive bacteria are important human pathogens and CDC-mediated pore-formation contributes to the bacterial invasion, dissemination and virulence1. For example, Clostridium perfringens causes the deadly gas gangrene, whereas deficiency in its encoded CDC perfringolysin O (PFO) significantly reduces disease severity5,6; Bacillus anthracis causes anthrax, whereas its encoded CDC anthrolysin O (ALO) contributes to the pathogenesis7; Streptococcus suis causes sepsis and meningitis, whereas its encoded CDC suilysin (SLY) serves as a critical virulence factor8.
CDCs can modulate intracellular processes indirectly through pore formation and ionic homeostasis alterations, causing mitochondrial fragmentation/dysfunction9,10, endoplasmic reticulum (ER) vacuolization11, lysosomal permeabilization12 and allowing the entry of bacterial NAD-glycohydrolase to induce Golgi apparatus fragmentation13. However, whether CDCs directly remodel the morphologies and functions of intracellular organelles remains unclear. Several CDCs activate the NLRP3 inflammasome, a pattern recognition receptor that senses diverse pathogen- and danger-derived agonists without direct binding14. Activated NLRP3 recruits the adaptor ASC, which then recruits the protease caspase-114. Caspase-1 undergoes autocleavage into p20 and p10 fragments to induce proinflammatory cytokine activation and pyroptosis15, which facilitates bacterial clearance during Streptococcus pneumoniae infection16,17. However, excessive NLRP3 inflammasome activation by CDCs may promote pathogenesis such as in the case of C. perfringens infection18. Several mechanisms, including K+ efflux, mitochondrial dysfunction, ATP-P2X7 axis and Ca2+ mobilization have been proposed for CDC-mediated NLRP3 activation4,19-22, although their detailed contributions are not fully understood. trans-Golgi network (TGN) dispersion is an essential common cellular signal for NLRP3 activation by small molecule stimuli (e.g., the bacterial ionophore nigericin and ATP) and nonribosomal peptides (e.g., gramicidin)23. NLRP3 is recruited to the dispersed TGN through ionic bonding between its positively charged KKKK motif and the negatively charged phospholipid PtdIns4P on the TGN, leading to the assembly and activation of the NLRP3 inflammasome complex23. Whether TGN remodeling is broadly essential for NLRP3 activation by microbial protein agonists including CDCs is unclear.
Here we found that CDCs could be grouped into two types, type A and type B, based on whether they were internalized or not. Type A CDCs translocated to the TGN through the D4 domain and reorganized the TGN through a peeling membrane mechanism to activate NLRP3, a process independent of ion flux and negatively regulated by membrane repair. Our study revealed how mammalian cells translated pores in the plasma membrane into an 'altered self' signal to recruit and activate the cytosolic sensor NLRP3.
RESULTS
PFO induces TGN dispersion and NLRP3 recruitment
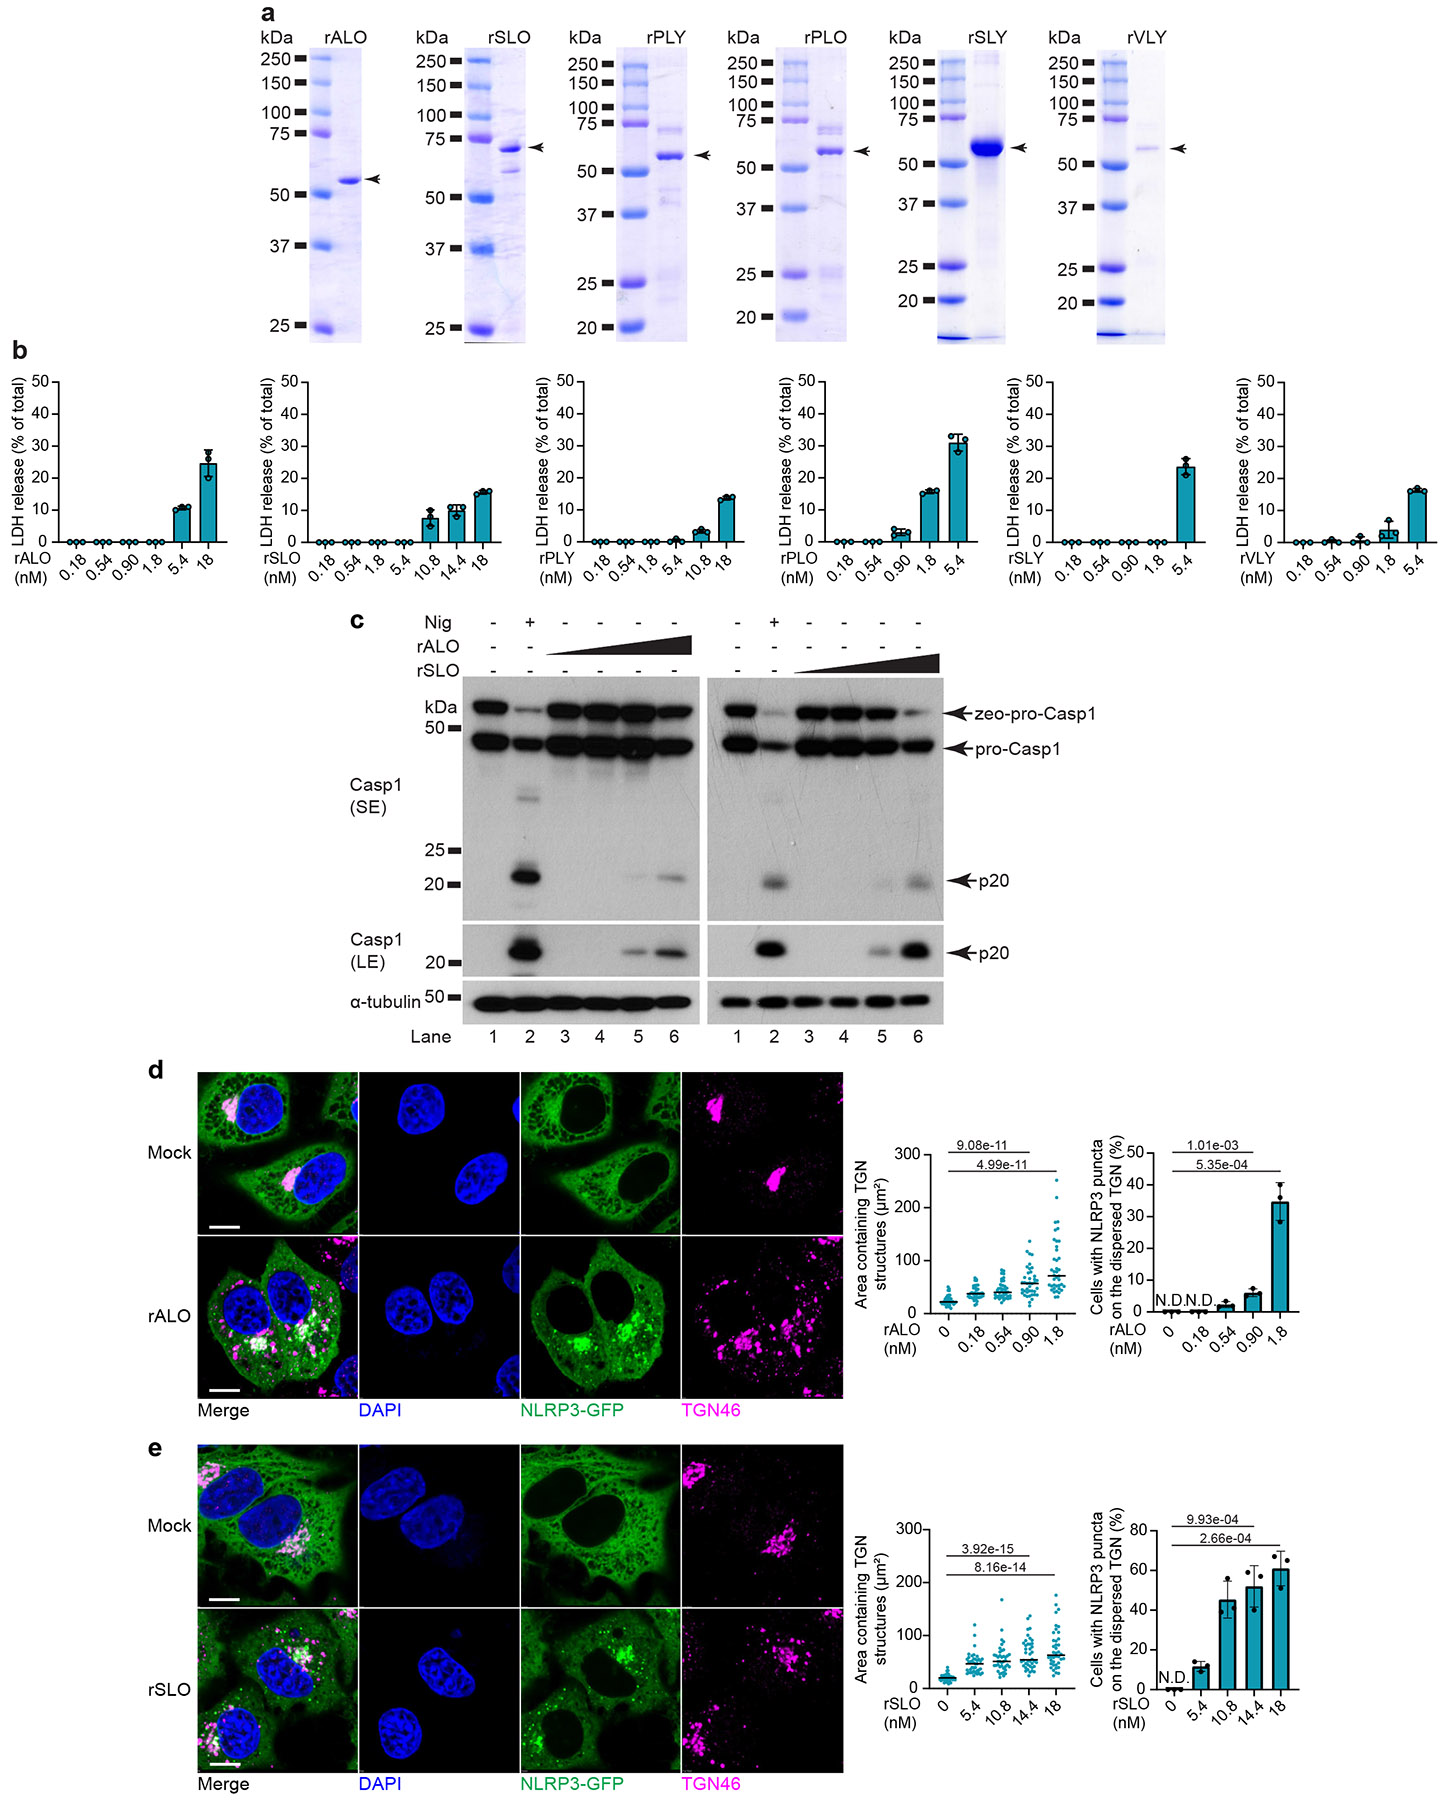
Recombinant (r)PFO was purified from Escherichia coli (Extended Data Fig. 1a). Signal peptide deletion and cysteine (Cys)-to-alanine (Ala) substitution in the undecapeptide were applied to all recombinant CDCs in this study to mimic secreted active CDCs24,25, unless otherwise specified. CDC concentrations that resulted in ⩽10% lactate dehydrogenase (LDH) release (i.e., ⩽1.8 nM for rPFO, Extended Data Fig. 1b) were used as sublytic concentrations. HeLa and HEK293T cell lines do not express endogenous inflammasome components26 or P2X7, the receptor for ATP-mediated NLRP3 activation23,27. Therefore, individual inflammasome components can be stably expressed via lentiviral transduction to reconstitute the NLRP3 inflammasome pathway, without the interference of potential NLRP3 activation by CDC-mediated ATP release23. Addition of sublytic rPFO to HeLa cells expressing NLRP3-GFP23 (HeLa NLRP3-GFP) induced TGN disassembly into vesicles, as indicated by immunofluorescence of TGN46 (Fig. 1a and Extended Data Fig. 1c), a TGN protein involved in cargo trafficking. NLRP3 was recruited to the remodeled TGN to form puncta, a hallmark of NLRP3 activation23, in a dose-dependent manner (Extended Data Fig. 1c). In contrast, rPFOY181A, a mutant defective in pore formation24 (Extended Data Fig. 1b), failed to induce TGN dispersion or NLRP3 recruitment (Fig. 1a and Extended Data Fig. 1c). rPFO but not rPFOY181A induced robust caspase-1 cleavage in HEK293T cells expressing NLRP3, ASC and caspase-1 (hereafter 293NAC) (Extended Data Fig. 1d).
Figure 1. PFO induced TGN dispersion and NLRP3 recruitment.
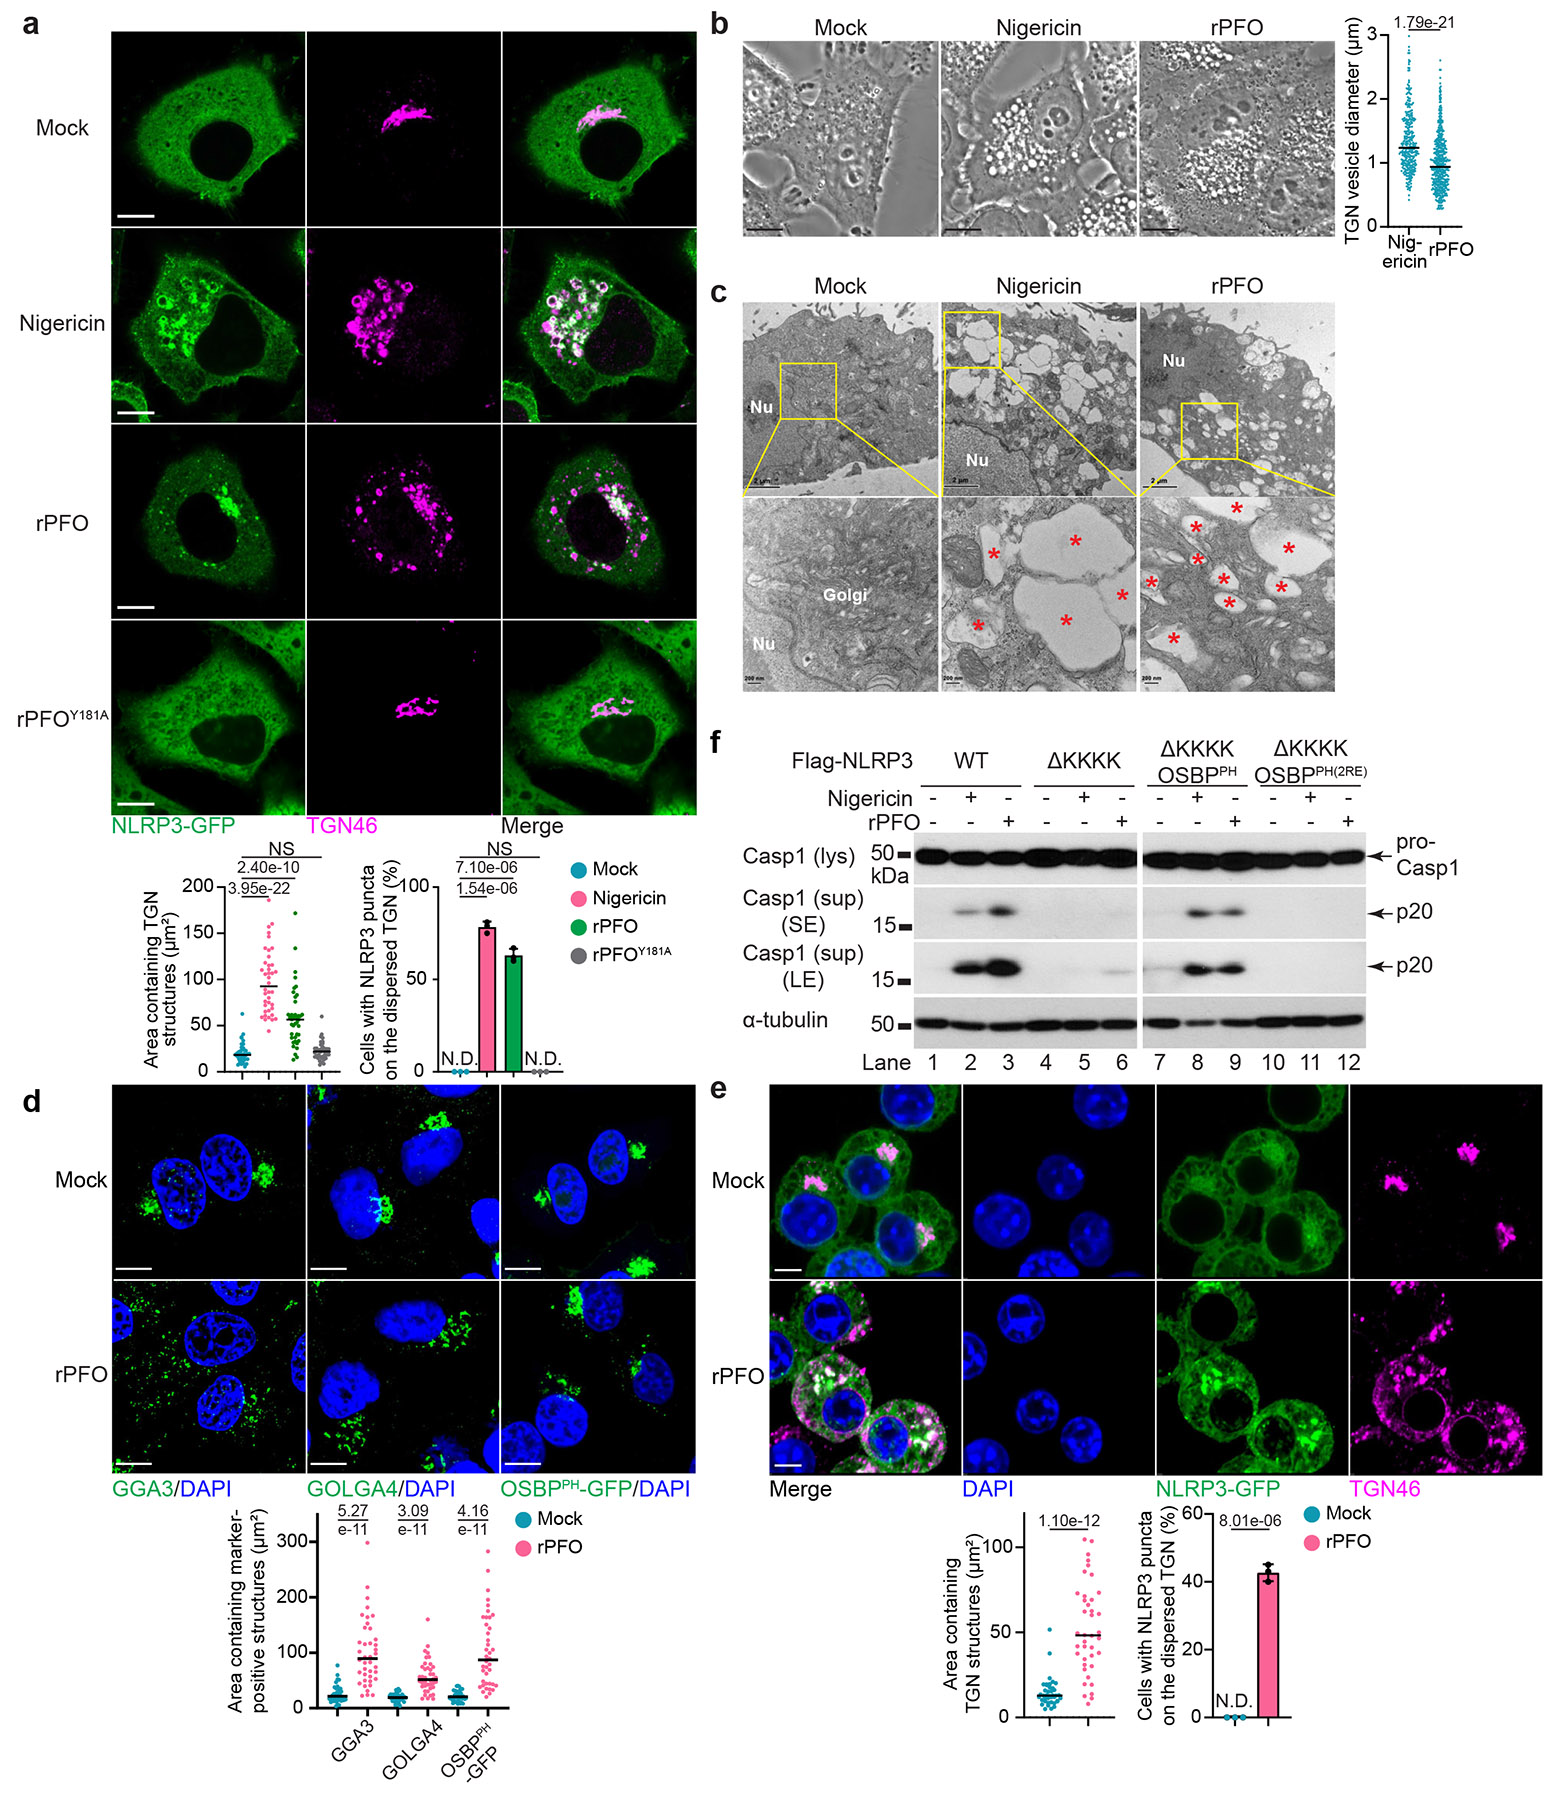
a, Representative immunofluorescence images (top) and quantification of TGN dispersion and NLRP3 recruitment (bottom) in HeLa cells stably expressing NLRP3-GFP incubated with 10 μM nigericin, 0.90 nM rPFO, 0.90 nM rPFOY181A or not (Mock) for 80 min before TGN46 immunofluorescence imaging. Scale bar, 10 μm. Areas containing TGN structures were measured with ImageJ (n = 40 cells per condition; mean ± s.d.; two-sided t-test; NS, not significant). NLRP3 recruitment was quantified from 100 cells (n = 3; N.D., not detectable). Representative from at least 3 independent experiments. b, Representative phase contrast images (left) and quantification of TGN vesicle diameter (right) in HeLa cells incubated with nigericin, rPFO or not (Mock) as in a. Scale bar, 10 μm. TGN vesicle diameter was measured with image J (n = 322 and 458 TGN vesicles from 10 cells for each condition). Representative from at least 3 independent experiments. c, Representative transmission electron microscopy images in HeLa cells incubated with nigericin, rPFO or not (Mock) as in a. Nu, nucleus. Red *, TGN vesicles. Representative from 2 independent experiments (n ≥ 40 cells per experiment). d, Representative images of GGA3 and GOLGA4 immunofluorescence in HeLa cells or HeLa cells stably expressing OSBPPH-GFP (top) and quantification of areas containing these proteins (bottom) incubated with 0.90 nM rPFO or not (Mock) for 80 min. Scale bar, 10 μm. Areas containing the indicated markers were measured as in a. Representative from at least 3 independent experiments. e, Representative immunofluorescence images (top) and quantification of TGN dispersion and NLRP3 recruitment (bottom) in Asc−/− iBMDM cells stably expressing NLRP3-GFP and human TGN46 incubated with 5.4 nM rPFO or not (Mock) for 60 min. Scale bar, 5 μm. Quantification was performed as in a. Representative from at least 3 independent experiments. f, Immunoblots of Nlrp3−/− iBMDM cells complemented with Flag-NLRP3 wild-type (WT), ΔKKKK (lacking the KKKK motif), ΔKKKK OSBPPH (KKKK motif replaced with OSBPPH) and ΔKKKK OSBPPH(2RE) (KKKK motif replaced with OSBPPHR107/108E) before incubation with 20 μM nigericin or 5.4 nM rPFO for 60 min. lys, lysate; sup, supernatant containing secreted proteins. SE, short exposure; LE, long exposure. Representative from 3 independent experiments.
rPFO-induced TGN vesicles appeared as bright vesicles with phase contrast microscopy (Fig. 1b and Extended Data Fig. 1e) and electron-lucent vesicles with transmission electron microscopy (Fig. 1c). While the morphology of these vesicles resemble those induced by nigericin23, the average diameter of rPFO-induced vesicles (1.02 ± 0.44 μm) was lower than that of nigericin-induced ones (1.34 ± 0.47 μm) (Fig. 1b,c). Similar to nigericin23, rPFO treatment dispersed other TGN markers, including GGA3 and GOLGA4 (Fig. 1d), two TGN proteins involved in cargo trafficking. rPFO also dispersed the PtdIns4P marker OSBPPH-GFP (Fig. 1d and Supplementary Movie 1), composed of the PH domain of the lipid transfer protein OSBP fused to GFP28, but did not disperse the cis- or medial-Golgi (Extended Data Fig. 1f). rPFO-induced NLRP3 aggregates were not detected on other organelles examined (Extended Data Fig. 1g).
To visualize NLRP3 recruitment without the interference of downstream ASC speck formation or pyroptosis, we generated ASC-deficient immortalized bone marrow-derived macrophages (Asc−/− iBMDMs) with CRISPR-Cas9 technology (Supplementary Fig. 1a). Based on the LDH release assay, 5.4 nM rPFO was used as the sublytic concentration for iBMDMs (Supplementary Fig. 1b). In Asc−/− iBMDMs, rPFO induced TGN dispersion and recruitment of NLRP3 (Fig. 1e), which colocalized with the dispersed TGN but not with mitochondria (Supplementary Fig. 1c). We next generated Asc−/− C57BL/6J mice with CRISPR-Cas9 technology (Supplementary Fig. 1d). Primary BMDMs from Asc−/− C57BL/6J mice showed TGN disassembly with rPFO addition, as indicated by endogenous imaging of TGN38, the mouse equivalent of human TGN46 (Supplementary Fig. 1e).
Deletion of the KKKK motif (ΔKKKK) abolished NLRP3 inflammasome activation by both K+ efflux-dependent (e.g., nigericin) and -independent stimuli (imiquimod and CL097)23. Replacing the KKKK motif with OSBPPH (ΔKKKK OSBPPH), but not with its PtdIns4P-binding-defective R107/108E mutant (ΔKKKK OSBPPH(2RE)), restored NLRP3 stimulation by these stimuli23. To examine whether this also applies to PFO, we established an NLRP3-deficient (Nlrp3−/−) iBMDM cell line with CRISPR-Cas9 technology (Supplementary Fig. 1f), which maintained caspase-1 cleavage in response to the AIM2 inflammasome stimulus poly(dA:dT), but not to nigericin or rPFO (Supplementary Fig. 1g). Introduction of Flag-NLRP3 wild-type (WT) or ΔKKKK OSBPPH, but not ΔKKKK or ΔKKKK OSBPPH(2RE), restored rPFO-induced caspase-1 cleavage (Fig. 1f and Supplementary Fig. 1h). Thus, rPFO facilitated the recruitment and activation of NLRP3 through the KKKK-PtdIns4P bonding.
C. perfringens induces TGN dispersion and NLRP3 recruitment
Consistent with previous literature18,29, infection with C. perfringens strain 13, which secretes PFO (Supplementary Fig. 2a), led to caspase-1 cleavage in WT iBMDMs and Nlrp3−/− iBMDMs complemented with Flag-NLRP3, but not in Nlrp3−/− iBMDMs (Supplementary Fig. 2b). Unlike the parental C. perfringens strain 13, the isogenic strain lacking PFO (ΔpfoA) failed to induce caspase-1 or IL-1β cleavage, while a ΔpfoA strain complemented with PFO (ΔpfoA + pfoA)30,31 restored these activities (Fig. 2a and Supplementary Fig. 2a). ΔpfoA + pfoA had weaker caspase-1 and IL-1β cleavage compared to the parental strain (Fig. 2a), likely because the former had lower PFO expression level compared to the latter (Supplementary Fig. 2a).
Figure 2. C. perfringens secretion induced TGN dispersion and NLRP3 recruitment through PFO.

a, Immunoblots of WT iBMDM cells primed with 50 ng/mL LPS for 3 hours (h) before incubation with 5.4 nM rPFO or wild-type C. perfringens (WT), an isogenic C. perfringens strain lacking PFO (ΔpfoA) or ΔpfoA complemented with PFO (ΔpfoA + pfoA) at a multiplicity of infection (MOI) of 1, 10, 20 and 50 for 60 min. lys, lysate; sup, supernatant. Representative from 3 independent experiments. b, Immunoblots of WT iBMDM cells primed as in a before incubation with 5.4 nM rPFO or C. perfringens (WT), ΔpfoA, ΔpfoA + pfoA or an isogenic C. perfringens lacking phospholipase C (Δplc) culture supernatant (equivalent to MOI of 50, 20 and 10) for 60 min. Representative from 3 independent experiments. c, Representative immunofluorescence images (top) and quantification of TGN dispersion and NLRP3 recruitment (bottom) in Asc−/− iBMDM cells stably expressing NLRP3-GFP and human TGN46 incubated with C. perfringens (WT), ΔpfoA, ΔpfoA + pfoA or Δplc culture supernatant (equivalent to MOI of 20) or not (Mock) for 60 min. Scale bar, 3 μm. Areas containing TGN structures were measured with ImageJ (n = 40 cells per condition; mean ± s.d.; two-sided t-test; NS, not significant). NLRP3 recruitment was quantified from 100 cells (n = 3; N.D., not detectable). Representative from at least 3 independent experiments.
To investigate whether NLRP3 inflammasome activation was caused by PFO secreted from bacteria instead of direct contact with bacteria, C. perfringens culture supernatant was filtered and incubated with WT iBMDMs. Robust caspase-1 and IL-1β cleavage were detected with WT and ΔpfoA + pfoA bacterial supernatant, but not with ΔpfoA supernatant (Fig. 2b). In addition, WT and ΔpfoA + pfoA bacterial supernatant, but not ΔpfoA supernatant, induced robust TGN dispersion and NLRP3 recruitment in Asc−/− iBMDMs (Fig. 2c). Supernatant from an isogenic strain lacking phospholipase C (PLC), Δplc30, induced TGN dispersion, NLRP3 recruitment and caspase-1/IL-1β cleavage at 60 minutes (min) comparable to WT C. perfringens (Fig. 2b,c), consistent with reports that PLC only contributes to NLRP3 inflammasome activation after overnight infection29. Thus, PFO secreted by C. perfringens was responsible for TGN remodeling and NLRP3 inflammasome activation during C. perfringens infection.
Multiple CDCs trigger TGN remodeling and NLRP3 recruitment
To determine whether other CDCs induce TGN remodeling, we selected another six CDCs with distinct features from various pathogenic bacteria: ALO from Bacillus anthracis, streptolysin O (SLO) from Streptococcus pyogenes, pneumolysin (PLY) from S. pneumoniae32, pyolysin (PLO) from Trueperella pyogenes33, SLY from S. suis, and vaginolysin (VLY) from Gardnerella vaginalis34 (Extended Data Table 1). SLO35, PLY20, PLO36 and SLY37 activate the NLRP3 inflammasome, while whether ALO and VLY activate NLRP3 is not well defined. The recombinant CDCs were purified from E. coli (Extended Data Fig. 2a) and their sublytic concentrations were determined with LDH release assay (Extended Data Fig. 2b). All six CDCs induced caspase-1 cleavage in 293NAC at sublytic concentrations (Fig. 3a,b and Extended Data Fig. 2c) and triggered TGN dispersion and NLRP3 recruitment in HeLa NLRP3-GFP (Fig. 3c and Extended Data Fig. 2d-e). Thus, the TGN remodeling activity was conserved among multiple CDCs from pathogenic bacteria.
Figure 3. Multiple CDCs induced TGN remodeling and NLRP3 recruitment.

a,b, Immunoblots of HEK293T cells stably expressing NLRP3, ASC and caspase-1 (Casp1) incubated with 10 μM nigericin or 0.18/0.54/1.8/5.4 nM rPLY (a) or 10 μM nigericin, 0.18/0.54/0.90/1.8 nM rPLO, 0.18/0.54/0.90/1.8 nM rSLY or 0.18/0.54/0.90/1.8 nM rVLY (b) for 40 min. pro-Casp1 has two bands because it was expressed as zeocinr-F2A-Casp1 (upper band) before ribosomal skipping to release pro-Casp1 (lower band). SE, short exposure; LE, long exposure. Representative from at least 3 independent experiments. c, Representative immunofluorescence images (top) and quantification of TGN dispersion and NLRP3 recruitment (bottom) in HeLa cells stably expressing NLRP3-GFP incubated with 5.4 nM rPLY, 0.90 nM rPLO, 1.8 nM rSLY, 0.90 nM rVLY or not (Mock) for 80 min before TGN46 immunofluorescence imaging. Scale bar, 10 μm. Areas containing TGN structures were measured with ImageJ (n = 40 cells per condition; mean ± s.d.; two-sided t-test). NLRP3 recruitment was quantified from 100 cells (n = 3; N.D., not detectable). Representative from at least 3 independent experiments.
CDCs represent a third type of NLRP3 stimuli
K+ efflux is not required for nigericin-induced TGN dispersion, but is required for nigericin-induced NLRP3 recruitment to the dispersed TGN23, probably because K+ efflux lowers the ionic strength to promote KKKK-PtdIns4P ionic bonding. In contrast, K+ efflux-independent stimuli (imiquimod and CL097) do not require K+ efflux for TGN dispersion or NLRP3 recruitment23, probably because they induce a more pronounced TGN dispersion23 and expose PtdIns4P in a more efficient conformation to recruit NLRP3. While CDCs require K+ efflux for NLRP3 inflammasome activation20,22, it is unclear which step requires K+ efflux. When WT iBMDMs were incubated with increasing concentrations of KCl, which inhibit K+ efflux22,23, nigericin- and rPFO-induced caspase-1 and IL-1β cleavage were blocked (Fig. 4a). While neither nigericin- nor rPFO-induced TGN dispersion was affected by K+ efflux inhibition, only nigericin-, but not rPFO-induced NLRP3 recruitment was blocked by K+ efflux inhibition in HeLa NLRP3-GFP (Fig. 4b,c). Similarly, neither rPFO-induced TGN dispersion nor rPFO-induced NLRP3 recruitment was affected by K+ efflux inhibition in Asc−/− iBMDMs (Supplementary Fig. 3). In contrast, both nigericin and rPFO-induced ASC speck formation were significantly reduced by K+ efflux inhibition in HeLa cells stably expressing NLRP3-GFP and ASC (HeLa NLRP3-GFP+ASC) (Fig. 4d) and Casp1−/− iBMDMs (Fig. 4e). Similar to rPFO, TGN dispersion and NLRP3 recruitment induced by rALO, rSLO and rPLY were not affected by K+ efflux inhibition in HeLa NLRP3-GFP (Extended Data Fig. 3a-c), while ASC speck formation induced by these CDCs was significantly reduced by K+ efflux inhibition (Extended Data Fig. 3d). Thus, CDCs represented a third type of NLRP3 stimuli that required K+ efflux in the step of ASC activation (Extended Data Fig. 3e).
Figure 4. CDCs represent a third type of NLRP3 stimuli.

a, Immunoblots of WT iBMDM cells primed with 50 ng/mL LPS for 3 h before incubation with 20 μM nigericin or 5.4 nM rPFO in the presence of 0/10/20/30/45 mM KCl for 60 min. lys, lysate; sup, supernatant. Representative from at least 3 independent experiments. b–d, Representative immunofluorescence images (b), quantification of TGN dispersion and NLRP3 recruitment (c) and quantification of ASC speck formation (d) in HeLa cells stably expressing NLRP3-GFP (b,c) or NLRP3-GFP and ASC (d) incubated with 10 μM nigericin or 0.90 nM rPFO for 80 min in the presence of KCl at the indicated concentrations before TGN46 immunofluorescence imaging (b,c) or ASC immunofluorescence imaging (d). Scale bar, 10 μm. Areas containing TGN structures were measured with ImageJ (n = 40 cells per condition, mean ± s.d., two-sided t-test; NS, not significant). NLRP3 and ASC recruitment were quantified from 100 cells (n = 3; N.D., not detectable). Representative from at least 3 independent experiments. e, Representative ASC immunofluorescence images (left) and quantification of ASC speck formation (right) in Casp1−/− iBMDM cells primed with 50 ng/mL LPS for 3 h before incubation with 20 μM nigericin or 5.4 nM rPFO in the presence of KCl at the indicated concentrations for 60 min and quantified as in d. Scale bar, 25 μm. Representative from at least 3 independent experiments.
PFO is internalized and translocates to the TGN
Because PFO-mediated TGN remodeling is independent of K+ efflux, we next examined whether PFO directly translocated to the TGN. We purified rPFO with an N-terminal Flag tag from E. coli (Supplementary Fig. 4a). Flag immunofluorescence indicated that Flag-rPFO was predominantly localized near the cell edge of HeLa (Supplementary Fig. 4b), consistent with its pore-forming activity on the plasma membrane. However, a small fraction of Flag-rPFO was detected inside HeLa and partially colocalized with the dispersed TGN vesicles, but not with the cis-Golgi (Supplementary Fig. 4b-d). Due to the low percentage of internalized rPFO and the interference of extracellular rPFO, the signal-to-noise ratio of Flag immunofluorescence was not optimal. To further examine PFO internalization, we developed a signal-amplifying imaging system based on the SunTag technology38. rPFO was fused to 10 copies of scaffold peptides (GCN4) (10xGCN4-rPFO) and purified from E. coli (Supplementary Fig. 4e). 10xGCN4 tagging did not affect rPFO-induced TGN dispersion or NLRP3 recruitment in HeLa NLRP3-GFP, or caspase-1 cleavage in 293NAC (Supplementary Fig. 4f,g). We next added 10xGCN4-rPFO to HeLa stably expressing the single-chain variable fragment tagged with a superfolder GFP (HeLa scFv-sfGFP). While extracellular 10xGCN4-rPFO was 'invisible' with fluorescence microscopy, internalized 10xGCN4-rPFO can recruit up to 10 copies of scFv-sfGFP through the GCN4-scFv interaction (Supplementary Fig. 4h), thus significantly improving the signal-to-noise ratio and enabling visualization of internalized PFO below the detection limit of Flag immunofluorescence (Supplementary Fig. 4i). Using this system, we discovered that internalized 10xGCN4-rPFO went through two distinct stages. At 10 min post addition, 10xGCN4-rPFO appeared as small intracellular aggregates ('rPFO puncta', Fig. 5a). Starting from 20 min, a larger type of rPFO aggregates started to appear ('rPFO foci', Fig. 5a,b). rPFO foci strongly colocalized with the TGN starting between 20 and 30 min (Fig. 5a,c), correlating with marked TGN dispersion (Fig. 5a,d). We performed stimulated emission depletion (STED) super-resolution microscopy using the SunTag system. While rPFO puncta appeared as single spherical dots with diameter of ~0.2–0.5 μm, rPFO foci appeared as more complex structures with diameter of ~0.7–1.2 μm, which consisted of multiple smaller subunits (Fig. 5e,f). In some of the foci, these subunits appeared as empty-center structures and were inserted into the dispersed TGN vesicles (Fig. 5e,g and Supplementary Movie 2).
Figure 5. A SunTag imaging system revealed that PFO translocates to the TGN.

a–d, Representative immunofluorescence images (a) and quantification of rPFO puncta and foci size (b), rPFO colocalization with the TGN (c) and TGN dispersion (d) in HeLa cells stably expressing scFv-sfGFP incubated with 0.90 nM 10xGCN4-rPFO over a 60-min time course before TGN46 immunofluorescence imaging. Yellow arrows, rPFO puncta; white arrows, rPFO foci. Scale bar, 5 μm. Average size of rPFO puncta and foci per cell was measured with ImageJ (n = 40 cells per condition; mean ± s.d.; N.D., not detectable). Areas of rPFO foci colocalizing with the TGN per cell were measured with ImageJ (n = 40 cells per condition). Areas containing TGN structures were measured with ImageJ (n = 40 cells per condition). Representative from at least 3 independent experiments. e,f, Representative STED super-resolution microscopy images (e) and quantification of rPFO puncta and rPFO foci diameter (f) in HeLa scFv-sfGFP cells as in a incubated with 0.90 nM 10xGCN4-rPFO for 60 min. Yellow frames, representative rPFO puncta for zoom-in images; white frames, representative rPFO foci for zoom-in images. Scale bar, 5 μm. rPFO puncta and foci diameters were measured with ImageJ (n = 20 foci/puncta; two-sided t-test). Representative from 3 independent experiments. g, Representative STED Z-stack 3D reconstruction images of a rPFO focus on a TGN vesicle from HeLa scFv-sfGFP cells as in e. Scale bar, 200 nm. Representative from 3 independent experiments (n ≥ 40 cells per experiment).
To verify that the Cys-to-Ala substitution did not affect the activities characterized above, we purified 10xGCN4-rPFO that retained the Cys residue (10xGCN4-rPFOC459, Supplementary Fig. 5a). The pore-forming activity of 10xGCN4-rPFOC459 (Supplementary Fig. 5b) was comparable to that of rPFO (Extended Data Fig. 1b) in HeLa, likely due to activation by the reducing agent in the lysis buffer (see Methods). 10xGCN4-rPFOC459 trafficked to the TGN in HeLa scFv-sfGFP (Supplementary Fig. 5c) and induced TGN dispersion and NLRP3 recruitment in HeLa NLRP3-GFP (Supplementary Fig. 5d), indicating that the Cys-to-Ala substitution did not define these activities, consistent with the results with native endogenous PFO secreted by C. perfringens. To test whether pore formation was required for PFO internalization and translocation, we introduced a Y181A mutation into 10xGCN4-rPFO. 10xGCN4-rPFOY181A was expressed at comparable level to 10xGCN4-rPFOC459 (Supplementary Fig. 5a), but failed to get internalized or translocate to the TGN (Supplementary Fig. 5c). Thus, PFO internalization and translocation required its pore-forming activity.
Intracellular trafficking of PFO is distinct from non-CDC toxins
To examine whether PFO trafficked through other organelles before reaching the TGN and whether TGN was the sole destination organelle, we imaged various organelle markers over a 60-min time course post 10xGCN4-rPFO addition in HeLa scFv-sfGFP. rPFO puncta or foci did not have marked colocalization with calnexin (ER), ERGIC-53 (ER-Golgi intermediate compartment), Rab7 (late endosome), LAMP1 (lysosome), CD63 (MVB/late endosome/lysosome/exosome) or TOM20 (mitochondria) (Supplementary Fig. 6-8). A subset of rPFO puncta localized in proximity to EEA1 (early endosome) at 10 and 20 min, but no evident colocalization was observed (Supplementary Fig. 9a).
Non-CDC bacterial toxins can hijack host machineries for internalization and trafficking. Shiga toxin from Shigella dysenteriae and pathogenic E. coli strains hijacks retrograde trafficking to translocate from the early/recycling endosomes to the TGN39, while lethal toxin from B. anthracis and diphtheria toxin from Corynebacterium diphtheriae hijack endosomal maturation for intracellular translocation40. However, neither the retrograde trafficking inhibitor retro-2cycl 41 nor the endosomal maturation inhibitor EGA40 affected rPFO-mediated TGN remodeling or NLRP3 recruitment in HeLa NLRP3-GFP, or caspase-1 cleavage in 293NAC (Extended Data Fig. 4a-d). Overexpression of the dominant-negative mutant S34N of Rab5A, a small GTPase that regulates endosomal maturation42, did not affect rPFO-mediated TGN remodeling in HeLa (Supplementary Fig. 9b). In addition, retro-2cycl did not affect internalization or TGN translocation of 10xGCN4-rPFO in HeLa scFv-sfGFP (Extended Data Fig. 5a,b).
Non-CDC toxins such as adenylate cyclase toxin from Bordetella pertussis and botulinum neurotoxin from Clostridium botulinum use endocytosis to enter host cells43. However, pitstop 2, an inhibitor of both clathrin-dependent and -independent endocytosis44,45, did not affect 10xGCN4-rPFO internalization or TGN translocation in HeLa scFv-sfGFP (Extended Data Fig. 5a,b). Pitstop 2 also did not affect 10xGCN4-rPFO-mediated TGN remodeling in HeLa scFv-sfGFP (Extended Data Fig. 5a,c) or caspase-1 cleavage in 293NAC (Extended Data Fig. 5d). Overexpression of the dominant-negative mutants K44A of dynamin 1 (DNM1) or dynamin 2 (DNM2), two GTPases crucial for multiple forms of endocytosis46, did not affect rPFO-mediated TGN remodeling in HeLa (Extended Data Fig. 6a-b) or caspase-1 cleavage in 293NAC (Extended Data Fig. 6c). Thus, PFO translocated to the TGN through a mechanism distinct from those described for non-CDC toxins.
Membrane repair downregulates PFO-mediated TGN remodeling
CDCs induce Ca2+ influx, which is required to initiate the membrane repair pathway, leading to endocytosis of pores for degradation47. To examine whether CDCs hijacked the membrane repair pathway to get internalized, we used Ca2+-free medium to block Ca2+ influx47, before addition of rPFO (Extended Data Fig. 7a) and assessment of plasma membrane permeability by a propidium iodide (PI) uptake assay. Increasing concentrations of rPFO resulted in increasing percentages of PI+ HeLa cells, and Ca2+-free medium allowed lower concentrations of rPFO to induce percentages of PI+ HeLa cells comparable to those induced by higher concentrations of rPFO in Ca2+-containing medium (Extended Data Fig. 7b,c), indicating that Ca2+-free medium successfully inhibited membrane repair. However, Ca2+-free medium did not block, but instead caused higher TGN dispersion level compared to Ca2+-containing medium for the same concentration of rPFO added, and it allowed lower concentrations of rPFO (0.18 nM instead of 0.54 nM) to start inducing TGN dispersion and NLRP3 activation in HeLa (Fig. 6a,b). In contrast, nigericin-induced TGN dispersion and NLRP3 recruitment was comparable in Ca2+-free and Ca2+-containing medium in HeLa (Fig. 6c,d). Consistently, Ca2+-free medium allowed lower concentrations of rPFO (0.18 nM instead of 1.8 nM) to trigger caspase-1 and IL-1β cleavage in WT iBMDMs, while nigericin induced comparable levels of caspase-1 and IL-1β cleavage in Ca2+-free medium and Ca2+-containing medium (Fig. 6e), suggesting that the negative regulatory effect of Ca2+ influx is specific to PFO- but not nigericin-induced NLRP3 activation. To examine whether this was due to changes in PFO translocation to the TGN, we incubated HeLa scFv-sfGFP with 0.36 and 0.54 nM 10xGCN4-rPFO, as 0.18 nM 10xGCN4-rPFO was below the microscopy detection limit even with the SunTag system. For both rPFO concentrations, Ca2+-free medium promoted significantly higher TGN translocation of 10xGCN4-rPFO compared to Ca2+-containing medium (Extended Data Fig. 7d), indicating that membrane repair reduced the amount of PFO that could reach the TGN.
Figure 6. Membrane repair negatively regulates PFO-induced TGN remodeling.

a,b, Representative immunofluorescence images (a) and quantification of TGN dispersion and NLRP3 recruitment (b) in HeLa cells stably expressing NLRP3-GFP incubated with 0.18 or 0.54 nM rPFO or not (Mock) in Ca2+-containing medium or Ca2+-free medium for 80 min before TGN46 immunofluorescence imaging. Scale bar, 10 μm. Areas containing TGN structures were measured with ImageJ (n = 40 cells per condition; mean ± s.d.; two-sided t-test; NS, not significant). NLRP3 recruitment was quantified from 100 cells (n = 3; N.D., not detectable). Representative from 3 independent experiments. c,d, Representative immunofluorescence images (c) and quantification of TGN dispersion and NLRP3 recruitment (d) in HeLa cells stably expressing NLRP3-GFP incubated with 10 μM nigericin in Ca2+-containing medium or Ca2+-free medium for 80 min before TGN46 immunofluorescence imaging. Scale bar, 10 μm. Areas containing TGN structures were measured with ImageJ (n = 40 cells per condition; mean ± s.d.; two-sided t-test; NS, not significant). NLRP3 recruitment was quantified from 100 cells (n = 3; N.D., not detectable). Representative from 3 independent experiments. e, Immunoblots of WT iBMDM cells primed with 50 ng/mL LPS for 3 h before incubation with 20 μM nigericin or 0.18/0.54/1.8/5.4 nM rPFO in Ca2+-containing medium or Ca2+-free medium for 60 min. lys, lysate; sup, supernatant. Lane 12 had decreased Casp1 p20 and IL-1β p17 compared to lane 6 because membrane repair inhibition caused higher cytotoxicity at this rPFO level. Representative from 3 independent experiments.
Because Ca2+ influx inhibition can have pleiotropic effects beyond membrane repair48, we next used the selective MEK inhibitors U0126 and mirdametinib to block the MEK-dependent membrane repair downstream of Ca2+ influx49. U0126 and mirdametinib enhanced LDH release in rPFO-treated HeLa (Extended Data Fig. 8a) and significantly enhanced rPFO-induced TGN remodeling and NLRP3 recruitment in HeLa NLRP3-GFP (Extended Data Fig. 8b-d), mirroring the effects of Ca2+-free medium. Thus, TGN remodeling was not an indirect effect of Ca2+ influx, which instead served as a negative regulatory mechanism to control PFO translocation to the TGN and downregulate subsequent NLRP3 inflammasome activation.
CDCs peel TGN membrane to recruit NLRP3
To test whether other CDCs also translocated to the TGN, we purified 10xGCN4-rSLO, 10xGCN4-rPLY, 10xGCN4-rPLO and 10xGCN4-rSLY from E. coli (Supplementary Fig. 10a). After addition to HeLa scFv-sfGFP, they were internalized and translocated to the TGN (Fig. 7a,b), indicating that TGN translocation was conserved among NLRP3-stimulating CDCs.
Figure 7. CDCs peeled away TGN membrane to expose PtdIns4P-enriched region for NLRP3 recruitment.

a,b, Representative immunofluorescence images (a) and quantification of CDC colocalization with the TGN (b) in HeLa cells stably expressing scFv-sfGFP incubated with 1.8 nM 10xGCN4-rSLO, 5.4 nM 10xGCN4-rPLY, 2.7 nM 10xGCN4-rPLO, 3.6 nM 10xGCN4-rSLY or not (Mock) for 60 min before TGN46 immunofluorescence imaging. Scale bar, 5 μm. Areas of CDC foci colocalizing with the TGN were measured with ImageJ (n = 40 cells per condition; mean ± s.d.; two-sided t-test; N.D., not detectable). Representative from 3 independent experiments. c,d, Representative immunofluorescence images (c) and quantification of colocalization (d) in HeLa cells stably expressing scFv-sfGFP and NLRP3-mScarlet-I incubated with 0.90 nM 10xGCN4-rPFO or not (Mock) for 80 min before TGN46 immunofluorescence imaging. Pseudocoloring was applied to facilitate detection of colocalization (indicated as white signal after merging of green and magenta signals). Bottom row, TGN46 channel, distal TGN vesicles are outlined with yellow dashed lines and perinuclear TGN membranes are outlined with white dashed lines. Scale bar, 5 μm. Areas of colocalization were measured with ImageJ (n = 40 cells per condition). Representative from 3 independent experiments. e,f, Representative immunofluorescence images (e) and quantification of colocalization (f) in HeLa cells stably expressing Flag-NLRP3 and OSBPPH-mRFP incubated with 0.90 nM rPFO or not (Mock) before TGN46 immunofluorescence imaging. White dashed lines outline OSBPPH-mRFP structures. Representative from 3 independent experiments. g,h, Representative immunofluorescence images (g) and quantification of colocalization (h) in HeLa cells stably expressing scFv-sfGFP and OSBPPH-mRFP incubated with 0.90 nM 10xGCN4-rPFO or not (Mock) for 80 min before TGN46 immunofluorescence imaging. White dashed lines outline OSBPPH-mRFP structures. Representative from 3 independent experiments.
Unlike previously described NLRP3 stimuli (e.g., nigericin and ATP) that induce the disassembly of the entire TGN into multiple vesicles23, CDCs remodel the TGN into two distinct groups of structures (Supplementary Fig. 10b): the first group consists of multiple vesicles that were well separated from one another and located distally from the original perinuclear position ('distal vesicles'); the second group consists of remodeled structures that lost their compact cisternae morphology, but remained proximal to the original perinuclear position ('perinuclear structures'). To characterize the relationship between these two groups of remodeled TGN structures and the recruited PFO and NLRP3, we developed three multi-channel fluorescence imaging systems. In the first system, we incubated HeLa cells stably expressing scFv-sfGFP and NLRP3-mScarlet-I with 10xGCN4-rPFO before TGN46 immunofluorescence. While both strongly colocalized with TGN46, rPFO and NLRP3 were primarily localized on the distal vesicles and perinuclear structures, respectively, and thus did not colocalize with each other (Fig. 7c,d). The distinct patterns of NLRP3 recruitment induced by rPFO and nigericin were also observed in live imaging (Supplementary Movie 3,4). In the second system, we incubated HeLa cells stably expressing Flag-NLRP3 and OSBPPH-mRFP with rPFO, followed by Flag and TGN46 immunofluorescence imaging. While OSBPPH-mRFP was dispersed upon rPFO treatment, the majority of this PtdIns4P marker was enriched in the perinuclear structures instead of the distal vesicles, and thus strongly colocalized with recruited Flag-NLRP3 (Fig. 7e,f). The OSBPPH-mRFP/Flag-NLRP3 colocalization was less pronounced in the central area (Fig. 7e), possibly due to competition for PtdIns4P binding. In the third system, we incubated HeLa cells stably expressing scFv-sfGFP and OSBPPH-mRFP with 10xGCN4-rPFO before TGN46 immunofluorescence imaging. While both strongly colocalized with TGN46, 10xGCN4-rPFO and OSBPPH-mRFP were primarily localized on the distal vesicles and perinuclear structures, respectively, and thus did not colocalize with each other (Fig. 7g,h). These results suggested that CDCs remodeled the TGN by peeling away the PtdIns4P-negative membrane and exposing the PtdIns4P-positive membrane to recruit NLRP3 (Supplementary Fig. 10b).
Desulfolysin does not get internalized or induce TGN remodeling
All CDCs identified to date are from Gram-positive bacteria with two exceptions: desulfolysin (DLY) and enterolysin (ELY), from Desulfobulbus propionicus and Enterobacter lignolyticus, respectively, both free-living Gram-negative bacteria50. rDLY was purified from E. coli (Supplementary Fig. 11a) and showed potent pore-forming activity in the LDH release assay and the PI uptake assay (Extended Data Fig. 9a,b). However, sublytic rDLY did not promote TGN dispersion or NLRP3 recruitment in HeLa NLRP3-GFP (Fig. 8a), including in PI+ cells (Supplementary Fig. 11b), and did not trigger caspase-1 cleavage in 293NAC (Extended Data Fig. 9c), suggesting that plasma membrane permeabilization was insufficient to induce CDC-mediated TGN remodeling or NLRP3 activation.
Figure 8. DLY was not internalized and did not translocate to the TGN for TGN remodeling and NLRP3 inflammasome activation.

a, Representative immunofluorescence images (top) and quantification of TGN dispersion and NLRP3 recruitment (bottom) in HeLa cells stably expressing NLRP3-GFP incubated with 0.90 nM rPFO, 1.8 nM rDLY or not (Mock) for 80 min before TGN46 immunofluorescence imaging. Scale bar, 10 μm. Areas containing TGN structures were measured with ImageJ (n = 40 cells per condition; mean ± s.d.; two-sided t-test; NS, not significant). NLRP3 recruitment was quantified from 100 cells (n = 3; N.D., not detectable). Representative from 3 independent experiments. b,c, Representative immunofluorescence images (b) and quantification of scFv-sfGFP aggregates colocalizing with the TGN and the cell edge (c) in HeLa cells stably expressing scFv-sfGFP incubated with 0.90 nM 10xGCN4-rPFO, 1.8 nM 10xGCN4-rDLY, 1.8 nM rDLY-10xGCN4 or not (Mock) before TGN46 immunofluorescence imaging. Scale bar, 10 μm. Areas of scFv-sfGFP aggregates colocalizing with the TGN were measured with ImageJ (n = 40 cells per condition). Cells with scFv-sfGFP aggregates at the cell edge were quantified from 100 cells (n = 3). Representative from 3 independent experiments. d,e, Representative immunofluorescence images (d) and quantification of CDC puncta or foci size, scFv-sfGFP colocalization with the TGN and TGN dispersion (e) in HeLa cells stably expressing scFv-sfGFP incubated with 0.90 nM 10xGCN4-rPFO, 1.8 nM 10xGCN4-rPFO_DLYD4 or not (Mock) before TGN46 immunofluorescence imaging. Scale bar, 10 μm. The average size of scFv-sfGFP aggregates was measured with ImageJ (n = 40 cells per condition). Areas of scFv-sfGFP aggregates colocalizing with the TGN were measured with ImageJ (n = 40 cells per condition). Areas containing TGN structures were measured with ImageJ (n = 40 cells per condition). Representative from 3 independent experiments.
To determine whether DLY could be internalized or translocate to the TGN, we purified 10xGCN4-rDLY and rDLY-10xGCN4, with N-terminal and C-terminal 10xGCN4 tag, respectively, from E. coli (Supplementary Fig. 11c). In HeLa scFv-sfGFP, 10xGCN4-rDLY can only recruit scFv-sfGFP after internalization, while rDLY-10xGCN4 can recruit scFv-sfGFP once it forms pores on the plasma membrane, because CDCs use the C-terminal D4 to insert into the plasma membrane24 (Supplementary Fig. 11d). rDLY-10xGCN4 formed distinct aggregates near the cell edge (Fig. 8b,c), indicating that rDLY successfully inserted into the plasma membrane and formed pores. In contrast, 10xGCN4-rDLY did not form puncta or foci (Fig. 8b,c), indicating that rDLY was not internalized or translocated to the TGN.
To identify the CDC sequence that determines the differences between PFO and DLY, we swapped the four individual domains in rPFO with those of rDLY (Extended Data Fig. 9d). Swapping of D1, D2 or D3 resulted in unstable chimeric proteins that could not be purified, while rPFO containing a rDLY D4 (rPFO_DLYD4) was stable and could be purified at high concentration and with high purity (Supplementary Fig. 11e). rPFO_DLYD4 exhibited pore-forming activity comparable to rPFO and rDLY (Extended Data Fig. 9e). However, rPFO_DLYD4 could not induce TGN remodeling or NLRP3 recruitment in HeLa NLRP3-GFP (Extended Data Fig. 9f), or caspase-1 cleavage in 293NAC (Supplementary Fig. 11f). To test whether D4 from rDLY blocked the internalization or the TGN translocation step, 10xGCN4-rPFO_DLYD4 purified from E. coli (Supplementary Fig. 11g) was added to HeLa scFv-sfGFP. 10xGCN4-rPFO_DLYD4 was internalized and formed small puncta, but did not form large foci on the TGN (Fig. 8d,e), indicating that D4 mediated CDC translocation to the TGN while other regions (i.e., D1–3) may determine the CDC internalization. Thus, CDCs could be classified into two groups, type A CDCs (represented by PFO, ALO, SLO, etc.) and type B CDCs (represented by DLY) based on whether they were internalized by host cells and translocated to the TGN to mediate NLRP3 inflammasome activation (Extended Data Fig. 9g).
DISCUSSION
Here we show that type A CDCs from various pathogenic bacteria were internalized by host cells and trafficked to the TGN to remodel it into a platform for NLRP3 inflammasome activation. In contrast, the type B CDC DLY was not internalized, despite potent pore formation that drove plasma membrane permeabilization. Unlike the canonical K+ efflux-dependent and - independent NLRP3 stimuli, type A CDCs only required K+ efflux for the downstream ASC activation.
While the activities of CDCs on the plasma membrane have been extensively studied, their direct effects on intracellular organelles have remained unclear. One major challenge is that only a small fraction of CDCs are internalized, making it extremely difficult to study intracellular CDCs, especially since the CDC concentrations need to be controlled within the sublytic range. We used the SunTag system to capture both extracellular (with C-terminal tagging) and intracellular (with N-terminal tagging) CDCs, which revealed that rPFO form empty-center aggregates that insert into the TGN vesicles. These empty centers are larger than the PFO pore size (~25–30 nm)2. Therefore, the ultrastructures CDCs assembled on the TGN vesicles remained to be determined. The intracellular trafficking of type A CDCs did not rely on previously described host machineries hijacked by non-CDC toxins. Given that pore formation is required for CDCs internalization, and that the TGN is highly enriched with cholesterol51, one possibility is that CDC pores on the plasma membrane detach and directly translocate to the TGN using their cholesterol-binding affinity. Consistently, N-terminally tagged 10xGCN4 could access the cytosolic scFv-sfGFP, indicating that at least the N-terminus of internalized CDCs was not enclosed within membrane-bound structures.
Both nigericin and rPFO induced the dispersion of multiple TGN markers, indicating that the entire TGN was remodeled. In contrast, there was no evident colocalization of the early endosomes with either recruited rPFO or NLRP3. Trafficking pathways involving the early endosome, including retrograde trafficking, endocytosis and endosomal maturation, were dispensable for rPFO-mediated TGN remodeling or NLRP3 activation. These results support that the remodeled TGN, rather than the early endosomes, serve as the platform for NLRP3 inflammasome assembly. This is consistent with reports that the 3a dense body, a structure assembled by SARS-CoV-2 and bat progenitor coronaviruses via hijacking TGN46- and EEA1-posotive membranes but not the other TGN membranes, fails to support NLRP3 inflammasome activation52. The diameters of TGN vesicles and dispersion levels varied between type A CDCs and nigericin, which may contribute to their dependence on K+ efflux in different steps. In addition, CDCs use a unique peeling membrane mechanism to remodel the TGN, which is not shared by other NLRP3 stimuli such as nigericin or ATP, indicating that while TGN remodeling served as a common cellular signal for NLRP3 inflammasome activation, the detailed mechanisms used by different stimuli can vary, consistent with the diverse chemical and structural nature of NLRP3 stimuli.
One main challenge in understanding TGN remodeling mechanism is that the majority of TGN-remodeling stimuli are either small molecules or nonribosomal peptides23. The discovery of CDCs as TGN-remodeling protein ligands will allow future genetic manipulation, proximity labeling and affinity precipitation to further explore the mechanisms. The SunTag system can also be adapted to investigate other bacterial toxins or virulence factors in general in vitro and in vivo. High-throughput screening of compounds targeting D4 may identify broad-spectrum therapeutics against various bacterial pathogens. Reproposing of selective MEK inhibitors, such as mirdametinib that has been approved for treating neurofibromatosis type 153, may lead to new treatments against bacterial pathogens sensitive to the NLRP3 inflammasome.
METHODS
All experimental protocols have been approved by the University of Chicago Institutional Biosafety Committee and Institutional Animal Care and Use Committee.
Antibodies and Reagents
Antibodies against NLRP3 (AG-20B-0014), ASC (AG-25b-0006), and caspase-1 (AG-20B-0042) were from AdipoGen. Antibodies against human TGN46 (HPA012723), α-tubulin (T9026), and Flag M2 (F1804) were from Sigma-Aldrich. Antibody against IL-1β (AB-401-NA) was from R&D Systems. Antibodies against GOLGA4 (611280), GGA3 (612310), GM130 (610822), and EEA1 (610456) were from BD Biosciences. Antibodies against giantin (ab24586) and calnexin (ab219644) were from Abcam. Antibodies against TOM20 (sc-11415), ERGIC-53 (sc-365158), Rab7 (sc-376362), LAMP1 (sc-20011), and CD63 (sc-5275) were from Santa Cruz Biotechnology. Antibody against mouse TGN38 (AHP499G) was from Bio-Rad. Antibody against β-actin (PA1-16889) was from Pierce. Antibody against HA (MMS-101P) was from BioLegend. Antibody against PFO (CSB-PA314820HA01CMB) was from CUSABIO. Alexa Fluor 488 (A-11001, A-11008), 568 (A-11004, A-11011, A21099), 633 (A-21050, A-21070), and 647 (A-21447) were from Life Technologies. Antibody against V5 (80076, mouse host), V5 (13202, rabbit host), and HRP-conjugated secondary antibodies (anti-mouse 7076S and anti-rabbit 7074S) were from Cell Signaling Technology. HRP-conjugated anti-goat secondary antibody (sc-2020) was from Santa Cruz. LysoTracker Red DND-99 was from Invitrogen (L-7528). Nigericin (N7143) were from Sigma-Aldrich. Ultrapure LPS (tlrl-3pelps) was from InvivoGen. Ni-NTA Agarose (30230) was from Qiagen. Propidium iodide (0219545810) was from MP Biomedicals.
Mammalian cell culture and CRISPR-Cas9 knockout cell lines
HEK293T and HeLa were obtained from ATCC (https://www.atcc.org/). WT iBMDM and casp1−/− iBMDM were obtained from BEI Resources (NR-9456 and NR-44113, respectively, deposited by D. Golenbock). Nlrp3−/− iBMDM and Asc−/− iBMDM were established in this study from WT iBMDM using pLentiCRISPR system with sgRNA targeting murine Nlrp3 (CAAGCTGGCTCAGTATCTAG) and murine Asc (ACAAGTTTTCAAGAGCGTCC), respectively. Knockout effects were confirmed by both genomic DNA sequencing and immunoblotting. To verify the phenotypes were not due to off-target effect, (1) at least two colonies were tested; (2) reintroduction of the target gene (sgRNA-resistant) was performed to verify the phenotypes could be rescued. HEK293T, HeLa, and iBMDM cells were cultured in Dulbecco’s modified Eagle’s medium (DMEM) supplemented with 10% (v/v) cosmic calf serum (Hyclone), penicillin (100 U/ml), and streptomycin (100 μg/ml) at 37°C with 5% (v/v) CO2. All cell lines were constantly monitored for contamination from other cell lines. They were free of mycoplasma contamination based on the results of e-Myco Mycoplasma PCR Detection Kit (Bulldog Bio 2523448) and were regularly maintained with Normocin (antimicrobial reagent against mycoplasma, bacteria and fungi) (InvivoGen ant-nr-05).
Lentivirus and stable cell lines
The lentiviral vectors pTY-EF1a-puroR/hygroR/zeoR-2A-GFP-Flag and pTY-EF1a-GFP-IRES-puroR/hygroR/zeoR have been described in our previous study23. NLRP3, ASC, and caspase-1 genes of mouse origin and other genes of interest were inserted into these lentiviral vectors using Gibson Assembly. The full-length sequences were confirmed by Sanger sequencing or whole-plasmid sequencing. GCN4 and scFv-sfGFP for SunTag system were cloned from pHRdSV40-scFv-GCN4-sfGFP-VP64-GB1-NLS (Addgene #60904) and pHRdSV40-K560-24xGCN4_v4 (Addgene #72229), both deposited by Ron Vale lab. OSBPPH-GFP, cloned in our previous study23, consists of an initial methionine residue and the PH domain from OSBP (human, amino acids 87–185) followed by a short linker (RSIAT) and GFP. The GFP tag was also replaced with mRFP to construct OSBPPH-mRFP. For NLRP3(ΔKKKK), NLRP3 (ΔKKKK OSBPPH) and NLRP3(ΔKKKK OSBPPH_R107/108E), a short linker (GGGGS) was inserted at the position of deleted amino acids 127–130 to maintain the structural flexibility between different domains. Stable cell lines were established through lentiviral transduction. Briefly, lentivirus was packaged by co-transfecting HEK293T cells with the lentiviral vector and packaging plasmids psPAX2 (Addgene #12260) and pMD2.G (Addgene #12259). Medium containing lentivirus was filtered and added to target cells in the presence of polybrene (10 μg/ml). Cells were then selected with the respective antibiotics for at least seven days before protein expression was confirmed by immunoblotting and/or fluorescence microscopy. For rescue in Nlrp3−/− iBMDM, sgRNA-resistant murine NLRP3 (39 nt G>A silent mutation) was introduced, and the expression was confirmed by immunoblotting.
Recombinant cholesterol-dependent cytolysins (CDCs)
The coding sequences of PFO, PLO, SLY, VLY, and DLY were synthesized as gene fragments (Integrated DNA Technologies and Twist Bioscience). The coding sequences of ALO, SLO, and PLY were amplified from genomic DNA of Bacillus anthracis Sterne (34F2) (kind gift from Dominique Missiakas, University of Chicago), genomic DNA of Streptococcus pyogenes MGAS5005 (kind gift from Michael Federle, University of Illinois Chicago), and pTricHis-PLY (Addgene #160537), respectively. The signal peptide was deleted for all recombinant CDCs, with the exceptions of PLY and DLY that do not have a signal peptide50,54. PFO C459A, ALO C472A, SLO C530A, PLY C428A, SLY C456A, and DLY C433A substitutions in the undecapeptide were introduced to render these CDCs insensitive to oxidation24,25,55,56. Cys-to-Ala substitution was not performed for PLO and VLY because they do not encode any Cys residue in their undecapeptide sequences. rPFOC459 did not contain the C459A substitution. rPFO-DLY chimeric mutants were constructed by domain swapping between PFO and DLY. Chimera Domain (D)1: DLY (residue 1–23), PFO (residue 54–89), DLY (residue 60–146), PFO (residue 179–228), DLY (residue 197–242) , PFO (residue 27–349), DLY (residue 325–348), PFO (residue 374–500); Chimera D2: PFO (residue 29–53), DLY (residue 24–59), PFO (residue 90–373), DLY (residue 349–365) , PFO (residue 391–500); Chimera D3: PFO (residue 29–178), DLY (residue 147–196), PFO (residue 229–274), DLY (residue 243–324) , PFO (residue 350–500); Chimera D4: PFO (residue 29–390), DLY (residue 366–475).
For expression of recombinant CDCs in E. coli, the CDCs except PLY were cloned into pET28a-His vector with Gibson Assembly. PLY and its derivative were cloned into pTricHisA vector, the same vector backbone with the PLY template pTricHis-PLY (Addgene #160537). Additional Flag tag and/or GCN4 tag (cloned from Addgene #72229) were added as specified in experiments. The full-length sequences were confirmed by Sanger sequencing or whole-plasmid sequencing. The plasmids were transformed into E. coli Rosetta™ (DE3) pLysS (Novagen 71403-3). The overnight LB culture was inoculated into 100 mL LB medium (1:50) and cultured at 37°C until OD600 reached 0.6. For rPFO, rALO, rSLY, and rDLY, protein expression was induced with 0.5 mM IPTG at 37°C for 4 hours (h). For rSLO and rPLO, protein expression was induced with 0.5 mM IPTG at 28°C for 6 h. For rPLY and rVLY, protein expression was induced with 0.5 mM IPTG at 18°C overnight. E. coli cells were harvested by centrifugation and suspended in E. coli buffer A [20 mM Tris-HCl (pH 8.0), 300 mM NaCl, 10 mM imidazole, 2 mM 2-mercaptoethanol, 1 mM PMSF]. Cells were lysed with an ultrasonic homogenizer (ThermoFisher Model 120 Sonic Dismembrator) and incubated with Benzonase nuclease (Sigma-Aldrich 70664, 0.0125 U/μL) at 4°C for 10 minutes (min) to degrade nucleic acids. Cell debris was removed by centrifugation at 10,000 g for 15 min. The supernatant was filtered through a 0.45-μm syringe filter and incubated with Ni-NTA agarose (Qiagen 30230) at 4°C for 1 h and loaded onto a gravity column (Bio-Rad 7311550). The Ni-NTA agarose was washed with 15x agarose volumes of E. coli buffer A for 3 times. The target proteins were eluted with 1x agarose volume of E. coli buffer B [20 mM Tris-HCl (pH 8.0), 50 mM NaCl, 300 mM imidazole, 2 mM 2-mercaptoethanol, 5% glycerol] for 5 times. Purified proteins were pooled and buffer exchanged using a spin concentrator (Sartorius Vivaspin VS0102, MWCO 10,000 Da) with dialysis buffer [20 mM Tris·Cl (pH7.5), 50 mM NaCl, 0.5 mM DTT, 5% glycerol] and stored at −80°C. The purified recombinant proteins were examined with Coomassie brilliant blue staining. At least 3 different batches were purified independently for each CDC to verify that the results were consistent across batches.
Clostridium perfringens infection and secretion incubation
C. perfringens WT strain 13, the isogenic ΔpfoA strain, the ΔpfoA strain reconstituted with PFO with plasmid pCP13pfoA (ΔpfoA + pfoA), and the Δplc strain30,57 were kind gifts from Jorge E. Vidal (University of Mississippi Medical Center). The bacteria were inoculated into 3 mL brain heart infusion (BHI) medium (BD Biosciences, 211059) supplemented with 0.5% yeast extract (Sigma-Aldrich, Y1625), 0.02% D-glucose (Sigma-Aldrich, G7021), and 0.01% L-cysteine (Sigma-Aldrich, C7880) inside an anaerobic chamber at 37°C for 24 h. Bacteria were then subcultured 1:10 into 5 mL fresh BHI medium and grown at 37°C overnight until OD600 reached 1.8 (OD600=1 equivalent to ~9.4x10⁸ CFU/mL)30. For infection, cells were incubated with C. perfringens at the indicated MOI for 60 min. For supernatant incubation, C. perfringens culture was centrifuged at 3,000 g for 10 min and the supernatant was then filtered using a 0.45-μm filter to remove bacteria. The bacterial supernatant equivalent to the indicated MOI was added to cells in Opti-MEM (Life Technologies) before incubation at 37°C for the indicated time.
Establishment of Asc−/− mouse line and primary BMDM induction
CRISPR ribonucleoprotein (RNP) complex was prepared by mixing Alt-R™ S.p. Cas9 Nuclease V3 (IDT #1081058) and tracrRNA annealed with crRNA (ACAAGTTTTCAAGAGCGTCC and TCCCTACTTGGTGATGGACC). RNP was incubated at 37°C for 10 min and was then delivered into zygotes by microinjection at the UChicago Transgenic Mouse Facility. Founder lines with confirmed ASC knockout were backcrossed to C57BL/6J mice for 12 generations before homozygous knockout lines were selected. For genotyping, genomic DNA was extracted from tail for PCR with primers (Fwd: CTGAAAGTCTTAGGGGCGGAA; Rev: ATGGGGAGCCAGGAATCATTT). The Asc−/− mouse line used in this study has a deletion covering coding sequence 30 bp to 572 bp of murine Asc gene. All mice were bred and maintained under specific pathogen-free conditions in the animal facility of University of Chicago.
For primary BMDM induction, cells were isolated from Asc−/− mouse bone marrow and cultured in MCSF-1-containing RPMI 1640 medium supplemented with 10% (v/v) cosmic calf serum (Hyclone), penicillin (100 U/ml), and streptomycin (100 μg/ml). Cells were then cultured at 37 °C in an atmosphere with 5% (v/v) CO2.
Inflammasome Stimulation
The culture medium was replaced by Opti-MEM (Life Technologies) containing nigericin or CDCs at the indicated concentrations. The cells were then incubated at 37 °C in an atmosphere of 5% (v/v) CO2. HeLa, HEK293T, and iBMDMs were stimulated for 80, 40, and 60 min respectively, similar to time points used in our previous study23, unless otherwise specified. Priming with TLR ligands is not required for reconstituted cell lines because the high expression level of stably introduced NLRP3 bypasses the priming step23,58,59. For iBMDMs stimulation, cells were primed with LPS (50 ng/mL) for 3 h before stimulation with nigericin or CDCs. For poly(dA:dT) stimulation, iBMDM cells were transfected with poly(dA:dT) (InvivoGen tlrl-patn, 2 μg/mL) using Lipofectamine 2000 (ThermoFisher) for 4 h.
Inhibition of Ion Flux and Trafficking Pathways
For K+ efflux inhibition, additional KCl with the indicated concentrations was added into Opti-MEM medium along with nigericin or the indicated CDCs. For retrograde trafficking inhibition, the indicated cells were pre-treated with DMSO (solvent control) or retro-2cycl (MCE HY-114698, 25 μM) in Opti-MEM at 37 °C for 1 h followed by addition of rPFO at the indicated concentrations. For inhibition of endosomal maturation, two independent methods were used. In the first method, the indicated cells were pre-treated with DMSO (solvent control) or EGA (MCE HY-125168, 20 μM) in Opti-MEM at 37 °C for 1 h followed by addition of rPFO at the indicated concentrations. In the second method, we cloned HA-tagged dominant-negative mutant of Rab5A (S34N) into a pTY lentiviral vector detailed above using Gibson assembly, before introducing this mutant protein into HeLa cells. The stable expression of HA-Rab5A (S34N) was confirmed using HA immunofluorescence. The cells were then incubated with rPFO (0.90 nM) for 80 min before HA and TGN46 immunostaining.
For endocytosis inhibition, two independent methods were used. In the first method, the indicated cells were pre-treated with DMSO (solvent control) or pitstop 2 (MCE HY-115604, 20 μM) in Opti-MEM at 37 °C for 1 h followed by addition of nigericin or rPFO at the indicated concentrations. In the second method, we cloned V5-tagged dynamin 1 (WT or K44A) or dynamin 2 (WT or K44A) into the plasmid backbone pEGFP-N1 to replace the EGFP gene. The indicated cells were then transfected with these plasmids using jetOPTIMUS (Polyplus #55-253) for 48 h. The expression of these proteins was confirmed with either V5 immunofluorescence or immunoblotting, before the cells were incubated with rPFO for the indicated concentration and time.
For membrane repair inhibition, two independent methods were used. In the first method, membrane repair was blocked by calcium (Ca2+) influx inhibition. Cells were washed with Ca2+-free DMEM (Gibco #21068028) containing 5 mM EGTA followed by two more washes in Ca2+-free DMEM, before incubation in Ca2+-free DMEM in the presence of nigericin or rPFO. As a control, cells were washed and incubated with Ca2+-containing DMEM (i.e., Ca2+-free DMEM plus 1.8 mM CaCl2) in the presence of nigericin or rPFO at the indicated concentrations. In the second method, membrane repair was blocked by inhibition of the noncanonical MEK signaling60. Cells were incubated with U0126 (MCE, HY-12031A, 20 μM) or mirdametinib (MCE, HY-10254 ,20 μM) for 30 min before incubation with rPFO at the indicated concentrations.
Immunoblotting
Cells were harvested in lysis buffer A [50 mM Tris·HCl (pH 7.5), 100 mM NaCl, 0.5% NP-40, 1 mM EDTA, 0.5 mM EGTA, 10% glycerol, protease inhibitor cocktail (ThermoFisher)] and centrifuged at 10,000 g for 10 minutes at 4°C to collect lysate. For iBMDMs, the cell medium (supernatant) was also collected following inflammasome stimulation for detection of secreted caspase-1 (p20 fragments) and IL-1β (p17 fragment) using methanol/chloroform concentration method adapted from a previous study26. Briefly, 500 μL supernatant from a 6-well plate was mixed with 500 μL methanol and 150 μL chloroform, before vortexing for 30 seconds. The mixture was centrifuged at 10,000g for 10 min before the upper aqueous phase was removed. Another 800 μL methanol was added and the mixture was centrifuged at 10,000g for 10 min. The pellet was then dried and dissolved in 15 μL 2x Laemmli Sample Buffer (Bio-Rad 161-0737, with 2-mercaptoethanol added) and boiled at 95 °C for 7 min. For C. perfringens culture supernatant (secretion), the overnight culture broth (OD600 1.8) was collected and mixed with 5x SDS loading buffer and boiled at 95 °C for 10 min. 10 μL sample was subjected to SDS-PAGE.
Lactate dehydrogenase (LDH) release assay
To measure cytotoxicity, HeLa (1.5x10⁴ cells in 100 μL) or iBMDM cells (5x10⁴ cells in 100 μL) were seeded in triplicate wells of a 96-well plate and treated with nigericin or CDCs with the indicated concentrations in Opti-MEM at 37 °C for 80 min (HeLa) or 60 min (iBMDMs). Cells were incubated with 10 μL of 10x Lysis Buffer (CyQUANT™ LDH cytotoxicity assay kit, Invitrogen C20300) for 45 min as the maximum LDH release control. 50 μL cell supernatant was collected and measured at 490 nm following the manufacturer's instructions. Signal below detection limit was recorded as 0%.
Immunostaining and fluorescence microscopy
For immunostaining, cells were seeded onto #1.5 coverslips, fixed with 4% paraformaldehyde in phosphate-buffered saline (PBS) for 10 min, permeabilized with 0.1% saponin in PBS for 5 min, and blocked with 10% bovine serum albumin (BSA) in PBS containing 0.1% saponin for 30 min. The samples were then incubated with primary antibodies followed by Alexa Fluor secondary antibodies. Nuclei were stained with DAPI in antifade mounting medium (Vectashield H1200). The specificity of antibodies was verified using one or multiple of these methods: (1) cells lacking expression of the protein of interest (e.g., TGN46 KO cell line for TGN46 antibody); (2) comparison with tagged proteins of interest using antibodies targeting the tags; (3) multiple different antibodies targeting the same protein. For imaging with multiple channels, extensive controls were performed to ensure there was no nonspecific staining or crosstalk between channels. These controls include (1) cells that lack one of the proteins of interest and (2) staining without one of the primary antibodies.
Fluorescence and phase contrast imaging was taken with a Nikon C2 point-scanning confocal microscope equipped on a Ti2-E inverted motorized microscope. Live imaging was taken with a Tokai Hit Incubator System (37°C with 5% (v/v) CO2) and a 60x objective lens (CFI60 Plan Apochromat Lambda). Images were analyzed using Nikon NIS-Elements software with the built-in Nikon Denoise.ai module61. For color blindness accessibility of confocal images, the red channel was pseudocolored to magenta.
For super-resolution microscopy of the SunTag system, fixed cells on #1.5 coverslips were probed with Alexa Fluor 633 against TGN46 antibody and mounted with ProLong™ Diamond antifade mounting medium (ThermoFisher P36961). Samples were imaged with a Leica Stellaris 8 microscope using a HC PL APO 100x/1.4 OIL STEDWHITE objective and Type F immersion oil (Leica Microsystems 11513859). Stimulated emission depletion (STED) was used to obtain super-resolution and z-stack images. Alexa Fluor 633 was excited by white light laser (WLL) at 631 nm and emission was detected from 640–800 nm; a STED depletion laser of 775 nm at 40% power was used. sfGFP was excited by WLL at 485 nm and emission was detected from 490–600 nm; a STED depletion laser of 592 nm at 40% power was used. Z-stack images were generated using a step size of 0.025 μm with 3D reconstruction applied.
For propidium iodide uptake assay to measure plasma membrane permeabilization, cells were incubated with propidium iodide (MP Biomedicals 0219545810, 50 μg/mL) along with the indicated CDC for 80 min, before imaged with an EVOS M5000 Cell Imaging System (Thermo Fisher Scientific).
Transmission electron microscopy
After treatment with nigericin (10 μM) or rPFO (0.90 nM) for 80 min, HeLa cells were washed with 0.1 M sodium cacodylate buffer and fixed with 2.5% glutaraldehyde and 4% paraformaldehyde in 0.1 M sodium cacodylate buffer at 4°C for 2 h. The cells were post-fixed with 1% osmium tetroxide in 0.1 M sodium cacodylate buffer for 1 h. Cells were then rinsed with 0.1 M sodium cacodylate buffer twice and maleate buffer (pH 5.1) once, before stained in 1% uranyl acetate in maleate buffer for 1 h. After removing uranyl acetate, cells were washed with maleate buffer three times. Cells were then dehydrated with increasing concentrations of ethanol (25%, 50%, 70%, 95%, and 100%), before infiltrated with propylene oxide (100% propylene oxide 3x15 min, 2:1 propylene oxide: spurr resin 2x30 min, 1:1 propylene oxide: spurr resin 2x30 min and overnight, and 100% spurr resin 6x60 min). Cells were then polymerized in a 60 °C oven for 1–2 days. Blocks were sectioned with Leica EM UC6 into 90 nm sections before post-stained with uranyl acetate and lead citrate. Images were acquired on an FEI Tecnai F30 transmission electron microscope using a voltage of 300 kV in the UChicago Advanced Electron Microscopy Facility.
Statistics and reproducibility
Representative results from at least three independent experiments are shown for every figure unless specified otherwise in the figure legends. The sample sizes were selected based on power analysis of results from pilot experiments, which show that the selected sample sizes were not only sufficient to obtain desirable significance level (<0.01) and power (>90%) but were also able to generate highly reproducible results with biological replicates. Image acquisition and analysis were performed before the sample types were mapped to wells or coverslips. Data are presented as mean ± s.d. Statistical analysis was performed using two-sided t-tests in GraphPad Prism 10.3.0. Data distribution was assumed to be normal but this was not formally tested. Statistical significance was determined with the Holm-Sidak method, with α = 0.01 for measurement of areas.
For quantification of cells with the phenotype of interest, non-overlapping whole-field images were randomly taken throughout the slide of each sample. Only the DAPI channel was used during the random selection of whole-field images to avoid bias in selection of cells with particular phenotypes before other channels were imaged. For quantification of TGN or cis/medial-Golgi marker-positive areas, cells undergoing mitosis (based on chromosomes morphology in DAPI channel) were excluded from the quantification because these cells had mitotic Golgi disassembly. 40 cells per sample were randomly selected by DAPI channel. For each cell, a region of interest (ROI) containing the entire TGN (or cis/medial-Golgi)-marker-positive structures were selected in Fiji (ImageJ 1.54j)62 and measured. To quantify the diameter of TGN vesicles induced by nigericin or rPFO, a total of 322 (for nigericin) and 458 (for rPFO) vesicles were measured from 10 cells for each condition. For percentage of cells with NLRP3 puncta formation or ASC speck formation, the number of cells with the phenotype of interest was recorded from 100 cells (randomly selected by DAPI channel) per sample and this process was repeated for a total of three times for quantification. For colocalization analysis between NLRP3 and organelle markers, an ROI was selected to cover the studied phenotypes (i.e., NLRP3 puncta) in Fiji, before Pearson's correlation coefficient (threshold regression: Costes) was calculated using Coloc 2 plugin of ImageJ. For Flag-rPFO-treated cells, fluorescence intensity line graphs were generated using ImageJ. For each channel, the fluorescence intensity was plotted individually along a line with the indicated lengths. For the SunTag system: (1) the area of individual sfGFP puncta/foci in each cell was measured in ImageJ before the average area was calculated for each cell; (2) the sum of area of sfGFP puncta/foci that colocalized with the indicated organelle markers was measured with ImageJ for each cell; (3) fluorescence intensity was plotted individually along a line with the indicated lengths and analyzed with ImageJ. For analysis of colocalization between NLRP3, rPFO (as indicated by scFv-sfGFP in the SunTag system), TGN46, and OSBPPH-mRFP, the sum of colocalization area between the two indicated proteins was measured with ImageJ for each cell.
Extended Data
Extended Data Figure 1. PFO remodeled the TGN but not other organelles.

a, Coomassie blue staining for rPFO and rPFOY181A purified from E. coli. Arrows indicate rPFO and rPFOY181A proteins. Representative from at least 3 independent experiments. b, Representative LDH release assay of HeLa cells incubated with rPFO or rPFOY181A for 80 min (n = 3 wells per condition; mean ± s.d.; two-sided t-test). Representative from 3 independent experiments. c, Quantification of TGN dispersion (left) and NLRP3 recruitment (right) in HeLa cells stably expressing NLRP3-GFP incubated with rPFO or rPFOY181A for 80 min. Areas containing TGN structures were measured with ImageJ (n = 40 cells per condition; mean ± s.d.; two-sided t-test). NLRP3 recruitment was quantified from 100 cells (n = 3). Representative from 3 independent experiments. d, Immunoblots of HEK293T cells stably expressing NLRP3, ASC, and caspase-1 (Casp1) incubated with 10 μM nigericin, 0.18/0.54/0.90/1.8 nM rPFO or 0.18/0.54/0.90/1.8 nM rPFOY181A for 40 min. pro-Casp1 has two bands because it was expressed as zeocinr-F2A-Casp1 (upper band) before ribosomal skipping to release pro-Casp1 (lower band). SE, short exposure; LE, long exposure. Representative from 3 independent experiments. e, Representative fluorescence and phase contrast images in HeLa cells stably expressing TGN46-mScarlet-I incubated with 0.90 nM rPFO for 30 min. mScarlet-I was pseudocolored to green. The TGN46 vesicles in yellow frames were highlighted in the zoom-in images. Scale bar, 5 μm. Representative from 3 independent experiments. f, Representative immunofluorescence images (left) and quantification of GM130- or giantin-containing structure areas (right) in HeLa cells incubated with 0.90 nM rPFO or not (Mock) for 80 min. Scale bar, 10 μm. Areas containing the indicated organelle markers were measured with ImageJ (n = 40 cells per condition; NS, not significant). Representative from 3 independent experiments. g, Representative immunofluorescence images (left) and quantification of colocalization between rPFO-induced NLRP3 puncta and organelle markers (right) in HeLa cells stably expressing NLRP3-GFP incubated with 0.90 nM rPFO or not (Mock) for 80 min. Scale bar, 10 μm. Colocalization of NLRP3 puncta with the indicated organelle markers after rPFO treatment was analyzed with Pearson correlation coefficient using Coloc 2 plugin of ImageJ (n = 20 cells/sample; threshold regression: Costes). Representative from 3 independent experiments.
Extended Data Figure 2. Multiple CDCs induced TGN remodeling and NLRP3 recruitment.
a, Coomassie blue staining for CDCs purified from E. coli. Arrows indicate the CDC proteins. Representative from at least 3 independent experiments. b, Representative LDH release assay of HeLa cells incubated with the indicated CDCs for 80 min (n = 3 wells per condition; mean ± s.d.). Representative from 2 independent experiments. c, Immunoblots of HEK293T cells stably expressing NLRP3, ASC, and caspase-1 (Casp1) incubated with 10 μM nigericin, 0.18/0.54/1.8/5.4 nM rALO, or 1.8/5.4/10.8/14.4 nM rSLO for 40 min. pro-Casp1 has two bands in this cell line because it was expressed as zeocinr-F2A-Casp1 (upper band) before ribosomal skipping to release pro-Casp1 (lower band). SE, short exposure; LE, long exposure. Representative from 3 independent experiments. d, Representative immunofluorescence images (left) and quantification of TGN dispersion and NLRP3 recruitment (right) in HeLa cells stably expressing NLRP3-GFP incubated with 0.18/0.54//0.90/1.8 nM rALO or not (Mock) for 80 min. Representative images for mock treatment and 1.8 nM rALO treatment are shown. Scale bar, 10 μm. Areas containing TGN structures were measured with ImageJ (n = 40 cells per condition; two-sided t-test ). NLRP3 recruitment was quantified from 100 cells (n = 3; N.D., not detectable). Representative from at least 3 independent experiments. e, As in d, except cells were incubated with 5.4/10.8/14.4/18 nM rSLO or not (Mock). Representative images for mock treatment and 14.4 nM rSLO treatment are shown. Scale bar, 10 μm. Representative from at least 3 independent experiments.
Extended Data Figure 3. K+ efflux was essential for ASC recruitment induced by multiple CDCs.

a–c, Representative immunofluorescence images (left) and quantification of TGN dispersion and NLRP3 recruitment (right) in HeLa cells stably expressing NLRP3-GFP incubated with 1.8 nM rALO (a), 14.4 nM rSLO (b), or 5.4 nM rPLY (c) for 80 min in the presence of KCl at the indicated concentrations. Scale bar, 10 μm. Areas containing TGN structures were measured with ImageJ (n = 40 cells per condition, mean ± s.d.; two-sided t-test; NS, not significant). NLRP3 recruitment was quantified from 100 cells (n = 3; N.D., not detectable). Representative from 3 independent experiments. d, Representative immunofluorescence images (left) and quantification of ASC speck formation (right) in HeLa cells stably expressing NLRP3-GFP and ASC incubated with 1.8 nM rALO, 14.4 nM rSLO or 5.4 nM rPLY for 60 min in the presence of KCl at the indicated concentrations. Scale bar, 25 μm. The percentage of cells with ASC speck formation was quantified from 100 cells (n = 3). Representative from 3 independent experiments. e, Model: CDCs represent a third type of NLRP3 stimuli. The canonical K+ efflux-dependent stimuli (e.g., nigericin) does not require K+ efflux for TGN dispersion but requires K+ efflux for NLRP3 recruitment to the dispersed TGN. The K+ efflux-independent stimuli (e.g., imiquimod) does not require K+ efflux for any step. CDCs do not require K+ efflux for either TGN dispersion or NLRP3 recruitment but require K+ efflux for ASC recruitment.
Extended Data Figure 4. Neither retrograde trafficking nor endosomal maturation was required for PFO-mediated TGN remodeling or NLRP3 inflammasome activation.

a–c, Representative immunofluorescence images (a), quantification of TGN dispersion (b) and NLRP3 recruitment (c) in HeLa cells stably expressing NLRP3-GFP pre-treated with DMSO (solvent control), 25 μM retro-2cycl or 20 μM EGA for 1 h before addition of 0.90 nM rPFO or not (Mock) for 80 min. Scale bar, 10 μm. Areas containing TGN structures were measured with ImageJ (n = 40 cells per condition; mean ± s.d.; two-sided t-test; NS, not significant). NLRP3 recruitment was quantified from 100 cells (n = 3; N.D., not detectable). Representative from 3 independent experiments. d, Immunoblots of HEK293T cells stably expressing NLRP3, ASC, and caspase-1 (Casp1) pre-treated with DMSO (solvent control), 25 μM retro-2cycl, or 20 μM EGA for 1 h before addition of 0.90 nM rPFO for 40 min. pro-Casp1 has two bands in this cell line because it was expressed as zeocinr-F2A-Casp1 (upper band) before ribosomal skipping to release pro-Casp1 (lower band). Representative from 2 independent experiments.
Extended Data Figure 5. Endocytosis was not required for PFO trafficking or PFO-mediated NLRP3 inflammasome activation.

a–c, Representative immunofluorescence images (a), quantification of rPFO colocalization with the TGN (b) and TGN dispersion (c) in HeLa cells stably expressing scFv-sfGFP pre-treated with DMSO (solvent control), 25 μM retro-2cycl or pitstop 2 (20 μM) for 1 h before addition of 0.90 nM 10xGCN4-rPFO. Scale bar, 5 μm. Areas of rPFO foci colocalizing with the TGN were measured with ImageJ (n = 40 cells per condition; mean ± s.d.; two-sided t-test; N.D., not detectable, NS, not significant). Areas containing TGN structures were measured with ImageJ (n = 40 cells per condition). Representative from 2 independent experiments. d, Immunoblots of HEK293T cells stably expressing NLRP3, ASC, and caspase-1 (Casp1) pre-treated with DMSO (solvent control) or 20 μM pitstop 2 for 1 h before addition of 0.90 nM rPFO for 40 min. pro-Casp1 has two bands in this cell line because it was expressed as zeocinr-F2A-Casp1 (upper band) before ribosomal skipping to release pro-Casp1 (lower band). Representative from 2 independent experiments.
Extended Data Figure 6. Endocytosis was not required for PFO-mediated TGN remodeling or NLRP3 inflammasome activation.

a,b, Representative immunofluorescence images (a) and quantification of TGN dispersion (b) in HeLa cells transfected with V5-tagged dynamin 1 (DNM1) (WT or dominant-negative mutant K44A), dynamin 2 (DNM2) (WT or dominant-negative mutant K44A) or not (Original) before incubated with 0.90 nM rPFO or not (Mock) for 80 min. Scale bar, 5 μm. b, Areas containing TGN structures were measured with ImageJ (n = 40 cells per condition; mean ± s.d.; two-sided t-test; NS, not significant). Representative from 2 independent experiments. c, Immunoblots of HEK293T cells stably expressing NLRP3, ASC, and caspase-1 (Casp1) before transfected as in a (top) and the same cell lines incubated with 0.90 nM rPFO for 40 min (bottom). pro-Casp1 has two bands in this cell line because it was expressed as zeocinr-F2A-Casp1 (upper band) before ribosomal skipping to release pro-Casp1 (lower band). Representative from 3 independent experiments.
Extended Data Figure 7. Membrane repair negatively regulated PFO translocation to the TGN.

a, Schematic of Ca2+ influx-driven membrane repair. Left: in Ca2+-containing medium, PFO induces Ca2+ influx, which leads to membrane repair. Right: in Ca2+-free medium, PFO cannot induce Ca2+ influx, and thus is unable to trigger membrane repair. b,c, Representative fluorescence and phase contrast images (b) and quantification of propidium iodide-positive cells (c) in HeLa cells incubated with rPFO in Ca2+-containing medium or Ca2+-free medium supplemented with 50 μg/mL propidium iodide for 80 min. Scale bar, 25 μm. c, The percentage of cells with propidium iodide signal was quantified from 100 cells (n = 3; mean ± s.d.; two-sided t-test; NS, not significant). Representative from 3 independent experiments. d, Representative immunofluorescence images (left) and quantification of rPFO colocalization with the TGN (right) in HeLa cells stably expressing scFv-sfGFP incubated with 10xGCN4-rPFO in Ca2+-containing medium or Ca2+-free medium for 80 min. Areas of rPFO foci colocalizing with the TGN were measured with ImageJ (n = 40 cells per condition; N.D., not detectable). Scale bar, 5 μm. Representative from 3 independent experiments.
Extended Data Figure 8. Membrane repair inhibitors enhanced PFO-mediated TGN remodeling and NLRP3 recruitment.

a, Representative LDH release assay of HeLa cells pre-treated with DMSO (solvent control), 20 μM U0126, or 20 μM mirdametinib for 30 min before addition of rPFO for 80 min (n = 3 wells per condition; mean ± s.d.; two-sided t-test; NS, not significant). Representative from 3 independent experiments. b–d, Representative immunofluorescence images (b), quantification of TGN dispersion (c) and NLRP3 recruitment (d) in HeLa cells stably expressing NLRP3-GFP pre-treated with DMSO (solvent control), 20 μM U0126 or 20 μM mirdametinib for 30 min before addition of rPFO or not (Mock) for 80 min. Scale bar, 10 μm. Areas containing TGN structures were measured with ImageJ (n = 40 cells per condition ). NLRP3 recruitment was quantified from 100 cells (n = 3; N.D., not detectable). Representative from 3 independent experiments.
Extended Data Figure 9. DLY did not activate the NLRP3 inflammasome.

a, Representative LDH release assay of HeLa cells incubated with rDLY for 80 min (n = 3 wells per condition; mean ± s.d.). Representative from 2 independent experiments. b, Representative fluorescence and phase contrast images (left) and quantification of propidium iodide-positive cells (right) in HeLa cells incubated with rDLY or not (Mock) in 50 μg/mL propidium iodide-containing medium for 80 min. Scale bar, 25 μm. The percentage of cells with propidium iodide signal was quantified from 100 cells (n = 3; mean ± s.d.; two-sided t-test ). Representative from 3 independent experiments. c, Immunoblots of HEK293T cells stably expressing NLRP3, ASC, and caspase-1 (Casp1) incubated with 10 μM nigericin or 0.18/0.54/1.8/5.4 nM rDLY for 40 min. pro-Casp1 has two bands in this cell line because it was expressed as zeocinr-F2A-Casp1 (upper band) before ribosomal skipping to release pro-Casp1 (lower band). SE, short exposure; LE, long exposure. Representative from 3 independent experiments. d, Schematic for rPFO and rDLY chimeric proteins. The signal peptide (residue 1–28) of rPFO was deleted. rDLY does not have a signal peptide and therefore no deletion was performed. Domain (D)1, D2, D3, and D4 in rPFO are swapped with the corresponding domains in rDLY. D1, D2, and D3 are discontinuous domains. e, Representative LDH release assay of HeLa cells incubated with rPFO_DLYD4 (rPFO with its D4 replaced by D4 of rDLY) for 80 min (n = 3 wells per condition). Representative from 2 independent experiments. f, Representative immunofluorescence images (top) and quantification of TGN dispersion and NLRP3 recruitment (bottom) in HeLa cells stably expressing NLRP3-GFP incubated with 0.90 nM rPFO, 1.8 nM rPFO_DLYD4 or not (Mock) for 80 min. Scale bar, 10 μm. Areas containing TGN structures were measured with ImageJ (n = 40 cells per condition; NS, not significant). NLRP3 recruitment was quantified from 100 cells (n = 3; N.D., not detected). Representative from 3 independent experiments. g, Model: CDCs can be grouped into two types based on whether they can be internalized by host cells to remodel the TGN. Type A CDCs form pores on the plasma membrane before being internalized inside cells and translocating to the TGN. This translocation is mediated by D4 and is negatively regulated by Ca2+ influx-driven membrane repair, as membrane repair facilitates the clearance of CDC pores. After reaching the TGN, type A CDCs peel away the PtdIns4P-negative TGN membrane into multiple vesicles, thus exposing the remodeled perinuclear PtdIns4P-positive TGN membrane for NLRP3 inflammasome assembly. CDC-induced K+ efflux is not essential for TGN dispersion or NLRP3 recruitment but required for ASC recruitment. Type B CDCs (represented by DLY), while also capable of forming pores on the plasma membrane, do not get internalized. As a result, type B CDCs do not translocate to the TGN and therefore cannot remodel the TGN to activate the NLRP3 inflammasome.
Extended Data Table 1. Summary of pathogenic bacteria-derived CDCs examined in this study.
| CDC | Bacteria | Undecapeptide | Signal peptide | Human CD59 as additional receptor |
TGN dispersion |
NLRP3 recruitment |
NLRP3 inflammasome activation |
|---|---|---|---|---|---|---|---|
| Perfringolysin O (PFO) | Clostridium perfringens | ECTGLAWEWWR | Yes | No | Yes | Yes | Yes |
| Anthrolysin O (ALO) | Bacillus anthracis | ECTGLAWEWWR (identical to PFO) | Yes | No | Yes | Yes | Yes |
| Streptolysin O (SLO) | Streptococcus pyogenes | ECTGLAWEWWR (identical to PFO) | Yes | No | Yes | Yes | Yes |
| Pneumolysin (PLY) | Streptococcus pneumoniae | ECTGLAWEWWR (identical to PFO) | No | No | Yes | Yes | Yes |
| Pyolysin (PLO) | Trueperella pyogenes | EATGLAWDPWW (No Cys) | Yes | No | Yes | Yes | Yes |
| Suilysin (SLY) | Streptococcus suis | ECTGLAWEWWR (identical to PFO) | Yes | No | Yes | Yes | Yes |
| Vaginolysin (VLY) | Gardnerella vaginalis | EKTGLVWEPWR (No Cys) | Yes | Yes | Yes | Yes | Yes |
Differences compared to the canonical undecapeptide sequence are highlighted with underline. 'No Cys', not containing a cysteine residue in the undecapeptide.
Supplementary Material
ACKNOWLEDGEMENTS
We thank J. E. Vidal and A. G. Vidal (University of Mississippi Medical Center) for sharing reagents, R. Tweten, S. Melville, D. Portnoy, M. Federle, D. Missiakas, L. Comstock, T. Golovkina, A. Chervonsky, S. Light, M. Mimee, and J. Lee for expertise, Y. Chen at UChicago Advanced Electron Microscopy Facility and L. Degenstein at UChicago Transgenic Mouse Facility for technical assistance, and all Chen Lab members for their help and support. This work was supported by the National Institute of General Medical Sciences (R35GM151390 to J.C.) and the National Institute of Allergy and Infectious Diseases (R01AI182143 to J.C.). Part of the work was performed at the Howard Taylor Ricketts Laboratory, a Regional Biocontainment Laboratory supported by the National Institute of Allergy and Infectious Diseases (UC7AI180312).
Footnotes
DECLARATION OF INTERESTS
The authors declare no competing financial interests.
DATA AVAILABILITY
Source data are provided with this paper.
REFERENCES
- 1.Peraro MD & van der Goot FG Pore-forming toxins: ancient, but never really out of fashion. Nat Rev Microbiol 14, 77–92 (2016). [DOI] [PubMed] [Google Scholar]
- 2.Hotze EM & Tweten RK Membrane assembly of the cholesterol-dependent cytolysin pore complex. Biochimica et Biophysica Acta (BBA) - Biomembranes 1818, 1028–1038 (2012). [DOI] [PMC free article] [PubMed] [Google Scholar]
- 3.Gonzalez MR et al. Pore-forming toxins induce multiple cellular responses promoting survival. Cellular Microbiology 13, 1026–1043 (2011). [DOI] [PubMed] [Google Scholar]
- 4.Jing W, Lo Pilato J, Kay C & Man SM Activation mechanisms of inflammasomes by bacterial toxins. Cellular Microbiology 23, e13309 (2021). [DOI] [PubMed] [Google Scholar]
- 5.Ellemor DM et al. Use of genetically manipulated strains of Clostridium perfringens reveals that both alpha-toxin and theta-toxin are required for vascular leukostasis to occur in experimental gas gangrene. Infect Immun 67, 4902–7 (1999). [DOI] [PMC free article] [PubMed] [Google Scholar]
- 6.Awad MM, Ellemor DM, Boyd RL, Emmins JJ & Rood JI Synergistic effects of alpha-toxin and perfringolysin O in Clostridium perfringens-mediated gas gangrene. Infect Immun 69, 7904–10 (2001). [DOI] [PMC free article] [PubMed] [Google Scholar]
- 7.Heffernan BJ, Thomason B, Herring-Palmer A & Hanna P Bacillus anthracis anthrolysin O and three phospholipases C are functionally redundant in a murine model of inhalation anthrax. FEMS Microbiol Lett 271, 98–105 (2007). [DOI] [PubMed] [Google Scholar]
- 8.Takeuchi D et al. The Contribution of Suilysin to the Pathogenesis of Streptococcus suis Meningitis. The Journal of Infectious Diseases 209, 1509–1519 (2014). [DOI] [PubMed] [Google Scholar]
- 9.Stavru F, Bouillaud F, Sartori A, Ricquier D & Cossart P Listeria monocytogenes transiently alters mitochondrial dynamics during infection. Proceedings of the National Academy of Sciences 108, 3612–3617 (2011). [Google Scholar]
- 10.Braun JS et al. Pneumolysin Causes Neuronal Cell Death through Mitochondrial Damage. Infection and Immunity 75, 4245–4254 (2007). [DOI] [PMC free article] [PubMed] [Google Scholar]
- 11.Mesquita FS et al. Endoplasmic reticulum chaperone Gp96 controls actomyosin dynamics and protects against pore-forming toxins. EMBO reports 18, 303–318 (2017). [DOI] [PMC free article] [PubMed] [Google Scholar]
- 12.Malet JK, Cossart P & Ribet D Alteration of epithelial cell lysosomal integrity induced by bacterial cholesterol-dependent cytolysins. Cellular Microbiology 19, e12682 (2017). [DOI] [PMC free article] [PubMed] [Google Scholar]
- 13.Nozawa T et al. Intracellular Group A Streptococcus Induces Golgi Fragmentation To Impair Host Defenses through Streptolysin O and NAD-Glycohydrolase. mBio 12, 10.1128/mbio.01974-20 (2021). [DOI] [Google Scholar]
- 14.Broz P & Dixit VM Inflammasomes: mechanism of assembly, regulation and signalling. Nat Rev Immunol 16, 407–20 (2016). [DOI] [PubMed] [Google Scholar]
- 15.Pandey A, Shen C, Feng S & Man SM Cell biology of inflammasome activation. Trends in Cell Biology (2021) doi: 10.1016/j.tcb.2021.06.010. [DOI] [Google Scholar]
- 16.Witzenrath M et al. The NLRP3 inflammasome is differentially activated by pneumolysin variants and contributes to host defense in pneumococcal pneumonia. J Immunol 187, 434–40 (2011). [DOI] [PubMed] [Google Scholar]
- 17.Fang R et al. Critical roles of ASC inflammasomes in caspase-1 activation and host innate resistance to Streptococcus pneumoniae infection. J Immunol 187, 4890–9 (2011). [DOI] [PMC free article] [PubMed] [Google Scholar]
- 18.Yamamura K et al. Inflammasome Activation Induced by Perfringolysin O of Clostridium perfringens and Its Involvement in the Progression of Gas Gangrene. Front Microbiol 10, 2406 (2019). [DOI] [PMC free article] [PubMed] [Google Scholar]
- 19.Chu J et al. Cholesterol-dependent cytolysins induce rapid release of mature IL-1beta from murine macrophages in a NLRP3 inflammasome and cathepsin B-dependent manner. J Leukoc Biol 86, 1227–38 (2009). [DOI] [PMC free article] [PubMed] [Google Scholar]
- 20.McNeela EA et al. Pneumolysin activates the NLRP3 inflammasome and promotes proinflammatory cytokines independently of TLR4. PLoS Pathog 6, e1001191 (2010). [DOI] [PMC free article] [PubMed] [Google Scholar]
- 21.Katsnelson MA, Rucker LG, Russo HM & Dubyak GR K+ efflux agonists induce NLRP3 inflammasome activation independently of Ca2+ signaling. J Immunol 194, 3937–3952 (2015). [DOI] [PMC free article] [PubMed] [Google Scholar]
- 22.Munoz-Planillo R et al. K(+) efflux is the common trigger of NLRP3 inflammasome activation by bacterial toxins and particulate matter. Immunity 38, 1142–53 (2013). [DOI] [PMC free article] [PubMed] [Google Scholar]
- 23.Chen J & Chen ZJ PtdIns4P on dispersed trans-Golgi network mediates NLRP3 inflammasome activation. Nature 564, 71–76 (2018). [DOI] [PMC free article] [PubMed] [Google Scholar]
- 24.Hotze EM et al. Monomer-monomer interactions propagate structural transitions necessary for pore formation by the cholesterol-dependent cytolysins. J Biol Chem 287, 24534–43 (2012). [DOI] [PMC free article] [PubMed] [Google Scholar]
- 25.Farrand AJ, LaChapelle S, Hotze EM, Johnson AE & Tweten RK Only two amino acids are essential for cytolytic toxin recognition of cholesterol at the membrane surface. Proc Natl Acad Sci U S A 107, 4341–6 (2010). [DOI] [PMC free article] [PubMed] [Google Scholar]
- 26.Gross O Measuring the inflammasome. Methods Mol Biol 844, 199–222 (2012). [DOI] [PubMed] [Google Scholar]
- 27.Mariathasan S et al. Cryopyrin activates the inflammasome in response to toxins and ATP. Nature 440, 228–32 (2006). [DOI] [PubMed] [Google Scholar]
- 28.Balla T & Varnai P Visualizing cellular phosphoinositide pools with GFP-fused protein-modules. Sci STKE 2002, pl3 (2002). [DOI] [PubMed] [Google Scholar]
- 29.Mathur A et al. Clostridium perfringens virulence factors are nonredundant activators of the NLRP3 inflammasome. EMBO reports 24, e54600 (2023). [DOI] [PMC free article] [PubMed] [Google Scholar]
- 30.Valeriani RG, Beard LL, Moller A, Ohtani K & Vidal JE Gas gangrene-associated gliding motility is regulated by the Clostridium perfringens CpAL/VirSR system. Anaerobe 66, 102287 (2020). [DOI] [PubMed] [Google Scholar]
- 31.Vidal JE, Shak JR & Canizalez-Roman A The CpAL Quorum Sensing System Regulates Production of Hemolysins CPA and PFO To Build Clostridium perfringens Biofilms. Infection and Immunity 83, 2430–2442 (2015). [DOI] [PMC free article] [PubMed] [Google Scholar]
- 32.Walker JA, Allen RL, Falmagne P, Johnson MK & Boulnois GJ Molecular cloning, characterization, and complete nucleotide sequence of the gene for pneumolysin, the sulfhydryl-activated toxin of Streptococcus pneumoniae. Infection and Immunity 55, 1184–1189 (1987). [DOI] [PMC free article] [PubMed] [Google Scholar]
- 33.Ding H & Lämmler C Purification and Further Characterization of a Haemolysin of Actinomyces pyogenes. Journal of Veterinary Medicine, Series B 43, 179–188 (1996). [DOI] [PubMed] [Google Scholar]
- 34.Gelber SE, Aguilar JL, Lewis KLT & Ratner AJ Functional and Phylogenetic Characterization of Vaginolysin, the Human-Specific Cytolysin from Gardnerella vaginalis. Journal of Bacteriology 190, 3896–3903 (2008). [DOI] [PMC free article] [PubMed] [Google Scholar]
- 35.Harder J et al. Activation of the Nlrp3 Inflammasome by Streptococcus pyogenes Requires Streptolysin O and NF-κB Activation but Proceeds Independently of TLR Signaling and P2X7 Receptor. J Immunol 183, 5823–5829 (2009). [DOI] [PMC free article] [PubMed] [Google Scholar]
- 36.Liang H, Wang B, Wang J, Ma B & Zhang W Pyolysin of Trueperella pyogenes Induces Pyroptosis and IL-1β Release in Murine Macrophages Through Potassium/NLRP3/Caspase-1/Gasdermin D Pathway. Frontiers in Immunology 13, (2022). [Google Scholar]
- 37.Song L et al. Contribution of Nlrp3 Inflammasome Activation Mediated by Suilysin to Streptococcal Toxic Shock-like Syndrome. Front. Microbiol 11, (2020). [Google Scholar]
- 38.Tanenbaum ME, Gilbert LA, Qi LS, Weissman JS & Vale RD A Protein-Tagging System for Signal Amplification in Gene Expression and Fluorescence Imaging. Cell 159, 635–646 (2014). [DOI] [PMC free article] [PubMed] [Google Scholar]
- 39.Mallard F et al. Direct pathway from early/recycling endosomes to the Golgi apparatus revealed through the study of shiga toxin B-fragment transport. J Cell Biol 143, 973–90 (1998). [DOI] [PMC free article] [PubMed] [Google Scholar]
- 40.Gillespie EJ et al. Selective inhibitor of endosomal trafficking pathways exploited by multiple toxins and viruses. Proceedings of the National Academy of Sciences 110, E4904–E4912 (2013). [Google Scholar]
- 41.Stechmann B et al. Inhibition of retrograde transport protects mice from lethal ricin challenge. Cell 141, 231–42 (2010). [DOI] [PubMed] [Google Scholar]
- 42.Woodman PG Biogenesis of the Sorting Endosome: The Role of Rab5. Traffic 1, 695–701 (2000). [DOI] [PubMed] [Google Scholar]
- 43.Williams JM & Tsai B Intracellular trafficking of bacterial toxins. Current Opinion in Cell Biology 41, 51–56 (2016). [DOI] [PMC free article] [PubMed] [Google Scholar]
- 44.Dutta D, Williamson CD, Cole NB & Donaldson JG Pitstop 2 Is a Potent Inhibitor of Clathrin-Independent Endocytosis. PLOS ONE 7, e45799 (2012). [DOI] [PMC free article] [PubMed] [Google Scholar]
- 45.von Kleist L et al. Role of the Clathrin Terminal Domain in Regulating Coated Pit Dynamics Revealed by Small Molecule Inhibition. Cell 146, 471–484 (2011). [DOI] [PubMed] [Google Scholar]
- 46.Hinshaw JE Dynamin and Its Role in Membrane Fission1. Annual Review of Cell and Developmental Biology 16, 483–519 (2000). [Google Scholar]
- 47.Andrews NW & Corrotte M Plasma membrane repair. Current Biology 28, R392–R397 (2018). [DOI] [PubMed] [Google Scholar]
- 48.Clapham DE Calcium Signaling. Cell 131, 1047–1058 (2007). [DOI] [PubMed] [Google Scholar]
- 49.Ray S, Roth R & Keyel PA Membrane repair triggered by cholesterol-dependent cytolysins is activated by mixed lineage kinases and MEK. Science Advances 8, eabl6367 (2022). [DOI] [PMC free article] [PubMed] [Google Scholar]
- 50.Hotze EM et al. Identification and characterization of the first cholesterol-dependent cytolysins from Gram-negative bacteria. Infect Immun 81, 216–25 (2013). [DOI] [PMC free article] [PubMed] [Google Scholar]
- 51.De Matteis MA & Luini A Exiting the Golgi complex. Nat Rev Mol Cell Biol 9, 273–84 (2008). [DOI] [PubMed] [Google Scholar]
- 52.Hartmann S, Radochonski L, Ye C, Martinez-Sobrido L & Chen J SARS-CoV-2 ORF3a drives dynamic dense body formation for optimal viral infectivity. Nat Commun 16, 4393 (2025). [DOI] [PMC free article] [PubMed] [Google Scholar]
- 53.Moertel CL et al. ReNeu: A Pivotal, Phase IIb Trial of Mirdametinib in Adults and Children With Symptomatic Neurofibromatosis Type 1-Associated Plexiform Neurofibroma. JCO 43, 716–729 (2025). [Google Scholar]
- 54.Mitchell TJ & Dalziel CE The biology of pneumolysin. Subcell Biochem 80, 145–60 (2014). [DOI] [PubMed] [Google Scholar]
- 55.Billington SJ, Jost BH & Songer JG Thiol-activated cytolysins: structure, function and role in pathogenesis. FEMS Microbiol Lett 182, 197–205 (2000). [DOI] [PubMed] [Google Scholar]
- 56.Shepard LA, Shatursky O, Johnson AE & Tweten RK The mechanism of pore assembly for a cholesterol-dependent cytolysin: formation of a large prepore complex precedes the insertion of the transmembrane beta-hairpins. Biochemistry 39, 10284–93 (2000). [DOI] [PubMed] [Google Scholar]
- 57.Vidal JE, Shak JR & Canizalez-Roman A The CpAL Quorum Sensing System Regulates Production of Hemolysins CPA and PFO To Build Clostridium perfringens Biofilms. Infection and Immunity 83, 2430–2442 (2015). [DOI] [PMC free article] [PubMed] [Google Scholar]
- 58.Juliana C et al. Non-transcriptional priming and deubiquitination regulate NLRP3 inflammasome activation. J Biol Chem 287, 36617–22 (2012). [DOI] [PMC free article] [PubMed] [Google Scholar]
- 59.Bauernfeind FG et al. Cutting Edge: NF-κB Activating Pattern Recognition and Cytokine Receptors License NLRP3 Inflammasome Activation by Regulating NLRP3 Expression1. The Journal of Immunology 183, 787–791 (2009). [DOI] [PMC free article] [PubMed] [Google Scholar]
- 60.Ray S, Roth R & Keyel PA Membrane repair triggered by cholesterol-dependent cytolysins is activated by mixed lineage kinases and MEK. Science Advances 8, eabl6367 (2022). [DOI] [PMC free article] [PubMed] [Google Scholar]
- 61.Davis M Application Note: Nikon NIS-Elements Denoise.ai Software: utilizing deep learning to denoise confocal data. Nature Research Custom (2019). [Google Scholar]
- 62.Schneider CA, Rasband WS & Eliceiri KW NIH Image to ImageJ: 25 years of image analysis. Nat Methods 9, 671–675 (2012). [DOI] [PMC free article] [PubMed] [Google Scholar]
Associated Data
This section collects any data citations, data availability statements, or supplementary materials included in this article.
Supplementary Materials
Data Availability Statement
Source data are provided with this paper.