

Abstract
Zeolitic imidazolate framework‐8 (ZIF‐8) is a promising material for C3H6/C3H8 separation; however, its inherent linker flexibility compromises molecular sieving effect. To address this limitation, a novel ZIF‐8, namely heterogeneous ZIF‐8 (hZIF‐8), is developed, consisting of nanocrystalline ZIF‐8 phases with a minor amorphous polymer component introduced via in situ coordination. hZIF‐8 is synthesized through a Lewis‐acid‐catalyzed cationic ring‐opening polymerization of tetrahydrofuran (THF), generating polytetramethylene ether glycol (PTMEG) chains that competitively coordinate with zinc ions during ZIF‐8 crystallization. This coordination‐mediated heterogeneous structure exhibits unique characteristics distinct from conventional ZIF‐8 and other polymer hybrid MOFs such as PolyMOFs. The polymer phase effectively restricts the linker flexibility of the nanocrystalline phase at the molecular level, leading to significantly enhanced molecular sieving properties. As a result, hZIF‐8‐containing mixed‐matrix membranes (MMMs) exhibit a significant enhancement in C3H6/C3H8 separation performance, with the separation factor increasing from 13.3 to 75.5 (by 468%) and the C3H6 permeability from 7.4 to 17.4 Barrer (by 135%) at 30 wt.% loading. Furthermore, the intrinsic selectivity of hZIF‐8 is predicted to reach ≈3700, representing an order‐of‐magnitude improvement over that of pristine ZIF‐8 (≈180).
Keywords: C3H6/C3H8 separation, coordination polymers, metal‐organic frameworks, mixed‐matrix membranes, zeolitic imidazolate frameworks
A new class of MOFs, one of its kind exemplified by heterogeneous ZIF‐8 (hZIF‐8), is developed through the competitive coordination of polymer and crystalline phases. This unique structure effectively restricts the linker motion of the ZIF‐8 crystal phase, achieving an exceptional C₃H₆/C₃H₈ molecular sieving effect. hZIF‐8‐based composite membranes exhibit outstanding C₃H₆/C₃H₈ separation performance, far surpassing ZIF‐8.

1. Introduction
Zeolitic imidazolate frameworks (ZIFs), a subclass of metal‐organic frameworks (MOFs), are considered a very promising microporous crystalline material for diverse applications, including gas separations.[ 1 ] In particular, ZIF‐8, made of Zn centers tetrahedrally coordinated with 2‐methylimidazole (HmIm) ligands with sodalite (SOD) typology, has been most extensively studied due to its remarkable propylene/propane (C3H6/C3H8) separation capability and its robust synthesis protocols.[ 2 ] Despite its crystallographically‐defined aperture size of ≈3.4 Å, ZIF‐8 exhibits a much larger effective aperture (i.e., 4.0–4.2 Å) resulting from the linker swing motion, thereby showing a high molecular sieving effect for C3H6/C3H8 gas mixtures. The intrinsic C3H6 permeability and C3H6/C3H8 selectivity of ZIF‐8, determined by equilibrium and kinetic sorption measurements, were ≈390 Barrer and ≈130, respectively.[ 3 ] As such, ZIF‐8‐based membranes have shown superior C3H6/C3H8 separation performances.[ 4 , 5 ]
However, unlike more rigid molecular sieves such as zeolites, ZIF‐8 does not exhibit a sharp molecular sieving effect due to its flexibility like a saloon door, allowing the diffusion of much larger guest gas molecules than its aperture size.[ 6 ] In this regard, several attempts have been made to further improve the intrinsic C3H6/C3H8 selectivity of ZIF‐8 by restricting the linker flexibility.[ 7 , 8 , 9 , 10 , 11 , 12 , 13 ] For example, Co‐substituted ZIF‐8 (known as ZIF‐67) showed enhanced C3H6/C3H8 selectivity due to the slightly more restricted linker flexibility resulting from the shorter and stiffer Co─N bonds.[ 7 , 8 ] In addition, different space groups exhibited different linker rotations, thereby affecting the molecular sieving properties of ZIF‐8.[ 9 ] ZIF‐8 with Cm (monoclinic) and R3m (trigonal) exhibited more rigid lattices than that with the dominant space group, (cubic).[ 10 , 11 , 12 ] While the simulation results predicted ZIF‐8_Cm with an impressive C3H6/C3H8 selectivity as high as ≈530, the ZIF‐8_Cm membranes prepared by a fast current‐driven synthesis achieved a C3H6/C3H8 separation factor of ≈300.[ 12 ] Recently, molecular guests such as crown ethers have been introduced to ZIF‐8 cavities to restrict linker mobility and improve separation performance.[ 13 ]
There have been several reports that the linker motion can be effectively restricted by neighboring phases due to a “space‐confinement effect,” consequently sharpening the molecular sieving effect of MOFs.[ 14 , 15 , 16 , 17 , 18 , 19 , 20 , 21 , 22 ] For MOF‐containing mixed‐matrix membranes (MMMs) (i.e., polymer/MOF composites), the linker flexibilities of the filler MOF particles were found suppressed by surrounding polymer phases, exhibiting higher selectivities far beyond prediction.[ 15 , 16 , 17 ] In particular, Hua et al.[ 18 ] demonstrated that using ultra‐small ZIF‐8 nanoparticles (<5 nm) in MMMs significantly enhanced the polymer‐MOF interfacial interaction, thereby effectively restricting the linker motion and considerablly improving C3H6/C3H8 selectivity. Similarly, in the cases of pure polycrystalline MOF membranes, polymer overlayers significantly improved the gas separation performances of the membranes by not only sealing the microstructural defects but also restricting the linker motion.[ 19 , 20 , 21 , 22 ] However, the reported linker motion restriction is mostly limited to the external surfaces of MOFs, consequently showing limited effects. Therefore, it is hypothesized that if a neighboring phase can suppress linker motion at the molecular level, the enhancement in the molecular sieving effects by restricted linker motion would be much more pronounced.
Various strategies have been employed to integrate polymers with MOFs, aiming to enhance structural flexibility, stability, or processability.[ 23 ] PolyMOFs proposed by Cohen et al.[ 24 ] incorporate polymeric ligands directly into the MOF framework, forming hybrid structures in which polymer chains act as bridging linkers between metal nodes. While offering improved mechanical flexibility and solution processability, this approach often sacrifices inherent porosity and framework rigidity due to the bulky nature of polymeric linkers. Surface‐initiated polymerization enables the controlled growth of polymer brushes from MOF surfaces, forming well‐defined core–shell structures.[ 25 , 26 ] However, this strategy primarily modifies external surfaces and does not impact the internal dynamics of the framework. Post‐synthetic modification, including covalent grafting of polymers onto MOF surfaces or within pores using click chemistry, allows for chemical tuning of surface functionality, but typically lacks uniformity and atomic‐level control.[ 27 ] Hierarchical MOF–polymer assemblies such as layer‐by‐layer films or 3D‐printed composites provide multiscale organization but are limited in their ability to alter intrinsic framework behavior.[ 28 , 29 ] These limitations collectively suggest that existing polymer‐based strategies, which typically rely on matrix‐level or external surface confinement, remain insufficient for achieving molecular‐level confinement necessary to suppress linker motion from within the framework itself.
In this study, we present a new strategy to effectively restrict the linker motion of ZIF‐8 at the molecular level by incorporating an amorphous polymer phase during in situ framework formation. The structure and properties of the ZIF‐8‐based composite, namely heterogeneous ZIF‐8 (hZIF‐8), were thoroughly investigated using a battery of tools and compared with those of its crystalline counterpart, ZIF‐8. Finally, the C3H6/C3H8 separation properties of hZIF‐8 were examined based on gas adsorption and gas permeation measurements of hZIF‐8‐containing MMMs.
2. Results and Discussion
2.1. Behavior of Heterogeneous ZIF‐8
hZIF‐8 is a novel ZIF‐8 design that effectively restricts the flexibility of the ZIF‐8 aperture by incorporating polymer phases within crystalline ZIF‐8 phases on a molecular scale through coordination bonds. Neighboring relatively bulky and amorphous polymer phases are expected to interfere with the swing motion of 2‐methylimidazole (HmIm), a ZIF‐8 linker, resulting in enhanced molecular sieving effects for propylene/propane separation (Figure 1 ). To achieve this, it is hypothesized that polymer phases can be integrated by the competitive coordination of zinc ions with HmIm linker precursors and polymers derived from the Lewis‐acid‐catalyzed cationic ring‐opening of tetrahydrofuran (THF) (Figure 1).
Figure 1.

Illustration of hZIF‐8 composed of ZIF‐8 and polymer phases and its expected enhancement of molecular sieving effects for propylene/propane separation compared to ZIF‐8.
Specifically, the formation of hZIF‐8 can be explained by a proposed mechanism involving two sequential steps: 1) preparation of precursor solutions and 2) mixing of metal and linker solutions. For the first step, as zinc sources dissolve in THF, the lone pair electrons of THF can form coordination bonds with the zinc ions through a Lewis acid‐base reaction, followed by a continuous ring‐opening polymerization.[ 30 ] This consequently leads to the formation of polytetramethylene ether glycol (PTMEG) (i.e., polytetrahydrofuran), in which zinc ions are coordinated (Figure 2a). Subsequently, upon introducing the metal solution into a linker solution containing HmIm dissolved in water, PTMEG engages in competitive coordination with HmIm to the zinc ions (Figure 2a). The resulting tetrahedrally coordinated zinc ions with HmIm form nuclei of the ZIF‐8 phases, while the polymer phases can be simultaneously generated from Zn‐mIm nuclei incorporating PTMEG (Figure 2a).
Figure 2.

a) Scheme for the formation of hZIF‐8. b) XRD Patterns of ZIF‐8 and hZIF‐8. c) 2nd run DSC curves of ZIF‐8 and hZIF‐8. d) GPC curves of ZIF‐8 and hZIF‐8 in DMF eluent with a PMMA standard. e) Photographs of ZIF‐8 (e1) and hZIF‐8 (e2). f) SEM images of ZIF‐8 (f1) and hZIF‐8 (f2). g) STEM images of ZIF‐8 (g1) and hZIF‐8 (g2).
The heterogeneity of hZIF‐8, containing the two phases of ZIF‐8 and the polymer, was confirmed. The X‐ray diffraction (XRD) patterns presented in Figure 2b confirm that hZIF‐8 shares the same long‐range order (i.e., SOD topology) as its homogeneous counterpart. Nevertheless, hZIF‐8 reveals much lower diffraction intensities and broader peaks than ZIF‐8, indicating its lower crystallinity and smaller particle size. The particle size of hZIF‐8 was estimated at ≈17 nm using the Scherrer formula.[ 31 ] More importantly, the peaks are shifted to a higher angle, possibly indicating a slightly shrinked crystal structure (Figure 2b). On the other hand, hZIF‐8, in contrast to ZIF‐8, shows clear reversible enthalpic responses at ≈120 °C (Figure 2c) and the presence of a bulky polymer in hZIF (Figure 2d). The endothermic peak is expected to be responsible for the phase transition of the polymer. These observations support that hZIF‐8 consists of shrinked crystalline ZIF‐8 and a relatively amorphous and bulky polymer.
hZIF‐8 particles are quite different in size and shape compared to typical ZIF‐8 particles synthesized under analogous conditions without THF. When naturally dried, unlike ZIF‐8, it became transparent (Figure 2e). The optical transparency of the naturally dried hZIF‐8 sample indicates that the size of the particles is much smaller than the wavelength of the visible light. Figure 2f1 displays a scanning electron microscope (SEM) image of ZIF‐8 nanoparticles of ≈100–200 nm in size. Meanwhile, hZIF‐8 shows micron‐sized plates with a grainy surface owing to particle agglomeration (Figure 2f2). To prevent agglomeration, the as‐synthesized wet hZIF‐8 samples were freeze‐dried, presenting individual particles of ≈10–20 nm in size (Figures S1 and S2, Supporting Information), which is comparable to the size estimated based on XRD (≈17 nm).
Figure 2g presents the scanning transmission electron microscopy (STEM) images of the ZIF‐8 and hZIF‐8 particles. The ZIF‐8 particle exhibits a typical homogeneous contrast (i.e., homogeneous distribution of atomic nuclei and electron densities) (Figure 2g1). In stark contrast, the hZIF‐8 particles showed heterogeneous contrast throughout the particle, strongly suggesting the existence of different phases with heterogeneous atomic nuclei and electron densities in the hZIF‐8 particles (Figure 2g2). The bright spots in Figure 2g2 are likely due to the denser crystalline ZIF‐8 phase, which is estimated to be only a few nanometers (i.e., 2–3 nm), indicating that the ZIF‐8 phases of hZIF‐8 may consist of interconnected few unit cells of ZIF‐8. Therefore, it is surmised that the hZIF‐8 particle is composed of a few epitaxially interconnected nanosized ZIF‐8 phases and polymer phases. While STEM imaging reveals phase heterogeneity in hZIF‐8, and elemental mapping by TEM‐EDS. Figures S1and S2 (Supporting Information) supports the co‐localization of Zn, C, and O within the particles, the precise spatial distribution of the polymer phase remains unresolved due to limited resolution. To gain more detailed insight into the positioning of the polymer phase relative to the crystalline domains, computational approaches could provide complementary structural information beyond current experimental resolution.
2.2. Mechanism of Formation and Characterization of hZIF‐8
NMR studies were performed to identify the polymer phases in hZIF‐8, nuclear magnetic resonance (NMR) studies were performed. The solution proton 1H NMR spectrum of hZIF‐8, despite the very low intensity of peaks corresponding to THF not being indicated here, exhibits relatively strong methylene ether (c) and methylene (d) peaks, which well correspond to PTMEG (Figure 3a).[ 32 ] This was further confirmed by the solid‐state 13C NMR spectrum, which shows methylene (g) and methylene ether (f) peaks in hZIF‐8, as shown in Figure 3b. Interestingly, there is an up‐field shift of peak (f) for the methylene ether of hZIF‐8 compared to that of pure PTMEG (d), while the methylene peaks show the same peak positions at (e) and (g) for pure PTMEG and hZIF‐8, respectively (Figure 3b). It is likely due to the deshielding effects of the electron cloud of zinc ions coordinating with PTMEG in hZIF‐8.[ 33 ]
Figure 3.

a) 1H NMR and b) solid 13C NMR spectra of ZIF‐8 and hZIF‐8. c) Mass fragment of coordination between zinc and PTMEG obtained using TOF‐SIMS. d) TGA and DTG curves of ZIF‐8 (d1) and hZIF‐8 (d2). e) IR spectra of ZIF‐8 and hZIF‐8. f,g) XPS spectra of ZIF‐8 and hZIF‐8 in elements of Zn 2p (f) and O 1s (g).
As shown in Figure 2d, the number‐averaged molecular weight (M n) of PTMEG in hZIF‐8 was evaluated to be ≈136 kDa, with a polydispersity index (PDI) of ≈1.12. Considering the short reaction time (5 min), the molecular weight of PTMEG was unexpectedly high. The results of time‐of‐flight secondary‐ion mass spectrometry (TOF‐SIMS) revealed several different individual polymer repeating units with molecular weights ranging from 226 to 586 amu (Figure 3c). These values were much smaller than the overall molecular weight of PTMEG in hZIF‐8 (136 K). Therefore, it is inferred that PTMEG in hZIF‐8 is a coordination polymer composed of short PTMEG polymers bridged by zinc ions through coordination bonds.
The quantity of PTMEG present in hZIF‐8 was investigated using thermogravimetric analysis (TGA). Unlike ZIF‐8 (Figure 3d1), there was a sharp derivative thermogravimetric (DTG) peak at ≈11.15 wt.% weight loss in the temperature range of 250–300 °C. This is likely attributable to PTMEG (see the deconvoluted peak of the DTG curves in red in Figure 3d2). To selectively remove PTMEG from hZIF‐8, hZIF‐8 was heat‐treated at 300 °C in air, resulting in the heat‐treated hZIF‐8 denoted as hZIF‐8 (HT) opaque and brownish (Figures S3 and S4, Supporting Information). The 1H NMR spectra of hZIF‐8 (HT) revealed significantly reduced intensities of peaks originating from PTMEG, while the crystal structure of hZIF‐8 was mostly maintained, except for the appearance of small unknown peaks, indicating that the polymer phase was mostly decomposed and re‐crystallization partially occurred with slightly expanded lattices (Figures S5 and S6, Supporting Information). The selective thermal decomposition of almost all PTMEG in hZIF‐8 was also inferred from the disappearance of the endothermic phase transition peak at 120 °C shown at hZIF‐8 (Figure S7, Supporting Information).
To examine the modification of the Zn‐N coordination environments of hZIF‐8 in the presence of PTMEG, the deconvoluted peaks of the DTG curves derived from the TGA thermograms were investigated more thoroughly. Major degradations of both ZIF‐8 and hZIF‐8 occur at temperatures above 350 °C through two different degradation mechanisms: 1) the decomposition of mIm coordinated to ZIF‐8 (i.e., ZIF‐8 (mIm)) and 2) the formation of ZnO resulting from Zn‐N coordination bond breaking (i.e., ZIF‐8 (ZnO)) (Figure 3d).[ 34 , 35 ] The ZIF‐8 (mIm)/ZIF‐8 (ZnO) area ratio of the hZIF‐8 (≈0.35) was considerably lower than that of ZIF‐8 (≈0.66) (Table S1, Supporting Information), implying that hZIF‐8 contains fewer Zn‐N coordination bonds than ZIF‐8. This suggests that hZIF‐8 is more defective than ZIF‐8. Notably, micron‐sized ZIF‐8 (≈30 µm) synthesized using a different recipe[ 36 ] revealed a much greater ZIF‐8 (mIm)/ZIF‐8 (ZnO) ratio (≈0.95), suggesting that micron‐sized ZIF‐8 was much less defective than submicron‐sized ZIF‐8 (Figure S8, Supporting Information). Hence, it can be inferred that the coordination polymer PTMEG is likely to be present in hZIF‐8 through coordination within the framework.
The coordination of PTMEG in the hZIF‐8 framework was further explored using infrared (IR) and X‐ray photoelectron spectroscopy (XPS). While both ZIF‐8 and hZIF‐8 showed Zn─N bonds in the wavenumber range of 450–400 cm−1 in the IR spectra, a broad peak at 575–490 cm−1 corresponding to Zn─O bonds was only observed in hZIF‐8 (Figure 3e). In addition to this, the coordination of PTMEG with Zn ions is supported by observing that the Zn 2p XPS peaks of hZIF‐8 shift slightly to lower binding energy relative to that of ZIF‐8 (Figure 3f).[ 37 , 38 ] Consistent with this observation, Raman spectroscopy further revealed a blueshift in the Zn‐N stretching mode in hZIF‐8 compared to ZIF‐8, indicative of stronger Zn–ligand interactions (Figure S9, Supporting Information). The O 1s and C 1s XPS peaks of hZIF‐8 reveal the presence of Zn─O─C and C─O bonds, respectively, in their deconvoluted curves (Figure 3g; Figure S10, Supporting Information). Therefore, it is estimated that PTMEG formed from THF in the metal precursor solution is integrated into the framework of hZIF‐8 through coordination bonds between the oxygen of PTMEG and zinc ions.
To understand the hZIF‐8 formation mechanism suggested above, the synthesis principles were thoroughly investigated from the perspective of 1) polymerization in a metal precursor solution and 2) the effects of solubility with a linker precursor solution (Figure 4a). 1) The PTMEG resulting from the Lewis‐acid‐catalyzed zinc cationic ring‐opening of THF in a metal precursor solution, which is coded as Zn‐THF, shows a significantly high Mn of ≈1201 k (Figure 4b). The coordination between PTMEG derived from THF and zinc ions was further confirmed by the redshift of PTMEG observed in the UV–vis spectra (Figure 4c). The 1H NMR results indicated that Zn‐THF involved PTMEG with a relatively small amount of THF (Figure 4d). After evaporating THF from Zn‐THF at room temperature for 12 h, a brownish solid chunk was obtained, indicating that THF is a good solvent for the formed PTMEG (Figure S11, Supporting Information).
Figure 4.

a) Synthesis mechanism of hZIF‐8. b) GPC data of Zn‐THF. c) IR spectra of ZIF‐8 and hZIF‐8. d) 1H NMR data for zinc nitrate, Zn‐THF, PTMEG, and THF. e) Differences in Hoy's solubility parameters between PTMEG, water, and MeOH. The insets in e are photographs of the solubility tests of Zn‐THF in MeOH and water. f) XRD pattern of samples prepared in methanol (green) and water (red). g) TGA curves of the samples prepared in different solvents.
2) When proper amounts of methanol (MeOH) and water were added to the metal solution (i.e., Zn‐THF), the Zn‐THF with MeOH remained transparent, while the solution with water became cloudy (see the inset of Figure 4e). Based on Hoy solubility parameters, the differences in values between PTMEG with the molecular weight determined by TOF‐SIMS and MeOH and water are 10.4 and 31.2 MJ1/2 m−3/2, respectively, exhibiting that the solubility of PTMEG in MeOH is higher than in water (Figure 4e; Table S2, Supporting Information).[ 39 ] When the syntheses were performed using a linker solution containing MeOH and water, typical ZIF‐8 was synthesized in MeOH, while hZIF‐8 was formed in water (Figure 4f). This is further supported by the fact that the sample prepared with MeOH showed no thermal decomposition corresponding to PTMEG and was optically opaque (Figure 4g; Figure S12, Supporting Information). This contrasting effect of solvents is possibly due to the solubility of the solvents in the linker solution. In other words, water, which is a poor solvent for PTMEG, likely enables zinc‐coordinated PTMEG species to engage in the reaction with mIm by their preferential association with species other than water (similar to liquid‐liquid phase separation), resulting in the formation of hZIF‐8 and vice versa (for MeOH) (Figure 4a).
The effects of THF concentration and synthesis time were further investigated and are presented in the Supporting Information (Figures S13–S16, Supporting Information). These observations indicate that the relative ratio between the ZIF‐8 crystalline domains and the polymer regions in hZIF‐8 is strongly dependent on the THF concentration during synthesis. While this study primarily aimed to demonstrate the feasibility of polymer coordination for linker confinement, future studies focused on optimizing this ratio may provide a better understanding of the coordination‐driven assembly process and enable more precise control over the resulting hybrid structures.
2.3. Gas Separation Properties of Restricted Structure of hZIF‐8
However, hZIF‐8 possesses more rigid linker motions, effectively constraining gate opening and exhibiting relatively smaller window sizes in its open pore structures. Because the suppressed gate opening of hZIF‐8 is recovered by selectively removing PTMEG, this strongly indicates that the linker swing motion is significantly restricted, primarily by the presence of the polymer phase in hZIF‐8.
Figure 5b presents the N2 sorption isotherms of hZIF‐8, which exhibit a type I isotherm similar to that of ZIF‐8, indicating its microporosity. The Brunauer–Emmett–Teller (BET) surface area and total pore volume of hZIF‐8 (≈863 ± 38 m2 g−1 and ≈0.38 ± 0.01 cm3 g−1, respectively) are lower than those of ZIF‐8 (≈1475 ± 65 m2 g−1 and ≈0.68 ± 0.01 cm3 g−1). The lower surface area and pore volume of hZIF‐8 are ascribed to the polymer phase as well as its shrinked crystal structure. This is corroborated by the fact that there was partial recovery in its microporosity when PTMEG was selectively removed (see hZIF‐8 (HT) aforementioned), (i.e., BET surface area of ≈1043 ± 30 m2 g−1 and total pore volume of ≈0.52 ± 0.01 cm3 g−1) (Figure 5b).
Figure 5.

a) Schematic illustration of the pore gate opening phenomena of ZIF‐8, hZIF‐8, and hZIF‐8 (HT). b,c) N2 adsorption (closed)/desorption (open) isotherms of ZIF‐8, hZIF‐8, and hZIF‐8 (HT) at 77 K on a linear scale (b) and semi‐log scale (c). d,e) Isothermal (d) and kinetic (e) uptakes of C3H6 (closed) and C3H8 (open) at 298 K for ZIF‐8, hZIF‐8, and hZIF‐8 (HT).
ZIF‐8 exhibits two gate‐opening steps at relative pressures (P/P0) of ≈0.004 and ≈0.02, consistent with previous reports (Figure 5c).[ 40 ] In contrast, hZIF‐8 displays a single gate‐opening step at a relative pressure of ≈0.04 (Figure 5c). It is worth noting that the gate opening of hZIF‐8 is not only significantly suppressed, but also shifted to a higher relative pressure compared to that of ZIF‐8. More importantly, when PTMEG is removed, hZIF‐8 (HT) exhibits gate‐opening behavior similar to that of ZIF‐8 (Figure 5c).
The molecular sieving property of hZIF‐8 for C3H6/C3H8 was investigated through equilibrium and kinetic adsorption experiments and compared to that of ZIF‐8. While ZIF‐8 shows negligible differences between C3H6 and C3H8, hZIF‐8 exhibits considerably enhanced C3H6 selectivity in both equilibrium and kinetic adsorption (Figure 5d,e). Since the isosteric heats of adsorption of C3H6 and C3H8 on hZIF‐8 are not significantly different (Figure S17 and Table S3, Supporting Information), the improvement in its equilibrium adsorption selectivity is likely attributed to its shrinked crystal structure rather than chemical interactions. This is supported by the fact that after removing PTMEG, hZIF‐8 (HT) still exhibited enhanced equilibrium adsorption selectivity compared to ZIF‐8, although its C3H6 and C3H8 uptake capacities were partially recovered (Figure 5e). In contrast, hZIF‐8 (HT) exhibited kinetic adsorption curves comparable to those of ZIF‐8 (Figure 5a), strongly suggesting that the high kinetic adsorption selectivity of hZIF‐8 is mainly due to the presence of PTMEG. It is suggested that PTMEG coordinated with zinc centers hinders the linker swing motion, thereby reducing the effective aperture size of hZIF‐8 and consequently enhancing its kinetic adsorption selectivity.
It is noteworthy that this polymer coordination strategy differs from previously reported space‐confinement effects. Prior approaches typically relied on matrix‐level rigidity or external structural constraints, whereas the current strategy achieves molecular‐level confinement by directly restricting linker mobility through internal coordination within the framework. Although the experimental results provide strong evidence for the suppression of linker motion in hZIF‐8, a more detailed molecular‐level understanding remains necessary. Techniques such as 2H NMR combined with molecular dynamics (MD) simulations are expected to provide quantitative insights into linker behavior, including rotational mobility and correlation times, and to clarify how polymer coordination alters the local energy landscape and dynamic flexibility of the framework.[ 6 , 11 ]
To evaluate the separation performance of hZIF‐8 for C3H6/C3H8 in a membrane setting, we prepared mixed‐matrix membranes (MMMs) incorporating hZIF‐8 into 6FDA‐DAM polyimides (PI) as continuous matrices (hereafter referred to as PI/hZIF‐8 MMMs). These MMMs were prepared using a blending method, which involves: 1) blending a polymer solution with an hZIF‐8 suspension, 2) solvent‐casting a composite dope solution, and 3) solvent evaporation‐induced phase inversion (Figure 6a). PI/hZIF‐8 MMMs were compared to neat PI membranes and MMMs containing ZIF‐8 (hereafter, PI/ZIF‐8 MMMs). The XRD patterns of the MMMs showed the presence of fillers that maintained their crystal structures within the polymers (Figure S18, Supporting Information). As can be seen in the photographs in Figure 6b–d, while the PI/ZIF‐8 MMMs appear translucent, both the PI and PI/hZIF‐8 membranes are optically transparent. The optical transparency of the PI/hZIF‐8 MMMs is ascribed to the fact that hZIF‐8 nanofillers of ≈10–20 nm in size (Figure 2g2), which are well below the wavelength of visible light, are homogeneously distributed without significant agglomeration (Figure 6e–g). Interestingly, PI/hZIF‐8 MMMs are as flexible as PI membranes, even at a filler loading of ≈30 wt.% (see the inset in Figure 6d). In contrast, PI/ZIF‐8 MMMs were relatively rigid and brittle at similar filler loadings. The high flexibility of the PI/hZIF‐8 MMMs is likely due to the enhanced dispersion of nano‐sized hZIF‐8 fillers within the polymer and the favorable interaction between the hZIF‐8 fillers and the polymer (Figure 6e–g), thereby enabling an increase in the hZIF‐8 loading up to ≈40 wt.% (Figure S19, Supporting Information).
Figure 6.
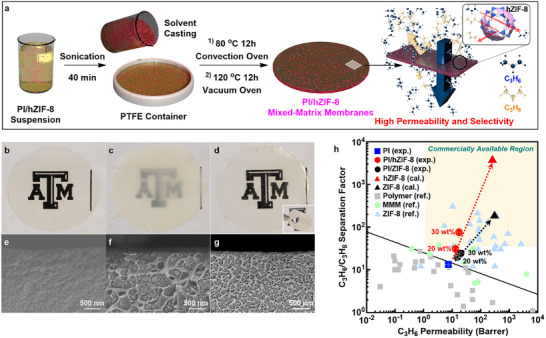
a) Scheme of preparation of 6FDA‐DAM (PI)/hZIF‐8 mixed‐matrix membranes (MMMs). b–d) Photographs of PI (b), PI/ZIF‐8 (c), and PI/hZIF‐8 (d) membranes. The inset in (c) shows the folded PI/hZIF‐8 membrane. e–g) Cross‐sectional SEM images of the PI (e), PI/ZIF‐8 (f), and PI/hZIF‐8 (g) membranes. The images were taken using MMMs with the filler loadings of ≈30 wt.%. h) C3H6/C3H8 separation performances of PI, PI/ZIF‐8, and PI/hZIF‐8 membranes in comparison with those reported in literatures.[ 7 , 12 , 41 , 42 , 43 , 44 , 45 , 46 , 47 , 48 , 49 , 50 , 51 , 52 , 53 , 54 , 55 , 56 , 57 , 58 , 59 , 60 , 61 , 62 , 63 , 64 , 65 , 66 , 67 , 68 , 69 , 70 , 71 , 72 , 73 , 74 , 75 ] The marked area in (h) is the membrane performance criteria for commercially attractive C3H6/C3H8 separation.
The separation performances of the PI/hZIF‐8 MMMs for binary C3H6/C3H8 gas mixtures were measured at ≈1 atm and room temperature. As presented in Figure 6h and Table S3 (Supporting Information), PI/hZIF‐8 MMMs exhibit enhancements in both C3H6 permeability and C3H6/C3H8 separation factor as the filler loading increases up to ≈30 wt.%. More interestingly, at ≈30 wt.% loading, the PI/ZIF‐8 MMMs show a significantly higher C3H6/C3H8 separation factor (≈75.5) compared to those of the PI/ZIF‐8 MMMs (≈24.5), despite having a comparable C3H6 permeability (≈17.4 vs ≈20.1 Barrer). In fact, PI/hZIF‐8 MMMs at ≈30 wt.% loading far outperform the majority of previously reported MMMs, and are even comparable to high‐performance polycrystalline ZIF‐8 membranes (Figure 6h).[ 7 , 12 , 41 , 42 , 43 , 44 , 45 , 46 , 47 , 48 , 49 , 50 , 51 , 52 , 53 , 54 , 55 , 56 , 57 , 58 , 59 , 60 , 61 , 62 , 63 , 64 , 65 , 66 , 67 , 68 , 69 , 70 , 71 , 72 , 73 , 74 , 75 ] When the loading is further increased to ≈40 wt.%, PI/hZIF‐8 MMMs show an unprecedentedly high C3H6/C3H8 separation factor of ≈180, which surpasses the reported intrinsic C3H6/C3H8 selectivity of ZIF‐8 (≈130) (Table S3, Supporting Information).[ 3 ] PI/hZIF‐8 MMMs (≈40 wt.%), however, exhibit reduced C3H6 permeability possibly due to the rigidification of polymer chains at interfaces between a polymer and filler nanoparticles.[ 76 ]
The intrinsic C3H6/C3H8 separation performance of hZIF‐8 was estimated using the Maxell model based on the effective medium theory.[ 41 ] It is noted that the model fitting was conducted with PI membranes and MMMs containing ≈20 wt.% filler because the Maxwell model is most effective for relatively low filler loadings.[ 4 ] Despite slight deviations, particularly at high loadings, which are likely attributed to the relatively strong interaction with the hZIF‐8 filler nanoparticles, the model predictions reasonably approximated the behavior of the samples loaded at ≈30 wt.%, as they closely aligned with the prediction lines (Figure 6h). The estimated C3H6/C3H8 separation factor for hZIF‐8 is ≈3700, which is an order of magnitude higher than that of ZIF‐8. Furthermore, the estimated C3H6 permeability is ≈260 Barrer, similar to that of ZIF‐8 (Figure 6h; Table S3, Supporting Information). These results suggest the potential for achieving unprecedented C3H6/C3H8 separation performance using hZIF‐8.
Finally, in an effort to directly determine the C3H6/C3H8 separation performance of hZIF‐8, several attempts were made to prepare pure hZIF‐8 membranes supported on porous anodized alumina disks using dip coating and drying techniques. Despite the dense coating layer on the support, there are micro‐defects that enable gas molecules to bypass the membranes (Figure S20, Supporting Information). Efforts to prepare defect‐free hZIF‐8 membranes are currently in progress, and will be reported in the future.
3. Conclusion
We introduce a novel molecular sieve material with exceptional C3H6/C3H8 selectivity, composed of nanosized ZIF‐8 phases and polymer phases, termed heterogeneous ZIF‐8 (hZIF‐8). hZIF‐8, the first of its kind, is synthesized through the competitive coordination of polytetramethylene ether glycol (PTMEG), which is formed in situ from tetrahydrofuran (THF) via a Lewis‐acid‐catalyzed cationic ring‐opening reaction and consecutive polymerization during hZIF‐8 synthesis. This results in the coexistence of shrinked ZIF‐8 nanocrystalline phases and a bulky polymer phase, formed through coordination bonds between the zinc ions and PTMEG. The N2 adsorption isotherm revealed that the linker swing motion in hZIF‐8 was noticeably suppressed compared with that in ZIF‐8, indicating a smaller effective aperture in hZIF‐8. Both thermodynamic and kinetic adsorption studies demonstrate that hZIF‐8 not only exhibits higher C3H6/C3H8 solubility selectivity, but also greater diffusivity selectivity than ZIF‐8. hZIF‐8‐containing mixed‐matrix membranes showed exceptionally high C3H6/C3H8 separation performances, comparable to those of polycrystalline ZIF‐8 membranes. Compared to ZIF‐8‐based MMMs, hZIF‐8‐based MMMs exhibited a 468% increase in C3H6/C3H8 selectivity at 30 wt.% loadings (13.3 for ZIF‐8 MMMs and 75.5 for hZIF‐8 MMMs). The extrapolated intrinsic selectivity of hZIF‐8 (≈3700) is one order of magnitude higher than that of ZIF‐8 (≈180), underscoring the potential of hZIF‐8 as a high‐performance molecular sieve. The unprecedentedly high C3H6/C3H8 separation factor of hZIF‐8 is attributed to the presence of a bulky polymer phase, which restricts the linker swing motion of the nano‐sized ZIF‐8 phase.
4. Experimental Section
Materials
Zinc nitrate hexahydrate (Zn(NO3)∙ 6H2O, 98%) and 2‐methylimidazole (HmIm, 99%), Tetrahydrofuran (THF, 99%), and methanol (MeOH, 99%) were purchased from Duksan Chemical. Polytetramethylene ether glycol (PTMEG, Mn ≈1000 g mol−1) and N‐methyl‐2‐pyrrolidone (NMP, 99%) were purchased from Sigma–Aldrich. 6FDA‐DAM (4,4′‐(hexafluoroisopropylidene) diphthalic anhydride‐2,4,6‐trimethyl‐1,3‐diaminobenzene, Mw: 148k, PDI: 2.14) was provided from Akron Polymer Systems Inc. THF was conducted through distillation and freeze‐and‐thaw under reduced pressure in an argon atmosphere before use. Other chemicals were used as received without further purification.
Synthesis of ZIF‐8 and Heterogeneous ZIF‐8 Particles
ZIF samples were synthesized under an aqueous condition. For hZIF‐8, a metal solution was prepared by dissolving 0.12 g of Zn(NO3) · 6H2O in 0.5 g THF. Separately, a ligand solution was prepared by dissolving 1.64 g of HmIm in 10 mL DI water. The metal solution was then added to the ligand solution. The molar ratio of the mixture was ZnN: THF: HmIm: H2O = 1: 17: 50: 1377. The reaction was conducted at room temperature for 5 min. After that, the solution was centrifuged at 8000 rpm for 15 min and decanted. The decanted sample was suspended in 15 mL MeOH under vigorous shaking at room temperature. The suspension was centrifuged at 8000 rpm for 15 min to collect precipitates. The precipitates were dried at 60 °C overnight in a convection oven. The dried sample was weighted at ≈16 mg.
For typical ZIF‐8, a metal solution was prepared by dissolving 0.12 g of Zn(NO3)∙ 6H2O in 0.5 g DI water instead of THF. The metal solution was mixed with the ligand solution (1.64 g of HmIm dissolved in 10 mL DI water). The molar ratio of the mixture was ZnN: HmIm: H2O = 1:50:1394. The mixture solution was gently shaken for 5 min at room temperature. The sample was washed and dried in the same manner as the hZIF‐8.
Heterogeneous ZIF‐8/6FDA‐DAM Mixed‐Matrix Membranes
For hZIF‐8‐containing MMMs, an allotted amount of wet gelatinous hZIF‐8 was dispersed in 3 mL NMP using a bath sonicator for 30 min. It is noted that hZIF‐8 particles were hardly re‐dispersed in solvents when dried. A proper amount of 6FDA‐DAM was added to the hZIF‐8 suspension and dissolved under ultrasound for 40 min. After completely dissolving the polymer, the solution was poured onto either a flat glass or a polytetrafluoroethylene container and placed in a convection oven at 80 °C for 12 h. The resulting film was further dried at 120 °C under vacuum for 12 h to remove residual solvents. For comparison, ZIF‐8‐containing MMMs were prepared in the same way. The thickness of the films was ≈85 µm except for the hZIF‐8‐containing MMMs of ≈40 wt.% loading (i.e., ≈130 µm). For reference, a 6FDA‐DAM polymer membrane was also prepared in the same manner without particles.
Characterization
X‐ray diffraction (XRD) patterns were collected in a transmission sample geometry for film samples using D8 Venture (Bruker) and in Bragg‐Brentano reflection geometry for powder samples using D8 Endeavor (Bruker) at a 2 θ spanned from 5° to 30° with Cu‐Kα radiation (λ = 1.5406 Å). Differential scanning calorimetry (DSC, Diamond DSC, Perkin Elmer) was performed at the temperature range of −80 to 150 °C at a ramping rate of 10 °C min−1 under the nitrogen flow of 30 cm3 min−1. A field‐emission scanning electron microscope (FE‐SEM, JEOL JSM‐7500F) was used at a working distance of 15 mm and acceleration voltage of 5 keV. For cross‐sectional SEM imaging, membrane samples were fractured in liquid nitrogen using a freeze‐fracturing method to ensure clean and comparable fracture surfaces. Scanning transmission electron microscopy (STEM) analysis was performed using JEM‐F200 (JEOL Ltd., Japan) at 200 keV. For STEM measurements, wet hZIF‐8 precipitates were first suspended in ethanol (0.5 wt.%), and a drop of the suspension was applied on an ultra‐thin carbon TEM grid. Afterward, the sample was freeze‐dried at −55 °C for 24 h using a vacuum freeze dryer (OPERON, FDB‐5502). The dried TEM sample was sealed with parafilm to prevent carbon contamination. Thermogravimetric analysis (TGA, Q50 TA instruments) was conducted in the temperature range of 25–800 °C at the ramping rate of 10 °C min−1 under the airflow of 50 cm3 min−1. Solution proton and carbon nuclear magnetic resonance (1H NMR and 13C NMR) and solid NMR spectra were taken using JEOL JNM ECZ‐400 (400 MHz system). Preparations for solution 1H NMR were conducted by dissolving ZIF samples in 0.5 mL of CD3COOD, PTMEG, and THF by dissolving in 0.5 mL CD3OD and Zn‐THF by dissolving in 0.4 mL CD3OD and 0.1 mL CD3COOD. Solution 13C NMR samples were prepared by dissolving in 0.5 ml CDCl3. Samples for solid 13C NMR spectra were prepared by grinding 0.5 g of samples in a solid state. Gel permeation chromatography (GPC) was performed with a flow rate of 1 ml min−1 at 40 °C and DMF (HPLC grade) was used as eluent. The GPC system compromises a Shimadzu Nexera series. X‐ray Photoelectron Spectrometer (XPS) spectra were acquired using a KRATOS AXIS SUPRA with a 15 kV Al/Ka source for the surface composition analysis. Time‐of‐flight secondary ion mass spectrometry (TOF‐SIMS) data was acquired using ION TOF TOF‐SIMS 5 with a bismuth liquid metal ion gun (Bi+). Ultraviolet–visible spectroscopy (UV–vis) spectra were acquired using a SINCO Mega‐2100 with an absorption spectrometer at 25 °C. Preparation for all samples was conducted by dissolving in 0.1 wt.% MeOH solution. N2 adsorption isotherms at 77 K and C3H6/C3H8 adsorption isotherms at 25 °C were measured using an ASAP 2020 plus (Micromeritics). Prior to all measurements, powder samples were degassed under vacuum at 100 °C overnight. N2 isotherms were collected over a relative pressure range of 10−5 to 0.99, while C3H6 and C3H8 isotherms were measured at absolute pressures ranging from 0.5 to 760 mmHg. Kinetic uptake measurements for C3H6 and C3H8 were obtained at 25 °C and 0.5 mmHg using the ROA (Rate of Adsorption) software, based on the pressure decay recorded over time after gas dosing. The initial uptake rate was extracted from the first point of the isotherm.
Gas Permeation Measurements
Equimolar C3H6/C3H8 binary gas permeation properties of mixed‐matrix membranes were performed using the Wicke‐Kallenbach technique at room temperature and atmospheric pressure. The binary feed mixture and the argon sweeping gas flowed at the same flow rate of 100 cm3 min−1 on the feed and the permeate side, respectively. For the hZIF‐8‐containing MMMs, the feed and sweeping gas flowed at 10 cm3 min−1 due to their low gas permeance. The compositions of the permeate were analyzed using gas chromatography (GC 7890A, Agilent) equipped with a flame‐ionized detector (FID) and a HP‐plot Q column.
Conflict of Interest
The authors declare no conflict of interest.
Supporting information
Supporting Information
Acknowledgements
S.P. and H.J.J. contributed equally to this work. Dr. H. K. J. gratefully acknowledges the financial support from the National Science Foundation (CBET‐1929596). This publication was made possible in part by NPRP grant # 12S‐0209‐190064 from the Qatar National Research Fund (a member of the Qatar Foundation). The findings achieved herein are solely the responsibility of the authors. The National Science Foundation supported the FE‐SEM acquisition under Grant DBI‐0116835, the VP for Research Office, and the Texas A&M Engineering Experimental Station. Dr. K. Y. C. acknowledges financial support through the National Research Foundation of Korea (NRF) grant funded by the Korea government (MSIT) (No. NRF‐2022R1C1C1003313). Dr. S.P. acknowledges partial financial support from the Ministry of Trade, Industry and Energy (MOTIE) (No. RS‐2023‐00266205).
Park S., Jung H. J., Kim S. H., et al. “Polymer‐Coordinated Heterogeneous Zeolitic Imidazolate Framework‐8 with Exceptional Propylene/Propane Molecular Sieving Effect.” Small 21, no. 37 (2025): 21, e05746. 10.1002/smll.202505746
Contributor Information
Kie Yong Cho, Email: kieyongh@pknu.ac.kr.
Hae‐Kwon Jeong, Email: hjeong7@tamu.edu.
Data Availability Statement
The data that support the findings of this study are available from the corresponding author upon reasonable request.
References
- 1. Park K. S., Ni Z., Côté A. P., Choi J. Y., Huang R., Uribe‐Romo F. J., Chae H. K., O'Keeffe M., Yaghi O. M., Proc. Natl. Acad. Sci. USA 2006, 103, 10186. [DOI] [PMC free article] [PubMed] [Google Scholar]
- 2. Chen B., Yang Z., Zhu Y., Xia Y., J. Mater. Chem. A 2014, 2, 16811. [Google Scholar]
- 3. Zhang C., Lively R. P., Zhang K., Johnson J. R., Karvan O., Koros W. J., J. Phys. Chem. Lett. 2012, 3, 2130. [DOI] [PubMed] [Google Scholar]
- 4. Abdul Hamid M. R., Shean Yaw T. C., Mohd Tohir M. Z., Wan Abdul Karim Ghani W. A., Sutrisna P. D., Jeong H.‐K., J. Ind. Eng. Chem. 2021, 98, 17. [Google Scholar]
- 5. Lee D. T., Corkery P., Park S., Jeong H. K., Tsapatsis M., Annu. Rev. Chem. Biomol. Eng. 2022, 13, 529. [DOI] [PubMed] [Google Scholar]
- 6. Kolokolov D. I., Diestel L., Caro J., Freude D., Stepanov A. G., J. Phys. Chem. C 2014, 118, 12873. [Google Scholar]
- 7. Kwon H. T., Jeong H. K., Lee A. S., An H. S., Lee J. S., J. Am. Chem. Soc. 2015, 137, 12304. [DOI] [PubMed] [Google Scholar]
- 8. Hillman F., Zimmerman J. M., Paek S. M., Hamid M. R. A., Lim W. T., Jeong H. K., J. Mater. Chem. A 2017, 5, 6090. [Google Scholar]
- 9. Kim Y., Kim T., Kim J., Lee N., Yoo S. H., Kwon H. T., Eum K., J. Membr. Sci. 2025, 723, 123963. [Google Scholar]
- 10. Babu D. J., He G. W., Hao J., Vandat M. T., Schouwink P. A., Mensi M., Agrawal K. V., Adv. Mater. 2019, 31, 1900855. [DOI] [PubMed] [Google Scholar]
- 11. Knebel A., Geppert B., Volgmann K., Kolokolov D. I., Stepanov A. G., Twiefel J., Heitjans P., Volkmer D., Caro J., Science 2017, 358, 347. [DOI] [PubMed] [Google Scholar]
- 12. Zhou S., Wei Y. Y., Li L. B., Duan Y. F., Hou Q. Q., Zhang L. L., Ding L. X., Xue J., Wang H. H., Caro J., Sci. Adv. 2018, 4, aau139. [DOI] [PMC free article] [PubMed] [Google Scholar]
- 13. Zhang Z., Zhu H., Jin H., Cao Y., Fang W., Zhang Z., Ma Q., Choi J., Li Y., Angew. Chem., Int. Ed. 2025, 64, 202415023. [DOI] [PubMed] [Google Scholar]
- 14. Hayashi M., Lee D. N. T., de Mello M. D., Boscoboinik J. A., Tsapatsis M., Angew. Chem., Int. Ed. 2021, 60, 9316. [DOI] [PubMed] [Google Scholar]
- 15. Diestel L., Wang N. Y., Schwiedland B., Steinbach F., Giese U., Caro J., J. Membr. Sci. 2015, 492, 181. [Google Scholar]
- 16. Xiang L., Liu D. H., Jin H., Xu L. W., Wang C. Q., Xu S. T., Pan Y. C., Li Y. S., Mater. Horiz. 2020, 7, 223. [Google Scholar]
- 17. Yang S., Wang Y. H., Lu P., Jin H., Pan F. S., Shi Z. X., Jiang X. S., Chen C., Jiang Z. Y., Li Y. S., ACS Appl. Mater. Interfaces 2020, 12, 55308. [DOI] [PubMed] [Google Scholar]
- 18. Hua Y., Mohamed A. M. O., Choi G. M., Cho K. Y., Economou I. G., Jeong H.‐K., ACS Appl. Mater. Interfaces 2024, 16, 15273. [DOI] [PMC free article] [PubMed] [Google Scholar]
- 19. Friebe S., Geppert B., Steinbach F., Caro J., ACS Appl. Mater. Interfaces 2017, 9, 12878. [DOI] [PubMed] [Google Scholar]
- 20. Sheng L., Wang C., Yang F., Xiang L., Huang X., Yu J., Zhang L., Pan Y., Li Y., Chem. Commun. 2017, 53, 7760. [DOI] [PubMed] [Google Scholar]
- 21. Hua J. X., Li C., Tao H. X., Wang L., Song E. Y., Lian H. Q., Wang C. Q., Jiang J. L., Pan Y. C., Xing W. H., J. Membr. Sci. 2021, 636, 119613. [Google Scholar]
- 22. Gu Y., Hua J., Chen J., Zhu W., Hou R., Wang C., Pan Y., J. Membr. Sci. 2023, 668, 121193. [Google Scholar]
- 23. Kalaj M., Bentz K. C., Ayala S., Palomba J. M., Barcus K. S., Katayama Y., Cohen S. M., Chem. Rev. 2020, 120, 8267. [DOI] [PubMed] [Google Scholar]
- 24. Zhang Z., Nguyen H. T. H., Miller S. A., Cohen S. M., Angew. Chem., Int. Ed. 2015, 54, 6152. [DOI] [PubMed] [Google Scholar]
- 25. Katayama Y., Kalaj M., Barcus K. S., Cohen S. M., J. Am. Chem. Soc. 2019, 141, 20000. [DOI] [PubMed] [Google Scholar]
- 26. Park S., Cho K. Y., Jeong H.‐K., J. Mater. Chem. A 2022, 10, 1940. [Google Scholar]
- 27. He S., Wang H., Zhang C., Zhang S., Yu Y., Lee Y., Li T., Chem. Sci. 2019, 10, 1816. [DOI] [PMC free article] [PubMed] [Google Scholar]
- 28. Xiang F., Popczun E. J., Hopkinson D. P., Nanotechnology 2019, 30, 345602. [DOI] [PubMed] [Google Scholar]
- 29. Molavi H., Mirzaei K., Barjasteh M., Rahnamaee S. Y., Saeedi S., Hassanpouryouzband A., Rezakazemi M., Nano‐Micro Lett. 2024, 16, 272. [DOI] [PMC free article] [PubMed] [Google Scholar]
- 30. Aouissi A., Al‐Deyab S. S., Al‐Shahri H., Molecules 2010, 15, 1398. [DOI] [PMC free article] [PubMed] [Google Scholar]
- 31. Patterson A. L., Phys. Rev. 1939, 56, 978. [Google Scholar]
- 32. Kim G., Won H., J. Korean Magn. Reson. Soc. 2016, 20, 7. [Google Scholar]
- 33. Mullane K. C., Hrobárik P., Cheisson T., Manor B. C., Carroll P. J., Schelter E. J., Inorg. Chem. 2019, 58, 4152. [DOI] [PubMed] [Google Scholar]
- 34. Xu B., Mei Y., Xiao Z., Kang Z., Wang R., Sun D., Phys. Chem. Chem. Phys. 2017, 19, 27178. [DOI] [PubMed] [Google Scholar]
- 35. Yin H., Kim H., Choi J., Yip A. C. K., Chem. Eng. J. 2015, 278, 293. [Google Scholar]
- 36. Cravillon J., Schröder C. A., Bux H., Rothkirch A., Caro J., Wiebcke M., CrystEngComm 2012, 14, 492. [Google Scholar]
- 37. Tian F., Cerro A. M., Mosier A. M., Wayment‐Steele H. K., Shine R. S., Park A., Webster E. R., Johnson L. E., Johal M. S., Benz L., J. Phys. Chem. C 2014, 118, 14449. [Google Scholar]
- 38. Chen H., Wang L., Yang J., Yang R. T., J. Phys. Chem. C 2013, 117, 7565. [Google Scholar]
- 39. Hoy K. L., J. Paint Technol. 1970, 42, 541. [Google Scholar]
- 40. Fairen‐Jimenez D., Moggach S. A., Wharmby M. T., Wright P. A., Parsons S., Düren T., J. Am. Chem. Soc. 2011, 133, 8900. [DOI] [PubMed] [Google Scholar]
- 41. Zhang C., Dai Y., Johnson J. R., Karvan O., Koros W. J., J. Membr. Sci. 2012, 389, 34. [Google Scholar]
- 42. Burns R. L., Koros W. J., J. Membr. Sci. 2003, 211, 299. [Google Scholar]
- 43. Shen Q., Cong S., He R., Wang Z., Jin Y., Li H., Cao X., Wang J., Van der Bruggen B., Zhang Y., J. Membr. Sci. 2019, 588, 117201. [Google Scholar]
- 44. Yu J., Wang C., Xiang L., Xu Y., Pan Y., Chem. Eng. Sci. 2018, 179, 1. [Google Scholar]
- 45. Askari M., Chung T.‐S., J. Membr. Sci. 2013, 444, 173. [Google Scholar]
- 46. Jung J. P., Kim M. J., Bae Y.‐S., Kim J. H., J. Appl. Polym. Sci. 2018, 135, 46545. [Google Scholar]
- 47. Sun H., Ma C., Wang T., Xu Y., Yuan B., Li P., Kong Y., Chem. Eng. Technol. 2014, 37, 611. [Google Scholar]
- 48. Park S., Jeong H.‐K., J. Membr. Sci. 2020, 612, 118429. [Google Scholar]
- 49. Park S., Jeong H.‐K., J. Membr. Sci. 2020, 596, 117689. [Google Scholar]
- 50. Park S., Abdul Hamid M. R., Jeong H.‐K., Acs Appl. Mater. Interfaces 2019, 11, 25949. [DOI] [PubMed] [Google Scholar]
- 51. Hara N., Yoshimune M., Negishi H., Haraya K., Hara S., Yamaguchi T., J. Chem. Eng. Jpn. 2014, 47, 770. [Google Scholar]
- 52. Hara N., Yoshimune M., Negishi H., Haraya K., Hara S., Yamaguchi T., J. Membr. Sci. 2014, 450, 215. [Google Scholar]
- 53. Pan Y., Li T., Lestari G., Lai Z., J. Membr. Sci. 2012, 390–391, 93. [Google Scholar]
- 54. Kwon H. T., Jeong H.‐K., Chem. Commun. 2013, 49, 3854. [DOI] [PubMed] [Google Scholar]
- 55. Kwon H. T., Jeong H.‐K., J. Am. Chem. Soc. 2013, 135, 10763. [DOI] [PubMed] [Google Scholar]
- 56. Shah M. N., Gonzalez M. A., McCarthy M. C., Jeong H.‐K., Langmuir 2013, 29, 7896. [DOI] [PubMed] [Google Scholar]
- 57. Kwon H. T., Jeong H.‐K., Chem. Eng. Sci. 2015, 124, 20. [Google Scholar]
- 58. Liu D., Ma X., Xi H., Lin Y. S., J. Membr. Sci. 2014, 451, 85. [Google Scholar]
- 59. Shekhah O., Swaidan R., Belmabkhout Y., du Plessis M., Jacobs T., Barbour L. J., Pinnau I., Eddaoudi M., Chem. Commun. 2014, 50, 2089. [DOI] [PubMed] [Google Scholar]
- 60. Pan Y., Liu W., Zhao Y., Wang C., Lai Z., J. Membr. Sci. 2015, 493, 88. [Google Scholar]
- 61. Sun J., Yu C., Jeong H.‐K., Crystals 2018, 8, 373. [Google Scholar]
- 62. Yu J., Pan Y., Wang C., Lai Z., Chem. Eng. Sci. 2016, 141, 119. [Google Scholar]
- 63. Tran N. T., Kim J., Othman M. R., Microporous Mesoporous Mater. 2019, 285, 178. [Google Scholar]
- 64. Wei R., Chi H.‐Y., Li X., Lu D., Wan Y., Yang C.‐W., Lai Z., Adv. Funct. Mater. 2020, 30, 1907089. [Google Scholar]
- 65. He G., Dakhchoune M., Zhao J., Huang S., Agrawal K. V., Adv. Funct. Mater. 2018, 28, 1707427. [Google Scholar]
- 66. James J. B., Wang J., Meng L., Lin Y. S., Ind. Eng. Chem. Res. 2017, 56, 7567. [Google Scholar]
- 67. Tanaka S., Okubo K., Kida K., Sugita M., Takewaki T., J. Membr. Sci. 2017, 544, 306. [Google Scholar]
- 68. Barankova E., Tan X., Villalobos L. F., Litwiller E., Peinemann K.‐V., Angew. Chem., Int. Ed. 2017, 56, 2965. [DOI] [PubMed] [Google Scholar]
- 69. Shamsaei E., Lin X., Low Z.‐X., Abbasi Z., Hu Y., Liu J. Z., Wang H., ACS Appl. Mater. Interfaces 2016, 8, 6236. [DOI] [PubMed] [Google Scholar]
- 70. Brown A. J., Brunelli N. A., Eum K., Rashidi F., Johnson J. R., Koros W. J., Jones C. W., Nair S., Science 2014, 345, 72. [DOI] [PubMed] [Google Scholar]
- 71. Eum K., Ma C., Rownaghi A., Jones C. W., Nair S., ACS Appl. Mater. Interfaces 2016, 8, 25337. [DOI] [PubMed] [Google Scholar]
- 72. Lee M. J., Abdul Hamid M. R., Lee J., Kim J. S., Lee Y. M., Jeong H.‐K., J. Membr. Sci. 2018, 559, 28. [Google Scholar]
- 73. Lee M. J., Kwon H. T., Jeong H.‐K., Angew. Chem., Int. Ed. 2018, 57, 156. [DOI] [PubMed] [Google Scholar]
- 74. Shamsaei E., Lin X., Wan L., Tong Y., Wang H., Chem. Commun. 2016, 52, 13764. [DOI] [PubMed] [Google Scholar]
- 75. Craig Colling G. H., BP Corp North America Inc, US6830691B2 2002.
- 76. Moore T. T., Mahajan R., Vu D. Q., Koros W. J., AIChE J. 2004, 50, 311. [Google Scholar]
Associated Data
This section collects any data citations, data availability statements, or supplementary materials included in this article.
Supplementary Materials
Supporting Information
Data Availability Statement
The data that support the findings of this study are available from the corresponding author upon reasonable request.