



Abstract
Knee osteoarthritis (OA) is the leading cause of physical disability in older adults. Total knee arthroplasty (TKA) is a common treatment for advanced stage knee OA that alleviates knee pain, but it is associated with precipitous reductions in physical function early after surgery that can take months or years to recover. Sustaining neuromuscular activation after surgery with neuromuscular electrical stimulation (NMES) can improve recovery of physical function, but the mechanisms underlying its benefits are unclear. To examine the unique effects of NMES on skeletal muscle, we randomized older adult patients (70 % female) to early NMES (n = 11) or no intervention (n = 12) for 5 weeks after surgery. We measured skeletal muscle (vastus lateralis) fiber size, contractility, mitochondrial content, and mRNA abundance pre-surgery and 5 weeks post-surgery. NMES diminished TKA-induced muscle fiber atrophy in fast-twitch, myosin heavy chain (MHC) IIA fibers and improved or preserved single muscle fiber contractility in MHC I and MHC IIA fibers, respectively. In MHC IIA fibers, the beneficial effects of NMES to sustain fiber force production were explained at the molecular level by preservation of strongly bound, myosin-actin crossbridges. Additionally, TKA-induced increases in markers of denervation (CHRNA1 and MYOG) in controls were prevented by NMES. Our results identify beneficial effects of sustaining neuromuscular activation early, post-TKA with NMES on skeletal muscle fiber size and function and potential molecular mechanisms underlying these effects.
Keywords: Disablement, Myosin, Denervation, Rehabilitation
1. Introduction
Knee osteoarthritis (OA) is the leading cause of disability in older adults (Anonymous, 2009). As non-surgical therapies are inadequate in managing symptoms (Turk et al., 2011) and do not alter the disease course, patients with advanced stage disease typically undergo total knee arthroplasty (TKA) to provide relief from OA-associated joint pain. TKA is the most common major elective surgery in the United States (Bateman et al., 2010) and is expected to rise dramatically in the future with increasing numbers of older adults (Kurtz et al., 2007). While TKA improves patient-reported function by alleviating joint pain (Ethgen et al., 2004), objectively measured physical function often does not improve much beyond pre-surgical levels even years after surgery and does not reach healthy control levels (Huang et al., 1996; Bade et al., 2010; Boonstra et al., 2008; Walsh et al., 1998).
One reason that TKA fails to restore function is the precipitous loss of skeletal muscle function and, in turn, whole body physical function early after TKA (Avramidis et al., 2003). The cause of these functional declines is not completely understood but are hypothesized to be due to reduced neuromuscular activation and skeletal muscle maladaptations, such as atrophy and weakness (Kittelson et al., 2013; Meier et al., 2009; Mizner et al., 2005). As neural activation deficits usually regress relatively quickly after surgery (Stevens-Lapsley et al., 2012), skeletal muscle maladaptations are thought to contribute disproportionately to long-term functional disability (Kittelson et al., 2013; Meier et al., 2009; Mizner et al., 2005). Thus, interventions that prevent or rehabilitate intrinsic skeletal muscle deficits hold promise for improving long-term functional recovery in older adults undergoing TKA.
Neuromuscular electrical stimulation (NMES) induces muscle contraction via transcutaneous current application through electrode pads placed over muscles of interest. NMES can be used to preserve or rehabilitate skeletal muscle atrophy and function resulting from orthopedic injury or surgery (Spector et al., 2016). Seminal work by our laboratories demonstrated that NMES to the quadriceps for 6 weeks post-TKA improved the recovery of whole muscle strength and physical function and that these benefits persisted for 1 year after surgery (Avramidis et al., 2003). Historically, NMES was thought to improve muscle function primarily by restoring motor neuron activation (Thomas and Stevens-Lapsley, 2012), but NMES also prevents muscle maladaptations that accompany TKA, such as atrophy (Gibson et al., 1988). Deciphering the mechanisms whereby NMES benefits function via assessments at the tissue level, however, is complicated because these measures are confounded by the sequelae of the surgery and methodological limitations. For example, muscle size measured by non-invasive imaging can be unreliable in the early post-surgical period because of tissue fluid accumulation (Toth et al., 2022). Moreover, whole muscle strength assessments do not reflect intrinsic muscle contractile function because of neural activation deficits (Thomas and Stevens-Lapsley, 2012). Thus, the effects of NMES on skeletal muscle after orthopedic surgery have not been rigorously evaluated.
Our goal in this study was to evaluate the effects of early NMES after TKA on skeletal muscle size and function in older adults. To accomplish this goal, we randomized volunteers undergoing TKA to unilateral NMES to the quadriceps of their surgical leg or no intervention for 5 weeks immediately post-surgery, with blinded outcome assessments conducted prior to and at 5-weeks post-surgery. Assessments of size and contractility were conducted at the single muscle fiber level from tissue acquired by percutaneous biopsy to overcome limitations in whole tissue-level measures. We hypothesized that NMES will preserve muscle fiber size but have limited effects on muscle fiber intrinsic contractility.
2. Methods
2.1. Study design
This study was designed as a prospective, randomized, controlled trial to examine the effects of NMES on skeletal muscle fiber structure and function in older adult volunteers undergoing TKA (NCT03051984). Outcomes were collected on operative legs prior to unilateral TKA and 5-weeks post-surgery. All personnel conducting outcome assessments were blinded to group assignment. Recruitment began on January 1, 2017, and ended on January 13, 2022. Volunteers undergoing assessment for TKA were screened from the Adult Reconstruction Service of our Department of Orthopaedics and Rehabilitation and local private practices and were eligible if they: 1) were 50–75 years of age, 2) had symptomatic, advanced stage knee OA, and 3) were scheduled to undergo unilateral TKA. Volunteers were excluded if they had: 1) knee OA secondary to inflammatory or autoimmune disease; 2) untreated/uncontrolled hypertension, diabetes, or thyroid disease; 3) chronic heart failure, actively treated malignancy, exercise-limiting peripheral vascular disease, stroke, or neuromuscular disease; 4) a body mass index ≥38 kg/m2; 5) a permanent pacemaker or implantable cardioverter defibrillator; or 6) known deep vein thrombosis or coagulopathy. The study was approved by the University of Vermont Committee on Research in the Medical Sciences and written informed consent obtained from each volunteer prior to participation.
A total of 227 volunteers were screened for procedural and initial eligibility. Of those volunteers who met these initial eligibility criteria, 30 were invited for detailed medical screening and 23 were enrolled and randomized (n = 6 failed medical screening due to uncontrolled diabetes (n = 4), rheumatoid arthritis (n = 1), and deep vein thrombosis (n = 1), and n = 1 patient had his surgery date changed, preventing baseline assessments). Patients (n = 7 men/n = 16 women) were randomized (1:1) using a covariate adaptive approach to receive NMES or no intervention (controls), with stratification for age and sex. Group allocation was only known to the statistician conducting the randomization and an unblinded study coordinator who trained the volunteer in the use of NMES. All other study personnel were blinded to treatment status throughout the study. Because of the nature of the NMES intervention, we could not blind volunteers to group assignments. An unblinded study coordinator enrolled volunteers, assigned them to intervention arms, and trained them to use NMES. Of the 23 patients (11 NMES/12 Control) enrolled and randomized, 21 (10 NMES/11 Control) completed baseline and 5-week, post-surgery evaluations (n = 2 did not complete 5-week assessments because of COVID-19 closures) and were included in primary analyses.
2.2. Protocol
Following a screening visit to determine eligibility, volunteers underwent baseline evaluations prior to TKA surgery during two outpatient visits. During the first visit, assessments of whole muscle strength and physical function were performed. The second visit was scheduled at least 7 days after the first and consisted of total and regional body composition scans and muscle tissue acquisition. Physical activity was assessed by accelerometry for 5 days during baseline evaluations and throughout the 5-week post-surgery intervention period. All patients underwent TKA via standard medial parapatellar surgical approach without a tourniquet. Additionally, all volunteers, regardless of group, received standard physical rehabilitation during their hospital stay, which focused on promoting weight bearing, transfers, ambulation and, if their home environment required, stair climbing. Home physical therapy was provided for at least the first two weeks post-discharge and consisted primarily of early strengthening exercise and knee range of motion. Thereafter, home and outpatient physical rehabilitation consisted of progressive strengthening exercises, gait training, and gradual progression of functional activities until the post-surgery visit. Approximately 5 weeks following hospital discharge, volunteers underwent re-assessment during two outpatient visits.
2.3. Treatment intervention
Patients randomized to NMES of the quadriceps musculature of their operative leg (Empi Continuum; EMPI Inc., Clear Lake, SD) began the intervention within 72 h post-surgery. Patients performed NMES at home 5 days/week, 50 min/day (5-min warm-up, 45-min stimulation session) using symmetrical, biphasic pulses (400 μs at 50 Hz), with a duty cycle of 25 % (10 s on, 30 s off). Electrode pads (7.5 × 13.5 cm) were placed horizontally on the proximal and distal aspects of the quadriceps to cause contraction of medial and lateral quadriceps, with the knee joint at a slightly bent angle and fixed using an ankle weight. NMES was applied to resting muscle at an intensity to obtain maximal tetanic, isometric contractions within pain tolerance. Each volunteer demonstrated proficiency using their device while supervised by unblinded study personnel and was contacted within 72 h of post-surgical training to ensure proficiency, with regular weekly phone contacts to encourage adherence and address any problems with the NMES intervention. Patients randomized to control were also contacted on a weekly basis to discuss recovery and general health to match the degree of interaction with study staff. Adherence to NMES prescriptions was tracked with the compliance monitoring feature of the device software. As the NMES device will not emit current unless there is electrical resistance (i.e., current must pass through electrodes affixed to the patient or the device will not work), software-derived device use is a reliable index of intervention fidelity.
2.4. Body composition
Total and regional fat mass, fat-free mass and bone mass were measured by dual energy x-ray absorptiometry (DEXA; GE Lunar Prodigy Encore) in the supine position while clothed in a hospital gown. Appendicular muscle mass was estimated as the sum of arm and leg fat-free mass. Additionally, bilateral thigh muscle tissue cross-sectional areas (CSA) by computerized tomography (CT; Phillips Ingenuity 128), as described (Callahan et al., 2014a; Toth et al., 1997). Briefly, slice location was at the midpoint of the thigh (halfway between the anterior superior iliac crest and the most proximal aspect of the patella). Data were analyzed using freely available software (Image J V1.44, National Institutes of Health, Bethesda, MD). A region of interest (ROI) was traced around specific muscle groups, and all pixels outside this ROI eliminated. Pixels within the ROI were differentiated between muscle and fat based on radiodensity, measured in Hounsfield units (0 to 100 for muscle and − 190 to −30 for fat). The sum of pixels corresponding to each tissue type was used to quantify their CSA.
2.5. Knee extensor muscle strength
Isometric (70°) and isokinetic (60°/sec) peak torque about the knee were evaluated by dynamometry (HUMAC/NORM, Computer Sports Medicine Inc., Stoughton, MA), as described (Toth et al., 2006). Briefly, strength of both surgical and non-surgical legs were tested with the hip fixed at 90° and waist, torso, and lower thigh secured with Velcro straps. The lever arm of the dynamometer was attached just proximal to the lateral malleolus and the axis of rotation aligned with the knee joint at the lateral epicondyle of the femur. The range of motion was determined separately for each individual prior to testing. Following instructions and the performance of sub-maximal practice contractions, three isometric (contraction held for minimum of 4 s) and two isokinetic (5 repetitions/trial) were performed. Each trial was separated by two minutes of rest.
2.6. Physical activity
Weight-bearing activity was measured with a triaxial accelerometer (Actigraph GT3x+; ActiGraph Co., Pensacola, FL) using average daily step counts, for 5 days during baseline assessments and for three 5-day periods at the beginning, middle and end of the 5 week post-surgery follow up. Data during the post-surgical period were averaged across groups and modeled via linear regression to derive the slope of the change in step counts in the 5 weeks post-surgery to determine if recovery of physical activity differed by group.
2.7. Muscle tissue biopsy and processing
Percutaneous biopsy of the vastus lateralis was performed, as described (Guigni et al., 2018), with the 5-week post-TKA biopsy taken ~2–3 cm proximal to the pre-surgery site to avoid areas of tissue damage associated with the initial biopsy. Tissue for immunohistochemistry was embedded in optimal cutting temperature medium, frozen in isopentane cooled in liquid nitrogen and stored at −80 °C until analysis. Another portion was placed immediately into cold (4 °C) dissecting solution, dissected into small fiber bundles, fixed at a slightly stretched length, chemically skinned overnight and stored at −20 °C for single fiber contractile assessments, with procedures and solutions as described (Callahan et al., 2014b). Tissue for electron microscopy was fixed (2.5 % glutaraldehyde/1 % paraformaldehyde) at a slightly stretched length and prepared, as described (Miller et al., 2009).
2.8. Immunohistochemistry
Muscle fiber cross-sectional area (CSA) was measured by immunohistochemistry for muscle myosin heavy chain (MHC) isoforms, as described and validated by us (Murach et al., 2020). Briefly, primary antibodies raised against the three main skeletal muscle MHC isoforms (MHC I, IIA, IIX; BA-D5, SC-71, and 6H-1 from Developmental Studies Hybridoma Bank, Iowa City, IA) are used to identify all 6 fiber isotypes (MHC I, I/IIA, IIA, IIA/X, IIX, I/IIA/IIX). Image acquisition was performed with an Olympus BX51 microscope (Olympus America, Center Valley, PA) at ×20, with analysis using ImageJ. Minimal Feret diameter, which represents the minimal distance between parallel lines from the entire boundary of the fiber, was derived from the image analysis. Minimal Feret diameter was used to calculate fiber CSA (Area = πr2) to control for muscle fiber bundle orientation and sectioning artifact (Briguet et al., 2004). Relative distribution of fiber types was derived from the fractional area of the muscle section comprised of each fiber type. Assessors were blinded to the intervention status of samples.
2.9. RNA fluorescent in situ hybridization (RNA-FISH)
CHRNA1 and MYOG mRNA location in muscle cross sections were determined with RNA-FISH, as described by us (Wen et al., 2023). Briefly, sections were fixed in 4 % paraformaldehyde, dehydrated, and incubated in 3 % hydrogen peroxide to quench endogenous peroxidases per instructions (ACDBio, Newark, CA). Antigen retrieval was performed using a protease (#322336, ACDBio), target mRNA hybridized with customized human CHRNA1 (#1248921-C1, ACDBio) or MYOG probes (#553201-C3, ACDBio), amplified, and detected using the TSA vivid 570 fluorescent reagent (#323272, ACDBio). Samples were incubated overnight in a laminin primary antibody (#L9393, Sigma). The next day, slides were incubated in goat anti-rabbit AF488 (#A-11034, ThermoFisher) and co-stained with DAPI (#D3571, ThermoFisher) prior to mounting with fluorescent mounting media (#H-1000, Vector). CHRNA1 and MYOG RNA fluorescent in situ hybridization images were taken at 20× magnification (Plan-Apochromat 20×, NA: 0.8, air) using a Zeiss M2 Axioimager with an automatic stage (AxioImager M2; Zeiss, Oberkochen, Germany) or at 40× magnification (Plan-Apochromat 40×, NA: 1.3, oil) with a Nikon AXR (Melville, NY) confocal microscope equipped with a motorized stage and a Galvano scanner. The intensity of the CHRNA1 and MYOG RNA-FISH signal was assessed as the mean fluorescent signal intensity within a specified, 25 μm2 circular region of interest (ROI) encompassing myonuclei (DAPI+ nuclei residing completely within the laminin border). 30 ROIs (i.e., 30 myonuclei) from each image were included in the analysis. Zen software (v3.1, Zeiss) was employed for all signal strength analyses. Assessors were blinded to the intervention status of samples.
2.10. Skeletal muscle fiber contractility
Segments (~2–3 mm) of chemically skinned fibers were isolated and cellular contractility and crossbridge mechanics/kinetics measured (25 °C) within 4 weeks of the biopsy, as described (Callahan et al., 2014b). The average CSA of each fiber was calculated from 3 to 5 pairs of measurements of top and side diameter taken in solution along the fiber segment using an elliptical model. For cellular contractility measurements, assessments were made under maximal Ca2+-activated conditions (pCa 4.5) and included maximum isometric tension (Tmax; force production per fiber CSA), maximum shortening velocity (Vmax) and maximum power production (Pmax), with the latter two indices derived from isotonic load clamps, as described (Callahan et al., 2014b). For Tmax, these data represent the total force production minus passive force production. If force decreased >10 % from the first to last activation during the isotonic load clamps, results for that fiber were not included in final analyses.
To assess myosin-actin crossbridge mechanics and kinetics, small amplitude (0.05 % fiber segment length) sinusoidal length perturbation analysis was conducted under maximal Ca2+-activated conditions across a frequency range of 0.25 to 200 Hz at 25 °C on a separate group of fibers, as detailed previously (Miller et al., 2010). These assessments and modeling of resulting stress data yields three characteristic processes, A, B, and C, which relate to mechanical (A, B, C, and k) and kinetic [2πb and (2πc)−1] properties of the crossbridge cycle, as described in detail (Miller et al., 2010).
Following both cellular and crossbridge functional assessments, all fiber segments were placed in gel loading buffer (2 % SDS, 62.5 mM Tris, 10 % glycerol, 0.001 % bromophenol blue, 5 % β-mercaptoethanol, pH 6.8) and analyzed for MHC isoform composition by SDS-PAGE, as described (Miller et al., 2009). Personnel performing muscle fiber contractility assessments were blinded to the group assignment of volunteers, as well as the MHC expression profile of the fibers, as this was determined by SDS-PAGE following completion of mechanical assessments.
2.11. Electron microscopy
Electron microscopy was conducted on intact (i.e., unskinned) skeletal muscle fibers to assess sub-sarcolemmal (SS) and intermyofibrillar (IMF) mitochondria area fraction, average area and number, as described in detail (Toth et al., 2020a). Assessors were blinded to the intervention status of samples.
2.12. Statistics
Prior to statistical analysis, all outcomes underwent tests of homogeneity of variance and distributions were examined to determine if any variables required transformation. For variables with a single measure per volunteer per time point, analysis of variance was used with time as a within-subject factor (baseline vs. 5-weeks post-surgery) and group (NMES vs. control) as the between-subject factor. For variables with multiple observations within the same individual at each time point (e.g., single fiber CSA and contractility), mixed model analyses of variance was used, including a random effect to account for the fact different muscle fibers within an individual are not independent. All mixed model data utilized factors described above and included both sex and baseline value as covariates. Data on skeletal muscle fibers were limited to fibers expressing MHC I, IIA and IIAX isoforms for immunohistochemical analyses, or MHC I and IIA isoform for mechanical measures, as other MHC isotype fibers were too few to permit analyses. SAS software (version 9.4, SAS Institute Inc., Cary, NC) was used for mixed model analysis, while SPSS (version 27) was used for all other analyses. All data are reported as mean ± SD, except for data from mixed model analysis, where mean and SE data are derived from parameter estimates from the model. Statistical significance was set at P < 0.05.
3. Results
3.1. Patient characteristics and intervention
All volunteers had radiographic signs [Kellgren and Lawrence grade 4 in all, except one patient who was grade 3] and self-reported symptoms of advanced stage knee OA in their surgical leg, consistent with the need for TKA. Fifteen (NMES: n = 8, Control: n = 7) volunteers had a history of hypertension and were on stable regimens of angiotensin converting enzyme inhibitors, angiotensin receptor blocker, or calcium channel blockers. In addition, 11 (NMES: n = 4, Control: n = 7) volunteers had a history of hyperlipidemia, with eight (NMES: n = 3, Control: n = 5) taking HMG-CoA reductase inhibitors (statins) for management. Of note, we have shown that older adults on stable doses of statins without any muscle symptoms show no evidence for altered muscle fiber size, contractility, or mitochondrial content (Rengo et al., 2016). All volunteers were on stable statin regimens and none showed signs or symptoms of statin-induced myalgia or myopathy. Twenty-one volunteers (NMES: n = 11, Control: n = 10) were taking nonsteroidal anti-inflammatory medications for knee pain before surgery.
At baseline, groups were similar for age, height, weight, body mass index, and amount of weight bearing activity (Table 1). No patients withdrew from the study following randomization. In the NMES group, no adverse events or unanticipated problems occurred related to the intervention. Adherence to the NMES prescription was strong, with volunteers using the device for 90 ± 4 % of prescribed sessions, with an average stimulation intensity of 38.5 ± 2.6 mA. The study period following TKA surgery was similar in NMES (36.1 ± 1.1 d) and control (36.9 ± 1.1 d) groups. While we did not restrict rehabilitation modalities, no patient reported receiving NMES outside that provided by the study intervention in either group.
Table 1.
Physical and clinical characteristics pre-surgery for volunteers randomized to control and neuromuscular electrical stimulation (NMES) groups.
| Variable | Control | NMES |
|---|---|---|
|
| ||
| n (M/F) | 3/9 | 4/7 |
| Age (year) | 64.8 ± 2.1 | 63.2 ± 1.9 |
| Weight (kg) | 81.2 ± 3.4 | 79.9 ± 3.1 |
| Height (cm) | 166.2 ± 3.0 | 166.1 ± 2.5 |
| Body mass index (kg/m2) | 29.4 ± 1.0 | 28.9 ± 1.0 |
| Physical activity (steps/day) | 4767 ± 691 | 4167 ± 688 |
Data are means ± SE.
3.2. Single muscle fiber size
As expected, TKA was accompanied by muscle fiber atrophy, as indicated by time effects in all fibers pooled and across fiber types (all P < 0.001; Fig. 1). However, we observed group X time effects (P = 0.0127) for MHC IIA fibers, suggesting that while TKA reduced MHC IIA CSA in both groups (P < 0.001), NMES reduced that magnitude of atrophy (−20 %) versus control (−30 %; P = 0.038).
Fig. 1.

Effect of NMES on the response of muscle fiber size to total knee arthroplasty (TKA). Representative immunohistochemistry images for pre-surgery and 5-wk post-surgery Control (A and B, respectively) and NMES (C and D, respectively) groups. Tissue sections treated with antibodies recognizing myosin heavy chain (MHC) I (green), MHC IIA (red), and MHC IIX (blue) isoforms are shown. As fibers expressing only MHC IIX are rare, the large majority of MHC IIX expression occurs in MHC IIAX hybrid fibers (purple). Scale bar = 50 um. Skeletal muscle fiber cross-sectional area (CSA) calculated from minimal Feret diameter (E) for all fiber types pooled together (All Fibers) and MHC I, IIA, and IIAX fibers are shown at pre-surgery (open bar) and post-surgery (filled bar) for patients in control (black) and NMES (blue) groups. Analyses were limited to fibers expressing MHC I, IIA, and IIAX isoforms because other MHC isotype fibers (MHC I/IIA, IIX, and I/IIA/IIX) were too few to permit analyses. Bars represent mean and SE from parameter estimates from the linear mixed model analysis for n = 10 patients for each time point derived, except for n = 9 patients for MHC IIAX post-surgery because one patient did not have any MHC IIAX fibers at one time point. Data points represent individual volunteer average values for single fibers clustered within each volunteer for baseline and 5-week post-surgery evaluations. Please note that these individual average data are presented for data transparency purposes only and are not utilized in the statistical analytical model. Bar graphs represent least squared means and standard error values derived from the mixed model analysis. Deviation of individual values from bars graph data are due to the fact model-derived values reflect adjustment for the effects of sex, as well as other factors. In addition, many of the measures were log transformed for analysis, and as such the least squared means and standard errors plotted were back transformed into original units. Thus, these values can be somewhat offset from those of the raw data. P values indicate time (T) and group X time (GxT) effects (atop brackets) or within group comparisons over time (over lines). *P < 0.05, ***P < 0.001. (For interpretation of the references to colour in this figure legend, the reader is referred to the web version of this article.)
3.3. Single muscle fiber contractility
MHC I fibers were less impacted by TKA than MHC IIA fibers (Fig. 2), as time effects were not significant in MHC I fibers (range of P values: 0.07 to 0.20, but none <0.05). However, NMES increased Vmax and Pmax (group X time: P = 0.0163 and P = 0.01, respectively) in MHC I fibers compared to control. In contrast to the lack of effect in MHC I fibers, TKA strongly impacted MHC IIA fibers to cause reductions in Tmax, Vmax, and Pmax (time effect: P < 0.001 for all). Moreover, NMES mitigated reductions in Pmax (group X time: P = 0.003). Pairwise comparisons showed a reduction in Pmax in controls (P < 0.001) but not NMES (P = 0.140), and this effect was driven primarily by the ability of NMES to diminish the effects of TKA on Tmax (group X time: P = 0.055), as the group X time effect was not significant for Vmax (P = 0.146).
Fig. 2.
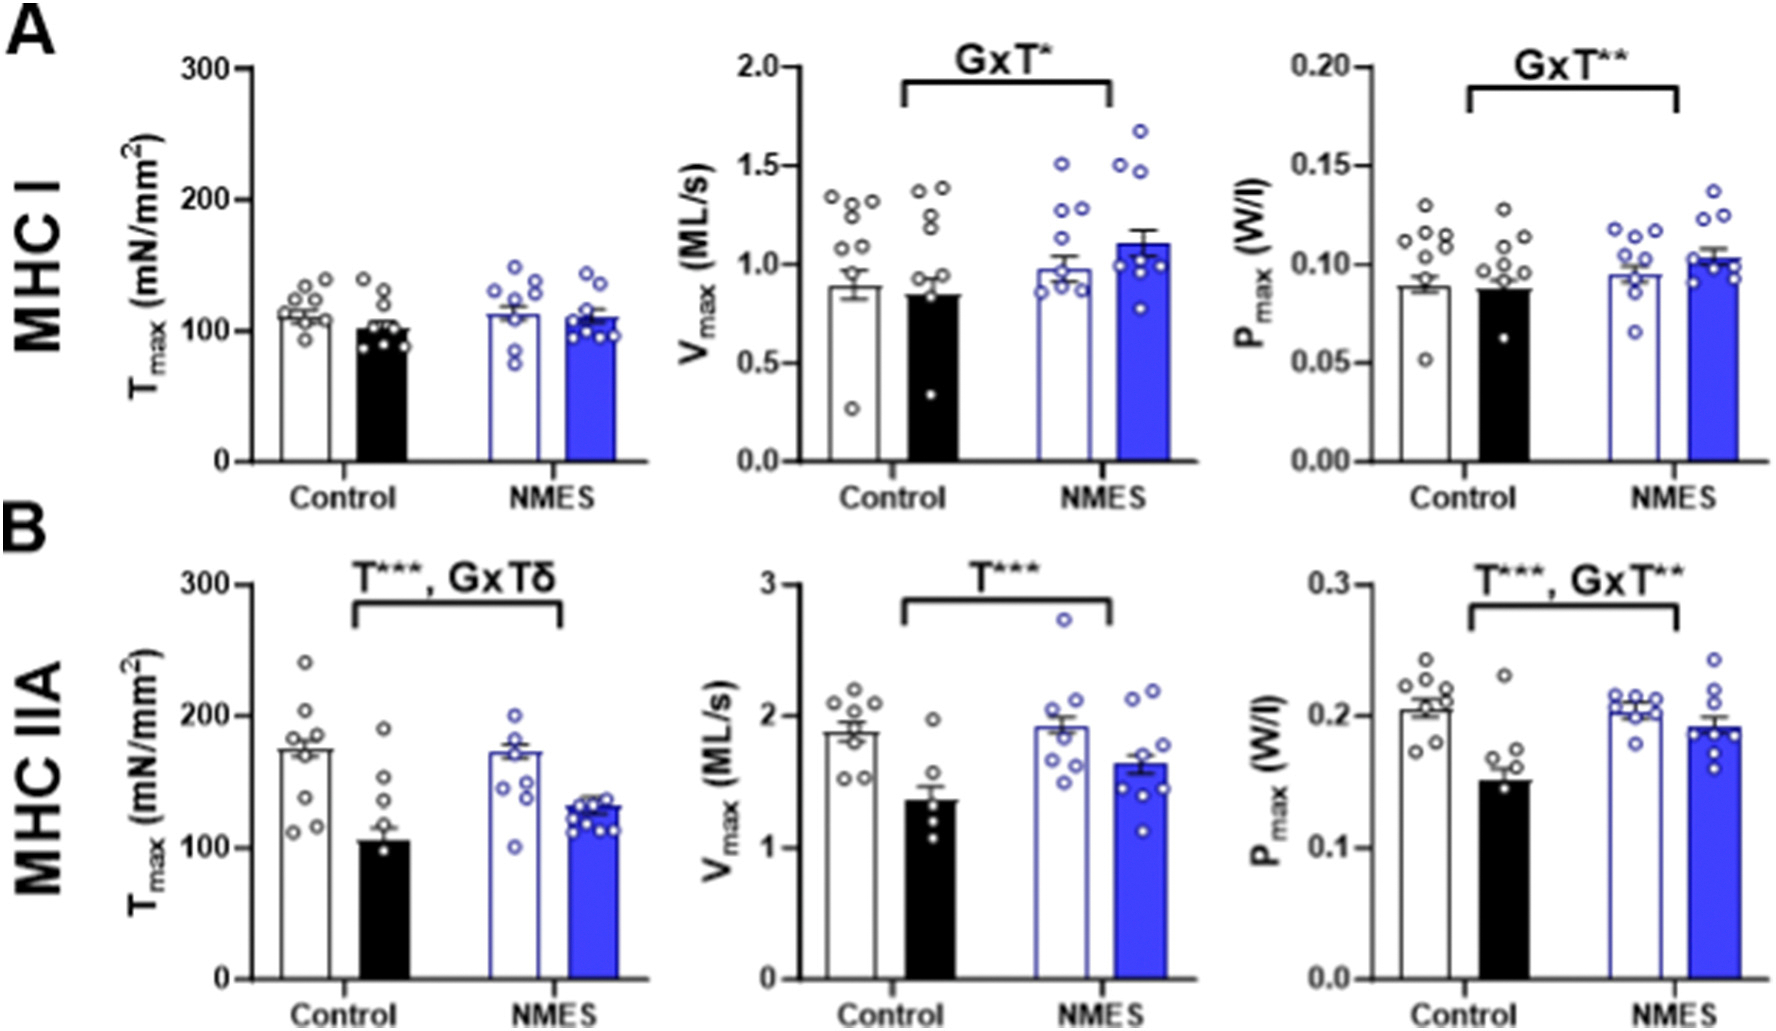
Effect of NMES on the response of skeletal muscle fiber contractility at the cellular level in myosin heavy chain (MHC) I and IIA fibers (A and B, respectively) to total knee arthroplasty (TKA). Data are shown for maximal Ca2+-activated isometric tension (Tmax, or force/cross-sectional area (CSA)) and maximal velocity (Vmax) and maximal power output (Pmax) derived from isotonic load clamps at pre-surgery (open bars) and 5-wk post-surgery (filled bars) for patients randomized to control (black) and NMES (blue) groups. Analyses were limited to these fiber types because other MHC isotype fibers were too few to permit analyses. Data represent mean and SE for parameter estimates from the linear mixed model analysis for n = 8/group, except n = 7 for NMES MHC IIA data because one patient did not have any MHC IIA fibers at one time point. Data points represent individual volunteer average values for single fibers clustered within each volunteer for baseline and 5-week post-surgery evaluations. Please note that these individual average data are presented for data transparency purposes only and are not utilized in the statistical analytical model. Bar graphs represent least squared means and standard error values derived from the mixed model analysis. Deviation of individual values from bars graph data are due to the fact model-derived values reflect adjustment for the effects of sex, as well as other factors. In addition, many of the measures were log transformed for analysis, and as such the least squared means and standard errors plotted were back transformed into original units. Thus, these values can be somewhat offset from those of the raw data. P values indicate time (T) and group X time (GxT) effects (atop brackets) or within group comparisons over time (over lines). *P < 0.05, ΔP = 0.06, **P < 0.01, ***P < 0.001. (For interpretation of the references to colour in this figure legend, the reader is referred to the web version of this article.)
3.4. Myosin-actin crossbridge mechanics and kinetics
To evaluate the mechanisms underlying the effects of NMES on single fiber contractility, we evaluated myosin-actin crossbridge mechanics and kinetics using small amplitude, sinusoidal length perturbation analysis (Table 2). In MHC I fibers, we found no effect of either TKA or NMES on myosin-acting crossbridge mechanic or kinetic parameters (range of P values for group X time: 0.169 to 0.795). In contrast, in MHC IIA fibers, TKA reduced A, B, and C (group X time: P < 0.001 for all). For B, and C, which reflect the number of strongly bound crossbridges, we also found group X time effects, with NMES diminishing TKA-related reductions (P = 0.035 for both).
Table 2.
Skeletal muscle myosin-actin crossbridge mechanics and kinetics pre-surgery and 5 weeks post-surgery.
| Variable | Control |
NMES |
Effect | ||
|---|---|---|---|---|---|
| Pre-surgery | Post-surgery | Pre-surgery | Post-surgery | ||
|
| |||||
| MHC I (n) | 8 | 8 | |||
| A (kN/mm2) | 1083 ± 70 | 1009 ± 64 | 932 ± 57 | 958 ± 63 | NS |
| B (kN/mm2) | 5507 ± 393 | 5997 ± 413 | 5460 ± 359 | 5765 ± 460 | NS |
| C (kN/mm2) | 7855 ± 450 | 8131 ± 449 | 7877 ± 416 | 7897 ± 503 | NS |
| 2πb (s−1) | 13.5 ± 0.5 | 14.7 ± 0.5 | 13.1 ± 0.4 | 13.2 ± 0.5 | NS |
| ton (ms) | 29.4 ± 1.3 | 30.1 ± 1.3 | 29.3 ± 1.2 | 30.9 ± 1.5 | NS |
| MHC IIA (n) | 8 | 7 | |||
| A (kN/mm2) | 2172 ± 111 | 1394 ± 128*** | 2297 ± 102 | 1903 ± 115** | Time P < 0.001 |
| B (kN/mm2) | 21,468 ± 1667 | 9269 ± 1276*** | 21,738 ± 1466 | 14,934 ± 1363** | Time P < 0.001, Group X Time P < 0.03 |
| C (kN/mm2) | 22,573 ± 1729 | 9639 ± 1327 | 22,686 ± 1492 | 15,016 ± 1345 | Time P < 0.001, Group X Time P < 0.05 |
| 2πb (s−1) | 47.5 ± 1.51 | 47.7 ± 2.38 | 45.9 ± 1.29 | 44.5 ± 1.52 | NS |
| ton (ms) | 16.3 ± 0.5 | 17.3 ± 0.8 | 16.8 ± 0.4 | 17.5 ± 0.6 | NS |
Data are means ± SE for parameter estimates from the linear mixed model analysis and are shown for myosin heavy chain (MHC) I and MHC IIA fiber types, as other fiber types were too few to permit analysis. P value notations for the Effect column denote time and group X time interaction effects. NS, nonsignificant for time and group x time effects.
P < 0.01,
P < 0.001 are indicated for pairwise, within-group comparison in variables with significant group X time interaction effects.
3.5. Mitochondria content and structure
In both SS and IMF locations (Fig. 3), there were reductions in mitochondrial fractional area (time effect: P < 0.001 and P = 0.005, respectively), which were primarily driven by reductions in mitochondrial number per unit area (time effect: P < 0.001 and P = 0.006, respectively), although average size was also reduced (P = 0.02) in SS mitochondria. No group X time interaction effects were noted for SS mitochondria (range of P values: 0.110 to 0.564), but we did observe a group X time effect for average IMF mitochondrion area (P = 0.0156), where NMES prevented declines in IMF mitochondrion size (P = 0.05) vs. declines in the control group (P = 0.004).
Fig. 3.

Effect of NMES on the response of skeletal muscle mitochondrial content and structure to total knee arthroplasty (TKA). Representative subsarcolemmal (A, B, E, F) and intermyofibrillar (C, D, G, H) images for pre-surgery (A, C, E, G) and 5-wk post-surgery (B, D, F, H) muscle sections for Control (A–D) and NMES (E-H) groups are shown. Scale bars = 1 um. Data derived from electron microscopy images of muscle tissue sections include fractional area, average mitochondrion area, and number per area for subsarcolemmal (SS) and intermyofibrillar (IMF) subcellular depots (I and J, respectively). Data represent least squares mean and SE for n = 10 Control patients (black) and n = 10 NMES patients (blue) derived from the linear mixed model analysis (open and filled bars for pre-surgery and 5-wk post-surgery, respectively). Data points represent individual volunteer average values for single fibers clustered within each volunteer for baseline and 5-week post-surgery evaluations. Please note that these individual average data are presented for data transparency purposes only and are not utilized in the statistical analytical model. Bar graphs represent least squared means and standard error values derived from the mixed model analysis. Deviation of individual values from bars graph data are due to the fact model-derived values reflect adjustment for the effects of sex, as well as other factors. In addition, many of the measures were log transformed for analysis, and as such the least squared means and standard errors plotted were back transformed into original units. Thus, these values can be somewhat offset from those of the raw data. P values denote time (T) and group X time (GxT) effects (atop brackets) or within group comparisons over time (over lines). *P < 0.05, **P < 0.01, ***P < 0.001. (For interpretation of the references to colour in this figure legend, the reader is referred to the web version of this article.)
3.6. RNA-FISH
To explore potential mechanisms underlying the beneficial effects of NMES on muscle fiber size and contractility, we evaluated expression of CHRNA1 and MYOG mRNA using fluorescent in situ hybridization (RNA-FISH; Fig. 4). We found group X time effects for both CHRNA1 and MYOG (P < 0.001 and P = 0.0450, respectively). Pairwise contrasts showed that TKA was accompanied by increased expression of CHRNA1 and MYOG mRNA in the control group (P < 0.001 and P = 0.01, respectively), but these increases were reduced (CHRNA1: P = 0.046) or prevented (MYOG: P = 0.173) by NMES.
Fig. 4.

Effect of NMES on the response to total knee arthroplasty (TKA) of skeletal muscle expression of genes activated upon skeletal muscle denervation via RNA fluorescent in situ hybridization (RNA-FISH), including the acetylcholine receptor sub-unit α1 (CHRNA1) and myogenin (MYOG). Representative images for CHRNA1 (A) and MYOG (C) are shown using antibodies for laminin (green), fluorescently labeled in situ hybridization probes (red) and DAPI (blue), along with mean myonuclear intensity data for each analyte (B and D, respectively). Scale bar = 100 μm. Data represent mean and SE for n = 8 controls and n = 7 NMES patients. Data points represent individual values for volunteers for baseline and 5-week post-surgery evaluations. P value notations indicate time (T) and group X time (GxT) effects (atop brackets) or within group comparisons over time (over lines). * P < 0.05, ** P < 0.01, *** P < 0.001. (For interpretation of the references to colour in this figure legend, the reader is referred to the web version of this article.)
3.7. Whole muscle size and function
TKA was accompanied by both decreased muscle size and strength, as demonstrated by CT measurements and knee extensor muscle strength tests (Tables 3 and 4). We observed significant time effects, indicating reductions in muscle CSA in the surgical leg thigh (quadriceps + hamstrings; P < 0.001), and quadriceps (P < 0.001) and hamstring muscle groups individually (P = 0.001). In the non-surgical leg, thigh, hamstring, and quadriceps muscle CSA (P < 0.001, P = 0.020 and P = 0.006, respectively). Additionally, we observed significant time effects in isometric and isokinetic peak torque measurements in the surgical leg (P < 0.001), with no time effects for strength measures in the non-surgical leg (P = 0.142 and 0.063, respectively).
Table 3.
Effect of NMES on body composition pre-surgery and 5-weeks post-surgery.
| Variable | Control |
NMES |
Effect | ||
|---|---|---|---|---|---|
| Pre-surgery | Post-surgery | Pre-surgery | Post-surgery | ||
|
| |||||
| DEXA (n) | 11 | 10 | |||
| Fat mass (kg) | 34.0 ± 2.7 | 33.4 ± 2.6 | 29.5 ± 2.8 | 29.0 ± 2.6 | NS |
| Fat-free mass (kg) | 45.1 ± 2.6 | 43.3 ± 2.3 | 47.8 ± 2.2 | 46.6 ± 2.2 | Time*** |
| Tissue % fat (%) | 42.9 ± 2.5 | 43.4 ± 2.5 | 37.7 ± 2.9 | 38.0 ± 2.7 | NS |
| Appendicular skeletal muscle mass (kg) | 27.1 ± 1.4 | 25.6 ± 1.3 | 29.4 ± 1.4 | 28.3 ± 1.5 | Time*** |
| Surgical leg fat-free mass (kg) | 7.57 ± 0.317 | 7.10 ± 0.326 | 8.21 ± 0.392 | 7.90 ± 0.398 | Time*** |
| Non-surgical leg fat-free mass (kg) | 8.00 ± 0.44 | 7.52 ± 0.39 | 8.28 ± 0.33 | 8.09 ± 0.34 | Time*** |
| CT (n) | 10 | 10 | |||
| Surgical leg thigh muscle CSA (cm2) | 97.2 ± 7.9 | 87.8 ± 6.1 | 113.1 ± 6.9 | 100.9 ± 6.9 | Time*** |
| Surgical leg quadriceps muscle CSA (cm2) | 38.8 ± 3.1 | 33.8 ± 266 | 45.5 ± 3.0 | 38.3 ± 3.3 | Time*** |
| Surgical leg hamstrings muscle CSA (cm2) | 58.3 ± 4.9 | 53.9 ± 3.6 | 67.6 ± 4.1 | 62.6 ± 3.8 | Time*** |
| Non-surgical leg thigh muscle CSA (cm2) |
106.2 ± 9.4 | 102.8 ± 7.8 | 121.1 ± 7.9 | 114.5 ± 7.7 | Time*** |
| Non-surgical leg quadriceps muscle CSA (cm2) | 46.0 ± 4.5 | 44.9 ± 3.9 | 52.0 ± 3.3 | 48.7 ± 3.6 | Time* |
| Non-surgical leg hamstring muscle CSA (cm2) | 60.2 ± 5.0 | 57.9 ± 4.0 | 69.1 ± 5.0 | 65.8 ± 4.2 | Time** |
Data are means ± SE. P value notations for the effect column denote time effects as group x time interaction effects were not significant.
P < 0.05,
P < 0.01,
P < 0.001. NS, nonsignificant for time and group X time effects.
Table 4.
Effect of NMES on knee extensor muscle strength at pre-surgery and 5 weeks post-surgery.
| Variable | Control (n = 11) |
NMES (n = 10) |
Effect | ||
|---|---|---|---|---|---|
| Pre-surgery | Post-surgery | Pre-surgery | Post-surgery | ||
|
| |||||
| Surgical | |||||
| Isometric peak torque (N•m) | 94.7 ± 9.8 | 65.7 ± 6.9 | 113.0 ± 14.5 | 65.8 ± 6.9 | Time*** |
| Isokinetic peak torque (N•m) | 58.9 ± 5.6 | 42.5 ± 3.9 | 89.9 ± 9.6 | 53.3 ± 4.2 | Time*** |
| Non-surgical | |||||
| Isometric peak torque (N•m) | 131.8 ± 14.4 | 127.1 ± 14.7 | 134.3 ± 12.2 | 125.9 ± 12.2 | NS |
| Isokinetic peak torque (N•m) | 94.1 ± 11.5 | 88.8 ± 12.6 | 109.2 ± 10.1 | 99.6 ± 8.1 | NS |
Data are means ± SE and are shown for the surgical and non-surgical legs. For Surgical NMES, isokinetic peak torque n = 9 because one patient was unable to complete isokinetic testing because of knee pain.
P < 0.05,
P < 0.01,
P < 0.001. NS, nonsignificant for time for group X time effects.
3.8. Physical activity
Step count was reduced in both groups over time (P = 0.002), but no group x time effects were found (P = 0.887), and the slope of the activity/time relationship during the 5 weeks post-TKA was similar between group (P = 0.990; Table 5), with the latter data suggesting a similar rate of recovery of physical activity between groups.
Table 5.
Effect of NMES on physical activity measured by accelerometry.
| Variable | Control (n = 10) |
NMES (n = 10) |
Effect | ||
|---|---|---|---|---|---|
| Pre-surgery | Post-surgery | Pre-surgery | Post-surgery | ||
|
| |||||
| Step counts (counts) | 4767 ± 691 | 2500 ± 587 | 4167 ± 688 | 2088 ± 588 | Time** |
| Slope of physical activity counts from TKA through 5 weeks post-surgery (counts/d) | 69.99 | 66.27 | NS | ||
Data are means ± SE. Units for accelerometry are raw activity counts One volunteer in the NMES group did not complete accelerometry measurements.
P < 0.01; NS, non-significant.
4. Discussion
To our knowledge, this is the first study to comprehensively evaluate the effects of NMES to modulate skeletal muscle structural and functional adaptations to TKA at the cellular and molecular level in older adults. Our results uncover novel effects of NMES to preserve muscle fiber contractility and mitigate skeletal muscle atrophy in MHC IIA fibers. Moreover, we identify potential molecular mechanisms underlying these benefits, including alterations in myosin-actin cross-bridge mechanics and prevention of muscle denervation. Effects of NMES on muscle structure and function were more robust for MHC IIA fibers, which is advantageous for functional recovery, as these fibers are important determinants of muscle power output. Collectively, our results identify mechanisms underlying the effects of NMES to improve long-term functional recovery from TKA (Stevens-Lapsley et al., 2012) via direct effects on skeletal muscle structure and function.
4.1. Single muscle fiber contractility
A predominant effect of NMES in our study was to preserve or improve peak power in single muscle fibers (Fig. 2). These findings contrast with our data in younger adults undergoing anterior cruciate ligament reconstruction (ACL-R), where NMES had minimal benefits on fiber contractility (Toth et al., 2020b). Of interest are the effects of NMES on MHC IIA fibers after TKA, as these fibers underwent more marked reductions in function post-TKA compared to MHC I fibers. Parenthetically, while the preferential effect on MHC II fibers has been attributed to NMES reversing the normal voluntary activation pattern of motor units (small, slow-twitch first, followed by larger, fast-twitch (Henneman et al., 1965)), conventional wisdom now holds that NMES activates motor units in a non-selective, temporally synchronous fashion that does not bias by fiber type (Bickel et al., 2011). Instead, as aging renders MHC II fibers more susceptible to contractile dysfunction and atrophy with disuse (Hvid et al., 2010; Hvid et al., 2011), preferential effects on MHC II fibers may be explained by the ability of NMES to protect fibers more vulnerable to disuse.
In MHC IIA fibers, the effect of NMES to preserve single fiber peak power was primarily explained by maintenance of force production per unit fiber CSA. By assessing contraction at the molecular level, we further showed that NMES preserved the number of strongly bound, myosin-actin crossbridges during maximal isometric contraction (Table 2). As fiber force production is directly proportional to the number of strongly-bound crossbridges (Miller et al., 2014), our data provide a molecular mechanism by which NMES preserves MHC IIA maximal power. How TKA reduces the number of strongly-bound crossbridges is unknown, but may relate to post-translational modification of myosin or other contractile proteins that alter myosin enzymatic function or structural configuration (van den Berg et al., 2024; Day et al., 2024). Regardless of the mechanism, as MHC IIA fibers are a strong determinant of whole muscle power output (Harridge et al., 1996; Ivy et al., 1981; Evans and Lexell, 1995) and whole muscle power predicts physical function in older adults (Bean et al., 2002), NMES may improve functional recovery after TKA (Stevens-Lapsley et al., 2012) through its effects to sustain or improve the intrinsic contractility of muscle fibers.
Unlike MHC IIA fibers, contractility of MHC I fibers was relatively resistant to the effects of TKA, similar to ACL-R in younger volunteers (Toth et al., 2020b). Despite this, NMES increased peak power in MHC I fibers in TKA and ACL-R (Toth et al., 2020b), due in both cases to increased maximal contractile velocity. Unfortunately, we were unable to identify myosin-actin crossbridge mechanic or kinetic properties that explain improved MHC I function with NMES. The inability of sinusoidal length perturbation analysis to explain MHC I fiber function at the myosin-actin crossbridge level may relate to the fact that this technique is conducted under isometric conditions, whereas power and velocity were measured under isotonic (i.e., shortening) conditions. These effects of NMES on MHC I maximal power and velocity align with the effects of aerobic exercise training, which increases peak power by improving velocity (Harber et al., 2009). This concordance between NMES and aerobic exercise is perhaps not unexpected, as our NMES regimen subjects muscle to repeated, low-intensity stress (Avramidis et al., 2003) similar to aerobic exercise.
4.2. Single muscle fiber size
Muscle fiber atrophy was apparent across all fiber types after TKA (Fig. 1). Consistent with more prominent effects of NMES on MHC IIA fiber contractility, NMES preserved muscle fiber size in MHC IIA fibers but not MHC I or MHC IIAX fibers. This preferential effect of NMES on MHC II fiber size is congruent with our data in young adults undergoing ACL-R (Toth et al., 2020b), where NMES diminished atrophy in MHC IIA and IIAX fibers, as well as the more pronounced response of this fiber type to mechanical stress (Raue et al., 2012). The more predominant effects on MHC II fibers may be explained by NMES preferentially activating MHC II fibers due to the properties of their motor units, although this has been disputed (Bickel et al., 2011). Regardless of the mechanism, the consistency of effects of NMES on MHC IIA fibers across different orthopedic surgeries in younger and older adults, coupled with the role for MHC II fibers in determining muscle power (Ivy et al., 1981), suggest that these trophic effects of NMES would be advantageous for promoting functional recovery in older adults.
4.3. Mechanisms underlying effects of NMES
TKA reduced volitional, weight-bearing activity (Table 5), and the resulting reduction in neuromuscular activation may promote fiber atrophy and dysfunction (Arentson-Lantz et al., 2016). By activating motor units via transcutaneous current, NMES may counter the effects of TKA-induced physical inactivity on muscle. One mechanism whereby NMES may mediate these benefits is via maintenance of muscle innervation, as muscle disuse increases markers of denervation in humans (Demangel et al., 2017) and data from rodent models show that maintenance of neuromuscular activation with electrical stimulation prevents increases in these markers during disuse (Eftimie et al., 1991). To explore this possibility, we assessed markers of denervation in skeletal muscle tissue sections using RNA-FISH. TKA was associated with large increases in myonuclear CHRNA1 and MYOG mRNA, well-established markers of denervation (Eftimie et al., 1991), and NMES prevented these increases (Fig. 3). To our knowledge, our data are the first to provide evidence in humans that: 1) skeletal muscle denervation may be accelerated following TKA and 2) NMES may prevent TKA-induced upregulation of markers of denervation. When the TKA-induced loss of whole muscle strength is viewed in light of these data, the early, post-surgical decline may be related not only to inhibition of neuromuscular activation due to surgical trauma, pain and swelling, also known as arthrogenic inhibition (Thomas and Stevens-Lapsley, 2012), but also to sub-cellular alterations in muscle in response to denervation. For instance, denervation promotes muscle protein catabolism and altered myofibrillar protein gene expression (Gundersen et al., 1988; Thomason et al., 1989; Pette, 2001) that likely contribute to single muscle fiber atrophy and contractile dysfunction, respectively. Some of these changes could change the functional character of muscle cells independent of innervation, thereby contributing to the altered single muscle fiber function we observed. In this context, NMES may counter cellular structural and functional maladaptations that reduce whole muscle function. Such effects of NMES to limit post-TKA denervation and sub-cellular adaptations may be advantageous in older adults, as an age-related failure to reinnervate muscle may drive sarcopenia (Hepple and Rice, 2016). More broadly, our data suggest that skeletal muscle denervation may be accelerated during or after acute disabling events, such as hospitalization and reduced activity, when older adults often develop disability (Gill et al., 2010). Caution is urged with this conclusion, as we only evaluated two markers of denervation. Further study with a range of markers, preferably from different experimental techniques, is needed to rigorously assess denervation. Nonetheless, early intervention to limit the detrimental effects of these events and/or to improve neuromuscular recovery may preserve physical function long-term and forestall age-related physical disability.
4.4. Limitations
The limitations of our study warrant discussion. Notably, our evaluations of muscle fiber size and contractility were conducted at a single time point 5 weeks after surgery. Whether the benefits of NMES on fiber size and contractility persist over the longer term is unknown. Second, we controlled for the effects of sex in our analyses. Nonetheless, our study was not powered to detect sex effects and further studies will need to determine whether the effects of NMES differ by sex. To assist with these future efforts, we provide sex-specific data (Supplemental Tables 1–10). Third, the effects of the age of the volunteers on the response to NMES was not examined and further studies with a broader age range will need to determine if response to NMES varies by age. Finally, the contribution of improved muscle fiber size and contractility to whole muscle function and, in turn, whole body physical function, after TKA is unclear. Muscle fibers are the unitary cellular determinants of the size and function of skeletal muscle, and myofilament properties, which are studied in our chemically-skinned muscle fiber preparations, are the end effectors of contraction. Despite this, we did not observe differences in whole muscle strength between groups. The lack of translation of the benefits of NMES on single muscle fibers across anatomic levels could be explained by the fact that there are numerous additional tissues and systems that regulate muscle strength in humans that our study was not designed to evaluate. Alternatively, as patients suffer from kinesiophobia for an extended period after surgery (Brown et al., 2020), whole muscle strength measures could be influenced by factors unrelated to the physiological determinants of muscle fiber size and function. Further studies are needed to determine how the effects of NMES on cellular and molecular muscle properties determine physical functional recovery after TKA.
4.5. Conclusion
Our data collectively suggest that relatively small amounts of increased muscle contractile activity via NMES may improve functional recovery from TKA by sustaining skeletal muscle size and contractility at the cellular level and identify potential molecular explanations for these effects, including improved myosin-actin cross-bridge mechanics and reductions in surgery-related muscle denervation.
Supplementary Material
Appendix A. Supplementary data
Supplementary data to this article can be found online at https://doi.org/10.1016/j.exger.2025.112831.
Funding
This study was supported by the National Institutes of Aging (R01 AG050305 to M.J.T.), Arthritis and Musculoskeletal Skin Diseases (R01 AR083375 to C.S.F.), and Heart Lung and Blood Institute (T32 HL076122 postdoctoral fellowship to D.B⋅S) at the National Institutes of Health.
Footnotes
Declaration of competing interest
The authors declare no conflicts of interest.
CRediT authorship contribution statement
Michael J. Toth: Writing – review & editing, Visualization, Resources, Writing – original draft, Supervision, Project administration, Funding acquisition, Conceptualization, Investigation, Formal analysis. Patrick D. Savage: Writing – original draft, Writing – review & editing, Investigation. Deena B. Snoke: Writing – original draft, Conceptualization, Writing – review & editing, Investigation. Emma R. Bellefleur: Writing – review & editing, Investigation, Writing – original draft. Michael DeSarno: Writing – review & editing, Formal analysis, Writing – original draft. Timothy W. Tourville: Writing – original draft, Writing – review & editing, Investigation. Michael Blankstein: Resources, Writing – review & editing, Writing – original draft. Alexander R. Keeble: Writing – review & editing, Investigation, Writing – original draft. Sara Gonzalez-Velez: Writing – original draft, Investigation, Writing – review & editing. Christopher S. Fry: Writing – review & editing, Investigation, Writing – original draft. Jennifer Stevens-Lapsley: Investigation, Writing – original draft, Conceptualization, Writing – review & editing. Nathaniel J. Nelms: Writing – review & editing, Resources, Writing – original draft.
References
- Anonymous, 2009. Prevalence and most common causes of disability among adults–United States, 2005. MMWR Morb. Mortal. Wkly. Rep. 58, 421–426. [PubMed] [Google Scholar]
- Arentson-Lantz EJ, English KL, Paddon-Jones D, Fry CS, 2016. Fourteen days of bed rest induces a decline in satellite cell content and robust atrophy of skeletal muscle fibers in middle-aged adults. J. Appl. Physiol. 120 (8), 965–975. [DOI] [PMC free article] [PubMed] [Google Scholar]
- Avramidis K, Strike PW, Taylor PN, Swain ID, 2003. Effectiveness of electric stimulation of the vastus medialis muscle in the rehabilitation of patients after total knee arthroplasty. Arch. Phys. Med. Rehabil. 84 (12), 1850–1853. [DOI] [PubMed] [Google Scholar]
- Bade MJ, Kohrt WM, Stevens-Lapsley JE, 2010. Outcomes before and after total knee arthroplasty compared to healthy adults. J. Orthop. Sports Phys. Ther. 40, 559–567. [DOI] [PMC free article] [PubMed] [Google Scholar]
- Bateman BT, Schmidt U, Berman MF, Bitnner EA, 2010. Temporal trends in the epidemiology of severe postoperative sepsis after elective surgery: a large, nationwide sample. Anesthesiology 112 (4), 917–925. [DOI] [PubMed] [Google Scholar]
- Bean JF, Kiely DK, Herman S, et al. , 2002. The relationship between leg power and physical performance in mobility limited elders. J. Am. Geriatr. Soc. 50, 461–467. [DOI] [PubMed] [Google Scholar]
- Bickel CS, Gregory CM, Dean JC, 2011. Motor unit recruitment during neuromuscular electrical stimulation: a critical appraisal. Eur. J. Appl. Physiol. 111 (10), 2399. [DOI] [PubMed] [Google Scholar]
- Boonstra MC, De Waal Malefijt MC, Verdonschot N, 2008. How to quantify knee function after total knee arthroplasty? Knee 15 (5), 390–395. [DOI] [PubMed] [Google Scholar]
- Briguet A, Courdier-Fruh I, Foster M, Meier T, Magyar JP, 2004. Histological parameters for the quantitative assessment of muscular dystrophy in the mdx-mouse. Neuromuscul. Disord. 14 (10), 675–682. [DOI] [PubMed] [Google Scholar]
- Brown OS, Hu L, Demetriou C, Smith TO, Hing CB, 2020. The effects of kinesiophobia on outcome following total knee replacement: a systematic review. Arch. Orthop. Trauma Surg. 140 (12), 2057–2070. [DOI] [PubMed] [Google Scholar]
- Callahan DM, Bedrin NG, Subramanian M, et al. , 2014a. Age-related structural alterations in human skeletal muscle fibers and mitochondria are sex-specific: relationship to single fiber function. J. Appl. Physiol. 116 (12), 1582–1592. [DOI] [PMC free article] [PubMed] [Google Scholar]
- Callahan DM, Miller MS, Sweeny AP, et al. , 2014b. Muscle disuse alters skeletal muscle contractile function at the molecular and cellular levels in older adult humans in a sex-specific manner. J. Physiol. 592 (20), 4555–4573. [DOI] [PMC free article] [PubMed] [Google Scholar]
- Day NJ, Kelly SS, Lui L-Y, et al. , 2024. Signatures of cysteine oxidation on muscle structural and contractile proteins are associated with physical performance and muscle function in older adults: study of muscle, mobility and aging (SOMMA). Aging Cell 23 (6), e14094. [DOI] [PMC free article] [PubMed] [Google Scholar]
- Demangel R, Treffel L, Py G, et al. , 2017. Early structural and functional signature of 3-day human skeletal muscle disuse using the dry immersion model. J. Physiol. 595 (13), 4301–4315. [DOI] [PMC free article] [PubMed] [Google Scholar]
- Eftimie R, Brenner HR, Buonanno A, 1991. Myogenin and MyoD join a family of skeletal muscle genes regulated by electrical activity. Proc. Natl. Acad. Sci. U. S. A. 88 (4), 1349–1353. [DOI] [PMC free article] [PubMed] [Google Scholar]
- Ethgen O, Bruyère O, Richy F, Dardennes C, Reginster J-Y, 2004. Health-related quality of life in total hip and total knee arthroplasty: a qualitative and systematic review of the literature. J Bone Joint Surg. 86 (5), 963–974. [DOI] [PubMed] [Google Scholar]
- Evans WJ, Lexell J, 1995. Human aging, muscle mass, and fiber type composition. J. Gerontol. A Biol. Sci. Med. Sci. 50A(Special Issue):11–16. [DOI] [PubMed] [Google Scholar]
- Gibson JNA, Smith K, Rennie MJ, 1988. Prevention of disuse muscle atrophy by means of electrical stimulation: maintenance of protein synthesis. Lancet 332 (8614), 767–770. [DOI] [PubMed] [Google Scholar]
- Gill TM, Allore HG, Gahbauer EA, Murphy TE, 2010. Change in disability after hospitalization or restricted activity in older persons. JAMA 304 (17), 1919–1928. [DOI] [PMC free article] [PubMed] [Google Scholar]
- Guigni BA, Callahan DM, Tourville TW, et al. , 2018. Skeletal muscle atrophy and dysfunction in breast cancer patients: role for chemotherapy-derived oxidant stress. Am. J. Physiol. Cell Physiol. 315 (5), C744–C756. [DOI] [PMC free article] [PubMed] [Google Scholar]
- Gundersen K, Leberer E, Lømo T, Pette D, Staron RS, 1988. Fibre types, calcium-sequestering proteins and metabolic enzymes in denervated and chronically stimulated muscles of the rat. J. Physiol. 398, 177–189. [DOI] [PMC free article] [PubMed] [Google Scholar]
- Harber MP, Konopka AR, Douglass MD, et al. , 2009. Aerobic exercise training improves whole muscle and single myofiber size and function in older women. American Journal of Physiology-Regulatory, Integrative and Comparative Physiology 297 (5), R1452–R1459. [DOI] [PMC free article] [PubMed] [Google Scholar]
- Harridge SDR, Bottinelli R, Canepari M, et al. , 1996. Whole-muscle and single-fibre contractile properties and myosin heavy chain isoforms in humans. Pflugers Arch-Eur J Physiol. 432, 913–920. [DOI] [PubMed] [Google Scholar]
- Henneman E, Somjen G, Carpenter DO, 1965. Functional significance of cell size in spinal motorneurons. J. Neurophysiol. 28 (3), 560–580. [DOI] [PubMed] [Google Scholar]
- Hepple RT, Rice CL, 2016. Innervation and neuromuscular control in ageing skeletal muscle. J. Physiol. 594 (8), 1965–1978. [DOI] [PMC free article] [PubMed] [Google Scholar]
- Huang CH, Cheng CK, Lee YT, Lee KS, 1996. Muscle strength after successful total knee replacement: a 6- to 13-year followup. Clin. Orthop. Relat. Res. 328, 147–154. [DOI] [PubMed] [Google Scholar]
- Hvid L, Aagaard P, Justesen L, et al. , 2010. Effects of aging on muscle mechanical function and muscle fiber morphology during short-term immobilization and subsequent retraining. J. Appl. Physiol. 109 (6), 1628–1634. [DOI] [PubMed] [Google Scholar]
- Hvid LG, Ørtenblad N, Aagaard P, Kjaer M, Suetta C, 2011. Effects of ageing on single muscle fibre contractile function following short-term immobilisation. J. Physiol. 589 (19), 4745–4757. [DOI] [PMC free article] [PubMed] [Google Scholar]
- Ivy JL, Withers RT, Brose G, Maxwell BD, Costill DL, 1981. Isokinetic contractile properties of the quadriceps with relation to fiber type. Eur. J. Appl. Physiol. Occup. Physiol. 47 (3), 247–255. [DOI] [PubMed] [Google Scholar]
- Kittelson AJ, Stackhouse SK, Stevens-Lapsley JE, 2013. Neuromuscular electrical stimulation after total joint arthroplasty: a critical review of recent controlled studies. Eur. J. Phys. Rehabil. Med. 49, 909–920. [PubMed] [Google Scholar]
- Kurtz S, Ong K, Lau E, Mowat F, Halpern M, 2007. Projections of primary and revision hip and knee arthroplasty in the United States from 2005 to 2030. J. Bone Joint Surg. 89 (4), 780–785. [DOI] [PubMed] [Google Scholar]
- Meier WA, Marcus RL, Dibble LE, et al. , 2009. The long-term contribution of muscle activation and muscle size to quadriceps weakness following total knee arthroplasty. J. Geriatr. Phys. Ther. 32, 79–82. [PubMed] [Google Scholar]
- Miller MS, VanBuren P, LeWinter MM, et al. , 2009. Mechanisms underlying skeletal muscle weakness in human heart failure: alterations in single fiber myosin protein content and function. Circ. Heart Fail. 2 (6), 700–706. [DOI] [PMC free article] [PubMed] [Google Scholar]
- Miller MS, VanBuren P, LeWinter MM, et al. , 2010. Chronic heart failure decreases cross-bridge kinetics in single skeletal muscle fibers from humans. J. Physiol. 588, 4039–4053. [DOI] [PMC free article] [PubMed] [Google Scholar]
- Miller MS, Callahan DM, Toth MJ, 2014. Skeletal muscle myofilament adaptations to aging, disease and disuse and their effects on whole muscle performance in older adult humans. Front. Physiol. 5, 369. [DOI] [PMC free article] [PubMed] [Google Scholar]
- Mizner RL, Petterson SC, Stevens JE, Vandenborne K, Snyder-Mackler L, 2005. Early quadriceps strength loss after total knee arthroplasty. The contributions of muscle atrophy and failure of voluntary muscle activation. J. Bone Joint Surg. 87 (5), 1047–1053. [DOI] [PMC free article] [PubMed] [Google Scholar]
- Murach KA, Dungan CM, Kosmac K, et al. , 2020. Fiber typing human skeletal muscle with fluorescent immunohistochemistry. J. Appl. Physiol. 127, 1632–1639. [DOI] [PMC free article] [PubMed] [Google Scholar]
- Pette D, 2001. Plasticity of mammalian skeletal muscle. J. Appl. Physiol. 90 (3), 1119–1124. [DOI] [PubMed] [Google Scholar]
- Raue U, Trappe TA, Estrem ST, et al. , 2012. Transcriptome signature of resistance exercise adaptations: mixed muscle and fiber type specific profiles in young and old adults. J. Appl. Physiol. (1985) 112 (10), 1625–1636. [DOI] [PMC free article] [PubMed] [Google Scholar]
- Rengo JL, Callahan DM, Savage PD, Ades PA, Toth MJ, 2016. Skeletal muscle ultrastructure and function in statin-tolerant individuals. Muscle Nerve 53, 242–251. [DOI] [PMC free article] [PubMed] [Google Scholar]
- Spector P, Laufer Y, Elboim Gabyzon M, Kittelson A, Stevens-Lapsley JE, Maffiuletti NA, 2016. Neuromuscular electrical stimulation therapy to restore quadriceps muscle function in patients after orthopaedic surgery: a novel structured approach. J. Bone Joint Surg. Am. 98 (23), 2017–2024. [DOI] [PubMed] [Google Scholar]
- Stevens-Lapsley JE, Balter JE, Wolfe P, Eckhoff DG, Kohrt WM, 2012. Early neuromuscular electrical stimulation to improve quadriceps muscle strength after total knee arthroplasty: a randomized controlled trial. Phys. Ther. 92 (2), 210–226. [DOI] [PMC free article] [PubMed] [Google Scholar]
- Thomas AC, Stevens-Lapsley JE, 2012. Importance of attenuating quadriceps activation deficits after total knee arthroplasty. Exerc. Sport Sci. Rev. 40, 95–101. [DOI] [PMC free article] [PubMed] [Google Scholar]
- Thomason DB, Biggs RB, Booth FW, 1989. Protein metabolism and ß-myosin heavy-chain mRNA in unweighted soleus muscle. Am. J. Physiol. 257, R300–R305. [DOI] [PubMed] [Google Scholar]
- Toth MJ, Gottlieb SS, Fisher ML, Poehlman ET, 1997. Skeletal muscle atrophy and peak oxygen consumption in heart failure. Am. J. Cardiol. 79, 1267–1269. [DOI] [PubMed] [Google Scholar]
- Toth MJ, Ades PA, Tischler MD, Tracy RP, LeWinter MM, 2006. Immune activation is associated with reduced skeletal muscle mass and physical function in chronic heart failure. Int. J. Cardiol. 109, 179–187. [DOI] [PubMed] [Google Scholar]
- Toth MJ, Voigt TB, Tourville TW, et al. , 2020a. Effect of neuromuscular electrical stimulation on skeletal muscle size and function in patients with breast cancer receiving chemotherapy. J. Appl. Physiol. 128, 1654–1665. [DOI] [PMC free article] [PubMed] [Google Scholar]
- Toth MJ, Tourville TW, Voigt TB, et al. , 2020b. Utility of neuromuscular electrical stimulation to preserve quadriceps size and function at the cellular level following anterior cruciate ligament injury and reconstruction: a randomized, sham-controlled, blinded trial. Am. J. Sports Med. 48, 2429–2437. [DOI] [PMC free article] [PubMed] [Google Scholar]
- Toth MJ, Savage PD, Voigt TB, et al. , 2022. Effects of total knee arthroplasty on skeletal muscle structure and function at the cellular, organellar, and molecular levels. J. Appl. Physiol. 133 (3), 647–660. [DOI] [PMC free article] [PubMed] [Google Scholar]
- Turk DC, Wilson HD, Cahana A, 2011. Treatment of chronic non-cancer pain. Lancet 377 (9784), 2226–2235. [DOI] [PubMed] [Google Scholar]
- van den Berg M, Shi Z, Claassen WJ, et al. , 2024. Super-relaxed myosins contribute to respiratory muscle hibernation in mechanically ventilated patients. Sci. Transl. Med. 16 (758), eadg3894. [DOI] [PMC free article] [PubMed] [Google Scholar]
- Walsh M, Woodhouse LJ, Thomas SG, Finch E, 1998. Physical impairments and functional limitations: a comparison of individuals 1 year after total knee arthroplasty with control subjects. Phys. Ther. 78 (3), 248–258. [DOI] [PubMed] [Google Scholar]
- Wen Y, Latham CM, Moore AN, et al. , 2023. Vitamin D status associates with skeletal muscle loss after anterior cruciate ligament reconstruction. JCI Insight 8 (23). [DOI] [PMC free article] [PubMed] [Google Scholar]
Associated Data
This section collects any data citations, data availability statements, or supplementary materials included in this article.