

Abstract
INTRODUCTION
We assessed pseudo‐continuous arterial spin labeling (pCASL) sensitivity to detect changes in cerebral blood flow (CBF) in adults with Down syndrome (DS) along the Alzheimer's disease (AD) continuum and explored the similarity with sporadic AD (sAD) hypoperfusion profile.
METHODS
Fifty‐one euploid cognitively unimpaired individuals, 54 adults with DS (34.54% symptomatic for AD), and 25 sAD patients underwent 3T magnetic resonance imaging. pCASL images were preprocessed using ASLprep. Analyses explored, globally and regionally, the effects of demographic variables, clinical stages, and AD biomarkers.
RESULTS
Age and sex differently impacted CBF in euploids versus the DS population. Asymptomatic DS showed temporo‐parietal hypoperfusion, extending into frontal areas in symptomatic cases. This pattern closely resembled sAD's pattern and correlated with AD biomarkers.
DISCUSSION
Adults with DS present CBF changes before symptom onset, primarily affecting posterior regions as in sAD. pCASL is a sensitive imaging modality that captures early AD‐related functional abnormalities in DS.
Highlights
Perfusion is negatively affected by age and correlates with Alzheimer's disease (AD) biomarkers in Down syndrome (DS).
Hypoperfusion in DS was observed even before the onset of the AD clinical symptoms.
The pattern of hypoperfusion in the DS population resembles the one observed in the sporadic AD population.
Keywords: Alzheimer's disease, arterial spin labeling, arterial transit time, brain perfusion, Down syndrome, magnetic resonance imaging, neuroimaging
1. BACKGROUND
Individuals with Down syndrome (DS) face an ultra‐risk of developing Alzheimer's disease (AD). 1 This heightened risk is primarily attributed to the triplication of chromosome 21, which contains the amyloid precursor protein (APP) gene. An overexpression of this gene is both necessary and sufficient to drive early‐onset AD pathology. 1 In individuals with DS, decreases in cerebrospinal fluid (CSF) amyloid beta (Aβ) begin to occur around age 30, 1 , 2 and both CSF and plasma tau levels follow by age 35. 1
While several studies have examined the pattern of gray matter (GM) atrophy associated with AD in individuals with DS, 3 , 4 , 5 , 6 , 7 there is limited knowledge about brain perfusion in this population. Yet, growing evidence in sporadic AD (sAD) indicates that early changes in cerebral blood flow (CBF) can be detected using arterial spin labeling magnetic resonance imaging (ASL‐MRI). 8 Indeed, previous studies consistently revealed reductions in CBF of ≈ 10% to 20% in sAD, often preceding detectable memory deficits. 9 , 10 These perfusion abnormalities are predominantly observed in regions typically affected by AD pathology, including the temporoparietal cortex, posterior cingulate, precuneus, and medial parietal cortex. 9 Moreover, these CBF reductions correlate with the severity of cognitive impairment and predict progression from normal cognition to mild cognitive impairment (MCI) and from MCI to AD. 9 , 11
To our knowledge, only one study has assessed brain perfusion in adults with DS using pulsed ASL‐MRI (pASL). This study reported a significant association between AD clinical severity and reduced total GM CBF. 12 Notably, the authors observed a steep decline in CBF by age 45 when analyzing its relationship to age. While these findings suggest that pASL can detect CBF changes in DS, the pathological correlates of these alterations and the regional pattern of brain perfusion associated with AD in adults with DS remain poorly understood. Additionally, changes in arterial transit time (ATT) have not yet been studied in the DS population. This ASL MRI parameter quantifies the time required for labeled blood to travel from the labeling plane to brain tissue and provides core information about early vascular dysfunction and perfusion efficiency.
The main aim of this study was to provide a comprehensive view of the topography of CBF and ATT alterations in individuals with DS along the AD continuum. Specifically, we used pseudo‐continuous ASL (pCASL) to characterize and compare the pattern of CBF and ATT alterations in DS at different clinical stages of AD to those observed in euploid cognitively unimpaired (eCU) individuals and sAD patients. We further investigated the effect of demographic factors, such as age and sex, on these regional ASL metrics and explored relationships with AD and cerebrovascular biomarkers to better understand their pathological substrates in sAD and DS.
2. METHODS
2.1. Study participants
This cross‐sectional study was conducted at a single center. Adults with DS aged ≥ 18 were recruited from the population‐based Down‐Alzheimer Barcelona Neuroimaging Initiative (DABNI). 13 The eCU individuals and patients with sAD were recruited from the Sant Pau Initiative on Neurodegeneration (SPIN) study. 14 Only participants with MRI scans that included both T1‐weighted and ASL imaging were included in the present study.
The Sant Pau Ethics Committee approved both projects following the standards for medical research in humans recommended by the Declaration of Helsinki. All participants or their legally authorized representatives gave written informed consent before enrolment for their medical information to be used for scientific research, following the local ethics committee guidelines.
2.2. Clinical and neuropsychological assessment
Participants were screened for apolipoprotein E (APOE) haplotype and underwent a comprehensive neurological and neuropsychological evaluation. For the DABNI cohort, this evaluation includes, among others, the Spanish version of the Cambridge Cognitive Examination for Older Adults with Down Syndrome (CAMCOG‐DS), a tool designed to assess global cognition by evaluating multiple cognitive domains such as orientation, language, memory, attention, praxis, abstract thinking, and perception. 15 , 16 Based on a consensus meeting involving both a neurologist and a neuropsychologist, masked from biomarker data, the DS participants were classified into distinct clinical groups. The classifications included: asymptomatic (aDS), for individuals without clinical or neuropsychological signs suggestive of cognitive impairment; prodromal stage (pDS), for those showing suggestive symptoms of cognitive impairment that do not meet dementia criteria; and dementia (dDS), for individuals with a clear diagnosis of cognitive impairment that leads to a loss of baseline functionality. 17 Additionally, some individuals were categorized as having an uncertain diagnosis or non–AD‐related neurocognitive disorder (i.e., a medical, pharmacological, or psychiatric condition interfering with cognition and/or activities of daily living, but no suspicion of AD). The Diagnostic and Statistical Manual of Mental Disorders, Fifth Edition, was used to stratify the level of intellectual disability (ID) of individuals with DS. Based on the individuals’ best‐ever level of functioning, it was classified as mild, moderate, or severe/profound. 18
Participants in the SPIN cohort underwent a standardized neuropsychological assessment to evaluate multiple cognitive domains, including episodic verbal memory, visual memory, attention, executive functions, visuoperceptive, and visuoconstructive abilities, as well as language. Additional evaluations included assessments of neuropsychiatric symptoms, functional impact, and global cognitive impairment. 19 The clinical diagnosis of the sporadic AD group, enabling the identification of individuals in the MCI and dementia stages of AD, was established following the National Institute on Aging–Alzheimer's Association (NIA‐AA) criteria. 20 , 21 In a subset of individuals with available fluid biomarkers, these biomarkers subsequently confirmed the presence of AD.
eCU participants were required to meet stringent inclusion criteria to ensure the absence of cognitive or neurological disorders. Participants were required to have a Clinical Dementia Rating (CDR) score of 0 and a Geriatric Depression Scale (GDS) score of 1, along with generally preserved cognition, as reflected by a Mini‐Mental State Examination (MMSE) score between 27 and 30 and/or a Free and Cued Selective Reminding Test (FCSRT) total immediate recall score > 7, no significant impairments in other cognitive domains, and no evidence of functional limitations in activities of daily living. 14
2.3. Neuroimaging data
2.3.1. MRI acquisition protocol
RESEARCH IN CONTEXT
Systematic review: Growing evidence suggests that changes in brain hypoperfusion precede cognitive deficits in Alzheimer's disease (AD). In individuals with Down syndrome (DS), a genetically determined form of AD, previous studies have demonstrated significantly reduced cerebral perfusion in individuals with dementia. However, the topography of these changes or their associations with metrics of disease severity have not yet been well established.
Interpretation: Hypoperfusion was found to increase with age and AD clinical progression in DS, correlating with cerebrospinal fluid biomarkers and hippocampal volume in the temporal lobe, the precuneus, supramarginal regions, and the middle frontal lobe. These findings suggest that reduced perfusion is intrinsically linked to the underlying AD pathophysiology in DS.
Future directions: Future studies should compare the sensitivity of pseudo‐continuous arterial spin labeling magnetic resonance imaging to other biomarkers of neurodegeneration in AD and investigate the longitudinal trajectory of hypoperfusion in adults with DS.
Participants underwent an MRI protocol at the Hospital Clinic (Barcelona, Spain) using a 3T Siemens‐Prisma scanner, from which a T1‐weighted (T1w), susceptibility weighted imaging (SWI), fluid‐attenuated inversion recovery (FLAIR), and ASL scans were acquired. T1w images were acquired using an echo time (TE) of 2.96 ms, repetition time (TR) of 2300 ms, and a slice thickness of 1 mm, resulting in a voxel size of 1 × 1 × 1 mm. SWI scans were obtained using a TE of 20 ms, TR of 26 ms, and slice thickness of 0.75 mm, yielding a voxel size of 0.8 × 0.8 × 0.8. FLAIR scans were obtained using a TE of 397 ms, TR of 6000 ms, and a slice thickness of 1 mm, yielding a voxel size of 1 × 1 × 1 mm. pCASL acquisition measured the resting state CBF and used a 3D gradient and spin echo (GRASE) background‐suppressed sequence. A total of 26 volumes were acquired, consisting of the M0 image followed by a dummy scan and 12 pairs of label‐control images. They featured TE of 31.68 ms, TR of 4100 ms, a slice thickness of 3.50 mm, a voxel size of 3.5 × 3.5 × 3.5 mm, a labeling duration of 700 ms, and multiple 12 post‐labeling delays (PLDs) of 500, 500, 1000, 1000, 1500, 1500, 2000, 2000, 2000, 2500, 2500, 2500 ms.
2.3.2. Quality control
A blind and randomized systematic visual inspection of the 4D pCASL images was conducted to ensure the quality of the acquisition. This assessment comprised three rounds of visual evaluation. The first round aimed to familiarize the rater (M.F.) with the dataset and identify various image artifacts, including motion, brain outside the field of view, and mirror artifact. 22 The second round focused on detecting motion artifacts, while the third round was conducted to ensure intra‐rater reliability with the two previous evaluations. Overall, the evaluations presented a high coincidence rate (98.7%) across all volumes from all subjects. Volumes categorized differently during the two rounds (35 volumes out of a total of 2760) were assessed visually one more time.
We used an in house–developed script to exclude the specific volumes exhibiting motion artifacts, which were present in < 10% of the participants. Because these artifacts can appear in some volumes but not others, we used a subsample of 20 participants with motion‐free pCASL acquisitions to determine how much volume deletion could be done without affecting CBF quantification. Results showed that, if at least one pair of control‐labeled volumes for each PLD was maintained, up to 7 out of 26 volumes could be removed without compromising the quantification. Subjects with insufficient volumes for adequate CBF quantification were subsequently excluded from the analysis. We additionally excluded any subjects with a quality evaluation index (QEI) inferior to 0.5. 23
2.3.3. MRI preprocessing and CBF/ATT quantification
The Computational Anatomy Toolbox (CAT12) for the Statistical Parametric Mapping 12 (SPM12; Welcome Center for Human Neuroimaging) toolbox was used to preprocess the structural T1w image and extract both the hippocampal volume and total intracranial volume (TIV). To account for different head sizes, hippocampal volume was divided by the TIV.
The processing and analysis of the pCASL data were carried out using the open‐source, publicly available ASLPrep software (version 7.2). 24 The anatomical preprocessing pipeline within ASLPrep integrates fMRIPrep (version 0.6.1), a robust structural MRI (sMRI) processing tool. 25 , 26 This pipeline performs essential preprocessing steps, including subject‐specific averaging, bias field correction, segmentation, and spatial normalization of the anatomical images. The ASL‐specific preprocessing workflow includes several steps to ensure data quality and accuracy: reference volume selection, motion estimation, co‐registration, and distortion correction. After these preprocessing steps, both CBF and ATT maps were generated using FSL's Bayesian Inference for Arterial Spin Labeling (BASIL) toolbox. 27 , 28 CBF reflects how much blood reaches the brain tissue and is expressed in mL/100 g/minute. It can be influenced by ATT, 29 which reflects the time it takes for blood to travel from the labeling region to the tissue, measured in seconds. In this study, CBF was adjusted for ATT using the BASIL toolbox, which performs this correction automatically for multiple PLD datasets. 30 Together, CBF and ATT offer complementary insights into the dynamics of cerebral perfusion.
Both maps were subsequently normalized to the Montreal Neurological Institute (MNI) 152 standard brain template and smoothed using a 12 mm full width half‐maximum Gaussian kernel, as used in previous studies in AD. 31
To ensure the highest data quality, all preprocessed ASL images underwent an additional visual inspection prior to inclusion in the analysis. To quantify global CBF and ATT, we extracted median values in individualized GM masks obtained from the T1w preprocessing step, using a gray matter probability > 0.3. To measure regional CBF and ATT, we extracted the median values for each region of interest (ROI) from the Desikan–Killiany–Tourville (DKT) atlas in the MNI space. To prevent contamination from voxels outside the field of view (due to some cut regions), only voxels with values > 0 were considered. Additionally, individual values were discarded for a given ROI if the coverage was < 75% (i.e., < 75% of values > 0).
2.3.4. Cerebrovascular lesions
The segmentation of white matter hyperintensities (WMHs) and cerebral microbleeds (MBs) followed protocols previously established by our group. 32 , 33 In short, FLAIR images were first co‐registered to their corresponding T1w scans using Advanced Normalization Tools (ANTs). The lesion prediction algorithm (LPA) from the Lesion Segmentation Toolbox for SPM12 was then used to generate WMH probability maps. These maps were binarized using a probability threshold of 0.3, and the total WMH volume was extracted. SWI data were processed to detect hypointense lesions indicative of MBs. Each suspected lesion was reviewed visually and classified according to established radiological characteristics. Finally, the participants were classified into two groups according to the presence or absence of MBs (MB positive or MB negative, respectively).
2.4. Fluid biomarkers
A subset of participants underwent, within 2 years of the MRI acquisition, a lumbar puncture to collect CSF, which included the concentrations of the ratio between Aβ peptide 42 and 40 (Aβ1–42/Aβ1–40), as well as tau phosphorylated at threonine 181 (p‐tau181). These biomarkers were quantified using a commercially available immunoassay on a fully automated platform (Lumipulse; Fujirebio Europe), according to a previously published protocol. 14 In the present study, the log‐transformed values of CSF Aβ1–42/Aβ1–40 and p‐tau181 were used to assess amyloid and tau pathology, respectively.
2.5. Statistical analysis
All statistical analyses were conducted using R software (version 4.0.4), Python (version 3.8), and MATLAB (version 2018a). Due to the limited sample size, individuals with DS at the prodromal and dementia stages (pDS and dDS, respectively), and euploid individuals at the MCI and dementia stages, were grouped as symptomatic DS (sDS) and sAD, respectively, for analysis. Baseline differences in sociodemographic characteristics among eCU, DS, and sAD participants were assessed with the R package “compareGroups,” which tests the normality of continuous variables and applies parametric (analysis of variance [ANOVA], followed by Tukey honestly significant difference [HSD] post hoc test) or non‐parametric (Kruskal–Wallis tests, followed by Dunn post hoc test) tests as appropriate. Chi‐squared tests were used for categorical variables, including sex, ID, and APOE ε4 status.
Given the normal distribution of global GM CBF and ATT data, parametric tests were applied throughout the statistical analysis. Linear regression analyses were first conducted to evaluate the relationship between both ASL metrics and age across groups, including eCU, DS (incorporating all DS participants regardless of their disease stage), and sAD. The effect of categorical variables (e.g., sex, presence of MBs, diagnostic group) on CBF and ATT was examined using either two‐sample t tests or ANOVA, followed by a post hoc pairwise Tukey HSD test. For the effect of diagnosis, we focused on three types of comparisons: (1) differences between the eCU group and non‐eCU groups (eCU vs. aDS, eCU vs. sDS, eCU vs. sAD), (2) the effect of AD clinical stage within DS (aDS vs. sDS), and (3) the difference between symptomatic patients with genetic versus sporadic AD (sDS vs. sAD). Finally, Pearson correlations and linear models were conducted to assess the relationships between both ASL metrics and AD biomarkers (i.e., CSF Aβ1–42/Aβ1–40 and p‐tau181, and hippocampal volume) in both the entire population and the non‐eCU subgroup (including the aDS, sDS, and sAD). The statistical significance was set at p = 0.05, with Bonferroni correction applied to account for multiple comparisons.
To investigate topographic associations with CBF and ATT, voxelwise analyses were conducted in SPM12 using smoothed and normalized images. These analyses mirrored those performed for global CBF. Thus, linear regression models and two‐sample t tests were performed to assess the relationship between CBF/ATT and age, sex, and AD biomarkers. Comparisons across diagnostic groups were assessed using a full‐factorial design. Sensitivity analyses, controlling for age and sex, were additionally performed.
Voxelwise analyses were performed within a GM mask, excluding non‐GM voxels, the cerebellum, as well as voxels not consistently acquired in all participants (due to scanner coverage issues). Multiple comparisons were corrected using a family‐wise error (FWE) threshold of p < 0.05 and a minimum cluster size of 500 mm3. To detect more subtle effects, voxelwise results were also presented at an uncorrected threshold of p < 0.005 with a cluster size of k > 500 mm3. Effect size metrics (i.e., R 2 for Pearson correlations, and Cohen's d for pairwise group comparisons) were computed in ROIs of the DKT atlas using the ggseg R package. 34
3. RESULTS
3.1. Sample composition
A total of 193 participants underwent a 3T MRI scan with both T1w and ASL images. After quality control, we excluded 17 eCU subjects, 29 participants with DS (n = 16 aDS, n = 13 sDS), and 17 sAD individuals. The final sample comprises 130 adults, including 51 eCU adults, 54 individuals with DS (n = 30 aDS, n = 19 sDS [36.84% with dementia], and 5 uDS), and 25 individuals with sAD (32% with dementia). Demographic data are presented in Table 1. The sAD group was significantly older (p < 0.001; median [interquartile range (IQR)]: 74.24 [67.40; 78.19]) than the eCU (57.06 [48.82; 65.12]) and DS (42.54 [37.11; 50.06]) groups. There were significant differences between groups in sex and APOE ε4 distributions (p = 0.046 and p = 0.014, respectively). Specifically, the eCU group had a greater proportion of females (66.67%) than the DS (42.59%) and sAD (56.00%) groups. And as expected, the sAD group had the highest proportion of APOE ε4 carriers (59.09%), followed by the eCU (36.84%) and DS (18.52%). Regarding vascular risk factors, hypertension was significantly more prevalent in the sAD group (80%) compared to the eCU (22.21%) and DS (5.56%) groups (p < 0.001). There were no significant differences for dyslipidemia (p = 0.5) or diabetes mellitus (p > 0.9).
TABLE 1.
Demographics and clinical data of the participants.
| eCU (N = 51) | DS (N = 54) | sAD (N = 25) | p value | |
|---|---|---|---|---|
| Age (Y) | 57.06 [48.82; 65.12] | 42.54 [37.11; 50.06] | 74.24 [67.40; 78.19] | <0.001 |
| Sex, no. | 0.046 | |||
| Female | 34 (66.67%) | 23 (42.59%) | 14 (56.00%) | |
| APOE4 status, no. (%) | 0.014 | |||
| Carrier | 14 (36.84%) | 5 (18.52%) | 13 (59.09%) | |
| Non‐carrier | 24 (63.16%) | 22 (81.48%) | 9 (40.91%) | |
| Hypertension, no. (%) | <0.001 | |||
| No | 14 (77.78%) | 51 (100.00%) | 2 (20.00%) | |
| Yes | 4 (22.22%) | 0 (0%) | 8 (80.00%) | |
| Dyslipidemia, no. (%) | 0.5 | |||
| No | 15 (83.33%) | 44 (86.27%) | 7 (70.00%) | |
| Yes | 3 (16.67%) | 7 (13.73%) | 3 (30.00%) | |
| Diabetes mellitus, no. (%) | >0.9 | |||
| No | 18 (100.00%) | 51 (98.08%) | 10.00 (100.00%) | |
| Yes | 0 (0%) | 1 (1.92%) | 0 (0%) | |
| AD biomarkers, median [IQR] | ||||
| CSF Aβ1–42/Aβ1–40 ratio (N = 82) | 0.10 [0.10; 0.11] | 0.06 [0.04; 0.09] | 0.04 [0.04; 0.05] | <0.001 |
| CSF p‐tau181 (N = 82) | 31.25 [27.18; 41.83] | 40.45 [19.80; 103.53] | 100.90 [73.55; 130.80] | <0.001 |
| Hippocampal volume/TIV (N = 127) | 0.0026 [0.0025; 0.0027] | 0.0023 [0.0021; 0.0025] | 0.0021 [0.0019; 0.0022] | <0.001 |
Abbreviations: Aβ, amyloid beta; AD, Alzheimer's disease; APOE, apolipoprotein E; CSF, cerebrospinal fluid; DS, Down syndrome; eCU, euploid cognitively unimpaired; IQR, interquartile range; p‐tau, phosphorylated tau; sAD, sporadic Alzheimer's disease; TIV, total intracranial volume.
CSF AD biomarker data were available for 82 participants. The sAD group had the lowest CSF Aβ1–42/Aβ1–40 ratio (0.04 [0.04; 0.05]), followed by the DS group (0.06 [0.04; 0.09]). These two groups also exhibited higher concentrations of p‐tau181 (100.90 [73.55; 130.80] and 40.45 [19.80; 103.53], respectively) and lower hippocampal volume (0.0021 [0.0019; 0.0022] and 0.0023 [0.0021; 0.0025], respectively) compared to the eCU group (p < 0.001). The detailed demographics of the DS group are presented in Table S1 in supporting information.
3.2. Effect of age
Age was negatively associated with median global GM CBF values in the eCU group (R 2 = 0.113, p = 0.02) but not in the DS and sAD groups (R 2 = 0.03; p = 0.2, R 2 = 0.03; p = 0.4, respectively; Figure 1A). Voxelwise analysis revealed a widespread effect of age in the eCU group, encompassing multiple prefrontal regions, the insula, superior, middle, and inferior temporal gyri, posterior cingulate, precuneus, superior parietal gyrus, lingual gyrus, and lateral occipital region (Figure 1C, top panel). The ROI‐based analysis showed that associations were the strongest in the medial and lateral prefrontal and temporal regions (Figure 1C, bottom panel). In DS, age‐related effects predominated in the left superior parietal gyrus and precuneus, and further included isolated clusters in the lingual and precentral gyri (Figure 1D, top panel). The highest R 2 values were primarily found in parieto‐occipital regions and medial superior frontal gyrus (Figure 1D, bottom panel). In the sAD group, only a small cluster in the inferior occipital was found to be correlated with age (Figure 1E, top panel). The greatest R 2 values were found in medial and orbitofrontal regions (Figure 1E, bottom panel).
FIGURE 1.
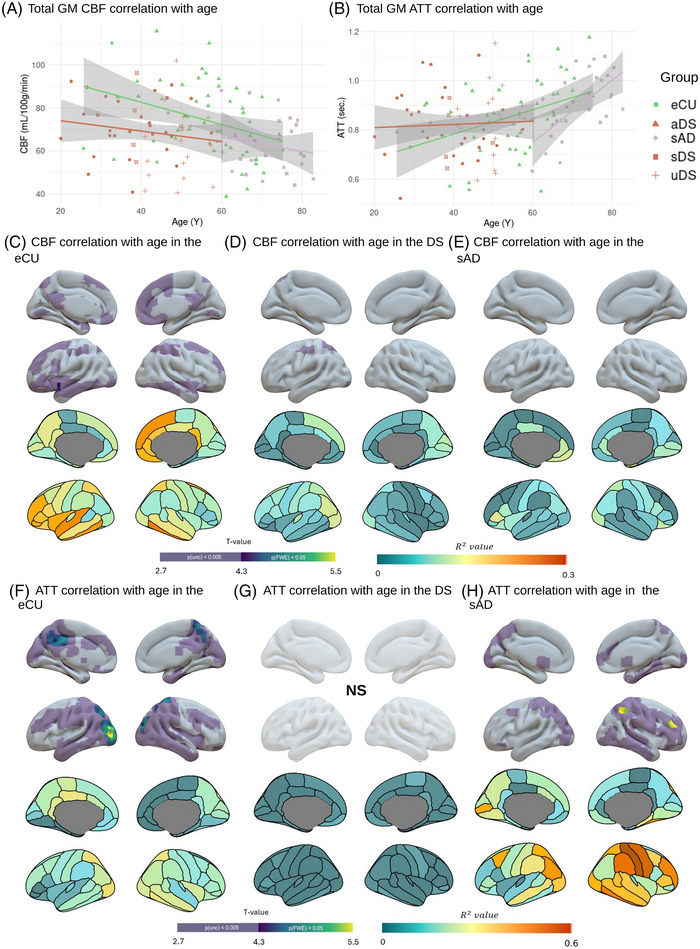
Effect of age on global and regional CBF and ATT. A, B, Scatterplot illustrating the association between age and global median GM CBF (A) and ATT (B) in the eCU (green), DS (red), and sAD (purple) groups. Data points represent individual subject values, regression lines depict group‐specific trends, and shaded areas indicate 95% confidence intervals. Within the DS group, subgroups are differentiated by shapes: aDS are represented as triangles, and sDS as squares. C–H, Results of voxelwise (top panel) and ROI (bottom panel) regression analyses showing the effect of age on CBF in eCU (B), DS (C), and sAD (D), and on ATT in eCU (F), DS (G), and sAD (H). Images are presented in neurological orientation and were generated using the SurfIce tool (top panel) and the ggseg R library (bottom panel). On top, the color scale indicates t values for both FWE‐corrected significance thresholds (p < 0.05, k > 500 mm3) and uncorrected thresholds (p < 0.005, k > 500 mm3). On the bottom, the color scale indicates the Pearson correlation coefficients (R 2 values). p(unc), p value for the uncorrected threshold. For detailed statistical values, see Table S2 in supporting information. AD, Alzheimer's disease; aDS, asymptomatic Down syndrome; ATT, arterial transit time; CBF, cerebral blood flow; DS, Down syndrome; eCU, euploid cognitively unimpaired; FWE, family wise error; GM, gray matter; ROI, region of interest; p‐tau, phosphorylated tau; sAD, sporadic Alzheimer's disease; sDS, symptomatic Down syndrome; TIV, total intracranial volume; uDS, uncertain Down syndrome.
Global ATT measures showed significant positive correlations with age in both the eCU and sAD groups (R2 = 0.20, p = 0.004; R 2 = 0.40, p = 0.001, respectively), but not in DS (R 2 = 0.002, p = 0.7; Figure 1B). Voxelwise analyses identified widespread age‐related correlations with ATT in eCU predominating in the medial and lateral occipito‐parietal cortex, and expanding to the lateral temporal lobe, insula, precentral gyrus, and putamen (Figure 1F, top panel). In DS, no significant voxelwise correlations were observed (Figure 1G, top panel). In sAD, associations encompassed right more than left parieto‐occipitotemporal and dorsolateral frontal regions (Figure 1H, top panel). ROI‐based analyses supported these findings, revealing the highest R 2 values primarily in the temporo‐parietal regions for the eCU group and in the inferior and superior parietal lobules for the sAD group (Figure 1F and Figure 1H, bottom panels, respectively). In DS, no R 2 values > 0.018 were found (Figure 1G, bottom panel).
3.3. Effect of sex
Significant differences in global GM CBF were observed between females and males in the eCU and sAD groups, with females showing significantly higher values than males (t = 3.54; p = 0.003 and t = 3.32; p = 0.01, respectively). No significant between sex difference was found in DS (t = 0.182; p = 1; Figure 2A).
FIGURE 2.

Effect of sex on global and regional CBF and ATT. A, B, Boxplot illustrating differences in GM perfusion (A) and ATT (B) between females (orange) and males (green) in the different diagnostic groups, that is, eCU, DS, and sAD. P values for between‐group differences were computed using a t test. C–H, Results of voxelwise (top panel) and ROI (bottom panel) analyses showing the effect of sex on CBF in eCU (C), DS (D), and sAD (E), and ATT in eCU (F), DS (G), and sAD (H). Images are presented in neurological orientation and were generated using the SurfIce tool (top panel) or the ggseg R library (bottom panel). On top, the color scale indicates t values for both FWE‐corrected significance thresholds (p < 0.05, k > 500 mm3) and uncorrected thresholds (p < 0.005 k > 500 mm3). On the bottom, the color scale represents the effect size of sex differences (Cohen's d). For detailed statistical values, see Table S2 in supporting information. ATT, arterial transit time; CBF, cerebral blood flow; DS, Down syndrome; eCU, euploid cognitively unimpaired; F, females; FWE, family wise error; GM, gray matter; M, males; ROI, region of interest; sAD, sporadic Alzheimer's disease.
When assessed voxelwise, eCU females showed higher perfusion than males across most brain structures (Figure 2C, top panel). Examination of Cohen's d indicated the greatest group differences in medial occipito‐parietal regions (Figure 2C, bottom panel). The opposite contrast (M > F) did not reveal any significant results. In DS, no regions exhibited a significant effect of sex in any direction (F > M nor M > F), except for a small cluster in the middle occipital lobe (Figure 2D, top panel). ROI analyses confirmed mostly small effect sizes (Cohen's d < 0.5), with females showing slightly higher perfusion in some occipito‐parietal and frontal regions, and males exhibiting slightly higher perfusion in the right temporal and orbitofrontal lobe (Figure 2D, bottom panel). In sAD, the effect of sex was most pronounced in the temporo‐occipito‐parietal regions in both the voxelwise and ROI analyses. Specifically, females showed greater CBF than males in the posterior and anterior cingulate cortex, precuneus, inferior and superior parietal, and the medial and lateral occipital lobes (Figure 2E). No significant results were found for the opposite contrast (M > F).
Between‐sex differences in ATT were minimal. At the global level, no significant differences between sexes were observed in any group (eCU: t = −1.33, p = 0.58; DS: t = −1.11, p = 0.81; sAD: t = −0.71, p = 1; Figure 2B). Voxelwise analyses revealed higher ATT in males than females in small clusters in the occipital pole, the calcarine and lingual gyri, the precuneus, middle cingulate, fusiform, and inferior temporal gyri in eCU (Figure 2F, top panel). In sAD, higher ATT in males than females was found in the calcarine, precuneus, angular, supramarginal gyrus, middle temporal, and occipital regions (Figure 2H, top panel), while the opposite contrast revealed a small cluster in the precentral gyrus (Figure S1 in supporting information). No regions showed a significant effect of sex in the DS group (Figure 2G, top panel). Overall, the effect sizes for ATT were smaller than those for CBF but consistently indicated a higher ATT in males than in females across most brain regions and in all groups. In eCU, the effects were the highest in the lateral occipital region and adjacent posterior regions. In sAD, the highest effect size was observed in the inferior parietal and isthmus cingulate, while no large effect size was observed in DS (Figure 2F–H, bottom panels).
3.4. Effect of the diagnostic group on global GM perfusion and ATT
Between‐group comparisons revealed significant differences in global GM perfusion (F = 5.16, p = 0.002, Figure 3A) but not ATT (F = 1.97, p = 0.12, Figure 3B). Specifically, the eCU group (median [IQR]: 73.0 mL/100 g/minute [61.3, 85.6]) showed significantly greater perfusion than the sDS (62.7 [51.5, 71.1], p = 0.02) and sAD (57.9 [52.4, 72.0], p = 0.007) groups, but not than aDS (70.6 [66.8, 81.6], p = 0.87). Additionally, no significant differences between sDS and sAD (p = 1) and aDS and sDS (p = 0.18). Regarding ATT, no significant difference was observed between the eCU (median [CI]: 0.859 seconds [0.783, 0.952]), aDS (0.797 [0.738, 0.881]), sDS (0.856 [0.786, 0.902]), and sAD (0.924 [0.835, 1.01]; all p > 0.11) groups.
FIGURE 3.

Between‐group differences and diagnostic group topographical distribution for total GM CBF and ATT. Boxplot illustrating differences in total GM CBF (A) and ATT (B) between diagnostic groups (eCU [red], aDS [green], sDS [blue], sAD [purple]) assessed using an analysis of variance followed by Tukey honestly significant difference test. C–J, Pattern of median perfusion in eCU (C), aDS (E), sDS (G), and sAD (I), and median ATT in eCU (D), aDS (F), sDS (H), and sAD (J). Results are presented in neurological convention and were generated using the SurfIce tool. The color scale indicates perfusion values in mL/100 g/minutes or ATT values in seconds. Statistically significant group differences are indicated by asterisks: * = p < 0.05, ** = p < 0.01, *** and **** = p < 0.001. aDS, asymptomatic Down syndrome; ATT, arterial transit time; CBF, cerebral blood flow; eCU, euploid cognitively unimpaired; GM, gray matter; sAD, sporadic Alzheimer's disease; sDS, symptomatic Down syndrome.
3.5. Pattern of CBF and ATT
The median CBF and ATT maps in each group are presented in Figure 3C–J. In eCU, brain regions showing the highest perfusion included the temporo‐parietal and frontal regions, such as the posterior middle and superior temporal, precuneus, inferior parietal, isthmus cingulate, and inferior frontal gyrus (Figure 3C). In aDS, the perfusion decreased across the whole brain, but the topography appeared relatively similar compared to eCU, with the highest perfusion predominating in the posterior superior temporal gyrus, posterior cingulate, inferior frontal gyrus, and medial occipital regions (Figure 3E). By contrast, both symptomatic groups (sDS and sAD) presented a clear reduction in perfusion, especially in temporoparietal structures (Figure 3G and Figure 3I, respectively).
Regarding ATT, we found that the eCU and aDS groups shared a similar ATT pattern (Figure 3D and Figure 3F, respectively), with the posterior parieto‐occipital showing higher ATT and the temporoparietal, insula, and medial frontal regions showing lower ATT. In symptomatic groups, the overall pattern was relatively preserved, even though an increased ATT was observed in parieto‐occipital areas, especially in the sAD group (Figure 3H,J).
3.6. Effect of the diagnostic group on regional CBF
Statistical between‐group comparisons showed a significant hypoperfusion in aDS compared to eCU in the posterior cingulate, inferior temporal and occipital region, amygdala, and orbitofrontal cortex (Figure 4A, left panel). This was further assessed using ROI analyses, which revealed moderate to strong effect sizes in the isthmus and rostral anterior cingulate, middle and inferior temporal gyri, as well as in the lateral occipital region (Figure 4A, right panel). The sDS group presented an extended pattern of hypoperfusion compared to the eCU group, notably in lateral temporo‐occipito‐parietal, medial parietal and medial frontal, posterior and anterior cingulate, and postcentral and precentral regions (Figure 4B, left panel). Effect sizes were overall large, and predominated in the superior and inferior parietal, supramarginal gyrus, and inferior and middle temporal and occipital cortex (Figure 4B, right panel). Similarly, a widespread pattern of hypoperfusion was noted in the sAD group. It predominated in fronto‐temporo‐parietal regions, including parts of the middle frontal gyrus, opercularis, and orbitalis regions; the inferior parietal, supramarginal, and isthmus cingulate areas; and superior and middle temporal regions, as well as some medial temporal lobe structures such as the parahippocampus (Figure 4C, left panel). Effect sizes were strongest in the inferior and middle temporal gyri, the rostral and caudal middle frontal, opercularis, and orbitalis regions (Figure 4C, right panel).
FIGURE 4.

Regional CBF and ATT differences across the clinical diagnosis. A–J, Results of voxelwise (left panel) and ROI (right panel) analyses examining differences in CBF between eCU > aDS (A), eCU > sDS (C), eCU > sAD (E), aDS > sDS (G), and sDS > sAD (I) and ATT differences between eCU < aDS (B), eCU < sDS (D), eCU < sAD (F), aDS > sDS (H), and sDS < sAD (J). Images are presented in neurological orientation and were generated using the SurfIce tool (left panel) or the ggseg R library (right panel). On the left, the color scale indicates t values for both FWE‐corrected significance thresholds (p < 0.05, k > 500 mm3) and uncorrected thresholds (p < 0.005, k > 500 mm3). On the right, the color scale represents the effect size of diagnostic group differences (Cohen's d). For detailed statistical values, see Table S3 in supporting information. aDS, asymptomatic Down syndrome; ATT, arterial transit time; CBF, cerebral blood flow; eCU, euploid cognitively unimpaired; FWE, family wise error; GM, gray matter; ROI, region of interest; sAD, sporadic Alzheimer's disease; sDS, symptomatic Down syndrome.
Comparisons between aDS and sDS revealed a significant decrease in perfusion in the angular gyrus, inferior parietal lobe, precuneus, and postcentral regions (Figure 4D, left panel). Effect sizes were the strongest in these regions, even though large effect sizes were also found in the frontal and occipital lobes (Figure 4D, right panel). Finally, the comparisons between the two symptomatic groups, sDS and sAD, showed minimal differences. Only a small cluster in the anterior part of the left inferior temporal lobe showed more CBF in sDS than sAD (Figure 4E, left panel). Effect size indicated higher perfusion in the temporal lobes in sDS versus higher perfusion in medial parietal regions in sAD (Figure 4E, right panel). Finally, aside from a small cluster in the superior frontal showing higher perfusion in aDS versus eCU (Figure S2 in supporting information), no patient group presented higher perfusion than the eCU group.
Sensitivity analyses including age and sex as covariates yielded results consistent with previous findings (Figure S3 in supporting information). Notably, this adjustment led to a more significant and extensive pattern of group differences between aDS and eCU, particularly in occipito‐parietal and frontal regions (Figure S3A). Conversely, it reduced the extent of hypoperfusion in sDS and sAD compared to eCU (Figure S3B, C). Differences between aDS versus sDS did not reach significance (Figure S3D), while comparisons between symptomatic groups remain limited (Figure S3E).
3.7. Effect of the diagnostic group on regional ATT
Comparisons of ATT between groups revealed limited differences in DS. Specifically, the eCU group had lower ATT values than the aDS group in small clusters in the superior and medial frontal regions (Figure 4F, left panel), and in the caudate and putamen compared to sDS (Figure 4G, left panel). The effect size of the group differences was smaller than the one observed for CBF and involved primarily the medial occipito‐temporal region in aDS (Figure 4F, right panel) and the parietal lobe in sDS (Figure 4G, right panel). A more extensive pattern of increased ATT was observed in sAD compared to eCU, primarily involving the temporo‐occipital regions, and expanding in the angular gyrus, precuneus, and posterior cingulate, and some clusters in the middle frontal gyrus (Figure 4H, left panel). Within the DS group, aDS had lower ATT than sDS in a small cluster in the right inferior temporal lobe (Figure 4I). Furthermore, the sDS group had lower ATT values than the sAD group in small clusters within the angular gyrus, inferior parietal, and inferior frontal triangularis (Figure 4J).
Analyses controlling for age and sex resulted in a more widespread pattern of lower ATT in eCU compared to aDS, encompassing medial parietal and dorsolateral frontal regions (Figure S3G). Comparisons between sDS versus eCU yield minimal differences (Figure S3H) while differences between eCU and sAD were more restricted to lateral parietal structures (Figure S3I). A similar pattern was observed between aDS and sDS, where aDS had a lower ATT than sDS in lateral parietal structures (Figure S3J). No significant differences were observed between symptomatic groups (Figure S3K).
3.8. Relationship to AD biomarkers
In the subset of participants that underwent a lumbar puncture (n = 82), we found a significant linear correlation (R 2 = 0.13; p < 0.001) between the global CBF and CSF Aβ1–42/Aβ1–40 levels (Figure 5A). Regional analysis revealed widespread correlation predominating in lateral temporo‐parietal and dorsolateral frontal cortex, and further encompassing the precuneus and posterior cingulate, the cuneus and several occipital regions (inferior, superior, and middle occipital gyri, and lingual gyrus), and the anterior medial temporal lobe (Figure 5B.1). When analyses were restricted to the non‐eCU group (n = 48, including n = 13 aDS, n = 15 sDS, n = 2 uDS, and n = 18 sAD), the global association that remained was not significant (R 2 = 0.06; p = 0.1) and the voxelwise analysis remained significant in the precuneus, anterior temporal, and dorsolateral frontal cortex (Figure 5C.1).
FIGURE 5.

Association between AD biomarkers and CBF. A–C, Scatterplots illustrating the association between global median GM perfusion and CSF Aβ1–42/Aβ1–40 ratio (A), CSF p‐tau181 (B), and hippocampal volume (adjusted by TIV; C). Data points represent individual subject values, regression lines depict group‐specific trends, with the dotted line for the association in the overall participants and the purple‐dashed line for the non‐eCU population only. Shaded areas indicate 95% confidence intervals. Shapes represent the diagnostic groups: eCU as triangles, aDS as circles, sDS as squares, uDS as crosses, and sAD as diamonds. Panels (D–F) and (G–I) show voxelwise (top) and ROI (bottom) analyses of the correlation between CBF and CSF Aβ1–42/Aβ1–40 ratio (D, G), CSF p‐tau181 (E, H), and hippocampal volume adjusted by TIV (F, I) in the entire population (D–F) and the non‐eCU group (G–I), respectively. Images are presented in neurological orientation and were generated using the SurfIce tool (top panel) or the ggseg R library (bottom panel). On top, the color scale indicates t values for both FWE‐corrected significance thresholds (p < 0.05, k > 500 mm3) and uncorrected thresholds (p < 0.005, k > 500 mm3). On the bottom, the color scale indicates the coefficient of determination (R 2 values). For detailed statistical values, see Table S4 in supporting information. Aβ, amyloid beta; AD, Alzheimer's disease; aDS, asymptomatic Down syndrome; ATT, arterial transit time; CBF, cerebral blood flow; CSF, cerebrospinal fluid; eCU, euploid cognitively unimpaired; FWE, family wise error; GM, gray matter; ROI, region of interest; p‐tau, phosphorylated tau; sAD, sporadic Alzheimer's disease; sDS, symptomatic Down syndrome; TIV, total intracranial volume; uDS, uncertain Down syndrome.
A significant negative correlation was observed between total CBF in GM and CSF p‐tau181 levels in the entire population (R2 = 0.08; p = 0.01) but not in the non‐eCU group alone (R = 0.04; p = 0.16; Figure 5A). Regional analyses were highly similar to those with CSF Aβ1–42/Aβ1–40 and included lateral temporo‐parietal and prefrontal regions in both the entire population (Figure 5B.2) and the non‐eCU group (Figure 5C.2).
Finally, we also assessed the relationship between CBF and hippocampal volume, a marker of neurodegeneration in AD. This measure was available for almost the whole cohort; only three eCU and two sDS subjects had missing data. Results showed that lower hippocampal volume was significantly associated with lower global CBF in the entire population (R 2 = 0.086, p = 0.004) but not in the non‐eCU group (R 2 = 0.005; p = 0.55; Figure 5A). Regional associations in the entire population showed topographical similarities to previous results, but most significant results occurred in the medial parietal lobe (Figure 5B.3). Associations restricted to the non‐eCU group were minimal (Figure 5C.3).
In the entire cohort, total ATT in GM was not significantly associated with CSF Aβ1–42/Aβ1–40 (R 2 = 0.01, p = 0.37) and p‐tau181 (R 2 = 0.03, p = 0.1), but did correlate with hippocampal volume (R 2 = 0.054, p = 0.001; Figure 6A). A similar pattern was observed when considering only the non‐eCU population (CSF Aβ1–42/Aβ1–40: R 2 = 0.03, p = 0.24; CSF p‐tau181: R 2 = 0.05, p = 0.1; hippocampal volume: R 2 = 0.12, p = 0.003). Voxelwise and ROI analysis showed associations involving mainly temporo‐occipital regions for the three biomarkers and further including medial and lateral parietal regions for CSF p‐tau181 and hippocampal volume (Figure 6B). As for the CBF, results with the non‐eCU were less significant and included mainly the anterior temporal and dorsolateral frontal cortex for CSF biomarkers. For the hippocampal volume, results were extended and mirrored those found in the entire population (Figure 6C).
FIGURE 6.

Association between AD biomarkers and ATT. A–C, Scatterplots illustrating the association between global median GM ATT and CSF Aβ1–42/Aβ1–40 ratio (A), CSF p‐tau181 (B), and hippocampal volume (adjusted by TIV; C). Data points represent individual subject values, regression lines depict group‐specific trends, with the dotted line for the association in the overall participants and the purple‐dashed line for the non‐eCU population only. Shaded areas indicate 95% confidence intervals. Shapes represent the diagnostic groups: eCU as triangles, aDS as circles, sDS as squares, uDS as crosses, and sAD as diamonds. Panels D–F and G–I show voxelwise (top) and ROI (bottom) analyses of the correlation between CBF and CSF Aβ1–42/Aβ1–40 ratio (D, G), CSF p‐tau181 (E, H), and hippocampal volume adjusted by TIV (F, I) in the entire population (D–F) and the non‐eCU group (G–I), respectively. Images are presented in neurological orientation and were generated using the SurfIce tool (top panel) or the ggseg R library (bottom panel). On top, the color scale indicates t values for both FWE‐corrected significance thresholds (p < 0.05, k > 500 mm3) and uncorrected thresholds (p < 0.005, k > 500 mm3). At the bottom, the color scale indicates the coefficient of determination (R 2 values). For detailed statistical values, see Table S4 in supporting information. Aβ, amyloid beta; AD, Alzheimer's disease; aDS, asymptomatic Down syndrome; ATT, arterial transit time; CBF, cerebral blood flow; CSF, cerebrospinal fluid; eCU, euploid cognitively unimpaired; FWE, family wise error; GM, gray matter; ROI, region of interest; p‐tau, phosphorylated tau; sAD, sporadic Alzheimer's disease; sDS, symptomatic Down syndrome; TIV, total intracranial volume; uDS, uncertain Down syndrome.
3.9. Correlation with vascular imaging features
We explored the relationship between the two ASL metrics and both the WMH volume and the presence of MBs. While total CBF in GM was not significantly correlated with WMH volume in the entire cohort (R 2 = 0.03, p = 0.09) or the non‐eCU group (R 2 = 0.032, p = 0.19; Figure S4A in supporting information), modest but significant associations were found with ATT (entire cohort: R 2 = 0.05, p = 0.026; non‐eCU group: R 2 = 0.06, p = 0.056; Figure S4B). Regarding MBs, their presence was associated with a significant reduction in both CBF (t = 2.11; p = 0.04; Figure S4C) and ATT (t = −2.96; p = 0.005; Figure S4D).
4. DISCUSSION
In the present study, we used a non‐invasive method, pCASL, to characterize the cerebral perfusion and ATT patterns in adults with DS along the AD continuum. Results revealed reduced brain perfusion in aDS compared to eCU participants, in the posterior cingulate and temporo‐occipital areas. At the symptomatic stage, individuals with DS presented a greater and more extensive pattern of cerebral hypoperfusion, with prominent involvement of the temporo‐parietal, cingulate, and dorsolateral frontal regions. This pattern of hypoperfusion largely overlapped with the one observed in sAD and included areas closely associated with AD pathology and biomarkers. Together, these results demonstrate that pCASL is a sensitive imaging modality to capture early functional abnormalities related to AD in adults with DS.
Our findings revealed an age‐related decrease in perfusion in eCU. Specifically, the CBF declined 0.52 units per year, and this loss predominated in the medial parietal and fronto‐temporal regions. These results are in line with previous studies showing a decrease in CBF in frontal and temporal regions with aging, particularly in the frontal cortex, superior temporal cortex, precuneus, hippocampus, and parahippocampus. 35 This reduction has been linked to common age‐related comorbidities, such as hypertension, 36 , 37 sedentary behavior, 38 and preclinical AD. 9 , 39 , 40 As previously reported, 29 we also observed an increase in ATT with age in the eCU population, mainly in the temporoparietal and occipital regions. The spatial overlap between age‐related CBF and ATT changes suggests that impaired cerebrovascular efficiency may be contributing to perfusion deficits.
The association with age and both CBF and ATT was much less evident in DS, suggesting that the variance in these metrics might be driven by pathological factors beyond aging. In sAD, ATT but not perfusion showed a strong association with age. This pattern may reflect the higher sensitivity of ATT versus perfusion to age‐related factors (e.g., hypertension, arterial stiffness). 41 , 42
Previous studies have reported sex differences in CBF, potentially driven by the influence of sex hormones on vascular responses 43 and/or the higher prevalence of vascular risk factors in males compared to females, 44 , 45 , 46 which are known to be negatively associated with brain perfusion. 47 , 48 Our results demonstrated greater GM CBF in females than males in both eCU and sAD. This effect predominated in occipito‐parietal regions but was consistent across the whole brain. These findings are in concordance with previous investigations showing that males have an extended pattern of reduced perfusion compared to females, while no regions present higher perfusion in males. 43 , 49 , 50 Although the exact cause of these differences is not yet fully understood, it has been proposed that estrogen levels may positively influence CBF, particularly in posterior brain regions, 51 with dehydroepiandrosterone sulfate potentially contributing to these sex‐related differences. 43 Interestingly, sex differences in ATT were modest but predominated in posterior regions in eCU and sAD, which could be consistent with a protective effect of estrogen on blood vessels. 52
In the DS population, we did not observe strong, significant differences between sexes in either global or regional CBF and ATT. Effect sizes were overall small to negligible, although they tended toward a higher perfusion in the occipito‐parietal areas. These results suggest that sexual dimorphism in CBF may be less prominent in DS than in the general population. This aligns with previous studies in adults with DS reporting limited sex differences across various neuroimaging and fluid biomarkers. 53 One possible explanation is the earlier onset of menopause in females with DS (average age ≈ 46 years), 54 compared to euploid females. 55 The associated decline in estrogen levels during this period might lead to a hypoestrogenic state, which has been previously associated with CBF decline in females. 56 Alternatively, hypothyroidism is significantly more prevalent in females with DS than males 53 and has been linked to reduced brain perfusion. 57 This comorbidity could diminish the neuroprotective effects of estrogen in the female brain, potentially explaining the diminished sex differences in CBF. 58 , 59 , 60 Finally, it is also possible that the lower prevalence of common vascular risk factors in individuals with DS compared to the euploid population 61 reduces the sex‐related differences in CBF typically attributed to these risks.
Individuals with sDS exhibited widespread hypoperfusion compared to eCU individuals. Regions primarily affected included the medial and lateral parietal lobes, cingulate cortex, posterior temporal, and dorsolateral frontal regions. Compared to the aDS group, the sDS showed hypoperfusion in the lateral parietal lobe and precuneus. This pattern largely mirrors the pattern of AD‐related brain hypometabolism reported in the DS population. 13 , 62 This overlap between glucose metabolism and perfusion was expected, as CBF underpins neuronal metabolism by delivering essential glucose and oxygen. 63
The topography of hypoperfusion in sDS and sAD was overall consistent. The statistical comparisons between the two groups revealed no significant differences, aside from a small cluster in the inferior temporal, showing greater hypoperfusion in sAD compared to sDS. This finding underscores the shared pathophysiological processes of AD in DS and other sporadic or genetic forms of AD. It is interesting to note that a closer inspection of the effect sizes suggested subtle regional variations: the DS group showed slightly lower perfusion in the parietal regions, while the sAD group exhibited lower perfusion in temporal and dorsolateral frontal regions. These topographical differences are similar to those reported in studies comparing atrophy 64 or tau positron emission tomography (PET) 65 in autosomal dominant AD versus sporadic AD, and may reflect specificities associated with genetic forms.
Regional perfusion changes were observed in aDS, indicating early functional alterations potentially associated with AD pathology. Compared to eCU individuals, aDS exhibited lower perfusion primarily in the posterior cingulate and posterior temporal lobes. When the statistical model was adjusted for age and sex, to account for the younger age of the aDS, these differences became more pronounced, particularly in the posterior cingulate, and extended to the lateral temporo‐occipital regions and dorsolateral prefrontal cortex. This pattern closely aligns with previous research indicating that the precuneus is one of the first regions showing reduced perfusion in AD. 66 Perfusion in these regions has also been associated with AD conversion in individuals with MCI. 67 These functional alterations likely reflect both the early presence of AD pathologies in these regions and diaschisis effects resulting from damage in medial temporal lobe structures. 68 , 69
Although we observed substantial reductions in cerebral perfusion in both aDS and sDS, ATT differences were relatively modest compared to eCU. Moreover, ATT did not show significant changes across AD clinical stages in DS. Similarly, after accounting for age, ATT differences were minimal comparing sAD to eCU. Together, these results may suggest that AD reduces the volume of blood delivered (i.e., decreases CBF) without highly impacting the rate at which blood arrives at the tissue (i.e., relative preservation of ATT). This profile might be explained by microvascular dysfunction affecting exchange at the tissue level (i.e., arterioles/capillaries) rather than large‐vessel arterial flow. It is well established that sporadic AD and DS are typically associated with cerebral amyloid angiopathy (CAA), which primarily affects small vessels by causing Aβ deposition in their walls. 70 , 71 , 72 Alternatively, the reduction in neuronal and synaptic activity related to neurodegeneration may be associated with a lower metabolic demand, resulting in decreased local blood flow. Future studies should further assess the interaction between both ASL metrics in the AD continuum and explore the influence of other factors specific to DS (e.g., lower blood pressure compared to the general population 73 ).
Our results also demonstrated that pathological hallmarks of AD and neurodegeneration were associated with CBF depletion and ATT increase. Indeed, both ASL metrics showed linear correlations with CSF Aβ1–42/Aβ1–40 and CSF p‐tau181 levels, and hippocampal volume. When assessing it in the entire population, associations with CBF were strong and included most brain regions showing hypoperfusion in symptomatic groups, that is, sDS and sAD. When restricted to the participants along the AD continuum, significant associations remained for CSF p‐tau181 and CSF Aβ1–42/Aβ1–40. This aligns with previous studies that have demonstrated that reductions in CBF are consistently associated with higher amyloid and tau burden, but not with hippocampal volume, 31 potentially reflecting the combined impact of these pathologies on cerebral perfusion.
Certain limitations of the present study must be acknowledged. First, our sample size was relatively modest, and we were not able to test the subtle effect of disease stages (e.g., the effect of prodromal AD) or explore non‐linear associations with age or AD biomarkers. While this warrants additional studies in larger cohorts, it is worth mentioning that we systematically presented effect sizes to limit bias in interpretations. Second, there is no universally accepted gold‐standard method for preprocessing ASL data, and further investigation is needed to ensure the reproducibility of our results across different preprocessing pipelines and research centers.
In summary, we found that brain perfusion is impaired in adults with DS along the AD continuum. At the symptomatic stage, the topography of hypoperfusion predominated in the temporoparietal and frontal regions and largely overlapped with the impairment found in sAD. Importantly, the brain perfusion in parietal structures differentiated aDS from sDS and was associated with various biomarkers of AD. These results demonstrated that pCASL can detect early functional changes related to AD in DS, which can have clinical implications for the monitoring of the disease. Additional studies are now needed to compare the sensitivity of pCASL to other functional imaging modalities (e.g., fluorodeoxyglucose PET) to detect AD stages and monitor disease progression.
CONFLICT OF INTEREST STATEMENT
J.F. reports receiving personal fees for service on the advisory boards, adjudication committees, or speaker honoraria from AC Immune, Adamed, Alzheon, Biogen, Eisai, Esteve, Fujirebio, Ionis, Laboratorios Carnot, Life Molecular Imaging, Lilly, Lundbeck, Perha, Roche, and Zambón, outside the submitted work. J.F. reports holding a patent for markers of synaptopathy in neurodegenerative disease (licensed to ADx, EPI8382175.0). M.R.A. has provided paid consultancy for Veranex. M.R.A. is a partner and director of production at Masima—Soluções em Imagens Médicas LTDA. A.L. has served as a consultant or on advisory boards for Almirall, Fujirebio‐Europe, Roche, Biogen, Grifols, Novartis, Otsuka, Eisai, Lilly, Nutricia, and Zambon. A.L. reports holding a patent for markers of synaptopathy in neurodegenerative disease (licensed to ADx, EPI8382175.0). D.A. participated on advisory boards from Fujirebio‐Europe, Roche Diagnostics, Grifols S.A., and Lilly, and received speaker honoraria from Fujirebio‐Europe, Roche Diagnostics, Nutricia, Krka Farmacéutica S.L., Zambon S.A.U., Neuraxpharm, Lilly, and Esteve Pharmaceuticals S.A. D.A. declares a filed patent application (WO2019175379 A1 Markers of synaptopathy in neurodegenerative disease). J.E.A.I. reports receiving personal fees for speaker honoraria from Roche outside the submitted work. The other authors declared no potential conflicts of interest. Author disclosures are available in the supporting information.
CONSENT STATEMENT
All participants and/or their legally authorized representatives gave written informed consent.
Supporting information
Supporting Information
Supporting Information
ACKNOWLEDGMENTS
The authors would like to thank all the participants with Down syndrome, their families, and their carers from the DABNI and SPIN cohorts for their support and dedication to this research. We also acknowledge the Fundació Catalana Síndrome de Down (https://fcsd.org/) for their global support. We also acknowledge the Support for Research Groups funding from the Department of Research and Universities from the Generalitat de Catalunya (2021 SGR 00979). This study was funded by the Fondo de Investigaciones Sanitario, Instituto de Salud Carlos III and co‐funded by the European Union (PI18/00335 and PI22/00758 to M.C.I., PI18/00435 and PI22/00611 to D.A., PI14/1561 and PI20/01330 to A.L., PI20/01473 to J.F., PI22/00307 to A.B., PI20/00836 to S.G.), the CIBERNED Program 1, the National Institutes of Health (NIH; 1R01AG056850‐01A1; 3RF1AG056850‐01S1; AG056850, R21AG056974, and R01AG061566 to J.F.), the Departament de Salut de la Generalitat de Catalunya, Fundación Tatiana Pérez de Guzmán el Bueno (IIBSP‐DOW‐2020‐151 to J.F. and S.G.), the European Union's Horizon 2020 “MES‐CoBraD” (H2020‐SC1‐BHC‐2018‐2020 / GA 965422 to J.F.), Brightfocus, and Life Molecular Imaging (LMI) to J.F. J.E.A.I. was supported by Instituto de Salud Carlos III through the Río Hortega Fellowship “CM22/00219” and co‐funded by the European Union. M.C.I. acknowledges support from the Alzheimer's Association (AARG‐22‐973966) and Global Brain Health Institute (GBHI_ALZ‐18‐543740). To S.G.the Jérôme Lejeune Foundation (#1913 Cycle 2019B), the Societat Catalana de Neurologia (Premi Beca Fundació SCN 2020). S.G. acknowledges support from the Global Brain Health Institute (GBHI_ALZ‐23‐971107), the Jérôme Lejeune Foundation (#1801 Cycle 2020 to S.G.). M.R.A. acknowledges support from Alzheimer's Association Research Fellowship to Promote Diversity (AARFD‐21‐852492). L.V.A. was supported by Instituto de Salud Carlos III through the Sara Borrell grant (SBCD23/00235) and co‐funded by the European Union. I.R.B. was supported by Instituto de Salud Carlos III through the Río Hortega Fellowship “CM22/00052” and co‐funded by the European Union. L.M.B. was supported by Instituto de Salut Carlos III through the Río Hortega Fellowhip “CM23/00291” and co‐funded by the European Union. A.B. acknowledges support from Instituto de Salud Carlos III through the Miguel Servet grant “CP20/00038” and co‐funded by the European Union, the Alzheimer's Association “AARG‐22‐923680,” and the Ajuntament de Barcelona, in collaboration with Fundació La Caixa (23S06157‐001). L.D.H.S. acknowledges support from Instituto de Salud Carlos III through the Miguel Servet grant CP24/00112 and co‐funded by the European Union, and the the Jérôme Lejeune Foundation (2326 ‐ GRT‐2024A).
Franquesa‐Mullerat M, Morcillo‐Nieto AO, Arriola‐Infante JE, et al. Study of brain perfusion in adults with Down syndrome along the Alzheimer's disease continuum. Alzheimer's Dement. 2025;21:e70581. 10.1002/alz.70581
REFERENCES
- 1. Fortea J, Zaman SH, Hartley S, Rafii MS, Head E, Carmona‐Iragui M. Alzheimer's disease associated with Down syndrome: a genetic form of dementia. Lancet Neurol. 2021;20:930‐942. doi: 10.1016/S1474-4422(21)00245-3/ATTACHMENT/714B8757-6081-4FDC-B7E0-B699BA47320E/MMC1.PDF [DOI] [PMC free article] [PubMed] [Google Scholar]
- 2. McCarron M, McCallion P, Reilly E, Dunne P, Carroll R, Mulryan N. A prospective 20‐year longitudinal follow‐up of dementia in persons with Down syndrome. J Intellect Disabil Res. 2017;61:843‐852. doi: 10.1111/JIR.12390 [DOI] [PubMed] [Google Scholar]
- 3. Anderson VM, Schott JM, Bartlett JW, Leung KK, Miller DH, Fox NC. Gray matter atrophy rate as a marker of disease progression in AD. Neurobiol Aging. 2012;33:1194‐1202. doi: 10.1016/J.NEUROBIOLAGING.2010.11.001 [DOI] [PMC free article] [PubMed] [Google Scholar]
- 4. Padilla C, Montal V, Walpert MJ, et al. Cortical atrophy and amyloid and tau deposition in Down syndrome: a longitudinal study. Alzheimer's Dement Diagnosis, Assess Dis Monit. 2022;14:e12288. doi: 10.1002/DAD2.12288 [DOI] [PMC free article] [PubMed] [Google Scholar]
- 5. Teipel SJ, Alexander GE, Schapiro MB, Möller HJ, Rapoport SI, Hampel H. Age‐related cortical grey matter reductions in non‐demented Down's syndrome adults determined by MRI with voxel‐based morphometry. Brain. 2004;127:811‐824. doi: 10.1093/BRAIN/AWH101 [DOI] [PubMed] [Google Scholar]
- 6. Teipel SJ, Hampel H. Neuroanatomy of Down syndrome in vivo: a model of preclinical Alzheimer's disease. Behav Genet. 2006;36:405‐415. doi: 10.1007/S10519-006-9047-X [DOI] [PubMed] [Google Scholar]
- 7. Buehner BJ, Morcillo‐Nieto AO, Zsadanyi SE, et al. Medial temporal lobe atrophy in Down syndrome along the Alzheimer's disease continuum. Brain 2025;148(7):2509‐2521. doi: 10.1093/BRAIN/AWAF133 [DOI] [PMC free article] [PubMed] [Google Scholar]
- 8. Grade M, Hernandez Tamames JA, Pizzini FB, Achten E, Golay X, Smits M. A neuroradiologist's guide to arterial spin labeling MRI in clinical practice. Neuroradiol. 2015;57:1181‐1202. doi: 10.1007/S00234-015-1571-Z [DOI] [PMC free article] [PubMed] [Google Scholar]
- 9. Wierenga CE, Hays CC, Zlatar ZZ. Cerebral blood flow measured by arterial spin labeling MRI as a preclinical marker of Alzheimer's disease. J Alzheimers Dis. 2014;42 Suppl 4:S411‐S419. doi: 10.3233/JAD-141467 [DOI] [PMC free article] [PubMed] [Google Scholar]
- 10. Bracko O, Cruz Hernández JC, Park L, Nishimura N, Schaffer CB. Causes and consequences of baseline cerebral blood flow reductions in Alzheimer's disease. J Cereb Blood Flow Metab. 2021;41(7):1501‐1516. doi: 10.1177/0271678x20982383 [DOI] [PMC free article] [PubMed] [Google Scholar]
- 11. Chao LL, Buckley ST, Kornak J, et al. ASL perfusion MRI predicts cognitive decline and conversion from MCI to dementia. Alzheimer Dis Assoc Disord. 2010;24:19‐27. doi: 10.1097/WAD.0B013E3181B4F736 [DOI] [PMC free article] [PubMed] [Google Scholar]
- 12. Thalman S, Van Pelt KL, Lin AL, et al. A preliminary study of cerebral blood flow, aging and dementia in people with Down syndrome. J Intellect Disabil Res. 2020;64:934‐945. doi: 10.1111/JIR.12784 [DOI] [PMC free article] [PubMed] [Google Scholar]
- 13. Fortea J, Vilaplana E, Carmona‐Iragui M, et al. Clinical and biomarker changes of Alzheimer's disease in adults with Down syndrome: a cross‐sectional study. Lancet. 2020;395:1988‐1997. doi: 10.1016/S0140-6736(20)30689-9 [DOI] [PMC free article] [PubMed] [Google Scholar]
- 14. Alcolea D, Clarimón J, Carmona‐Iragui M, et al. The Sant Pau Initiative on Neurodegeneration (SPIN) cohort: A data set for biomarker discovery and validation in neurodegenerative disorders. Alzheimer's Dement. 2019;5:597‐609. doi: 10.1016/J.TRCI.2019.09.005 [DOI] [PMC free article] [PubMed] [Google Scholar]
- 15. Hon J, Huppert FA, Holland AJ, Watson P. Neuropsychological assessment of older adults with Down's syndrome: an epidemiological study using the Cambridge Cognitive Examination (CAMCOG). Br J Clin Psychol. 1999;38:155‐165. doi: 10.1348/014466599162719 [DOI] [PubMed] [Google Scholar]
- 16. Esteba Castillo S, Dalmau‐Bueno A, Vilá Alsina M, García Alba J, Ribas Vidal N, Novell R. Adaptación y validación del Cambridge Examination for Mental Disorders of Older People with Down's Syndrome and Others with Intellectual Disabilities (CAMDEX‐DS) en población española con discapacidad intelectual. Rev Neurol. 2013;57:337‐346. [PubMed] [Google Scholar]
- 17. Fortea J, Carmona‐Iragui M, Benejam B, et al. Plasma and CSF biomarkers for the diagnosis of Alzheimer's disease in adults with Down syndrome: a cross‐sectional study. Lancet Neurol. 2018;17:860‐869. doi: 10.1016/S1474-4422(18)30285-0 [DOI] [PubMed] [Google Scholar]
- 18. Regier DA, Kuhl EA, Kupfer DJ. The DSM‐5: classification and criteria changes. World Psychiatry. 2013;12:92‐98. doi: 10.1002/WPS.20050 [DOI] [PMC free article] [PubMed] [Google Scholar]
- 19. Sala I, Illán‐Gala I, Alcolea D, et al. Diagnostic and prognostic value of the combination of two measures of verbal memory in mild cognitive impairment due to Alzheimer's disease. J Alzheimers Dis. 2017;58:909‐918. doi: 10.3233/JAD-170073 [DOI] [PubMed] [Google Scholar]
- 20. Albert MS, DeKosky ST, Dickson D, et al. The diagnosis of mild cognitive impairment due to Alzheimer's disease: recommendations from the National Institute on Aging‐Alzheimer's Association workgroups on diagnostic guidelines for Alzheimer's disease. Alzheimers Dement. 2011;7:270‐279. doi: 10.1016/J.JALZ.2011.03.008 [DOI] [PMC free article] [PubMed] [Google Scholar]
- 21. McKhann GM, Knopman DS, Chertkow H, et al. The diagnosis of dementia due to Alzheimer's disease: recommendations from the National Institute on Aging‐Alzheimer's Association workgroups on diagnostic guidelines for Alzheimer's disease. Alzheimers Dement. 2011;7:263‐269. doi: 10.1016/J.JALZ.2011.03.005 [DOI] [PMC free article] [PubMed] [Google Scholar]
- 22. Jaganmohan D, Pan S, Kesavadas C, Thomas B. A pictorial review of brain arterial spin labelling artefacts and their potential remedies in clinical studies. Neuroradiol J. 2020;34:154‐168. doi: 10.1177/1971400920977031 [DOI] [PMC free article] [PubMed] [Google Scholar]
- 23. Dolui S, Wang Z, Wolf RL, et al. Automated quality evaluation index for arterial spin labeling derived cerebral blood flow maps. J Magn Reson Imaging. 2024;60:2497‐2508. doi: 10.1002/JMRI.29308;REQUESTEDJOURNAL:JOURNAL:15222586;WGROUP:STRING:PUBLICATION [DOI] [PMC free article] [PubMed] [Google Scholar]
- 24. Adebimpe A, Bertolero M, Dolui S, et al. ASLPrep: a platform for processing of arterial spin labeled MRI and quantification of regional brain perfusion. Nat Methods. 2022;19:683‐686. doi: 10.1038/s41592-022-01458-7 [DOI] [PMC free article] [PubMed] [Google Scholar]
- 25. Esteban O, Markiewicz CJ, Blair RW, et al. fMRIPrep: a robust preprocessing pipeline for functional MRI. Nat Methods. 2019;16:111‐116. doi: 10.1038/S41592-018-0235-4 [DOI] [PMC free article] [PubMed] [Google Scholar]
- 26. Esteban O, Ciric R, Finc K, et al. Analysis of task‐based functional MRI data preprocessed with fMRIPrep. Nat Protoc. 2020;15:2186‐2202. doi: 10.1038/s41596-020-0327-3 [DOI] [PMC free article] [PubMed] [Google Scholar]
- 27. Chappell MA, Groves AR, Whitcher B, Woolrich MW. Variational Bayesian inference for a nonlinear forward model. IEEE Trans Signal Process. 2009;57:223‐236. doi: 10.1109/TSP.2008.2005752 [DOI] [Google Scholar]
- 28. Chappell MA, Kirk TF, Craig MS, et al. BASIL: A toolbox for perfusion quantification using arterial spin labelling. Imaging Neurosci. 2023;1:1‐16. doi: 10.1162/IMAG_A_00041 [DOI] [PMC free article] [PubMed] [Google Scholar]
- 29. Zhang Z, Riley E, Chen S, et al. Age and gender‐related patterns of arterial transit time and cerebral blood flow in healthy adults. Neuroimage. 2025;309:121098. doi: 10.1016/J.NEUROIMAGE.2025.121098 [DOI] [PubMed] [Google Scholar]
- 30. BASIL documentation . Perfusion Quantification using Arterial Spin Labelling MRI. ASL Analysis Guide (Accessed July 11, 2025) https://asl‐docs.readthedocs.io/en/latest/analysis_guide.html
- 31. Falcon C, Montesinos P, Václavů L, et al. Time‐encoded ASL reveals lower cerebral blood flow in the early AD continuum. Alzheimer's Dement. 2024;20:5183‐5197. doi: 10.1002/ALZ.14059;SUBPAGE:STRING:FULL [DOI] [PMC free article] [PubMed] [Google Scholar]
- 32. Morcillo‐Nieto AO, Zsadanyi SE, Arriola‐Infante JE, et al. Characterization of white matter hyperintensities in Down syndrome. Alzheimer's Dement. 2024;20:6527‐6541. doi: 10.1002/ALZ.14146;PAGEGROUP:STRING:PUBLICATION [DOI] [PMC free article] [PubMed] [Google Scholar]
- 33. Zsadanyi SE, Morcillo‐Nieto AO, Aranha MR, et al. ASSOCIATIONS of microbleeds and their topography with imaging and CSF biomarkers of Alzheimer pathology in individuals with Down syndrome. Neurology. 2024;103:e209676. doi: 10.1212/WNL.0000000000209676/SUPPL_FILE/SUPPLEMENT.PDF [DOI] [PMC free article] [PubMed] [Google Scholar]
- 34. Mowinckel AM, Vidal‐Piñeiro D. Visualization of brain statistics With R packages ggseg and ggseg3d. Adv Methods Pract Psychol Sci. 2020;3:466‐483. doi: 10.1177/2515245920928009/ASSET/IMAGES/LARGE/10.1177_2515245920928009-FIG8.JPEG [DOI] [Google Scholar]
- 35. Wierenga CE, Clark LR, Dev SI, et al. Interaction of age and APOE genotype on cerebral blood flow at rest. J Alzheimers Dis. 2013;34:921. doi: 10.3233/JAD-121897 [DOI] [PMC free article] [PubMed] [Google Scholar]
- 36. Lipsitz LA, Gagnon M, Vyas M, et al. Antihypertensive therapy increases cerebral blood flow and carotid distensibility in hypertensive elderly subjects. Hypertens. 2005;45:216‐221. doi: 10.1161/01.HYP.0000153094.09615.11 [DOI] [PubMed] [Google Scholar]
- 37. de la Torre JC. Cerebral perfusion enhancing interventions: a new strategy for the prevention of Alzheimer dementia. Brain Pathol. 2016;26:618‐631. doi: 10.1111/BPA.12405 [DOI] [PMC free article] [PubMed] [Google Scholar]
- 38. Zlatar ZZ, Hays CC, Mestre Z, et al. Dose‐dependent association of accelerometer‐measured physical activity and sedentary time with brain perfusion in aging. Exp Gerontol. 2019;125. doi: 10.1016/J.EXGER.2019.110679 [DOI] [PMC free article] [PubMed] [Google Scholar]
- 39. Bangen KJ, Clark AL, Edmonds EC, et al. Cerebral blood flow and amyloid‐β interact to affect memory performance in cognitively normal older adults. Front Aging Neurosci. 2017;9:260001. doi: 10.3389/FNAGI.2017.00181/BIBTEX [DOI] [PMC free article] [PubMed] [Google Scholar]
- 40. Austin BP, Nair VA, Meier TB, et al. Effects of Hypoperfusion in Alzheimer's Disease. J Alzheimer's Dis. 2011;26:123. doi: 10.3233/JAD-2011-0010 [DOI] [PMC free article] [PubMed] [Google Scholar]
- 41. Tarumi T, Zhang R. Cerebral blood flow in normal aging adults: cardiovascular determinants, clinical implications, and aerobic fitness. J Neurochem. 2017;144:595. doi: 10.1111/JNC.14234 [DOI] [PMC free article] [PubMed] [Google Scholar]
- 42. Feron J, Segaert K, Rahman F, et al. Determinants of cerebral blood flow and arterial transit time in healthy older adults. Aging. 2024;16:12473. doi: 10.18632/AGING.206112 [DOI] [PMC free article] [PubMed] [Google Scholar]
- 43. Ghisleni C, Bollmann S, Biason‐Lauber A, et al. Effects of steroid hormones on sex differences in cerebral perfusion. PLoS One. 2015;10. doi: 10.1371/JOURNAL.PONE.0135827 [DOI] [PMC free article] [PubMed] [Google Scholar]
- 44. Wakabayashi I. Gender differences in cardiovascular risk factors in patients with coronary artery disease and those with type 2 diabetes. J Thorac Dis. 2017;9:E503. doi: 10.21037/JTD.2017.04.30 [DOI] [PMC free article] [PubMed] [Google Scholar]
- 45. Andersen KK, Andersen ZJ, Olsen TS. Age‐ and gender‐specific prevalence of cardiovascular risk factors in 40 102 patients with first‐ever ischemic stroke: A Nationwide Danish Study. Stroke. 2010;41:2768‐2774. doi: 10.1161/STROKEAHA.110.595785/ASSET/5C3F5756-9372-468F-98CD-8AB2819E4D3E/ASSETS/GRAPHIC/10FF4.JPEG [DOI] [PubMed] [Google Scholar]
- 46. Sur NB. Navigating the intersection of sex, vascular risk factors, and cognitive decline. JACC Adv. 2024;3:100929. doi: 10.1016/J.JACADV.2024.100929 [DOI] [PMC free article] [PubMed] [Google Scholar]
- 47. Kitagawa K, Oku N, Kimura Y, et al. Relationship between cerebral blood flow and later cognitive decline in hypertensive patients with cerebral small vessel disease. Hypertens Res. 2009;32:816‐820. doi: 10.1038/hr.2009.100 [DOI] [PubMed] [Google Scholar]
- 48. De La Torre JC. Cardiovascular risk factors promote brain hypoperfusion leading to cognitive decline and dementia. Cardiovasc Psychiatry Neurol. 2012;2012:367516. doi: 10.1155/2012/367516 [DOI] [PMC free article] [PubMed] [Google Scholar]
- 49. Mazzucco S, Li L, Tuna MA, Rothwell PM. Age‐specific sex‐differences in cerebral blood flow velocity in relation to haemoglobin levels. Eur Stroke J. 2024;9:772‐780. doi: 10.1177/23969873241245631 [DOI] [PMC free article] [PubMed] [Google Scholar]
- 50. Muer JD, Didier KD, Wannebo BM, et al. Sex differences in gray matter, white matter, and regional brain perfusion in young, healthy adults. Am J Physiol Heart Circ Physiol. 2024;327. doi: 10.1152/AJPHEART.00341.2024 [DOI] [PMC free article] [PubMed] [Google Scholar]
- 51. Cote S, Butler R, Michaud V, et al. The regional effect of serum hormone levels on cerebral blood flow in healthy nonpregnant women. Hum Brain Mapp. 2021;42:5677‐5688. doi: 10.1002/HBM.25646 [DOI] [PMC free article] [PubMed] [Google Scholar]
- 52. Robison LS, Gannon OJ, Salinero AE, Zuloaga KL. Contributions of sex to cerebrovascular function and pathology. Brain Res. 2019;1710:43‐60. doi: 10.1016/J.BRAINRES.2018.12.030 [DOI] [PubMed] [Google Scholar]
- 53. Iulita MF, Bejanin A, Vilaplana E, et al. Association of biological sex with clinical outcomes and biomarkers of Alzheimer's disease in adults with Down syndrome. Brain Commun. 2023;5. doi: 10.1093/BRAINCOMMS/FCAD074 [DOI] [PMC free article] [PubMed] [Google Scholar]
- 54. Seltzer GB, Schupf N, Wu HS. A prospective study of menopause in women with Down's syndrome. J Intellect Disabil Res. 2001;45:1‐7. doi: 10.1046/J.1365-2788.2001.00286.X [DOI] [PubMed] [Google Scholar]
- 55. Esbensen AJ. Health conditions associated with aging and end of life of adults with Down syndrome. Int Rev Res Ment Retard. 2010;39:107‐126. doi: 10.1016/S0074-7750(10)39004-5 [DOI] [PMC free article] [PubMed] [Google Scholar]
- 56. Greene RA. Estrogen and cerebral blood flow: a mechanism to explain the impact of estrogen on the incidence and treatment of Alzheimer's disease. Int J Fertil Womens Med. 2000;45:253‐257. [PubMed] [Google Scholar]
- 57. Pak K, Kim M, Kim K, Kim BH, Kim SJ, Kim IJ. Cerebral glucose metabolism and Cerebral blood flow in thyroid dysfunction: an activation likelihood estimation meta‐analysis. Sci Reports. 2020;10:1‐6. doi: 10.1038/s41598-020-58255-5 [DOI] [PMC free article] [PubMed] [Google Scholar]
- 58. Spampinato SF, Molinaro G, Merlo S, et al. Estrogen receptors and type 1 metabotropic glutamate receptors are interdependent in protecting cortical neurons against β‐amyloid toxicity. Mol Pharmacol. 2012;81:12‐20. doi: 10.1124/MOL.111.074021 [DOI] [PubMed] [Google Scholar]
- 59. Liang K, Yang L, Yin C, et al. Estrogen stimulates degradation of β‐amyloid peptide by Up‐regulating neprilysin. J Biol Chem. 2010;285:935‐942. doi: 10.1074/JBC.M109.051664 [DOI] [PMC free article] [PubMed] [Google Scholar]
- 60. Amtul Z, Wang L, Westaway D, Rozmahel RF. Neuroprotective mechanism conferred by 17beta‐estradiol on the biochemical basis of Alzheimer's disease. Neuroscience. 2010;169:781‐786. doi: 10.1016/J.NEUROSCIENCE.2010.05.031 [DOI] [PubMed] [Google Scholar]
- 61. Carmona‐Iragui M, Videla L, Lleó A, Fortea J. Down syndrome, Alzheimer disease, and cerebral amyloid angiopathy: The complex triangle of brain amyloidosis. Dev Neurobiol. 2019;79:716‐737. doi: 10.1002/DNEU.22709 [DOI] [PubMed] [Google Scholar]
- 62. Arriola‐Infante JE, Morcillo‐Nieto AO, Zsadanyi SE, et al. Regional brain metabolism across the Alzheimer's disease continuum in Down syndrome. Ann Neurol. 2025:1‐11. doi: 10.1002/ANA.27226 [DOI] [PMC free article] [PubMed] [Google Scholar]
- 63. Fantini S, Sassaroli A, Tgavalekos KT, Kornbluth J. Cerebral blood flow and autoregulation: current measurement techniques and prospects for noninvasive optical methods. Neurophotonics. 2016;3:031411. doi: 10.1117/1.NPH.3.3.031411 [DOI] [PMC free article] [PubMed] [Google Scholar]
- 64. Dincer A, Gordon BA, Hari‐Raj A, et al. Comparing cortical signatures of atrophy between late‐onset and autosomal dominant Alzheimer disease. NeuroImage Clin. 2020;28:102491. doi: 10.1016/J.NICL.2020.102491 [DOI] [PMC free article] [PubMed] [Google Scholar]
- 65. Gordon BA, Blazey TM, Christensen J, et al. Tau PET in autosomal dominant Alzheimer's disease: relationship with cognition, dementia and other biomarkers. Brain. 2019;142:1063‐1076. doi: 10.1093/BRAIN/AWZ019 [DOI] [PMC free article] [PubMed] [Google Scholar]
- 66. Miners JS, Palmer JC, Love S. Pathophysiology of Hypoperfusion of the precuneus in early Alzheimer's disease. Brain Pathol. 2015;26:533. doi: 10.1111/BPA.12331 [DOI] [PMC free article] [PubMed] [Google Scholar]
- 67. Hirao K, Ohnishi T, Hirata Y, et al. The prediction of rapid conversion to Alzheimer's disease in mild cognitive impairment using regional cerebral blood flow SPECT. Neuroimage. 2005;28:1014‐1021. doi: 10.1016/J.NEUROIMAGE.2005.06.066 [DOI] [PubMed] [Google Scholar]
- 68. Strom A, Iaccarino L, Edwards L, et al. Cortical hypometabolism reflects local atrophy and tau pathology in symptomatic Alzheimer's disease. Brain. 2022;145:713‐728. doi: 10.1093/BRAIN/AWAB294 [DOI] [PMC free article] [PubMed] [Google Scholar]
- 69. Villain N, Fouquet M, Baron JC, et al. Sequential relationships between grey matter and white matter atrophy and brain metabolic abnormalities in early Alzheimer's disease. Brain. 2010;133:3301‐3314. doi: 10.1093/BRAIN/AWQ203 [DOI] [PMC free article] [PubMed] [Google Scholar]
- 70. Carmona‐Iragui M, Balasa M, Benejam B, et al. Cerebral amyloid angiopathy in Down syndrome and sporadic and autosomal dominant Alzheimer's disease. Alzheimers Dement. 2017;13:1251. doi: 10.1016/J.JALZ.2017.03.007 [DOI] [PMC free article] [PubMed] [Google Scholar]
- 71. Head E, Phelan MJ, Doran E, et al. Cerebrovascular pathology in Down syndrome and Alzheimer disease. Acta Neuropathol Commun. 2017;5:93. doi: 10.1186/S40478-017-0499-4 [DOI] [PMC free article] [PubMed] [Google Scholar]
- 72. Charidimou A, Boulouis G, Gurol ME, et al. Emerging concepts in sporadic cerebral amyloid angiopathy. Brain. 2017;140:1829‐1850. doi: 10.1093/BRAIN/AWX047 [DOI] [PMC free article] [PubMed] [Google Scholar]
- 73. Morrison RA, McGrath A, Davidson G, Brown JJ, Murray GD, Lever AF. Low blood pressure in down's syndrome: A link with Alzheimer's disease? Hypertension. 1996;28:569‐575. doi: 10.1161/01.HYP.28.4.569/ASSET/824576E0-316B-4423-8F47-B9914F0E5215/ASSETS/GRAPHIC/0006F5.JPEG [DOI] [PubMed] [Google Scholar]
Associated Data
This section collects any data citations, data availability statements, or supplementary materials included in this article.
Supplementary Materials
Supporting Information
Supporting Information