Abstract
Recently, in a beautiful set of experiments, it has been shown that a Ncd mutant, NK11, which lacks directionality in its individual motion, was able to exhibit a new kind of directed motion in motility assays (Endow, S. A. & Higuchi, H. (2000) Nature (London) 406, 913–916): the filaments keep a given velocity for a while and then suddenly move in the opposite direction with similar velocity. We show that these observations nicely illustrate the concept of dynamic transitions in motor collections introduced earlier in the case of an infinite number of motors. We investigate the experimentally relevant case of a finite number of motors both when directionality is present (kinesins, myosins, Ncd) and absent (NK11). Using a symmetric two-state model, we demonstrate that bidirectional motion is the signature of a dynamic transition that results from the collective behavior of many motors acting on the same filament. For motors exhibiting directional bias individually, an asymmetric two-state model is appropriate. In that case, dynamic transitions exist for motor collections in the presence of an external force. We give predictions for the dependence of motion on ATP concentration, external forces, and the number of motors involved. In particular, we show that the reversal time grows exponentially with the number of motors per filament.
Motor proteins such as kinesins and myosins are driven by ATP hydrolysis and are able to generate motion and perform work against external forces (1). A given type of motor has a particular directionality of motion along its track filament. Most kinesins move toward the plus end of microtubules (2), but Ncd moves toward the minus end (3). The opposite directionality of closely related motors such as Ncd and conventional kinesins has raised a lot of interest (4–6). Artificial constructs have been built to determine ways to control the directionality of motors. A chimera composed of a conventional kinesin with a Ncd motor domain exhibited motion toward the minus end (7). Recently, a Ncd mutant NK11, which differs from Ncd only by 1 aa in the region of the neck, was described. This mutant apparently lacked a well-defined directionality as an individual motor, but in motility assay experiments it could generate bidirectional motion of filaments in both the plus and minus directions (8). A given microtubule reversed its direction of motion after time intervals of up to 1 min and exhibited characteristic velocities of similar magnitude in opposite directions. Motility assays, which provide a convenient tool for the study of the directionality of motors, typically involve the simultaneous action of many motors at any given time (2, 9, 10). Individual motor molecules, however, can be studied by manipulating motor-coated beads with optical traps (11–13). These single-molecule experiments reveal different behaviors for Ncd and NK11: whereas Ncd clearly exhibits characteristic displacements of typically 6 nm directed toward the minus end of the filament, NK11 produces displacements of a similar size, however, with no directionality (8).
In this article, we show that the observation of bidirectional motion in motility assays, i.e., the occurrence of sudden transitions of the direction of motion of a given filament can be explained very naturally as a collective behavior of many motors. Such behaviors had been predicted on purely theoretical grounds (14). The observed bidirectional motion is expected to be visible in the absence of external forces in situations where the individual motors lack a clear directionality of active displacements. In this case, single motors cannot produce appreciable motion, whereas many motors that interact with the same filament do generate directed motion during significant time intervals. We have performed numerical simulations of a simple two-state model of N rigidly coupled motors to study the general properties of these behaviors. These models are motivated by simplified physical descriptions for the force generation of motor proteins (15–23). We distinguish in our simulations two cases: (i) symmetric systems that lack a directional bias and (ii) asymmetric systems where a preferred directionality of motion is introduced. In the symmetric case, we find the characteristic behavior observed for NK11. The observed bidirectional motion is the signature of a dynamic transition of the system that occurs in the limit of a large number of motors. For realistic numbers of motors their stochastic action together with thermal fluctuations induce stochastic transitions between the two directionalities. We discuss the emergence of bidirectional motion with increasing number of motors N. Fluctuations of the velocity decrease with increasing N while the time intervals between directionality changes increase exponentially with N.
In the asymmetric case, which corresponds to the behavior of Ncd, the system typically exhibits a single direction of motion in the absence of external forces. Collective behaviors characterized by a bimodal velocity distribution can in this case occur if external forces are applied. Such behavior has been reported for a myosin II motility assay under near stalling conditions induced by electric fields (24).
Two-State Model for Several Rigidly Coupled Molecular Motors
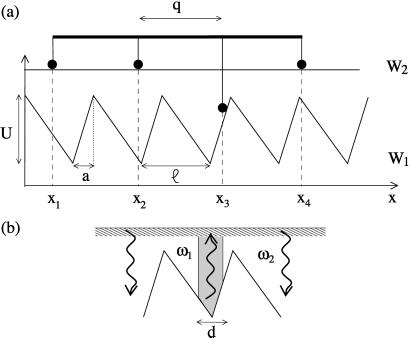
Our model is motivated by a motility assay where a polar filament slides along a substrate on which motor molecules have been grafted. In such a situation, a finite number of motors interact simultaneously with the filament. For simplicity, and to illustrate the principles, we consider a one-dimensional situation, similar to a motility assay, where N motors are attached to a rigid rod of length L = (N − 1)q at fixed spacing q. The relative displacement between rod and substrate is denoted by X. Each of the motors is represented by a simplified two-state model that captures the generic physical aspects of force-generation (14, 18, 22). The interaction of the motors with the filament is characterized by energy landscapes. For a motor that interacts with the substrate at a position x, the interaction energy is Wσ(x). Here, σ = 1,2 denotes the chemical state of a motor. The potentials are periodic, Wσ(x) = Wσ(x + ℓ), reflecting the periodicity of cytoskeletal filaments. With the extremity of the rod located at position X on the substrate, the n-th motor interacts at xn = X + q(n − 1) along the substrate (see Fig. 1a). The distance q between neighboring motors is taken incommensurate with respect to the period ℓ, i.e., q/ℓ is an irrational number.
Figure 1.
Schematic representation of N rigidly coupled motors. (a) The motors are interacting with a filament via periodic and asymmetric potentials W1(x) and W2(x) with period ℓ. In the examples discussed here, the potentials are chosen piecewise linear with the parameter a/ℓ characterizing the degree of asymmetry of the system, which becomes symmetric for a = ℓ/2. (b) The excitation rate ω1 is localized near the potential minima within a region of size d, centered at the minimum of the potential while the deexcitation rate ω2 is constant.
The instantaneous total force exerted by all motors on the filament is then given by
 |
1 |
and depends on the internal states σn of the motors. We express the instantaneous filament velocity as
 |
2 |
where forces and the friction coefficients have been normalized: λ is a friction coefficient per motor, fmot = Fmot/N and fext = Fext/N are the normalized forces exerted by the motors and the externally applied force, respectively. The stochastic force per motor that describes the effect of thermal noise is denoted η(t). It has zero average 〈η(t)〉 = 0 and 〈η(t)η(t′)〉 = 2kTλ/Nδ(t − t′).
To complete the dynamic equations of our model we have to specify the chemical transitions between the states σ = 1 and 2. At any instant, motor n at position x = xn can independently undergo transitions from σn = 1 to σn = 2 with a probability per unit time ω1(x) that depends on the position of the motor. Similarly, ω2(x) denotes the rate for transitions 2→1. Ncd is a nonprocessive motor (25). The probability of having the two heads of an Ncd attached at the same time is therefore small, and we can describe with good accuracy the motor with two states. One state describes biochemical conformations of a motor with no head bound to the filament. It does not contribute to force generation and is represented by a constant potential W2. A second state, describing biochemical conformations with one head bound, is represented by a periodic potential W1. We simulate this model by using two potentials as shown in Fig. 1, and transition rates that are localized in a region near the potential minima (see Fig. 1b).
For a given choice of parameters, the system attains a steady state. The stochastic properties of motion in the steady state can be characterized by the probability distribution P(ΔX,τ) of the system to generate a displacement ΔX during the time τ. Equivalently, for a given time interval τ we can define the distribution Qτ(ν) = P(vτ,τ) of velocities averaged within this interval. For large N the system attains a mean-field limit in which fluctuations become irrelevant. This limit has been previously discussed (14, 22, 26, 27).
Simulation Results
Directed and Bidirectional Motion.
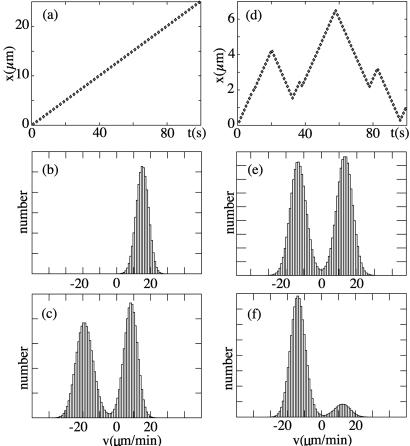
We have performed computer simulations of the N-motor system described above both in the symmetric case and the asymmetric case. Fig. 2 shows examples for the observed displacements as a function of time and velocity distributions Qτ(ν). In the asymmetric case, the system has a preferred direction of motion (Fig. 2a). The velocity histogram is peaked around a characteristic velocity (Fig. 2b). The symmetric system exhibits bidirectional motion, with periods of motion to the left and to the right separated by rapid changes in the velocity direction (Fig. 2d). The corresponding velocity distribution is bimodal, indicating that the system typically moves with velocity ±v0; the average velocity, however, is zero by symmetry (Fig. 2e). For increasing N, the peaks in the velocity distribution sharpen and become pronounced as the mean-field limit is approached, at the same time velocity fluctuations become unimportant. Bidirectional motion and the bimodal distribution is lost if the number of motors is reduced below a critical number of motors Nmin.
Figure 2.
Motion of a finite number of motors for an asymmetric and a symmetric system. (a) Position as a function of time for an asymmetric system a/ℓ = 0.2 (see Fig. 1) with N = 300, ω = 25 ms, ω
 = 2 ms, U/kT = 20, d/ℓ = 0.2, and χ = ω2ℓ2λ/U = 0.4. (b) Velocity histogram Qτ(v) of the motion shown in a for averaging time τ = 1 ms. (c) Velocity histogram for the same system with an applied external force fext = −2.8 pN. (d) Position as a function of time for a symmetric system with a/ℓ = 0.5 and otherwise the same parameters as in a. (e) Velocity histogram for this symmetric system. (f) Velocity histogram of the same system with an applied external force fext = −0.2 pN.
Force-Velocity Relationship.
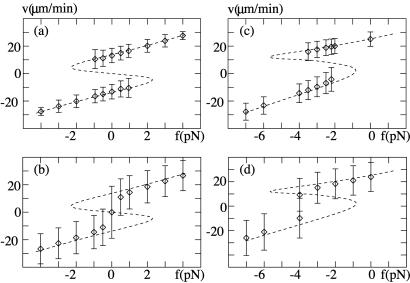
If a constant external force fext per motor is applied, the system reaches a new steady state that depends on the force. Fig. 2 c and f shows examples of velocity histograms for different forces for an asymmetric and a symmetric system, respectively. In the case of the symmetric system, the peak corresponding to motion in the direction of the force becomes more pronounced while the second peak is reduced; both peaks shift in the direction of the force. Beyond a critical force, the second peak vanishes and the velocity distribution becomes monomodal. In the case of the asymmetric system, the velocity distribution is initially monomodal; however, in the presence of an applied force the system can have two velocities that coexist (Fig. 2f).
The positions of the maxima of the histograms are displayed in Fig. 3 together with the width of the peaks as error bars as a function of the applied force. These diagrams exhibit a range of forces where two different velocities coexist; beyond this range only a single peak appears in the distribution. In the case of the symmetric system, this range of coexistence of two velocities is symmetrically centered around zero force (Fig. 3a), while in general an external force is needed to bring the asymmetric system in this regime (Fig. 3c). As the number of motors is reduced below N = 50, this coexistence and bimodal structure disappears in this example (see Fig. 3 b and d). In the limit of large N, the positions of the peaks approach the velocities calculated by a mean-field theory where fluctuations are neglected altogether. This limit is indicated by a broken line.
Figure 3.
Force-velocity relationships for a symmetric and asymmetric system. (a) Symmetric system with N = 300 motors, the other parameters are the same as in Fig. 2. (b) Force-velocity relation for this system with N = 50. (c) Asymmetric system with a/ℓ = 0.2, N = 200 motors and otherwise same parameters as above. (d) Same plot as in c but with N = 40 motors. The symbols denote the positions of peaks in the velocity histograms, error bars denote the width of these peaks. The dashed lines represent the force-velocity relation in the mean field limit for large N.
Correlation Functions.
The dynamic properties in the steady state can be characterized by the velocity correlation function
 |
3 |
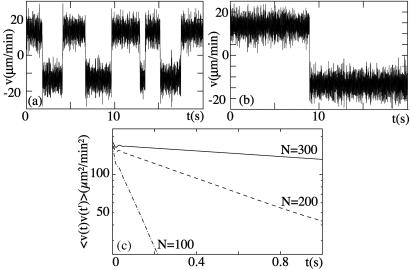
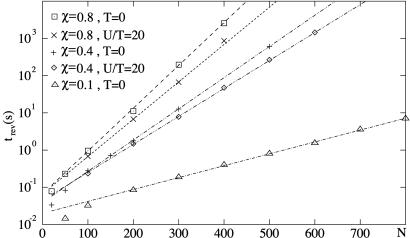
which in the steady state is independent of t0. Fig. 4 shows the velocity as a function of time for a symmetric system for different numbers of motors, together with the corresponding velocity correlation function. The velocity switches between two values ±v0, thus exhibiting bidirectional motion (see Fig. 4 a and b). The correlation function decays for large times exponentially as C(t)∼exp(−2t/trev), with a characteristic time trev (see Fig. 4c). This correlation time characterizes the time scale of velocity reversals or switching events. The exponential shape of the correlation function for long times implies a poissonian distribution of switching events. The dependence of the correlation time trev on the number N of motors is displayed in Fig. 5 for a symmetric system. The straight line in the single-logarithmic plot indicates that this time increases exponentially for large N.
Figure 4.
(a) Velocity as a function of time for a symmetric system with parameters as in Fig. 2 and N = 200 motors. (b) Same system with N = 300. (c) Velocity correlation functions for this system for different numbers N.
Figure 5.
The characteristic time of velocity reversals trev as a function of the number N of motors for a symmetric system. The different lines correspond to different values of temperature T and the dimensionless parameter χ = ω2ℓ2λ/U. The other parameters are chosen as in Fig. 2.
Signatures of a Dynamic Transition
The behaviors observed in the simulations, in particular the bimodal velocity distributions and long correlation times can be interpreted as the signature of a dynamic transition that occurs for infinite number of motors N. This can be most easily described in the case of a symmetric system. For sufficiently large N and in the absence of external forces, the steady state of the system is characterized by stochastic switching between two competing velocities ±v0; the average velocity is zero. The velocities ±v0 characterize steady states in the limit of infinite N. For finite N, fluctuations become relevant, thus triggering transitions between these states. The steady state for finite N exhibits correlations on a time trev characterizing the time between velocity changes. Consequently, the motion averaged over times long compared with trev has vanishing velocity and is diffusive with diffusion coefficient
 |
4 |
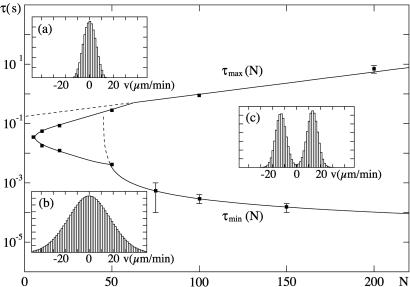
Furthermore, the velocity histogram for τ ≫ trev exhibits only a single peak at zero velocity. The velocity distribution becomes bimodal as discussed in the previous section if the velocity is determined by using an averaging time τ within an interval τmin ≤ τ ≤ τmax. As mentioned, the averaging time must be smaller than the time of velocity reversals, τmax ≃ trev. Furthermore, τ must be larger than a time τmin below which velocity fluctuations caused by thermal noise 〈v(t)v (0)〉 ≃ 2kTδ(t)/(λN) dominate in the Langevin equation. These noise-induced velocity fluctuations are of the order of 〈v2〉τ ≃ 2kT/(λNτ). We therefore estimate
 |
5 |
in the limit of large N. This scenario is summarized in Fig. 6, which displays the region in the (N,τ) plane where velocity distributions are bimodal. This bimodal shape occurs within an interval of averaging times τ for N > Nmin ≃ 5. For smaller numbers of motors, the velocity histogram in our model exhibits a single peak, the signature that the transition is lost.
Figure 6.
Shape of the velocity histograms of a symmetric system in the (N,τ) plane. Two regions can be distinguished: a region of bimodal velocity histograms and a region where this signature of a dynamic transition is lost. The line that separates the two regions was determined numerically at distinct points (marked as squares with error bars). The black solid line connects these points as a guide for the eye. Bimodal distributions occur for N > Nmin ≃ 5. For large N, the interval τmin ≤ τ ≤ τmax for which bimodal shapes occur widens and the curves τmax(N) and τmin(N) follow simple laws are represented by broken lines: ln(τmax(N)) ∝ N, and τmin(N) was fitted best by 1/(N − N0) with N0 = 45, which asymptotically behaves like 1/N. Insets a–c display examples of velocity histograms for N = 20 and τ = 2.10−1 s, N = 20 and τ = 10−3 s, N = 300 and τ = 10−3 s respectively. The experiments of ref. 8 correspond to τ ≃ 0.5 s and N ≃ 300.
The effects of noise on the dynamic transition for large number N of motors can be illustrated by a simple argument. We first consider the steady states of a system in the mean-field limit of infinite N that exhibit a dynamic instability and for which noise can be neglected. For a finite number of motors, fluctuations occur that are described by the random force ξ(t). The relaxation of the system to a steady state can be described by
 |
6 |
where f(v) denotes the force-velocity relationship of steady states for the mean-field limit of Eq. 2 with infinite N (14), and g is the coefficient characterizing the relaxation of this system to its steady state. For simplicity, we choose Gaussian white noise with zero average 〈ξ(t)〉 = 0 and 〈ξ(t)ξ(t′)〉 = 2D/Nδ(t − t′), which represents both thermal and nonthermal fluctuations. The noise amplitude decreases with an increasing number of motors, because each motor contributes equally to the noise while different motors are uncorrelated.
The stochastic motion of v(t) in the presence of noise is formally equivalent to the overdamped motion of a particle in a bistable potential and can be studied by using standard methods. This can be illustrated with the simple choice
 |
7 |
where α and β are two coefficients. This force-velocity relation corresponds to a symmetric system that undergoes a dynamic instability at α = 0. In the steady state, this system attains a velocity distribution Q(v) = exp[(αv2/2 − βv4/4)Ng/D]. The correlation time of velocity reversals
 |
8 |
in this simplified description is formally equivalent to a Kramer escape time over an effective barrier. This effective barrier NΔU = Nα2/(4β) increases linearly with N and the corresponding escape time therefore grows exponentially with the number of motors. This characteristic property has been also seen in our simulations.
Our simplified argument uses an analogy with an equilibrium problem. Note, however, that our many motor system operates far from equilibrium. Exponential dependences of escape rates on effective barriers heights have also been found in other nonequilibrium situations (see section VIII of ref. 28 for a review).
The generalization of these arguments to asymmetric systems is straightforward. Bimodal velocity distributions and exponentially growing correlation times for increasing N are also found in this case. Furthermore, the region of bimodal velocity distributions in this case typically occurs for finite external force. The signatures of a dynamic transition appear in the asymmetric case only if the external force is chosen appropriately.
Comparison to Experiments
Bidirectional motion of microtubules interacting with NK11, a Ncd mutant, has been observed in motility assay experiments. The microtubules moved for several seconds in one direction before switching to the opposite direction. The velocity of motion in both directions was approximately equal (8).
In our simulations, we chose parameter values that correspond to the behaviors observed for NK11 and Ncd. The amplitude of the potentials was U ≃20kT, a choice that is typical to capture the mechanical properties of many cytoskeletal motors. The potential period ℓ = 8 nm corresponds to the distance between binding sites along microtubules. The lifetime of the detached state ω = 25 ms was chosen to generate characteristic velocities comparable to those of filaments in Ncd motility assays. The excitation rate ω1 of 500 s−1 was large compared with ω2 as experiments were performed under saturating ATP concentrations. The friction coefficient λ, which represents protein friction and other dissipative processes, is difficult to estimate. We chose the value of the dimensionless parameter χ = ω2ℓ2λ/U = 0.4, which corresponds to λ = 10−5 kg/s. This choice is close to the value where the efficiency and speed of a motor are simultaneously optimized (29). For these parameters, we found for a symmetric potential with a = ℓ/2 and values of N ≥ 50 bidirectional motion with velocities v0 = ±13.8 μm/min. This should be compared with v0 ≃ ±12 μm/min observed for NK11 (8). Using the same parameter values, changing only the potential shape, we found for an asymmetric potential with a/ℓ = 0.2 a spontaneous velocity v0 ≃ 15.3 μm/min, which corresponded well to the observed value of v0 ≃ 16.4 μm/min for wild-type Ncd. The maximal load force per motor against which the system could move was 1 pN for the symmetric system with 300 motors and 3 pN for the asymmetric system with 200 motors (see Fig. 3 a and c). These values are similar to those observed for related motors such as conventional kinesins and myosins (12, 13, 30). In the case of the symmetric system, we found characteristic times of velocity reversals trev, which depended exponentially on the number of motors. The experimentally observed switching time for NK11 was of the order of trev ≃ 30 s (22). With our choice of parameters, about N = 300 motors were needed in our simulations to obtain this reversal time. This number of motors is consistent with motility assay experiments where microtubules had a length of about 10 μm and N = 300 corresponds to a spacing of q ≃ 35 nm between motors along a microtubule, or about 800 motors per μm2. This falls within the range of previous estimates of motor densities of 250–8,000 molecules per μm2 in Ncd motility assays (31).
Our model can also account for single motor laser trap assays performed on Ncd and NK11 (8). In these experiments, motors are attached at very low concentration to μm-sized beads that are manipulated by a laser trap. Single motors generated stochastic displacements of the bead in the trap that could be represented by displacement histograms. These displacements were biased toward the minus end of the microtubules in the case of Ncd with a characteristic step size of ≈6 nm. In the case of NK11, steps were typically of the same order of magnitude. However, displacements occurred toward both ends of the microtubules, indicating a lack of directionality of individual motors. Note that this observation excludes the possibility that the bidirectional motion of many motors results from two different populations of motors with opposite directionality.
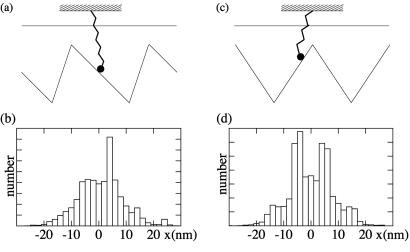
We have performed simulations of single motors in our model both for the symmetric and the asymmetric case. We represent the laser trap by a spring of stiffness k = 0.08 pN/nm to which the motor is attached. The base of the spring corresponds to the trap center and is held fixed at the midpoint between two potential minima (see Fig. 7 a and c). In our simulations of single motors, we obtained sequences of stochastic displacements similar to experimental data from laser trap assays. The corresponding displacement histograms agree qualitatively for symmetric and asymmetric potentials with those obtained experimentally for NK11 and Ncd, respectively (see Fig. 7 b and d). The values for the transition rates ω1 and ω2 used in single motor simulations were chosen differently from the many motor simulations. The slow rate ω1 ≃ 1 s−1 chosen in the single motor simulations takes into account a lower ATP concentration in laser-trap assay experiments as compared with motility assays. We also adapted the value of ω2 to accommodate the observed attachment rates. This change of parameters reflects different assay conditions in both experiments. In the laser trap assay, a motor may diffuse further away from the trap as compared with a motility assay, where nearby motors that interact with the filament keep the filament in the proximity of an active motor. Furthermore, in the single motor simulation, we introduced a different friction coefficient in state 2, λ2 = 10−7 kg/s, which corresponds to the friction coefficient of a 1-μm diameter bead in water.
Figure 7.
Simulation of individual motors attached to a spring. This situation corresponds to a single motor laser trap experiment. (a and c) Schematic representation of an asymmetric and a symmetric system. (b) Histogram of displacements generated by an asymmetric system with a/ℓ = 0.2, moving in a trap of stiffness k = 0.08 pN/nm. Parameter values are ω = 1 s, ω
 = 2 s, λ1 = 10−5 kg/s, λ2 = 10−7 kg/s, U/kT = 20, and d/ℓ = 0.2. (d) Histogram of displacement for a symmetric system and otherwise same parameters as in b.
Discussion
Our numerical simulations of a simple two-state model containing about 300 motors exhibit the characteristic behaviors observed in motility assays of both Ncd and NK11 mutants. To switch from a situation resembling NK11 to one corresponding to Ncd, it was sufficient to change the shape of the potential W1 in our model, while keeping all other parameters fixed. Even though our model is very simple and captures only the essential features of the physics of energy transduction and force generation, the simulations agree quantitatively with the experimentally observed values. The observed velocities could be accounted for by a simple choice of parameters. Furthermore, the observed switching time of 30 s in the case of bidirectional motion of NK11 corresponded to the switching times in our simulations of 300 motors. This time scale of velocity reversals is much longer than the typical stepping times of individual motors and can be understood as a result of collective effects in the many-motor system.
Why would one expect that a mutation from Ncd to NK11 should correspond to changing the model from an asymmetric to a symmetric situation? The mutation in NK11 was deliberately chosen to influence the directionality of the motor, motivated by the interest to better understand how the different directionalities of conventional kinesin and Ncd arise. This mutation resulted in the motor NK11 with properties somewhere in between those of Ncd and conventional kinesin and a lack of directionality. Such a lack of directionality corresponds in our description to a symmetric system. Based on this idea, we can naturally explain the observation that this nondirectional motor does generate bidirectional motion in motility assays as a collective effect. Our simulations suggest that around 300 motors are involved in the collective behavior.
We have explored in detail these collective behaviors as a function of the number of motors and an applied external load. They display the signature of a dynamic transition that occurs in the limit of a very large number N of motors but becomes concealed by noise for smaller N. Its signature remains in the form of bimodal velocity histograms and long correlation times. In the symmetric case, the dynamic transition occurs in the absence of an external load. This fact results from the symmetry properties of the system that ensure that the transition region, where two dynamic states compete, is centered around zero speed and zero force. For this reason, bidirectional motion is directly visible in motility assays for nondirectional motors.
Collective effects are also expected to occur in motors such as Ncd with a well-defined directionality. However, in this case a nonzero load is in general necessary to bring the system into the transition region where collective effects become apparent. Note that the signature of a dynamic transition has been reported in actin-myosin motility assays where electric fields were used to apply a load. Bidirectional motion was observed with an applied field near stalling conditions (24).
In our simplified model, bimodal velocity distributions with short correlation times and hysteresis can be found for as little as five motors working together (see Fig. 6). However, in certain models, a single motor can already display noisy bidirectional motion (32) and there is some evidence that single dynein motor in axonemes could have this property (33). Note, however, that only if there is a dynamic transition caused by collective effects would there be long correlation times that grow exponentially with the number of motors. To explain the correlation time of 30 s observed in the experiments (8), a dynamic transition is required. This leads to the generic behaviors discussed in this article regardless of whether a single motor already exhibits bidirectionality or not.
Our simulations can naturally explain qualitatively and quantitatively the motion observed in motility assays in terms of collective effects. Based on this idea we can now make predictions for the expected behavior in future experiments on Ncd and NK11 motility assays.
If in the motility assay the motor density or the filament length are changed, the number of motors that simultaneously interact with a given filament changes accordingly. The maximal number of motors that can interact with microtubules with a length of 10 μm is about 500, where we assume a minimal spacing of 20 nm between motors in a motility assay. Decreasing the number of motors by reducing the filament length or the motor density on the substrate is expected to lead to an exponential decrease in switching time as described by Eq. 8. Below about 5−30 motors per filament, the dynamic transition is expected to disappear. In our simulations, bimodal velocity distributions existed above ≃5 motors; however, for small N the averaging time has to be chosen carefully to see the dynamic instability (Fig. 6). ATP concentration in general serves as a control parameter that can induce a dynamic transition beyond a critical value CATP = C*. We predict that for sufficiently low ATP concentration, CATP < C*, bidirectional motion disappears. In the case of the symmetric system, there is no motion for CATP < C* and the velocity histogram has a single peak at v = 0. Beyond the dynamic transition, a characteristic velocity appears in the histogram, which is expected to increase as v0∼(CATP −C*)1/2 near the onset of the transition (14).
Finally, it would be of particular interest to study these motility assays in situations where an external force is applied. We predict that in the case of NK11, bidirectional motion is lost beyond a characteristic force where the filament simply follows the force. At the critical point CATP = C*, the velocity should increase in a nonlinear fashion as v0 ∼ f1/3. In the case of Ncd, a dynamic transition and a bimodal distribution of velocities could appear if a constant load force is applied. From our results for an asymmetric system, we expect bidirectional motion to occur if filaments are close to stalling conditions in the presence of a load.
The bidirectional motion of NK11 is a beautiful example of the concept of collective behaviors of molecular motors acting in groups (14, 22, 34). Because of the particular nature of NK11—its lack of directionality—the collective effects become particularly visible as they occur in simple motility assays in the absence of other forces. We suggest that collective effects are quite common in many motor systems and exist also for other types of motors, where they have so far been largely overlooked because they are usually difficult to observe.
Collective effects are likely to occur in the actin-myosin system (35) where they could be the key for the understanding of oscillatory and unstable behaviors of regular muscles and insect flight muscles (36, 37). Dynamic instabilities resulting from collective effects of dynein motors could also be at the origin of the oscillatory motion of axonemal cilia and flagella (38, 39). A further example is the suggestion that auditory hair cells of the inner ear could use such collective effects to detect and amplify minute auditory stimuli (40–42).
Acknowledgments
We thank S. Camalet, I. Derényi, S. Endow, A. Ott, and K. Sekimoto for stimulating discussions.
Footnotes
This paper was submitted directly (Track II) to the PNAS office.
See commentary on page 6521.
References
- 1.Howard J. Mechanics of Motor Proteins and the Cytoskeleton. Sunderland, MA: Sinauer; 2001. pp. 198–283. [Google Scholar]
- 2.Vale R D, Reese T S, Sheetz M P. Cell. 1985;42:39–50. doi: 10.1016/s0092-8674(85)80099-4. [DOI] [PMC free article] [PubMed] [Google Scholar]
- 3.McDonald H B, Stewart R J, Goldstein L S. Cell. 1990;63:1159–1165. doi: 10.1016/0092-8674(90)90412-8. [DOI] [PubMed] [Google Scholar]
- 4.Stewart R J, Thaler J P, Goldstein L S. Proc Natl Acad Sci USA. 1993;90:5209–5213. doi: 10.1073/pnas.90.11.5209. [DOI] [PMC free article] [PubMed] [Google Scholar]
- 5.Case R B, Pierce D W, Hom-Booher N, Hart C L, Vale R D. Cell. 1997;90:959–966. doi: 10.1016/s0092-8674(00)80360-8. [DOI] [PubMed] [Google Scholar]
- 6.Endow S A, Waligora K W. Science. 1998;281:1200–1202. doi: 10.1126/science.281.5380.1200. [DOI] [PubMed] [Google Scholar]
- 7.Henningsen U, Schliwa M. Nature (London) 1997;389:93–96. doi: 10.1038/38022. [DOI] [PubMed] [Google Scholar]
- 8.Endow S A, Higuchi H. Nature (London) 2000;406:913–916. doi: 10.1038/35022617. [DOI] [PubMed] [Google Scholar]
- 9.Kron S J, Spudich J. Proc Natl Acad Sci USA. 1986;83:6272–6276. doi: 10.1073/pnas.83.17.6272. [DOI] [PMC free article] [PubMed] [Google Scholar]
- 10.Winkelmann D A, Bourdieu L, Ott A, Kinose F, Libchaber A. Biophys J. 1995;68:2444–2453. doi: 10.1016/S0006-3495(95)80426-1. [DOI] [PMC free article] [PubMed] [Google Scholar]
- 11.Svoboda K, Schmidt C F, Schnapp B J, Block S M. Nature (London) 1993;365:721–727. doi: 10.1038/365721a0. [DOI] [PubMed] [Google Scholar]
- 12.Finer J T, Simmons R M, Spudich J A. Nature (London) 1994;368:113–119. doi: 10.1038/368113a0. [DOI] [PubMed] [Google Scholar]
- 13.Kojima H, Muto E, Higuchi H, Yanagida T. Biophys J. 1997;73:2012–2022. doi: 10.1016/S0006-3495(97)78231-6. [DOI] [PMC free article] [PubMed] [Google Scholar]
- 14.Jülicher F, Prost J. Phys Rev Lett. 1995;75:2618–2621. doi: 10.1103/PhysRevLett.75.2618. [DOI] [PubMed] [Google Scholar]
- 15.Hill T L. Prog Biophys Mol Biol. 1974;28:267–340. doi: 10.1016/0079-6107(74)90020-0. [DOI] [PubMed] [Google Scholar]
- 16.Ajdari A, Prost J. C R Acad Sci Paris II. 1992;315:1635–1639. [Google Scholar]
- 17.Magnasco M O. Phys Rev Lett. 1993;71:1477–1481. doi: 10.1103/PhysRevLett.71.1477. [DOI] [PubMed] [Google Scholar]
- 18.Prost J, Chauwin J-F, Peliti L, Ajdari A. Phys Rev Lett. 1994;72:2652–2655. doi: 10.1103/PhysRevLett.72.2652. [DOI] [PubMed] [Google Scholar]
- 19.Astumian R D, Bier M. Phys Rev Lett. 1994;72:1766–1769. doi: 10.1103/PhysRevLett.72.1766. [DOI] [PubMed] [Google Scholar]
- 20.Peskin C S, Ermentrout G B, Oster G F. In: Cell Mechanics and Cellular Engineering. Mow V, Guilak F, Tran R, Hochmuth R, editors. New York: Springer; 1994. pp. 479–489. [Google Scholar]
- 21.Astumian R D. Science. 1997;276:917–922. doi: 10.1126/science.276.5314.917. [DOI] [PubMed] [Google Scholar]
- 22.Jülicher F, Ajdari A, Prost J. Rev Mod Phys. 1997;69:1269–1281. [Google Scholar]
- 23.Fisher M E, Kolomeisky A B. Proc Natl Acad Sci USA. 2001;98:7748–7753. doi: 10.1073/pnas.141080498. [DOI] [PMC free article] [PubMed] [Google Scholar]
- 24.Riveline D, Ott A, Jülicher F, Winkelman D A, Cardoso O, Lacapere J J, Magnusdottir S, Viovy J L, Gorre-Talini L, Prost J. Eur Biophys J. 1998;27:403–408. doi: 10.1007/s002490050147. [DOI] [PubMed] [Google Scholar]
- 25.Stewart R J, Semerjian J, Schmidt C F. Eur Biophys J. 1998;27:353–360. doi: 10.1007/s002490050142. [DOI] [PubMed] [Google Scholar]
- 26.Jülicher F, Prost J. Phys Rev Lett. 1997;78:4510–4513. [Google Scholar]
- 27.Jülicher F. In: Transport and Structure: Their Competitive Roles in Biophysics and Chemistry. Müller S C, Parisi J, Zimmermann W, editors. Berlin: Springer; 1999. pp. 46–74. [Google Scholar]
- 28.Hänggi P, Talkner P, Borkovec M. Rev Mod Phys. 1990;62:251–341. [Google Scholar]
- 29.Parmeggiani A, Jülicher F, Ajdari A, Prost J. Phys Rev E. 1999;60:2127–2140. doi: 10.1103/physreve.60.2127. [DOI] [PubMed] [Google Scholar]
- 30.Svoboda K, Block S M. Cell. 1994;77:773–784. doi: 10.1016/0092-8674(94)90060-4. [DOI] [PubMed] [Google Scholar]
- 31.deCastro M J, Ho C H, Stewart R J. Biochemistry. 1999;38:5076–5081. doi: 10.1021/bi9829175. [DOI] [PubMed] [Google Scholar]
- 32.Brokaw C J. Cell Motil Cytoskeleton. 2000;47:108–119. doi: 10.1002/1097-0169(200010)47:2<108::AID-CM2>3.0.CO;2-7. [DOI] [PubMed] [Google Scholar]
- 33.Shingyoji C, Higuchi H, Yoshimura M, Katayama E, Yanagida T. Nature (London) 1998;393:711–714. doi: 10.1038/31520. [DOI] [PubMed] [Google Scholar]
- 34.Reimann P, Kawai R, Van Den Broeck C, Hänggi P. Europhys Lett. 1999;45:545–551. [Google Scholar]
- 35.Huxley A F. Prog Biophys Biophys Chem. 1957;7:255–318. [PubMed] [Google Scholar]
- 36.Pringle J W S. In: Insect Flight Muscle. Tregear R T, editor. Amsterdam: North–Holland; 1977. p. 177. [Google Scholar]
- 37.Yasuda K, Shindo Y, Ishiwata S. Biophys J. 1996;70:1823–1829. doi: 10.1016/S0006-3495(96)79747-3. [DOI] [PMC free article] [PubMed] [Google Scholar]
- 38.Brokaw C J. Proc Natl Acad Sci USA. 1975;72:3102–3106. doi: 10.1073/pnas.72.8.3102. [DOI] [PMC free article] [PubMed] [Google Scholar]
- 39.Camalet S, Jülicher F, Prost J. J Phys Rev Lett. 1999;82:1590–1593. [Google Scholar]
- 40.Martin P, Hudspeth A J. Proc Natl Acad Sci USA. 1999;96:14306–14311. doi: 10.1073/pnas.96.25.14306. [DOI] [PMC free article] [PubMed] [Google Scholar]
- 41.Camalet S, Duke T, Jülicher F, Prost J. Proc Natl Acad Sci USA. 2000;97:3183–3188. doi: 10.1073/pnas.97.7.3183. [DOI] [PMC free article] [PubMed] [Google Scholar]
- 42.Eguiluz V M, Ospeck M, Choe Y, Hudspeth A J, Magnasco M O. Phys Rev Lett. 2000;84:5232–5235. doi: 10.1103/PhysRevLett.84.5232. [DOI] [PubMed] [Google Scholar]


