Abstract
The architecture of membrane proteins in their native environment of the phospholipid bilayer is critical for understanding physiological function, but has been difficult to realize experimentally. In this communication we describe the incorporation of a membrane-anchored protein into a supported phospholipid bilayer. Cytochrome P450 2B4 solubilized and purified from the hepatic endoplasmic reticulum was incorporated into phospholipid bilayer nanostructures and oriented on a surface for visualization by atomic force microscopy. Individual P450 molecules were observed protruding from the bilayer surface. Problems associated with deformation of the protein by the atomic force microscopy probe were avoided by analyzing force-dependent height measurements to quantitate the height of the protein above the bilayer surface. Measurements of the atomic force microscopy cantilever deflection as a function of probe-sample separation reveal that the top of the P450 opposite the N-terminal membrane anchor region sits 3.5 nanometers above the phospholipid–water boundary. Models of the orientation of the enzyme are presented and discussed in relation to membrane interactions and interaction with cytochrome P450 reductase.
Cytochromes P450 are a class of heme-thiolate enzymes that activate molecular oxygen used in the oxidation of a variety of substrates. Found in mammalian liver and steroid-sensitive tissue, the microsomal P450s are responsible for synthesizing steroids, activating procarcinogens, and metabolizing pharmaceuticals (1). Because of the biological importance of these enzymes, a large amount of effort has been directed toward understanding their structure and function. Unfortunately, the microsomal enzymes are membrane proteins and have proven difficult to characterize. Analysis by x-ray diffraction has been hindered because of the challenges of producing high-quality crystals of membrane proteins. To date, only one microsomal P450 has been successfully crystallized (2). In this case, successful crystallization required removal of the transmembrane sequence and substitution of residues that confer membrane-binding ability. Structural characterization of the microsomal P450s has been further complicated by the fact that the phospholipid component of the membrane has been shown to modulate catalysis. In addition to substrate binding, the phospholipid component of the membrane is also believed to be important in maintaining efficient electron transfer from NADPH-cytochrome P450 reductase (P450 reductase) to the P450 heme (3). Although the rate of electron transfer has been shown to correlate with the type of lipids in the membrane (4, 5), the mechanism by which the lipids mediate electron transfer is unclear.
Because of the influence of the membrane on the catalytic reaction cycle, it is critical not only to determine the three-dimensional structure of the protein but also the interaction of cytochrome P450 with membranes. The interaction of the protein with the membrane will clearly mediate its interactions with other protein components in the monoxygenase system and therefore the mechanism of substrate turnover cannot be fully elucidated until an accurate model of the P450-membrane association has been developed. Early models suggested a deeply embedded protein (6, 7), whereas more recent evidence reveals that the P450 is a largely hydrophilic globular structure with a single transmembrane anchor at the N-terminal sequence of the enzyme. However, truncation mutants lacking the membrane anchor region retain their membrane localization (8–12). Furthermore, the measured insertion area of cytochrome P450 2B4 indicates the equivalent of three to four α-helices associated with the membrane (13).
Spectroscopic techniques have been used to measure the positions of proteins in bilayers. For example, power-saturation electron paramagnetic resonance (EPR) methods (14) have been used to gauge the position of spin-labeled proteins within the bilayer. Fluorescence quenching of tryptophan residues by using the parallax quenching method (15, 16) has been used to estimate the depth of penetration of several membrane proteins. Atomic force microscopy (AFM) is an extraordinary technique that can be used to directly determine the topography of membrane proteins associated with a supported phospholipid bilayer.
We have reported the use of ten nanometer-scale phospholipid bilayer structures to orient membrane proteins on a surface for visualization by AFM (17, 18). This structure consists of a discoidal phospholipid bilayer domain stabilized at the edges by a protein shell of apo A-I, which forms amphipathic α-helices that associate with the hydrophobic edges of the phospholipid bilayer disk. Herein we report the incorporation of cytochrome P450 2B4 into disk structures and visualization by AFM. This enzyme, like others, deforms under the force of the AFM probe even under optimal imaging conditions. By analyzing force curves we obtained a more accurate height of the protein above the bilayer surface. Using the force-dependent topographic information, the approximate position of the native membrane-bound enzyme normal to the bilayer has been determined. With the measured heights of cytochrome P450 and cytochrome P450 reductase (17, 18) above the bilayer surface we discuss a model for interaction with the membrane and redox complex formation in light of known interactions and structural information.
Materials and Methods
Materials.
Human apoA-I, purified as described (19), was the kind gift of Ana Jonas (University of Illinois, Urbana). Cytochrome P450 2B4 (CYP2B4) was purified from livers of phenobarbital-induced rabbits according to published procedures (20). Dipalmitoyl phosphatidylcholine was obtained from Avanti Polar Lipids. Muscovite mica was obtained from S and J Trading (Glen Oaks, NY). Silicon nitride AFM tips were from Digital Instruments (Santa Barbara, CA). Water used for reconstitution of reconstituted high-density lipoprotein (rHDL) and imaging was purified with a Milli-Q system (Millipore).
Formation of rHDL/P450 Particles.
Cytochrome P450 was reconstituted into rHDL by the detergent dialysis method essentially as described (17, 21). The buffer consisted of 10 mM Tris⋅HCl (pH 8.0), 0.1 M NaCl, and 10% (vol/vol) glycerol. The mixture of apo A-I, cholate, and phospholipid (1:220:110 mole ratio) was incubated for 8 h at 37°C followed by addition of P450 (1:0.5, apo A-I:P450 mole ratio) and incubation overnight at room temperature. The mixture was dialyzed using a 10,000-MW cutoff slide-a-lyzer (Pierce) at room temperature for 2 h followed by a change of buffer and continued dialysis at 4°C. It was found that 82% of the P450 content could be recovered under these conditions, based on an absolute spectra of the ferrous CO adduct. The detergent-solubilized CYP2B4 has a certain degree of instability and converts to the P420 form and loses heme upon long-term storage and manipulation. However, the process of incorporating P450 into disks causes no more than a 10% increase in the level of P420. After dialysis, the mixture was injected onto a Superdex 200 HR10/30 gel filtration column (Pharmacia, Uppsala) equilibrated in reconstitution buffer at room temperature at a flow rate of 0.25 ml/minute with collection of 0.5 ml fractions. Fractions were assayed using native polyacrylamide gradient gel electrophoresis on 8–25% gradient native gels and Coomassie staining with the Phastgel system (Pharmacia).
Atomic Force Microscopy.
AFM images were obtained with a Nanoscope IIIa (Digital Instruments) equipped with a fluid cell, using the “A” scanner. The calibration of piezo movement in the z direction was initially performed using 180-nm-deep pits in a silicon standard (Digital Instruments) and fine-tuned by measuring the 1-nm periodicity of mica cleavage planes. To form the surface of rHDL/cytochrome P450, mica was glued to 10-mm steel disks, cleaved with cellophane tape and 10 μl of rHDL/cytochrome P450 was applied followed by 10–20 μl of imaging buffer [10 mM Tris⋅HCl (pH 8.0)/0.15 M NaCl/10 mM MgCl2]. After 30 min, the sample was mounted in the fluid cell and several milliliters of imaging buffer was passed through the cell to remove any unadsorbed material. Contact imaging was done under imaging buffer by using the thin-legged 200-μm cantilever having a nominal spring constant of 0.06 N/m.
Force Curves and Data Analysis.
Force curves were obtained using the force-volume feature of the Nanoscope IIIa data acquisition software. Calibration of cantilever deflection was performed by taking force curves over a region of the rHDL surface. Force curves were measured using the “relative trigger” mode in which the maximum cantilever deflection is constant. The trigger value was set to 15 or 20 nanometers. Sixty-four samplings were taken for each force curve and each force-volume image was comprised of an array of 64 × 64 force curves over a 500 × 500-nm area. Data were exported to a spreadsheet for analysis. Only force curves in the approach direction were analyzed. Force curves were filtered using the Savitzky–Golay quadratic smoothing algorithm (22) to reduce noise. The slope and y intercept for each force curve were calculated from the ten largest deflection values (between 10–15 nm deflection). An averaged theoretical force curve for a hard surface was obtained by averaging the intercept values and the slopes. The line defined by these parameters represents the contact portion of a force curve on a hard surface, which should have a negative unity slope and an intercept value defined by the trigger threshold value. The slope and intercept values did not differ markedly (<10%) from that obtained using the z sensitivity calibration value or the trigger threshold value; however, average values over the entire image were taken as a best estimate of these parameters. Force curves were corrected for scanner z position at turnaround, which was required because of the use of the relative trigger mode. This information is provided by the force-volume height image, which gives the relative z position at turnaround for each force curve and was added to the x axis for each force curve. The relative height (difference in scanner position) at each point along the force curve was measured relative to the force curve for the theoretical hard surface having a height of zero. The relative height as a function of cantilever deflection was extrapolated to zero deflection by using deflection values between 1 and 3 nm for each force curve, yielding a “zero-force” image. Objects above the rHDL surface were chosen by visual inspection of the images and an average relative height over a square array of 2 × 2 pixels was measured. The relative height of the underlying rHDL surface was subtracted from each measurement to obtain the height of cytochrome P450 above the phospholipid bilayer surface.
Results
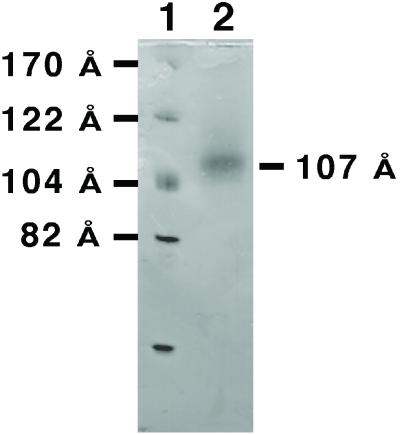
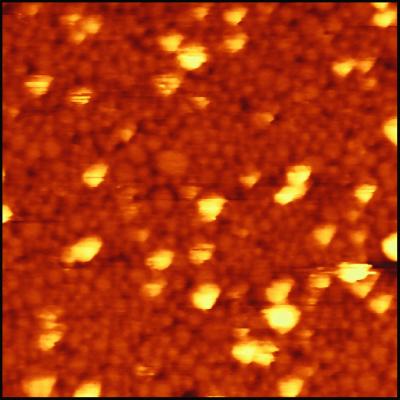
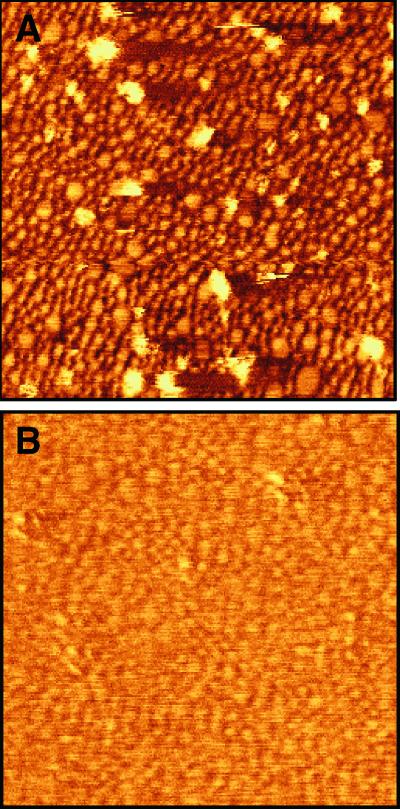
Formation of rHDL particles in the presence of CYP2B4 results in one major band on a Coomassie-stained native 8–25% polyacrylamide gradient electrophoresis gel. The CYP2B4-rHDL particles run at 259 kDa with an estimated Stokes diameter of 107 Å (Fig. 1). The single major band obtained after dialysis contrasts with rHDL formed in the presence of P450 reductase, which shows multiple larger-sized species, probably because of incorporation of multiple reductase molecules into rHDL (17). The band was isolated by gel filtration chromatography. An estimated 10% of the rHDL disk structures present in the main peak contained a CYP2B4 molecule, based on cytochrome and protein absorbance values. The mixture of rHDL and rHDL/CYP2B4 complexes was incubated on a freshly cleaved mica surface and scanned with the AFM (Fig. 2). The surface consists mainly of adsorbed rHDL. Cytochrome P450 molecules (light-colored objects) can be observed protruding from the surface. The cytochrome P450 molecules are associated with the bilayer disks and can be imaged repeatedly. The images of cytochrome P450 molecules appear broadened because of the size of the AFM tip. The underlying rHDL particles have diameters of approximately 10–20 nm (17, 18, 23, 24). The size heterogeneity of the rHDL arises from partial fusion of disks on the mica surface (23). Treatment of the rHDL/P450 surface with trypsin rapidly releases the P450 component (Fig. 3), consistent with disk-associated P450 being cleaved near the N-terminal membrane anchor region.
Figure 1.
Native polyacrylamide gradient gel electrophoresis of rHDL/CYP2B4. Dialysate containing rHDL and CYP2B4 was run on an 8–25% gradient gel and stained with Coomassie brilliant blue. The sizes of the rHDL structures were estimated from the known hydrodynamic diameters of the protein standards.
Figure 2.
Height image of cytochrome P450 at the rHDL surface. The rHDL/CYP2B4 complex was isolated by gel filtration and applied to a freshly cleaved mica surface as described in Materials and Methods. The image was obtained in contact mode. The image size is 500 × 500 nm.
Figure 3.
Images of CYP2B4 before (A) and after (B) in situ treatment with 15 μg/ml trypsin. The image in B was taken approximately 10 min after addition of trypsin. Images are contact images in deflection mode. The image size is 500 × 500 nm.
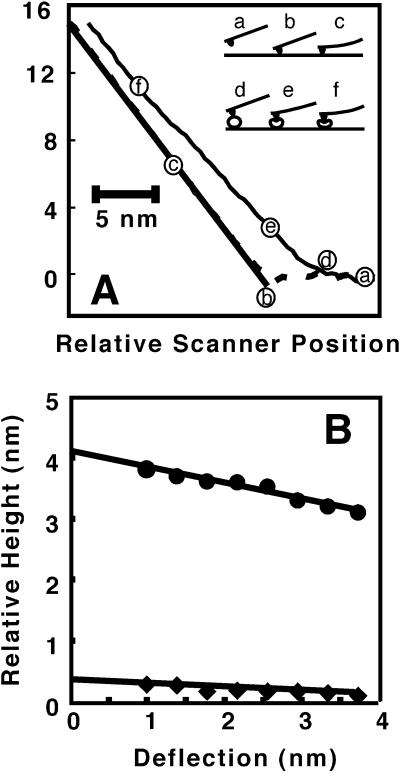
The initially measured heights of the cytochrome P450 molecules obtained from normal-force contact images by cross section of 1.2 ± 0.3 nanometers are small compared with the dimensions of the catalytic domain, which range from about 3.5 to 7 nm based on crystal structures of bacterial P450s (25–27) and the recently determined structure of mammalian microsomal CYP 2C5 (2). The large forces involved in normal contact-mode imaging could easily mask the actual height of the soft membrane-associated protein. To obtain an accurate height measurement, we developed a method for obtaining more accurate topographic information through force-distance measurements. Fig. 4A shows force curves taken on a molecule of cytochrome P450 and on the rHDL surface. The solid line represents the contact region of the force curve expected for a hard surface. The rHDL surface approximates a hard surface in the linear portion of the contact region at larger deflections. In contrast, the force curve for a cytochrome P450 molecule is nonlinear over a large portion of the curve. The inset to Fig. 4A depicts schematically what may be occurring at the surface. As the tip approaches the surface no deflection is measured (a). Where the tip contacts the sample (b), a deflection occurs that is linear with respect to change in vertical scanner position (c). In the case of a P450 molecule, once contact is made (d) deflection begins, but in a nonlinear manner because of deformation (e). At a certain point deflection approaches linearity with respect to scanner position (f).
Figure 4.
(A) Force curve in approach direction taken on a cytochrome P450 molecule (thin line), rHDL surface (dashed line), and theoretical hard surface (thick line). Curves are averages of several force curves. (Inset) Regions of force curves on a hard surface [(a) noncontact, (b) point of contact, and (c) region of constant compliance] and on a protein [(d) region of contact with protein, (e) deformation, and (f) region of constant compliance]. (B) Relative height as a function of cantilever deflection. Lines are least squares fits with intercepts of 0.39 ± 0.03 nm (rHDL) and 4.13 ± 0.06 nm (CYP2B4) giving an extrapolated height for CYP2B4 above the rHDL surface of 3.74 ± 0.07 nm.
Nonlinearity in the contact portion of the curve can be due to sample-induced forces on the tip, including electrostatic, hydration, and van der Waal's forces, as well as deformation of the sample. Electrostatic forces contribute to the apparent height of charged surfaces, but can be screened with electrolytes. All experiments were done in buffered solution containing 150 mM NaCl and 10 mM MgCl2, which should be sufficient to screen much of the electrostatic contribution to the force curves (28). However some residual electrostatic contribution may exist at small cantilever deflections on the order of the Debye length (0.72 nm) in this solution. Hydration forces on the order of 0.5 nN can occur over tip-sample separation of about 1 nm (29). The variation in height with force for the cytochrome P450 molecule, however, is larger than one nanometer, so nonlinearity cannot be solely due to hydration. Furthermore, hydration layers exist for both cytochrome P450 and rHDL so that contributions due to hydration will tend to cancel when the relative height of rHDL is subtracted from the relative height of cytochrome P450 to obtain the height of cytochrome P450 above the rHDL surface. Viscoelastic deformation, a tip-induced bending motion, or lateral movement of the protein could explain the majority of the force dependence of the cytochrome P450. A similar force response has been observed for P450 reductase (17).
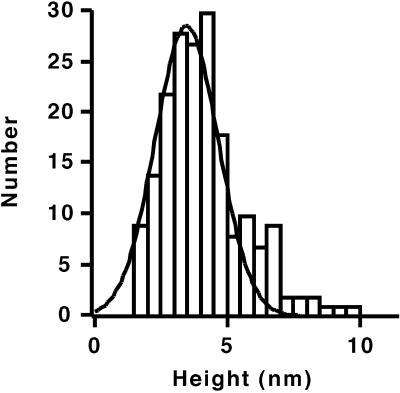
The relative height of the cytochrome P450 and the rHDL surface as a function of cantilever deflection near the initial contact of the tip with the sample is approximately linear (Fig. 4B). The dependence of height on deflection was approximated as a linear function at low cantilever deflection and extrapolated to a deflection of zero to obtain an estimate of the height of the cytochrome P450 molecule as depicted in Fig. 4B. Extrapolation was performed using cantilever deflection values between 1 and 3 nm. The lower limit of 1-nm deflection was used because of noise in the digitized deflection values of the force curves at or near zero deflection. The results of many measurements of the height of the cytochrome P450 extrapolated to zero force are given in the histogram of Fig. 5. The data can be approximated by a normal distribution centered at 3.5 ± 0.9 nanometers.
Figure 5.
Histogram of the height of cytochrome P450 molecules above the rHDL surface measured by extrapolation to zero cantilever deflection. The solid line is a Gaussian fit having a peak at 3.5 nm with a SD of 0.9 nm. Data were taken for 191 cytochrome P450 molecules from 12 areas of a sample. Relative heights were linearly extrapolated to cantilever deflection values of zero, using four points of the height vs. deflection curves at cantilever deflections between 1 and 3 nm. The relative height of the rHDL surface was subtracted from the relative height of cytochrome P450 to obtain the height of cytochrome P450 above the rHDL surface.
Discussion
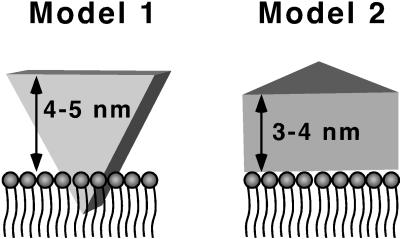
We have clearly shown that the majority of the CYP2B4 structure protrudes above the membrane surface. The value of 3.5 nm we obtain by AFM differs from the value of 0.4 nm based on measurements of the lamellar repeat distance of partially oriented samples by x-ray diffraction (30). Two cases for P450 interaction with membranes that are consistent with the measured distance above the surface are shown in Fig. 6. Note that the transmembrane anchor is not shown. In Model 1 the enzyme sits upright with both proximal and distal faces normal to the bilayer. The recent crystal structure of P450 2C5 shows a hydrophobic “tip” on 2C5 near the N terminus in the structure that might insert partially into the membrane. Interactions with the membrane, besides the transmembrane helix, would include regions near the mouth of the substrate access channel (F–G loop) and structures near the membrane anchor (2, 31–33). The height above the surface would be between 4 and 5 nm in the case of Model 1. Model 2, in which the enzyme lies on its distal face, is also consistent with the present AFM measurements.
Figure 6.
Schematic of P450 interacting with the phospholipid bilayer domain of rHDL. In Model 1, a hydrophobic tip is inserted into the membrane and the heme is perpendicular to the membrane. In Model 2, the enzyme is lying on its distal face with the heme parallel to the membrane. The transmembrane anchor domain is not shown.
Previous evidence suggests that Model 1 is more correct. Antipeptide binding experiments (32, 33) suggest that both faces and the edges of the enzyme are available for antibody binding (Fig. 7). The N-terminal region and loop between the F and G helices contain epitopes that are masked in the membrane-bound form but available in detergent-solubilized forms. The predicted binding site of reductase and cytochrome b5 occurs on the proximal face of the enzyme based on site-directed mutagenesis and molecular modeling (34). In Model 2 the proteins could not interact in a side-by-side fashion as predicted. The orientation of the heme has been estimated from results of anisotropy decay measurements after flash photolysis (35–37). The reported values are a 41°, 55°, or 71° angle between heme and membrane normal for phenobarbital-induced P450 and 48° or 62 ° for 3-methylcholanthrene-induced P450, suggesting a heme and membrane orientation intermediate between Models 1 and 2. The results of electron paramagnetic resonance (EPR) measurements on partially oriented samples (38) were used to calculate an angle between heme and membrane normal of approximately zero, contradicting the anisotropy measurements. However, these EPR measurements were performed with a dried preparation making the overall integrity of the sample questionable. Based on the above evidence, we conclude that Model 1 is more appropriate than Model 2.
Figure 7.
Theoretical model structure of CYP2B4 showing surfaces distal and proximal to the heme thiolate ligand. The membrane anchor is not shown. The regions colored yellow are segments corresponding to regions in the CYP2C5 structure reported to be hydrophobic (2). Segments colored red are anti-peptide antibody binding epitopes known to bind the membrane-bound form of CYP2B4 or CYP2B5. Residues colored blue are believed to be involved in electrostatic interaction with P450 reductase.
Experimental evidence for interaction of more than a single α-helical anchor exists. For example, N-terminal deletion mutants lacking the membrane anchor of CYP2B4 will bind membranes (12). We have performed surface pressure measurements of CYP2B4 in phospholipid Langmuir-Blodgett films to obtain the molecular embedded surface area. The surface pressure measurements show the monolayer-bound form of the enzyme occupying 680 Å (2), a cross-sectional area much larger than a single helix (13). Regions that may be partly immersed in the lipid phase include the F–G loop, the membrane anchor itself, and the hydrophobic “tip” observed in the structure of P450 2C5 (2). Based on the stated 2C5 hydrophobic regions (2) and a theoretical model of CYP2B4 (ref. 39; coordinates kindly provided by L. Waskell, University of Michigan, Ann Arbor), the embedded cross-section is estimated to be roughly 1,000 Å (2) if the hydrophobic area is immersed in the membrane (see Fig. 7).
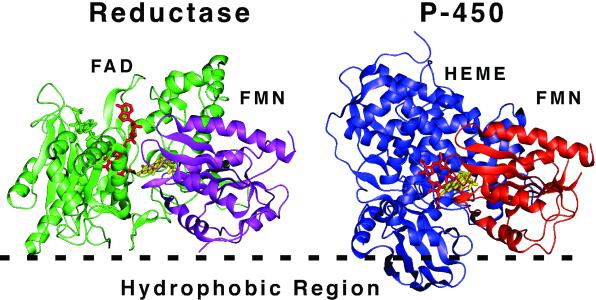
Some interesting observations can be made based on the proposed orientation of CYP2B4 (Model 1), P450 reductase, and the known structure of CYP102 with an associated flavin domain. CYP102 is a soluble bacterial enzyme consisting of a fusion between the heme and flavin domains. The FMN domain interacts with the proximal face of the CYP102 heme domain (40). The flavin of the FAD domain in the mammalian reductase structure replaces the position of the heme group in the CYP102 structure (41). It has been suggested that the FAD and FMN domains of CYP102 rearrange during catalysis to bring redox groups into close proximity for more efficient transfer from FAD to FMN and from FMN to heme. Such a rearrangement was suggested for the mammalian reductase (42), because close proximity of heme and FMN in a P450 reductase-cytochrome P450 complex seem unlikely based on the crystal structures of mammalian reductase and P450s. Also, aspartate 208 in mammalian reductase has been implicated in the interaction with P450 but is buried in the reductase crystal structure and occurs at what would be the interface between FMN and heme domains in the CYP102 structure (43). It is therefore tempting to use the orientation of the mammalian reductase FMN domain to orient cytochrome CYP102 (as a model for microsomal P450s) through its associated flavin domain with respect to the plane of a membrane. This orientation is depicted in Fig. 8. The overall fold of the CYP102 FMN domain resembles the mammalian domain. If the CYP102 FMN domain is positioned on a membrane surface as proposed for P450 reductase (18, 41), the heme domain is oriented according to Model 1 with what would be the hydrophobic “tip” of microsomal P450 facing and inserted into the membrane surface.
Figure 8.
Possible orientation of redox transfer complexes on the membrane surface. Cytochrome P450 reductase is shown based on the probable orientation of the reductase at a membrane surface (hydrophobic region). Cytochrome P450 was oriented such that the FMN domain (orange) of the known structure of bacterial cytochrome P450 CYP102 is roughly superimposable on the FMN domain of P450 reductase (purple). The resulting orientation of cytochrome P450 with respect to the membrane corresponds to Model 1 of Fig. 6. Note that whereas the FMN (yellow) of reductase accepts electrons from FAD (green), in the P450 structure the FMN (yellow) is in close proximity to the heme cofactor (red). The structures of reductase (PDB ID 1AMO) and CYP102 (PDB ID 1BVY) were obtained from the Protein Data Bank, www.rcsb.org.
In summary, there is great interest in determining the interaction of membrane proteins with phospholipid bilayer structures, the mode and depth of insertion, interaction of structural motifs with the head group and hydrophobic regions of the bilayer, orientation of the protein at the bilayer surface, and interaction with other membrane proteins. We have shown that AFM can be used to obtain an estimate of the height of a membrane protein above a phospholipid bilayer surface, using high-precision measurements of cantilever deflection vs. z-scanner piezo position in an attempt to correct for deformation of the protein by imaging forces. The cantilever deflection as a function of tip-sample separation was analyzed to estimate a 3.5-nm height for CYP2B4, in contrast to a height of 1.2 nm measured from images obtained at a single low force. The information obtained can be interpreted in terms of structural interactions with the membrane and with its membrane-bound redox partner, cytochrome P450 reductase. We conclude that the general model, in which a hydrophobic tip of the enzyme near the membrane anchor inserts partially into the membrane, is correct. This position at the membrane surface would allow the possibility of close interaction between the P450 heme and the mammalian reductase FMN cofactor.
Acknowledgments
We thank Professor M. J. Coon and Gregory Raner (University of Michigan) for important discussion and advice, Mary Shank-Retzlaff for purified P450 2B4, Professor Ana Jonas (University of Illinois) for the apo A-I preparation, Professor Lucy Waskell (University of Michigan) for the CYP2B4 model coordinates, and the thoughtful reviewers. This research was supported by National Institutes of Health Grants GM 33775 and GM 31756. T.H.B. is a recipient of National Institutes of Health Postdoctoral Fellowship GM 19024.
Abbreviations
- AFM
atomic force microscopy
- rHDL
reconstituted high-density lipoprotein
- CYP2B4
cytochrome P450 2B4
References
- 1.Ortiz de Montellano P R. Cytochrome P-450: Structure, Mechanism, and Biochemistry. New York: Plenum; 1986. [Google Scholar]
- 2.Williams P A, Cosme J, Sridhar V, Johnson E F, McRee D E. Mol Cell. 2000;5:121–131. doi: 10.1016/s1097-2765(00)80408-6. [DOI] [PubMed] [Google Scholar]
- 3.Strobel H W, Lu A Y, Heidema J, Coon M J. J Biol Chem. 1970;245:4851–4854. [PubMed] [Google Scholar]
- 4.Ingelman-Sundberg M, Haaparanta T, Rydstrom J. Biochemistry. 1981;20:4100–4106. doi: 10.1021/bi00517a024. [DOI] [PubMed] [Google Scholar]
- 5.Ingelman-Sundberg M, Blanck J, Smettan G, Ruckpaul K. Eur J Biochem. 1983;134:157–162. doi: 10.1111/j.1432-1033.1983.tb07546.x. [DOI] [PubMed] [Google Scholar]
- 6.Ozols J, Heinemann F S, Johnson E F. J Biol Chem. 1985;260:5427–5434. [PubMed] [Google Scholar]
- 7.Haniu M, Ryan D E, Levin W, Shively J E. Arch Biochem Biophys. 1986;244:323–337. doi: 10.1016/0003-9861(86)90121-9. [DOI] [PubMed] [Google Scholar]
- 8.Sagara Y, Barnes H J, Waterman M R. Arch Biochem Biophys. 1993;304:272–278. doi: 10.1006/abbi.1993.1349. [DOI] [PubMed] [Google Scholar]
- 9.Cullin C. Biochem Biophys Res Commun. 1992;184:1490–1495. doi: 10.1016/s0006-291x(05)80051-8. [DOI] [PubMed] [Google Scholar]
- 10.Larson J R, Coon M J, Porter T D. Proc Natl Acad Sci USA. 1991;88:9141–9145. doi: 10.1073/pnas.88.20.9141. [DOI] [PMC free article] [PubMed] [Google Scholar]
- 11.Larson J R, Coon M J, Porter T D. J Biol Chem. 1991;266:7321–7324. [PubMed] [Google Scholar]
- 12.Pernecky S J, Larson J R, Philpot R M, Coon M J. Proc Natl Acad Sci USA. 1993;90:2651–2655. doi: 10.1073/pnas.90.7.2651. [DOI] [PMC free article] [PubMed] [Google Scholar]
- 13.Shank-Retzlaff M L, Raner G M, Coon M J, Sligar S G. Arch Biochem Biophys. 1998;359:82–88. doi: 10.1006/abbi.1998.0889. [DOI] [PubMed] [Google Scholar]
- 14.Altenbach C, Greenhalgh D A, Khorana H G, Hubbell W L. Proc Natl Acad Sci USA. 1994;91:1667–1671. doi: 10.1073/pnas.91.5.1667. [DOI] [PMC free article] [PubMed] [Google Scholar]
- 15.Chattopadhyay A, London E. Biochemistry. 1987;26:39–45. doi: 10.1021/bi00375a006. [DOI] [PubMed] [Google Scholar]
- 16.Abrams F S, London E. Biochemistry. 1992;31:5312–5322. doi: 10.1021/bi00138a010. [DOI] [PubMed] [Google Scholar]
- 17.Bayburt T H, Carlson J W, Sligar S G. J Struct Biol. 1998;123:37–44. doi: 10.1006/jsbi.1998.4007. [DOI] [PubMed] [Google Scholar]
- 18.Bayburt T H, Carlson J W, Sligar S G. Langmuir. 2000;16:5993–5997. [Google Scholar]
- 19.Jonas A, Kézdy K E, Wald J H. J Biol Chem. 1989;264:4818–4824. [PubMed] [Google Scholar]
- 20.Coon M J, van der Hoeven T A, Dahl S B, Haugen D A. Methods Enzymol. 1978;52:109–117. doi: 10.1016/s0076-6879(78)52012-0. [DOI] [PubMed] [Google Scholar]
- 21.Jonas A. Methods Enzymol. 1986;128:553–582. doi: 10.1016/0076-6879(86)28092-1. [DOI] [PubMed] [Google Scholar]
- 22.Savitzky A, Golay M J E. Anal Chem. 1964;36:1627–1639. [Google Scholar]
- 23.Carlson J W, Jonas A, Sligar S G. Biophys J. 1997;73:1184–1189. doi: 10.1016/S0006-3495(97)78150-5. [DOI] [PMC free article] [PubMed] [Google Scholar]
- 24.Carlson J W, Bayburt T, Sligar S G. Langmuir. 2000;16:3927–3931. [Google Scholar]
- 25.Hasemann C A, Ravichandran K G, Peterson J A, Deisenhofer J. J Mol Biol. 1994;236:1169–1185. doi: 10.1016/0022-2836(94)90019-1. [DOI] [PubMed] [Google Scholar]
- 26.Ravichandran K G, Boddupalli S S, Hasermann C A, Peterson J A, Deisenhofer J. Science. 1993;261:731–736. doi: 10.1126/science.8342039. [DOI] [PubMed] [Google Scholar]
- 27.Poulos T L, Finzel B C, Gunsalus I C, Wagner G C, Kraut J. J Biol Chem. 1985;260:16122–16130. [PubMed] [Google Scholar]
- 28.Müller D J, Engel A. Biophys J. 1997;73:1633–1644. doi: 10.1016/S0006-3495(97)78195-5. [DOI] [PMC free article] [PubMed] [Google Scholar]
- 29.Ho R, Yuan J-Y, Shao Z. Biophys J. 1998;75:1076–1083. doi: 10.1016/S0006-3495(98)77597-6. [DOI] [PMC free article] [PubMed] [Google Scholar]
- 30.Miller J P, Herbette L G, White R E. Biochemistry. 1996;35:1466–1474. doi: 10.1021/bi9514572. [DOI] [PubMed] [Google Scholar]
- 31.Graham-Lorence S, Amarneh B, White R E, Peterson J A, Simpson E R. Protein Sci. 1995;4:1065–1080. doi: 10.1002/pro.5560040605. [DOI] [PMC free article] [PubMed] [Google Scholar]
- 32.Edwards R J, Murray B P, Singleton A M, Boobis A R. Biochemistry. 1991;30:71–76. doi: 10.1021/bi00215a011. [DOI] [PubMed] [Google Scholar]
- 33.von Wachenfeldt C, Johnson E F. In: Cytochrome P450: Structure, Mechanism, and Biochemistry. 2nd Ed. Montellano P R O d., editor. New York: Plenum; 1995. pp. 183–244. [Google Scholar]
- 34.Lewis D F, Lake B G. Xenobiotica. 1997;27:443–478. doi: 10.1080/004982597240433. [DOI] [PubMed] [Google Scholar]
- 35.Etter H U, Richter C, Ohta Y, Winterhalter K H, Sasabe H, Kawato S. J Biol Chem. 1991;266:18600–18605. [PubMed] [Google Scholar]
- 36.Gut J, Richter C, Cherry R J, Winterhalter K H, Kawato S. J Biol Chem. 1983;258:8588–8594. [PubMed] [Google Scholar]
- 37.Kawato S, Gut J, Cherry R J, Winterhalter K H, Richter C. J Biol Chem. 1982;257:7023–7029. [PubMed] [Google Scholar]
- 38.Rich P R, Tiede D M, Bonner W D., Jr Biochim Biophys Acta. 1979;546:307–315. doi: 10.1016/0005-2728(79)90048-3. [DOI] [PubMed] [Google Scholar]
- 39.Chang Y T, Stiffelman O B, Vakser I A, Loew G H, Bridges A, Waskell L. Protein Eng. 1997;10:119–129. doi: 10.1093/protein/10.2.119. [DOI] [PubMed] [Google Scholar]
- 40.Sevrioukova I F, Li H, Zhang H, Peterson J A, Poulos T L. Proc Natl Acad Sci USA. 1999;96:1863–1868. doi: 10.1073/pnas.96.5.1863. [DOI] [PMC free article] [PubMed] [Google Scholar]
- 41.Wang M, Roberts D L, Paschke R, Shea T M, Masters B S S, Kim J P. Proc Natl Acad Sci USA. 1997;94:8411–8416. doi: 10.1073/pnas.94.16.8411. [DOI] [PMC free article] [PubMed] [Google Scholar]
- 42.Zhao Q, Modi S, Smith G, Paine M, McDonagh P D, Wolf C R, Tew D, Lian L Y, Roberts G C, Driessen H P. Protein Sci. 1999;8:298–306. doi: 10.1110/ps.8.2.298. [DOI] [PMC free article] [PubMed] [Google Scholar]
- 43.Shen A L, Kasper C B. J Biol Chem. 1995;270:27475–27480. doi: 10.1074/jbc.270.46.27475. [DOI] [PubMed] [Google Scholar]


