

Abstract
Context
The COVID-19 health crisis has triggered major economic shocks globally, particularly affecting the fragile economies of Central Africa. The region, faced with institutional challenges and sometimes fragile governance, has had to implement strict health measures (lockdowns, border closures, etc.) to limit the spread of the virus. However, the impact of these measures on economic resilience remains underexplored, particularly with regard to the influence of corruption in this process. This study aims to analyze the effects of COVID-19 control measures on economic resilience in the region, with a specific focus on the role of corruption.
Methods
The study is based on an econometric analysis using panel data covering several Central African countries during the pandemic. We use Ordinary Least Squares (OLS) and Triple Least Squares (TLS) regressions to estimate the impact of economic support policies, health measures, and corruption on the economic resilience index. Variables include income support, debt relief, and other health measures such as school and workplace closures. The corruption indicator is included to assess its influence on economic recovery.
Results
The results show that income support policies and debt relief have a significant impact on economic resilience, but corruption exacerbates the negative effects on growth. Countries with higher levels of corruption experience slower economic recovery. Health measures such as school and workplace closures also have negative effects, although these are mitigated by appropriate support policies.
Conclusions
This study reveals that corruption plays a key role in post-COVID economic resilience in Central Africa. More transparent governance and stronger institutions are crucial to building resilience in the face of health crises. Recommendations include better management of public resources and the adoption of more inclusive economic policies to accelerate economic recovery.
Keywords: Central Africa, Corruption, GDP, Resilience, Economic growth
Introduction
The COVID-19 pandemic has profoundly disrupted economic, health, cultural, financial, and governmental systems worldwide. Through its unprecedented and relatively rapid contagion effect, it has posed a particularly serious threat to the economies of developing countries, particularly in sub-Saharan Africa. Compared with previous pandemics, this pandemic has proven to be the most costly in history [1]. According to some studies, COVID-19 has caused a loss of 0.3 to 2.2% of global GDP, induced by a triple shock demand, production, and financial [2, 3]. The economic slowdown observed during the pandemic even exceeded that of the 2008–2009 financial crisis. In sub-Saharan Africa, this shock led to a contraction in economic activity of 2.8% in 2020, in a context marked by high uncertainty, after a modest growth of 2.2% in 2019 [4]. Although a slight recovery was observed with rates of 4.6% in 2021, 3.6% in 2022, and 2.5% in 2023 the crisis has highlighted the region's structural vulnerabilities.
Yet, paradoxically, the crisis also generated positive externalities. Indeed, in the fields of teaching, research, and entrepreneurship, COVID-19 acted as a catalyst for the accelerated use of information and communication technologies (ICTs). According to Ziemba and Eisenbardt [5], and Papaioannou [6], higher education experienced an unprecedented digital transformation. Online learning and collaborative platforms became more widespread and institutionalized [7], while universities adapted their operations through interactive tools [8]. At the entrepreneurial level, ICTs also enabled the survival of many micro-enterprises, allowing them to maintain activity despite physical constraints [9]. These developments have paved the way for long-term transformation and resilience across sectors.
Historically, pandemics have long had devastating effects on human societies. The Plague of Justinian, the Black Death, the Spanish flu, and more recently HIV/AIDS, have caused millions of deaths and widespread socio-economic disruption [10]. These past crises underscore the vital role of institutional, medical, and economic resilience in confronting global shocks.
In this context, economic growth resilience defined as an economy’s capacity to absorb and adapt to shocks while maintaining or returning to a growth trajectory has emerged as a central concern. Although the concept lacks a unified theoretical framework, it is widely studied [11–15]. Most definitions converge on the idea of dynamic adjustment and sustainability in the face of crises.
Meanwhile, corruption adds a further layer of complexity to this resilience. The literature offers diverging perspectives: while institutionalist theories [16] emphasize the negative impact of corruption on governance and recovery, other works such as Leff [17] defend a more controversial thesis, suggesting that in weak institutional contexts, corruption may act as a functional workaround. However, empirical studies largely support the former view: corruption impedes investor confidence, distorts public policy, and weakens economic recovery [18–20].
In Central Africa, response measures to COVID-19 including lockdowns, border closures, and mobility restrictions have further exposed structural fragilities [21, 22]. At the same time, corruption has emerged as a potentially decisive factor in explaining the region's limited resilience. On the one hand, it can intensify crises by misallocating public resources, while on the other, some view it as a coping mechanism against administrative inefficiencies [17].
Hence, a key debate arises: is corruption a hindrance or a facilitator of economic resilience in the face of COVID-19 in Central Africa? This question becomes even more pertinent considering that crisis management policies themselves may be conditioned directly or indirectly by corruption. In this regard, it is crucial to understand how COVID-19 containment measures have impacted the resilience of economic growth in Central Africa, and to what extent corruption acts as a mediating factor.
Therefore, this study aims to evaluate the effects of anti-COVID-19 measures on the resilience of economic growth in Central Africa, with a particular focus on the mediating role of corruption. Specifically, it seeks to assess the direct impact of COVID-19 containment measures on the resistance of economic growth. Examine their influence on economic recovery capacity. Analyze the indirect effects of these measures through the channel of corruption.
This research contributes to the literature in four major ways. First, unlike existing studies [23, 24], which generally assess the direct impact of COVID-19 on macroeconomic performance, this study introduces an original perspective by modeling short-term economic resilience through two indicators: resistance (2020) and recovery (2021). Second, it bridges a gap in both theoretical and empirical research by examining the mediating effect of corruption, a dimension rarely explored in this context. Third, it diverges from most resilience analyses that take a long-term view [11, 14], aligning instead with the short-term analytical approach advocated by Martin [13].
Fourth, from a methodological standpoint, the study employs daily economic data extrapolated from annual aggregates, and mobilizes a threefold empirical approach: (i) resilience indicator modeling; (ii) estimation using structural equation modeling [25], and (iii) the N-SIRD epidemiological model adapted for economic analysis [24]. Robustness is reinforced through the application of advanced econometric techniques, including OLS, TLS, DMC, Driscoll-Kraay, and Lewbel methods.
Ultimately, this study proposes a multidimensional and innovative framework to better understand the complex interplay between public health crises, institutional weaknesses, and economic adaptability in Central Africa.
The structure of the article is as follows: a literature review on economic resilience and the impacts of COVID-19 (Sect. Literature review on economic resilience), a presentation of the methodology (Sect. Methodolog), the results (Sect. Results) and the discussion of the results (Sect. Discussion of results).
Literature review on economic resilience
The literature on the impact of COVID-19 response measures on economic growth resilience is organized around two dimensions: first, the fundamental analysis of the concept of economic growth resilience, and second, recent studies devoted to the link between COVID-19 and economic growth. These two aspects are explored in this section.
Theoretical and empirical foundations of economic growth resilience
The concept of resilience, originally rooted in ecology [26] and biology [27], has been transposed into economics to better understand the capacity of systems to cope with shocks. Today, two main approaches are debated: static resilience, which measures the ability to absorb a shock and return to the initial state, and dynamic resilience, which focuses on the system's ability to transform in response to disturbances [28, 29].
Classical approaches [30–32], are based on the assumption that economies naturally tend towards equilibrium. Neoclassical economists integrate exogenous shocks into endogenous growth models, while Keynesians, such as Keynes [33] or Stiglitz et al. [34], emphasise the stabilising role of public policies.
A more contemporary debate contrasts advocates of “endogenous” resilience, embedded in institutional structures [16], with those who stress the importance of exogenous innovation and adaptation [35]. This tension is reflected in the dichotomy between structural resilience (rooted in the quality of institutions and economic diversification) and contextual or conjunctural resilience, which depends on short-term political responsiveness.
Our study is positioned within this debate, offering a contextual reading applied to the economies of Central Africa, where weak institutions profoundly alter the mechanisms of resilience.
Early empirical work [12] attempted to measure resilience through composite indices, combining economic, political, and institutional factors. These indicators, such as the Growth with Resilience Index or the IMF’s Economic Resilience Indicator (2014), were primarily designed for developed economies. They therefore raise questions about their transferability in contexts with weak governance.
Studies such as those by Diop et al. [36] have extended these approaches to a heterogeneous panel of countries by classifying economies based on their vulnerability-resilience profile. However, these analytical frameworks remain relatively insensitive to atypical shocks such as pandemics, where public health policy responses interact with the economic sphere.
Our contribution lies in adapting these empirical tools to economies with low institutional capacities by incorporating a health stringency indicator and measures specific to the highly informal economies prevalent in Central Africa.
The Covid-19 crisis: a catalyst and revealer of resilience gaps
The pandemic sparked an extensive debate on the economic costs of lockdowns and other restrictive measures. [22] and Fornaro & Wolf [37] demonstrated that lockdowns can lead to Keynesian supply shocks, simultaneously reducing demand. These effects were confirmed by DSGE modelling [38], combined with epidemiological models [2].
However, other studies [39, 40], highlight that when health measures are effectively applied, they can promote a faster economic recovery by restoring confidence. The debate here focuses on the trade-off between short-term costs and medium-term benefits.
Our work aligns with this perspective by evaluating the impact of measures according to country-specific contexts and the stringency of their application, using contrasting cases such as Rwanda (good resilience) and Congo (resilience weakened by poor governance).
The literature has also revealed fractures between developed and emerging economies. While global value chains helped cushion shocks in some cases [41, 42], other studies [43] show that sub-Saharan Africa experienced fiscal losses and rising unemployment. Heterogeneous performances between regions [44, 45] highlight the importance of sectoral structures and political responses.
Recent literature [46, 47] has also highlighted the role of digital infrastructure in resilience, facilitating economic continuity via remote work. Similarly, Li et al. [48] show that structural projects such as the CPEC have promoted stability. While acknowledging this contribution, our study emphasises the limitations of digitalisation in Central Africa due to insufficient infrastructure.
The link between corruption and resilience of growth is highly debated. While agency theory [49] and public choice theory [50] highlight its detrimental effects on economic performance, some authors [17, 51] argue that, in a failing institutional context, corruption might facilitate economic activity by bypassing administrative burdens.
Nevertheless, the majority of empirical studies [52–54] conclude that corruption has a structurally negative effect on growth and resilience by undermining investment, trust, and the effectiveness of public policies. This conclusion is reinforced by Chêne & Robin [55] and Tsiotas & Katsaiti [56], who establish a direct link between corruption, inequality, and the weakness of safety nets.
The health crisis strikingly illustrated the role of governance in resilience capacity. Mlambo & Masuku [57] showed that corruption weakened support mechanisms in South Africa. Arabiat et al. [58] showed that a combination of good governance, monetary reserves, and economic freedom helped limit corruption during crises.
Our study is positioned at the heart of this tension. By taking corruption as a key governance indicator, it demonstrates that the most corrupt countries in Central Africa were also those with the most limited economic resilience.
Methodology
Modeling of sensitivity and recovery indices
The economic resilience model is based on theoretical foundations that examine the ability of economic systems to absorb, adapt, and transform in the face of external shocks. Duval and Vogel [59], in the OECD Economic Review, studied how structural policies strengthen economic resilience by stabilizing macroeconomic fluctuations and promoting sustainable growth. Their approach emphasizes the importance of strong institutions and governance mechanisms in mitigating the impacts of crises. Furthermore, Douglass North [16], in his book Institutions, Institutional Change, and Economic Performance, emphasizes that the quality of institutions plays a key role in the ability of economies to overcome disruptions by facilitating adaptation and reducing inefficiencies. This work provides an essential theoretical framework for understanding the mechanisms of economic resilience.
Let  ,
,  and
and  be the growth rates at peak
  to trough
  and at peak, respectively
 . Thus,
  denotes the rate of decline of economic growth, i.e., its percentage drop. It is calculated between
  and
and  (recession phase (r)), as follows:
 |
 , denotes the rate of decline of economic growth or the intensity of GDP recovery. It is calculated between points C m and P 2 m (recession phase (e)) as follows:
 |
From the resilience intensity variables, we can construct the sensitivity index (SI) which corresponds to the rate of decline in economic growth ( )
)  compared to the national average decline.
 |
Also, we can construct the recovery index (RI) defined as the rate of economic growth  compared
  to the average expansion of the country
  after the crisis by the formulation:
 |
The following modeling allows us to evaluate the temporality of the shock in terms of both decline and recovery. For the duration of the decline ∆t C it is measured in years before the first peak P 1 m and the trough C m with:
 |
The rebound can be described as rapid when the duration of the decline calculated for each country is less than or equal to that of the reference cycle, i.e. 1 to 2 years. For the recovery duration, ∆t R it is measured in years between the first peak P 1 m and the recovery point R m1 either:
 |
Recovery will be described as rapid when this duration is less than or equal to that of the reference cycle which is 2 to 3 years, otherwise it is slow.
Analysis models
Structural equation model: mediation analysis
We deepen the study by carrying out mediation analysis. The study uses a mediation: corruption. The approach followed in this study is inspired by Ang [60] and taken up by Ndoya et al. [61] and illustrated in the graph below (refer to Fig. 1);
Fig. 1.
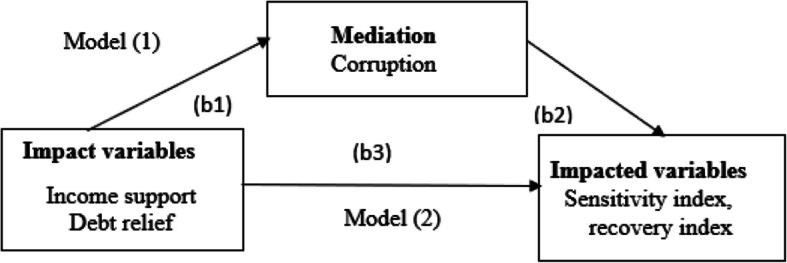
Model for analysing the mediation between measures to combat Covid-19 and economic resilience. Source: Authors
This approach involves the subsequent estimation of two regression equations which are:
Model 1:


Model 2:


Where Medit represents the mediation variable (corruption). The composition effect is derived from the above two models as follows:
 |
First, we estimate Model (1), which is the effect of the impact variables (income support and debt relief) (refer to Table 9 - Appendix) on the mediator (corruption); b1 is the parameter describing this effect. The second step is to estimate Model (2), where we regress growth resilience through sensitivity and recovery on debt support and the budget balance, controlling for the mediator. The magnitude of this effect is provided by the coefficient of the variables income support and debt relief (b2). The indirect effect is obtained from the product of b1 and b3, where b3 measures the correlation strength between income support, debt relief, and the mediators in Model (2). This term also reflects the size of the mediation, which essentially depends on the extent to which income support and debt relief affect the mediators (b1) and the extent to which the mediator influences economic growth resilience (b3).
N-SIRD model
Thus, the study retains the N-SIRD model used by Pongou et al., [24]. The equation of the model is as follows:
 |
1 |
where  is a variable counting the total number of deaths due to Covid19 in nursing home i, in county j and US state S;
  is the tolerable infection incidence in US states s;
  is the centralized index of eigenvectors for the nursing home;
  is the average socioeconomic status of county j;
  is an indicator indicating whether nursing home i is for-profit (1 if for-profit and 0 otherwise);
  represents other exogenous characteristics of the nursing home, including the constant and
  is the county fixed effect,
  ;
;  ;
;  ;
;  and
and  ;
;  and
and  are the parameters of interest. We take this linear equation from Pongou et al. [24] by integrating our analysis variables. Thus, we will rewrite this equation in the simplest possible way because the index i which will indicate the individual and j the period of application of the measures to combat Covid-19. Also, we replace the dependent variable with our sensitivity indices (SI) in the first equation of 2020 and the recovery index (RI) in the second equation of 2021. In addition, the variables of interest are of two orders, health measures and economic measures; we keep the different coefficients of interest. The following linear equations will be estimated;
 |
2 |
 |
3 |
These equations are estimated by the ordinary least squares (OLS) method [24]. Other methods can be used to estimate these equations. For example, quantiles and generalized least squares. These methods are valid from econometric tests.
Ordinary least squares (OLS) has several limitations, particularly when endogeneity issues exist. These limitations have been widely discussed in the literature. For example, Theil [62] and Basmann [63] showed that OLS produces biased and inconsistent estimators when the explanatory variables are correlated with the error term. This problem can arise due to simultaneity, omitted variables, or measurement errors [64]. To address these limitations, alternative methods such as two-stage least squares (2SLS) have been developed, allowing the use of instrumental variables to correct for endogeneity. This method is particularly useful in simultaneous equation models, where the causal relationships between variables are complex.
Structural equation models (SEMs) offer a powerful approach to analyzing causal relationships between latent and observed variables. Jöreskog [65] pioneered the development of these models, which combine factor analysis and multiple regression. However, SEMs are not without challenges, particularly regarding model identification and measurement error management. To address endogeneity issues in SEMs, methods such as those proposed by Driscoll and Kraay [66] to correct for spatial and temporal correlations, or Lewbel's [67] heteroscedasticity-based approach, are often used. These techniques improve the robustness of estimates and ensure more reliable results.
Data
The study is carried out on a sample of 11 Central African countries over a period from 2020 to 2021. Thus, it uses daily data from 2020 and 2021 on measures to combat COVID-19 and corruption. These daily data come from two sources, Oxford University,2which was put online on January 1, 2020. This database provides data on measures to combat COVID-19, more specifically public health measures and economic measures. The Afrobarometer survey database on corruption was put online in 2020. In addition, the study uses World Bank data on the economic growth rate over the periods 2020–2021. These data are used to model the sensitivity and recovery indices. In addition, after calculating these indices, they are made daily by the following formula:
 |
with V j as the daily value we want to obtain, V cal the global calculated value with the global data, N j the total number of days. With j ranging from 1 to 365 days. We multiply by 100 to have the estimable coefficients. Secondary data on the variables used in the analysis were collected as follows:
Health policy measures taken as indicators. These indicators are 11 in number, namely, school closures, workplace closures, cancellation of public events, restrictions on gatherings, public transport, stay-at-home orders, and restrictions on internal movement. These measures are categorized on a scale ranging from 0 to 100 for some and 0 and 1 for others. We also have the handwashing index. The economic measures taken as indicators are also four, namely, income support, debt relief. In addition, income support measures. Economic growth is taken in terms of GDP.3
Results
Descriptive statistics provide an interesting overview of the variables studied (Table 1). The GDP sensitivity index (GDI) has a mean of 0.184, with a large variation (standard deviation of 0.397), indicating significant fluctuations in economic sensitivity among the countries studied. Income support and debt relief have means of 0.475 and 0.986, respectively, with fairly high standard deviations, suggesting diversity in the application of these aid measures. Corruption, measured by an index from 0 to 1, has a mean of 0.094, indicating that, on average, countries have a low corruption index in the available data.
Table 1.
Summary statistics of key variables related to economic resilience and COVID-19 measures
| Variable | Obs | Mean | Std. Dev | Min | Max |
|---|---|---|---|---|---|
| IS GDP | 3199 | .184 | .397 | -.378 | .708 |
| Income support | 3199 | .475 | .588 | 0 | 2 |
| Debt relief | 3199 | .986 | .905 | 0 | 2 |
| corruption | 3199 | .094 | .292 | 0 | 1 |
| School closure | 3199 | 2,028 | .986 | 0 | 3 |
| Workplace closures | 3199 | 1,373 | .906 | 0 | 3 |
| Cancellation of events | 3199 | 1,169 | .826 | 0 | 3 |
| Quarantine | 3199 | 51,745 | 17,183 | 7.14 | 85.12 |
| Containment index | 2906 | 18,242 | 17,069 | 2,735 | 50.54 |
| Hand washing | 3199 | 2,586 | 1,284 | 0 | 4 |
| Restriction of gatherings | 3199 | .496 | .596 | 0 | 2 |
| Public transport | 3199 | 3.021 | 1,012 | 0 | 4 |
| Variable | Obs | Mean | Std. Dev | Min | Max |
| IR GDP | 4015 | .192 | .546 | -.379 | 1.61 |
| School closure | 4015 | .215 | .371 | 0 | 1.5 |
| Workplace closures | 4015 | .552 | .691 | 0 | 2 |
| Cancellation of events | 4015 | .091 | .288 | 0 | 1 |
| Quarantine | 4015 | .506 | .689 | 0 | 3 |
| Containment index | 4015 | .916 | .789 | 0 | 2.5 |
| Hand washing | 4015 | 1.116 | .867 | 0 | 2 |
| Restriction of gatherings | 4015 | 44,134 | 16,954 | 9.52 | 72.98 |
| Public transport | 4015 | 407,092 | 443,306 | 2 | 1851 |
| School closure | 4015 | 2,247 | 1,336 | 0 | 4 |
| Workplace closures | 4015 | .345 | .492 | 0 | 2 |
| Cancellation of events | 4015 | 1,662 | .79 | 0 | 4 |
Sources: Authors
Regarding health measures, school and workplace closures have an average of 2,028 and 1,373 respectively, with maximum values reaching 3 and 2, reflecting the diversity in the intensity of the restrictions applied. Other measures, such as quarantine (average of 51,745 days) and the confinement index (18,242), reveal that countries have adopted a range of strict measures, although these figures show great variation.
For the GDP recovery index (GDPRI), with a mean of 0.192 and a standard deviation of 0.546, economic recovery also appears to vary significantly across countries. Containment measures, such as restrictions on gatherings (mean of 44,134) and public transport (mean of 407,092), present extreme values, showing considerable disparities in pandemic management policies. Overall, the results reveal significant heterogeneity in countries'economic and health responses, highlighting the importance of taking these variations into account for further analyses.
Tables 10 and 11 (Appendix) present the correlation matrices for the sensitivity or resistance index and the recovery or return to equilibrium index, respectively.
In Table 10, a negative correlation is observed between IS GDP and several restriction measures, such as business closures (−0.216), travel restrictions (−0.380), and gathering limitations (−0.090). This suggests that economies more sensitive to shocks were more affected by these restrictions. Conversely, corruption shows a positive correlation with IS GDP (0.319), indicating that the most impacted economies may be characterized by weaker governance.
Table 11, on the other hand, reveals that IR GDP is also negatively correlated with several containment measures, including business closures (−0.264) and transportation restrictions (−0.274), suggesting that restrictions delayed economic recovery. Furthermore, corruption exhibits a negative correlation with IR GDP (−0.120), confirming that poor governance can hinder recovery.
These findings corroborate the analyses of Figs. 2 and 3 (Appendix), which highlight the impact of restriction measures and governance on economic resilience and recovery.
The Table 2 presents data on economic intensity, the index of sensitivity or resistance to economic growth (IS_pib), and the index of recovery or return to equilibrium (IR_pib) for different countries between 2020 and 2021. In general, countries that have better controlled corruption appear to display higher recovery indices. For example, Angola, despite a recession in 2020, shows a strong recovery in 2021, suggesting that corruption management facilitated this recovery. Similarly, Chad, with good resilience to the crisis and a positive recovery, appears to benefit from effective reforms, including in the fight against corruption. In contrast, countries such as the Democratic Republic of Congo, despite low initial growth, have not shown significant signs of recovery, which could be linked to ineffective corruption management.
Table 2.
Results of economic intensities, the index of sensitivity or resistance of economic growth (IS_pib) and index of recovery or return to equilibrium (IR_pib) of economic growth
| country | Int_pib2020 | IS_pib2020 | Int_pib2021 | IR_pib2021 |
|---|---|---|---|---|
| Angola | −0.3000213 | −0.0154698 | 0.0089592 | 0.0230925 |
| Burundi | 0.0476224 | 0.048519 | 0.0267633 | 0.0064335 |
| Cameroon | 0.0430257 | 0.0367741 | 0.0349982 | −0.0005719 |
| Central African Republic | 0.0204096 | −0.0063286 | 0.0205872 | 0.0308808 |
| Chad | 0.0387783 | 0.0490464 | 0.0218739 | 0.0140107 |
| Congo | −0.5969812 | −0.0261632 | 0.0100425 | 0.0605063 |
| Congo, Dem, Rep, of tea | 0.0187861 | −0.0121326 | −0.0193762 | −0.0142479 |
| Equatorial Guinea | 0.0056126 | 0.019696 | 0.0189066 | −0.0056822 |
| Gabon | 0.0447442 | 0.0344014 | 0.0188716 | 0.0022875 |
| Rwanda | 0.0415712 | 0.0265682 | 0.025734 | −0.0052477 |
| São Tomé and Príncipe | 0.0337951 | 0.0451835 | 0.0707685 | 0.0047635 |
Source: authors
Burundi, despite showing good resilience in 2020, showed a weak recovery in 2021, suggesting that corruption may have hampered a faster recovery. Countries such as Gabon and Equatorial Guinea, despite moderate growth, showed a weak recovery, which could indicate that the fight against corruption did not have a sufficient impact to foster a stronger recovery. Finally, countries such as Congo, despite a sharp recession in 2020, showed a solid recovery capacity in 2021, which could also reflect more effective management of economic challenges, including corruption. In sum, this analysis shows that the ability to control corruption plays a crucial role in the economic resilience of countries, influencing their ability to recover quickly from economic shocks.
The analysis of this Table 3 highlights the main determinants of economic resilience in 2020, measured by IS_pib, and their estimated impact through different econometric specifications.
Table 3.
Basic result on the relationship between COVID-19 control measures and the sensitivity index: Estimation by ordinary least squares (OLS) and triple least squares (TLS)
| MCO | MCO | MCO | MCO | MCO | MCO | TMC | |
|---|---|---|---|---|---|---|---|
| IS_pib | IS_pib | IS_pib | IS_pib | IS_pib | IS_pib | IS_pib | |
| VARIABLES | 1 | 2 | 3 | 4 | 5 | 6 | 7 |
| Income support | 0.0302*** | 0.00832 | 0.0459*** | 0.0442*** | 0.0442*** | ||
| (0.0100) | (0.0100) | (0.0101) | (0.0135) | (0.0135) | |||
| Debt relief | 0.0580*** | 0.0567*** | 0.0705*** | 0.115*** | 0.115*** | ||
| (0.00763) | (0.00779) | (0.00770) | (0.00812) | (0.00902) | |||
| Corruption | −0.383*** | −0.433*** | −0.0369 | −0.0369 | |||
| (0.00744) | (0.0103) | (0.0233) | (0.0278) | ||||
| School closure | −0.0940*** | −0.0940*** | |||||
| (0.0114) | (0.0113) | ||||||
| Workplace closures | −0.0291** | −0.0291** | |||||
| (0.0115) | (0.0113) | ||||||
| Cancellation of events | −0.227*** | −0.227*** | |||||
| (0.0115) | (0.0132) | ||||||
| Quarantine | 0.000924 | 0.000924 | |||||
| (0.000962) | (0.00111) | ||||||
| Containment index | −0.00863*** | −0.00863*** | |||||
| (0.000455) | (0.000486) | ||||||
| Hand washing | 0.110*** | 0.110*** | |||||
| (0.00799) | (0.00814) | ||||||
| Restriction of gatherings | −0.106*** | −0.106*** | |||||
| (0.0127) | (0.0128) | ||||||
| Public transport | 0.00878 | 0.00878 | |||||
| (0.00721) | (0.00738) | ||||||
| Constant | 0.169*** | 0.126*** | 0.148*** | 0.124*** | 0.0517*** | 0.374*** | 0.374*** |
| (0.00973) | (0.0107) | (0.00744) | (0.0118) | (0.0126) | (0.0254) | (0.0263) | |
| Observations | 3,199 | 3,199 | 3,199 | 3,199 | 3,199 | 2,906 | 2,906 |
| R-squared | 0.002 | 0.017 | 0.079 | 0.018 | 0.114 | 0.400 | 0.400 |
| F | 9,078 | 57.83 | 29.26 | 929.0 | 500.6 |
Source: Authors
Income support emerges as a key factor promoting economic resilience. Its effect is positive and significant in several specifications, notably in models (1), (5), (6) and (7), with a coefficient reaching 0.0459 in model (5). This suggests that income support measures have helped mitigate the negative economic impact of the crisis by stabilizing consumption and maintaining economic activity.
Similarly, debt relief has a significant and positive impact on IS_gdp in all models where it is included. Its coefficient varies between 0.0567 and 0.115, which shows that the reduction in the debt burden played a key role in the ability of economies to recover more quickly from the 2020 shock.
The impact of corruption on economic resilience is overall negative and significant in models (3) and (5), with a coefficient reaching −0.433. This confirms that high levels of corruption exacerbated economic vulnerability in 2020, likely by reducing the effectiveness of stimulus measures and diverting essential public resources. However, in the more comprehensive models (6 and 7), this effect becomes statistically insignificant, which may indicate that other institutional variables capture part of this impact.
School and workplace closures, and event cancellations all have significant negative effects on economic resilience. Their respective coefficients (−0.094, −0.0291, and −0.227) show that these restrictions have hampered economic growth, likely by limiting productivity and disrupting supply chains.
The lockdown index is also negatively associated with IS_pib (−0.00863), indicating that stricter restrictions had a direct economic cost. In contrast, some health measures such as handwashing are positively correlated with economic resilience (0.110), suggesting that better public hygiene may have limited the spread of the virus while allowing a faster resumption of activity.
Table 4 analyzes the mediation effect of corruption in the relationship between certain economic policies (income support and debt relief) and economic resilience, measured by the IS_gdp indicator. This model highlights the direct and indirect impact of these policies on economic performance and how corruption intervenes in this dynamic.
Table 4.
Mediation effect
| 1 (1a) | 2 (1b) | 3 (2a) | 4 (2a) | |||
|---|---|---|---|---|---|---|
| VARIABLES | Corruption | IS_pib | Corruption | IS_pib | ||
| Income support | 0.104*** | 0.0392*** | ||||
| (0.00727) | (0.0130) | |||||
| Debt relief | 0.0416*** | 0.0893*** | ||||
| (0.00441) | (0.00807) | |||||
| Corruption | −0.155*** | −0.178*** | ||||
| (0.0248) | (0.0262) | |||||
| School closure | −0.0946*** | −0.109*** | ||||
| (0.0100) | (0.0112) | |||||
| Workplace closures | −0.0598*** | −0.0535*** | ||||
| (0.0106) | (0.0112) | |||||
| Cancellation of events | 0.0956*** | 0.107*** | ||||
| (0.0174) | (0.0191) | |||||
| Quarantine | −0.212*** | −0.201*** | ||||
| (0.0108) | (0.0111) | |||||
| Containment index | 0.00703*** | 0.0107*** | ||||
| (0.00112) | (0.00110) | |||||
| Hand washing | −0.0117*** | −0.0137*** | ||||
| (0.000478) | (0.000431) | |||||
| Restriction of gatherings | 0.0789*** | 0.0645*** | ||||
| (0.00741) | (0.00763) | |||||
| Public transport | −0.0366** | −0.0279* | ||||
| (0.0146) | (0.0153) | |||||
| Traffic restrictions | −0.232*** | −0.255*** | ||||
| (0.0127) | (0.0136) | |||||
| Constant | 0.141*** | 0.336*** | 0.144*** | 0.303*** | ||
| (0.00861) | (0.0246) | (0.00788) | (0.0260) | |||
| Observations | 2,906 | 2,906 | 2,906 | 2,906 | ||
| Mediating effect through corruption | ||||||
| Coeff | Std. Error | P-value | Coeff | Std. Error | P-value | |
| (A) Mediation test | ||||||
| Delta | −0.018 | 0.003 | 0.000 | −0.006 | 0.001 | 0.000 |
| Sobel | −0.018 | 0.003 | 0.000 | −0.006 | 0.001 | 0.000 |
| Monte Carlos | −0.019 | 0.003 | 0.000 | −0.007 | 0.001 | 0.000 |
| (A) Composition of the effect | ||||||
| Indirect effect (Sobel) | 0.4 | 0.054 | ||||
| Direct effect | 0.15 | 0.02 | ||||
| Total effect | 0.55 | 0.074 | ||||
| % of total mediation effect | 32% | 7% | ||||
Source: Authors
The results show that income support has a positive and significant effect on IS_gdp, indicating that this policy promotes economic resilience. This suggests that providing direct aid to households and businesses helps mitigate the negative effects of economic shocks and maintain economic activity.
Debt relief also has a positive and significant effect on IS_gdp, meaning that reducing the financial burden on economic agents contributes to improving their resilience to crises. However, unlike income support, this policy also has a significant impact on reducing corruption, which could indicate that debt management is subject to stricter controls or that it limits opportunities for misappropriation.
Corruption itself has a negative and significant effect on IS_gdp, confirming its deleterious impact on economic performance. This means that higher levels of corruption are associated with a decrease in economic resilience, likely due to misallocation of resources, ineffective public policies, and weakened confidence among economic agents.
Moreover, corruption is influenced by the economic policies studied. While income support appears to be correlated with an increase in corruption, debt relief tends to reduce it. This result suggests that direct aid may be more prone to misappropriation and fraudulent practices, while debt relief measures may be better regulated or monitored.
Mediation tests (Delta, Sobel, and Monte Carlo) indicate that corruption plays a statistically significant role in transmitting the effects of economic policies on IS_gdp. All these tests show a significant negative indirect effect for income support and debt relief, confirming that corruption reduces the effectiveness of these policies.
In terms of the composition of the total effect, the indirect effect via corruption accounts for 32% of the total effect of income support on IS_gdp and 7% of the total effect of debt relief. This means that for income support, a significant part of its positive impact is absorbed by the negative effects of corruption, reducing its overall effectiveness. In contrast, the indirect effect for debt relief is relatively small, suggesting that this policy is less affected by corruption-related distortions.
This Table 5 analyzes the effect of different policies and variables on the return to equilibrium of economic growth (IR_gdp), which measures economic resilience after a shock. The estimation is carried out using the ordinary least squares (OLS) method with different specifications and a TCM (Triple Least Squares) model in the last column.
Table 5.
Basic result on the relationship between COVID-19 control measures and the recovery index: Estimation by MCO and TMC
| MCO | MCO | MCO | MCO | MCO | MCO | TCM | |
|---|---|---|---|---|---|---|---|
| IR_pib | IR_pib | IR_pib | IR_pib | IR_pib | IR_pib | IR_pib | |
| VARIABLES | 1 | 2 | 3 | 4 | 5 | 6 | 7 |
| Income support | −0.227*** | −0.0713*** | −0.0944*** | −0.0170** | −0.0170** | ||
| (0.0154) | (0.0160) | (0.0164) | (0.0154) | (0.0210) | |||
| Debt relief | −0.190*** | −0.172*** | −0.205*** | −0.216*** | −0.216*** | ||
| (0.00980) | (0.0104) | (0.0113) | (0.0102) | (0.0111) | |||
| Corruption | −0.228*** | −0.375*** | −0.0796*** | −0.0796** | |||
| (0.00942) | (0.0152) | (0.0260) | (0.0330) | ||||
| School closure | −0.163*** | −0.163*** | |||||
| (0.0118) | (0.0117) | ||||||
| Workplace closures | −0.0830*** | −0.0830*** | |||||
| (0.00931) | (0.0101) | ||||||
| Cancellation of events | 0.225*** | 0.225*** | |||||
| (0.0112) | (0.0115) | ||||||
| Quarantine | −0.0235*** | −0.0235*** | |||||
| (0.00104) | (0.000922) | ||||||
| Containment index | −0.000697*** | −0.000697*** | |||||
| (1.85e-05) | (1.84e-05) | ||||||
| Hand washing | 0.214*** | 0.214*** | |||||
| (0.0105) | (0.00867) | ||||||
| Restriction of gatherings | 0.160*** | 0.160*** | |||||
| (0.0181) | (0.0159) | ||||||
| Public transport | 0.154*** | 0.154*** | |||||
| (0.00963) | (0.00901) | ||||||
| Constant | 0.241*** | 0.297*** | 0.213*** | 0.302*** | 0.360*** | 0.743*** | 0.743*** |
| (0.0109) | (0.0129) | (0.00942) | (0.0132) | (0.0152) | (0.0202) | (0.0232) | |
| Observations | 4,015 | 4,015 | 4,015 | 4,015 | 4,015 | 4,015 | 4,015 |
| R-squared | 0.024 | 0.058 | 0.014 | 0.060 | 0.096 | 0.461 | 0.461 |
| F | 216.7 | 377.4 | 197.4 | 375.4 |
Source: Authors
Robust standard errors in parentheses
***p < 0.01
**p < 0.05
*p < 0.1
Income support has a negative and statistically significant effect on in all specifications. This means that income support policies slow the return to normal economic growth. One possible explanation is that these policies create inefficiency or dependency effects, reducing the incentive for economic agents to adapt quickly after the crisis. However, this negative effect is attenuated in the final model (column 7), where the magnitude is reduced, suggesting that other variables influence this relationship.
Debt relief also has a negative and significant effect on economic resilience. This suggests that, while this measure helps in the short term, it can prolong economic adjustment by changing the incentives of firms and households. Indeed, those who benefit from debt relief may delay restructuring or innovation decisions, thus slowing economic recovery.
Corruption has a strong and significant negative impact on IR_gdp. In other words, the higher the corruption, the slower the economic recovery. This result indicates that corruption can reduce the effectiveness of public policies, divert resources to unproductive uses, and hamper investment and innovation. The magnitude of this effect becomes more pronounced in more comprehensive models, suggesting that corruption acts independently of other economic and health measures.
Restrictive measures taken in response to the economic and health shock have diverse effects on economic recovery. School and workplace closures have a significant negative effect on IR_gdp for both schools and workplaces. This indicates that these measures have slowed the recovery, likely due to their impacts on productivity and learning.
In contrast, event cancellations had a significant positive effect, meaning they promoted a faster recovery. This may be because these restrictions limited the spread of the health shock, thus reducing its long-term economic impact. Similarly, handwashing, restrictions on gatherings, and restrictions on public transport appear to have contributed positively to the recovery, likely by helping to control the crisis without excessively affecting economic activity.
This Table 6 examines the effect of corruption as a mediator between selected economic policies and the resilience of economic growth (IR_gdp) in 2021. It also shows the direct and indirect effect of these variables, as well as the proportion of the total effect that is mediated by corruption.
Table 6.
Result on the relationship between COVID-19 control measures and the recovery index: Estimation of mediation in 2021 by corruption
| 1 | 2 | 3 | 4 | |||
|---|---|---|---|---|---|---|
| VARIABLES | Corruption | IR_pib | Corruption | IR_pib | ||
| Income support | 0.142*** | −0.210*** | ||||
| (0.00728) | (0.0171) | |||||
| Debt relief | 0.105*** | −0.194*** | ||||
| (0.00525) | (0.00935) | |||||
| Corruption | 0.244*** | 0.237*** | ||||
| (0.0298) | (0.0293) | |||||
| School closure | −0.169*** | −0.168*** | ||||
| (0.0125) | (0.0123) | |||||
| Workplace closures | −0.118*** | −0.105*** | ||||
| (0.00961) | (0.00983) | |||||
| Cancellation of events | −0.338*** | −0.345*** | ||||
| (0.0158) | (0.0152) | |||||
| Quarantine | 0.211*** | 0.234*** | ||||
| (0.0114) | (0.0110) | |||||
| Containment index | −0.00616*** | −0.00754*** | ||||
| (0.000882) | (0.000871) | |||||
| Hand washing | −0.000694*** | −0.000711*** | ||||
| (1.67e-05) | (1.72e-05) | |||||
| Restriction of gatherings | 0.198*** | 0.204*** | ||||
| (0.0106) | (0.0102) | |||||
| Public transport | 0.111*** | 0.145*** | ||||
| (0.0177) | (0.0173) | |||||
| Traffic restrictions | −0.0642*** | −0.0269** | ||||
| (0.0126) | (0.0123) | |||||
| Constant | 0.121*** | 0.634*** | 0.149*** | 0.683*** | ||
| (0.00606) | (0.0208) | (0.00726) | (0.0205) | |||
| Observations | 4,015 | 4,015 | 4,015 | 4,015 | ||
| Mediating effect through corruption | ||||||
| Coeff | Std. Error | P-value | Coeff | Std. Error | P-value | |
| (A) Mediation test | ||||||
| Delta | −0.035 | 0.005 | 0.000 | −0.025 | 0.003 | 0.000 |
| Sobel | −0.035 | 0.005 | 0.000 | −0.025 | 0.003 | 0.000 |
| Monte Carlos | −0.035 | 0.005 | 0.000 | −0.025 | 0.003 | 0.000 |
| (A) Composition of the effect | ||||||
| Indirect effect (Sobel) | 0.55 | 0.45 | ||||
| Direct effect | 0.20 | 0.11 | ||||
| Total effect | 0.70 | 0.56 | ||||
| % of total mediation effect | 14% | 11% | ||||
Source: Author
Income support has a positive and significant effect on corruption, indicating that increasing income support is associated with an increase in corruption. However, its direct effect on economic resilience is negative and significant, meaning that this policy slows the return to growth after a shock. Debt relief has a positive and significant effect on corruption, but has a negative effect on economic resilience, suggesting a similar impact to that of income support.
Corruption has a positive and significant effect on IR_gdp, indicating that, contrary to usual expectations, an increase in corruption appears to be associated with an improvement in the return to economic equilibrium. This result can be interpreted as an indication that, in certain contexts, corruption can facilitate recovery by circumventing certain administrative or regulatory rigidities.
School and workplace closures have a negative and significant effect on IR_gdp, meaning they slow down economic recovery. Event cancellations also have a significant negative effect, suggesting that this measure has had an adverse impact on growth, potentially due to its effect on tourism and events-related sectors.
In contrast, quarantine has a positive and significant effect on IR_gdp, suggesting that this measure may have limited the spread of the economic and health shock, thus facilitating recovery. Similarly, restrictions on gatherings and the limitation of public transport appear to promote economic resilience, possibly by maintaining a certain level of activity while reducing health risks.
Mediation tests (Delta, Sobel, and Monte Carlo) show that the effect of corruption on the relationship between economic policies and economic resilience is statistically significant. The indirect effect of corruption is estimated at 0.55 and 0.45 depending on the models, while the direct effect is 0.20 and 0.11, respectively. The total effect is therefore 0.70 and 0.56, with a mediation proportion of 14% and 11%, which means that a significant part of the impact of economic policies on economic resilience is mediated by corruption.
Robustness analysis and consideration of endogeneity issues
The robustness analysis confirms the general trends of the baseline estimation, making adjustments to better control for endogeneity issues (Table 7). The results show that income support and debt relief significantly increase countries'economic resilience to the health crisis. These coefficients remain positive and highly significant across all estimation methods (DCM, Driscoll & Kraay, and Lewbel), confirming the robustness of their impact.
Table 7.
Result on the relationship between COVID-19 control measures and the sensitivity index (IS_pib)
| DCM | DCM | Driscoll & Kraay | Driscoll & Kraay | Lewbel | Lewbel | |
|---|---|---|---|---|---|---|
| IS_pib | IS_pib | IS_pib | IS_pib | IS_pib | IS_pib | |
| VARIABLES | 1 | 2 | 3 | 4 | 5 | 6 |
| Income support | 0.0418*** | 0.0442*** | 0.0418*** | 0.0442*** | 0.0418*** | 0.0442*** |
| (0.0135) | (0.0119) | (0.0122) | (0.0135) | (0.0135) | (0.0135) | |
| Debt relief | 0.125*** | 0.115*** | 0.115*** | 0.115*** | 0.125*** | 0.115*** |
| (0.00910) | (0.00859) | (0.00895) | (0.00902) | (0.00910) | (0.00902) | |
| Corruption | −0.0820** | −0.0820** | −0.0820** | −0.0369 | −0.0820** | −0.0369 |
| (0.0343) | (0.0379) | (0.0407) | (0.0278) | (0.0343) | (0.0278) | |
| School closure | −0.112*** | −0.0940*** | −0.112*** | −0.0940*** | −0.112*** | −0.0940*** |
| (0.0116) | (0.0123) | (0.0129) | (0.0113) | (0.0116) | (0.0113) | |
| Workplace closures | −0.0470*** | −0.0291** | −0.0470*** | −0.0291** | −0.0470*** | −0.0291** |
| (0.0116) | (0.0139) | (0.0144) | (0.0113) | (0.0116) | (0.0113) | |
| Cancellation of events | −0.241*** | −0.227*** | −0.241*** | −0.227*** | −0.241*** | −0.227*** |
| (0.0133) | (0.0116) | (0.0117) | (0.0132) | (0.0133) | (0.0132) | |
| Quarantine | 0.00287** | 0.000924 | 0.00287** | 0.000924 | 0.00287** | 0.000924 |
| (0.00115) | (0.00112) | (0.00122) | (0.00111) | (0.00115) | (0.00111) | |
| Containment index | −0.00811*** | −0.00863*** | −0.00811*** | −0.00863*** | −0.00811*** | −0.00863*** |
| (0.000491) | (0.000509) | (0.000528) | (0.000486) | (0.000491) | (0.000486) | |
| Hand washing | 0.108*** | 0.110*** | 0.108*** | 0.110*** | 0.108*** | 0.110*** |
| (0.00810) | (0.00962) | (0.00947) | (0.00814) | (0.00810) | (0.00814) | |
| Restriction of gatherings | −0.110*** | −0.106*** | −0.110*** | −0.106*** | −0.110*** | −0.106*** |
| (0.0128) | (0.0169) | (0.0168) | (0.0128) | (0.0128) | (0.0128) | |
| Public transport | 0.0116 | 0.00878 | 0.0116 | 0.00878 | 0.0116 | 0.00878 |
| (0.00744) | (0.00888) | (0.00892) | (0.00738) | (0.00744) | (0.00738) | |
| Constant | 0.336*** | 0.374*** | 0.336*** | 0.374*** | 0.336*** | 0.374*** |
| (0.0270) | (0.0217) | (0.0251) | (0.0263) | (0.0270) | (0.0263) | |
| Observations | 2,906 | 2,906 | 2,906 | 2,906 | 2,906 | 2,906 |
| R-squared | 0.407 | 0.400 | 0.407 | 0.400 | 0.407 | 0.400 |
| F | 152.9 | 1030 | 4181 | 175.5 | 152.9 | 175.5 |
| sargan | 0 | 86.81 | 52.16 | 0 | ||
| jdf | 0 | 8 | 6 | 0 | ||
| sigma_e | 0.312 | 0.311 |
Source: Authors
Standard errors in parentheses
***p < 0.01
**p < 0.05
*p < 0.1
In contrast, the effect of corruption is more uncertain. In most estimations, corruption has a significant negative effect on the economic sensitivity index (IS_gdp), suggesting that high levels of corruption increase countries'economic vulnerability to the pandemic. However, with some estimation methods (Driscoll & Kraay and Lewbel), this effect weakens or even becomes insignificant in some specifications. This indicates that the impact of corruption could depend on other institutional and economic factors.
Regarding restrictive measures, school closures, workplace closures, event cancellations, and restrictions on gatherings all have a significant negative effect on the economy. This is consistent with the baseline estimate, where these policies were associated with greater economic sensitivity. The lockdown index, however, retains a negative effect, confirming that widespread restrictions have amplified economic hardship.
Some health measures, such as quarantine and handwashing, show a positive effect on economic resilience. The impact of handwashing is particularly robust, with a significant effect in all estimates. This highlights that well-implemented health measures can help reduce the negative economic impact of the pandemic.
The robustness results broadly confirm the conclusions of the baseline estimate. Economic support measures have a stabilizing effect, while health restrictions increase economic vulnerability. The effect of corruption remains a key factor, but its impact depends on the institutional context. The analysis thus reinforces the need to adopt appropriate economic and health policies to limit the negative effects of future crises.
The robustness analysis (Table 8) of the results regarding the relationship between COVID-19 control measures and the economic recovery index (IR_pib) shows significant results that deserve special attention.
Table 8.
Result on the relationship between COVID-19 control measures and the recovery index (IR_pib)
| DCM | DCM | Driscoll & Kraay | Driscoll & Kraay | Lewbel | Lewbel | DCM | Driscoll & Kraay | Lewbel | |
|---|---|---|---|---|---|---|---|---|---|
| IR_pib | IR_pib | IR_pib | IR_pib | IR_pib | IR_pib | IR_pib | IR_pib | IR_pib | |
| VARIABLES | 1 | 2 | 3 | 4 | 5 | 6 | 7 | 8 | 9 |
| Income support | −0.307*** | −0.307*** | −0.486*** | −0.0170* | −0.0170** | −0.00405** | |||
| (0.0796) | (0.0513) | (0.0900) | (0.0210) | (0.0180) | (0.0264) | ||||
| Debt relief | −0.392*** | −0.392*** | −0.573*** | −0.216*** | −0.216*** | −0.241*** | |||
| (0.0407) | (0.0336) | (0.0433) | (0.0111) | (0.0103) | (0.0122) | ||||
| Corruption | −0.433*** | −0.513*** | −0.0796** | −0.0796** | −0.131*** | ||||
| (0.0313) | (0.0310) | (0.0330) | (0.0318) | (0.0352) | |||||
| School closure | −0.163*** | −0.163*** | −0.176*** | ||||||
| (0.0117) | (0.0148) | (0.0136) | |||||||
| Workplace closures | −0.0830*** | −0.0830*** | −0.0745*** | ||||||
| (0.0101) | (0.0110) | (0.0113) | |||||||
| Cancellation of events | 0.225*** | 0.225*** | 0.225*** | ||||||
| (0.0115) | (0.0126) | (0.0122) | |||||||
| Quarantine | −0.0235*** | −0.0235*** | −0.0227*** | ||||||
| (0.000922) | (0.000931) | (0.00104) | |||||||
| Containment index | −0.000697*** | −0.000697*** | −0.000737*** | ||||||
| (1.84e-05) | (1.96e-05) | (1.96e-05) | |||||||
| Hand washing | 0.214*** | 0.214*** | 0.206*** | ||||||
| (0.00867) | (0.00734) | (0.00934) | |||||||
| Restriction of gatherings | 0.160*** | 0.160*** | 0.219*** | ||||||
| (0.0159) | (0.0201) | (0.0188) | |||||||
| Public transport | 0.154*** | 0.154*** | 0.164*** | ||||||
| (0.00901) | (0.00972) | (0.0102) | |||||||
| Constant | 0.585*** | 0.663*** | 0.585*** | 0.663*** | 0.734*** | 0.864*** | 0.743*** | 0.743*** | 0.725*** |
| (0.0284) | (0.0302) | (0.0142) | (0.0241) | (0.0319) | (0.0340) | (0.0232) | (0.0195) | (0.0250) | |
| Observations | 4,015 | 4,015 | 4,015 | 4,015 | 3.65 | 3.65 | 4,015 | 4,015 | 3.65 |
| R-squared | 0.074 | 0.098 | 0.074 | 0.098 | 0.113 | 0.153 | 0.461 | 0.461 | 0.472 |
| sargan | 0 | 0 | 658.9 | 702.7 | 0 | 362.0 | |||
| F | 106.5 | 144.6 | 1576 | 1835 | 116.5 | 164.6 | 311.0 | 525.0 | 296.1 |
| sigma_e | 0.536 | 0.524 | 0.414 | ||||||
| Number of groups | 11 | 11 | 11 | ||||||
| lag | 1 | 1 | 1 |
Source: Authors
Standard errors in parentheses
***p < 0.01, **p < 0.05, *p < 0.1
First, both income support and debt relief variables are negatively and significantly associated with the economic recovery index. These results indicate that these measures, although intended to support the economy during the crisis, are associated with a reduction in economic recovery capacity. This could suggest that financial aid or debt relief, by providing temporary support, can create dependency that slows long-term economic recovery, reducing pressure on necessary economic reforms or increasing the country's vulnerability to future shocks.
Corruption also has a negative effect on the economic recovery index. This result is consistent across all the estimations used (DCM, Driscoll & Kraay, and Lewbel), indicating that in countries with higher corruption, post-COVID economic recovery is slower. This finding could be explained by less efficient management of public resources and inefficient allocation of economic aid, which prevents a rapid recovery from the crisis.
Regarding specific restrictive measures, interesting effects are observed. Both school and workplace closures are negatively associated with the recovery index, showing that these measures, while effective in controlling the spread of the virus, have prolonged economic effects by slowing the recovery in certain sectors. This may be explained by the disruption of production chains and the reduction of work capacity in key sectors. The cancellation of events appears to have a positive effect on the recovery index, suggesting that these measures, although they have immediate costs, may allow for a faster economic recovery once the crisis has passed.
Quarantine and lockdown measures, as well as other public health policies such as handwashing and restrictions on gatherings, also show significant effects. Lockdown and quarantine have a negative impact on economic recovery, but this impact is less pronounced. These results confirm that although these measures are crucial for containing the spread of the virus, they generate significant short-term economic costs. Conversely, measures such as handwashing, restrictions on gatherings, and the use of public transit have a positive effect on economic recovery, suggesting that prevention measures that do not disrupt economic activities as much may be more compatible with a rapid recovery.
Robustness tests, including Sargan tests, indicate that the instruments used in the Lewbel estimations are valid, which strengthens confidence in the robustness of the results. The coefficient of determination (R-squared) is low in some cases, but this low value may reflect the limitations of the model's explanation regarding the economic recovery index, which may be influenced by many other factors not observed in this model.
In conclusion, this robustness analysis shows that financial support measures, such as income support and debt relief, are associated with a reduction in economic recovery capacity, suggesting that poorly targeted or excessive policies can hamper economic recovery. Conversely, containment and restriction measures have negative short-term economic effects, but measures such as restrictions on gatherings or handwashing can promote faster economic recovery. These findings highlight the need for a carefully measured balance between health and economic management to ensure a rapid and sustainable recovery.
Discussion of results
Economic interpretation of the results
The study you present, entitled"Economic resilience in Central Africa in the face of COVID-19: corruption, a hindrance or a key factor?", takes place in a context where the economic impact of the COVID-19 pandemic has been felt unevenly globally, with disproportionate effects in low- and middle-income regions, such as Central Africa. The analysis of the regression results, coupled with the existing literature on economic resilience and the effects of corruption, provides a rich perspective for understanding the economic dynamics of this
Impact of COVID-19 control measures on the resilience of economic growth in Central Africa
The results show that measures taken to combat COVID-19, such as income support, school and workplace closures, as well as quarantines and gathering restrictions, had an overall negative effect on economic recovery in Central Africa, as confirmed by the work of Guerrieri et al. [22] and Fornaro and Wolf [37]. Recent studies, such as those by Ashraf et al. [68], confirm these findings, suggesting that restrictive measures disproportionately affect economies with lower resilience capacities, particularly in developing regions.
Support measures, although essential to limit the immediate impact on the population, show an association with a slowdown in economic growth. Indeed, the results indicate that income support policies have a negative effect on the economic recovery index (IR_gdp), corroborating the notion of Keynesian supply shocks highlighted by Guerrieri et al. [22], where the ineffectiveness or lack of sustainability of support policies creates fragility in the recovery. This phenomenon is also observed in developing economies where public responses to the crisis have often lacked the robustness necessary to support a return to stable growth. Recent research by Zhang et al. [69] further highlights the vulnerability of countries with weak economic institutions to such shocks.
School and workplace closures, as well as restrictions on gatherings, have exacerbated the negative effects on the local economy. This confirms the results of Ashraf et al. [68], which show that these measures lead to disruptions in global value chains and disruptions in trade flows, amplifying the effects of supply shocks. Moreover, a study by Dube and Horvey [70] suggests that in regions with limited digital infrastructure, such as Central Africa, these disruptions were even more pronounced.
However, preventive measures such as handwashing, restrictions on gatherings, and public transport, which are considered less intrusive, have shown positive effects on the resilience of economic growth. This is in line with the findings of Rose and Liao [28], who distinguish between static resilience (efforts to keep the economy functioning) and dynamic resilience (measures to adapt and rebound quickly). Recent work by Fernandes and Chamusca [71] also stresses that less disruptive measures can help mitigate long-term economic decline, especially in low-resource settings.
The effect of quarantine and lockdown indices is also significant, suggesting that more rigid policies have a lasting negative effect on economic recovery. This trend is supported by the literature that highlights the importance of finding a balance between health and economic measures to avoid paralyzing economic activity (cf. Fornaro and Wolf [37]). A recent paper by Larson et al. [72] echoes this concern, arguing that prolonged lockdowns in economies with fragile institutional structures can lead to deeper economic recessions.
The impact of corruption on the resilience of economic growth
The study also highlights the impact of corruption on the resilience of economic growth. The results show that corruption is a significantly negative factor on the ability of Central African countries to recover from the COVID-19 crisis. This finding is in line with the work of Ormerod [19] and Mauro [52], who demonstrate that corruption hinders economic resilience by limiting the effectiveness of public interventions and diverting essential resources for economic recovery. This relationship is confirmed by recent findings by Diop et al. [36], which underscore that corruption exacerbates economic fragility in developing economies.
Highly corrupt countries in the region, according to the results, had a slower economic recovery. This phenomenon could be linked to misallocation of resources and a lack of trust in institutions, essential elements for a rapid recovery after an external shock. This observation is consistent with the agency theories of Jensen & Meckling [49] and North [16], Mauro [52], Tanzi and Davoodi [73], which suggest that fragile, corrupt, or ineffective institutions are less able to recover from a significant economic shock. The recent work by Sengupta and Das [74] further supports the argument that corruption has a compounding negative effect during crises by weakening institutional capacity for crisis management and response.
Nevertheless, it is important to note that corruption can sometimes have a temporarily stimulatory effect in certain economic environments where it bypasses bureaucratic red tape, as suggested by Leff's [17] theory. However, the results of our study further support the idea that the negative effects of corruption far outweigh these temporary benefits, especially in the context of the COVID-19 crisis, where the needs for transparent governance and rapid response were crucial. A study by McCartney et al. [75] provides recent evidence from South America, showing that corruption, even in the short term, hampers the rapid mobilisation of resources needed for a timely crisis response.
Originality of the study and contribution to the literature
One of the main contributions of our study is its exploration of economic resilience in the specific context of Central Africa, which is often overlooked in research on the COVID-19 crisis. By focusing on corruption as a key determinant of economic resilience, this research differs from conventional studies by offering a more focused analysis of the local determinants that influence the ability of economies to recover from a global health crisis.
Existing literature, such as the work of Briguglio et al. [12] and Fornaro and Wolf [37], has focused on developed countries or more stable macroeconomic contexts. Our study adapts these theoretical frameworks by taking into account the economic and institutional realities of Central Africa, where corruption, governance, and health crisis management have profound repercussions on economic resilience. Recent contributions by Clark [76] also emphasise the need for context-specific analyses, particularly in regions with high levels of informality and weak governance structures, like Central Africa.
In conclusion, the study highlights that COVID-19 response measures have had negative effects on economic growth, particularly when responses were poorly coordinated or marked by institutional weaknesses. Corruption appears to act as an additional obstacle to economic recovery, highlighting the importance of strengthening governance and adopting appropriate economic responses to ensure greater resilience to external shocks.
Limitations of the study
Limitations related to data availability
One of the main limitations of the study lies in the availability and quality of economic data in Central Africa. Indeed, countries in this region often face gaps in reliable and timely economic statistics, which can make it difficult to accurately assess the effects of COVID-19 response measures on economic growth. Data on the actual impact of support policies and the measurement of corruption may be partial, which could limit the robustness of the conclusions drawn in the study.
Limited contextual approach
Although the study focuses on Central Africa, the diversity of economic and political contexts within this region is not sufficiently explored. The impact of COVID-19 and corruption can vary considerably from one country to another due to differences in economic structures, political stability, and institutional effectiveness. A more in-depth approach by country or subregion would have allowed for a more detailed analysis of disparities within Central Africa.
Measuring the effects of corruption
Assessing corruption and its impact on economic resilience presents methodological challenges. Corruption measures are often based on indices that can be subjective and may not fully reflect local or country-specific dynamics. Furthermore, the impact of corruption on economic resilience can vary depending on its type and intensity, making it difficult to attribute direct and general results.
Simplified economic modeling
The study was able to use relatively simplified economic models to analyze economic resilience, due to the complexities of economic interactions and the numerous variables (external shocks, government responses, etc.). More detailed modeling, including more variables or the use of more advanced econometric models, would have better captured the underlying dynamics of the crisis.
Temporality and long-term effect
The study focuses primarily on the immediate and short-term impact of COVID-19, without necessarily exploring the long-term effects of the crisis. Economic resilience could be affected for several years, particularly with regard to investment, consumer confidence, and the restructuring of value chains. The long-term impact could differ from that observed in the short term and would merit further analysis as the effects of the pandemic persist.
The impact of external factors
While the study highlights the impact of COVID-19 measures and corruption on economic resilience, it may not adequately consider external factors that also influenced economic growth in Central Africa during this period. For example, declining oil prices, fluctuations in foreign investment, or global economic trends also played a crucial role in the evolution of economic resilience in the region, but may not have been sufficiently integrated into the analysis.
Reduction in the diversity of health measures
The study likely analyzed the overall impact of health measures (such as lockdowns and quarantines), but the diversity and variation in the intensity of health policies across countries and regions were not sufficiently detailed. A country's health strategy can influence how economic resilience is affected, and a deeper dive into the different types of lockdown or health relaxation policies would have allowed for a more nuanced analysis.
Conclusion
The results of this study reveal notable variations in the economic resilience of Central African countries to the COVID-19 crisis. Analyzing the sensitivity (SI) and recovery (RI) indices, it appears that economic policies, including income support and debt relief, had a significant impact on the countries'ability to recover from the recession. However, corruption was found to be a significant moderating factor, affecting the speed of recovery (see Table 2). Countries with better corruption control showed higher recovery indices. These results highlight the need to implement rigorous economic policies while combating corruption for a rapid and sustainable economic recovery.
The conclusion is based on econometric estimations carried out by ordinary least squares and triple least squares in basic analysis, two-stage least squares (2SLS), Driscoll and Kraay, and Lewbel, in order to correct endogeneity problems and ensure the robustness of the results obtained. These techniques made it possible to analyze the relationships between economic measures, corruption and economic resilience in a solid empirical framework.
Recommendations
Targeted economic policies
The recommendations must be adapted to the specific economic contexts of Central African countries. For example, countries with a more informal economy or one dependent on commodity exports must prioritize support measures for the most vulnerable sectors, particularly agriculture and small businesses.
Institutional reforms
Effective crisis management requires strengthening public institutions to better combat corruption. Reforms must include greater transparency in public finances and rigorous monitoring mechanisms for funds allocated to support measures.
Feasibility and institutional constraints
It is important to take into account local institutional constraints and infrastructure. Recommendations should include practical strategies to strengthen administrative capacity, for example, through continuous training of civil servants and the establishment of digital governance systems to facilitate the monitoring of aid programs.
Learning for other regions
Central African countries can offer valuable lessons to emerging regions facing economic crises. Integrating corruption and governance indicators into resilience strategies could be applied in other contexts, particularly in Southeast Asia or Latin America, where health and economic crises are also prevalent.
Acknowledgements
Our thanks go to the members of the BMC Health Services Research Dear Editor, and to those who reviewed it. To Professors Roland Pongou, Gankou Jean-Marie, Essombe Innocent, Kouayep Bertin Leopold for his advice and review of this article. To Drs Ngounou Boris Augustin, Ondoua Beyene Blaise and Ngnouwal Eloundou Georges.
Abbreviations
- AFBD
African Development Bank
- GDP
Growth Domestic Product
- IMF
International Monetary Fund
- N-SIRD
Population- Susceptible-Infected-Recovered-Deceased
- OLS
Ordinary Least Squares
- SEM
Structure Equation Model
- UN
United Nations
- UNDP
United Development Program
Appendix
Table 9.
Presentation of variables
| Variables | Definitions | Sources |
|---|---|---|
| Hand washing | Indicator captured from data provided on individuals who complied with government guidelines in both public and private places. Thus, it is measured as 1 if the individual complied with the guidelines and 0 if not. As in previous studies, this variable is converted into a percentage. | OXCGRT (2021) |
| The stringency index | This indicator measures the level of rigor with which a government applies the measures it has enacted. It is measured on a scale of 0 to 1. A 1 indicates that the government strictly applies the measure and a 0 indicates that it does not. It is captured as a percentage to determine the difference in its application within a government. | OXCGRT (2021) |
| School closures | It measures compliance with the decision to close schools and universities. Thus, this variable is equal to 1 if it imposes social distancing, capacity limitations, or other important public health precautions that result in significant differences from usual, non-COVID-19, and 0 otherwise. | OXCGRT (2021) |
| The closure of workplaces | Variable that indicates the application of the government decision. | OXCGRT (2021) |
| Cancellation of public events | These are restrictions on gatherings, controls on public transport, restrictions on internal movement and controls on international travel. Indicator ranging from 0 to 100 | OXCGRT (2021) |
| The confinement | The confinement variable is taken according to whether the policy is implemented by a government. It is taken partially or totally. | OXCGRT (2021) |
| The relief Corruption |
The debt relief variable accounts for the debt of private individuals whose investments were halted during the Covid-19 outbreak. Corruption is the perversion or misuse of a process or interaction with one or more persons with the intention, for the corruptor, of obtaining particular advantages or prerogatives or, for the corrupted, of obtaining retribution in exchange for their compliance. |
OXCGRT (2021) Afrobarometer (2022) |
| Economic Growth Sensitivity and Recovery Index | The job sensitivity index and the job recovery index are calculated indices. | Authors |
Source: Authors
Table 10.
Correlation matrix for the sensitivity or resistance index
| Variables | (1) | (2) | (3) | (4) | (5) | (6) | (7) | (8) | (9) | (10) | (11) | (12) |
|---|---|---|---|---|---|---|---|---|---|---|---|---|
| (1) IS_pib | 1,000 | |||||||||||
| (2) Income support | 0.091 | 1,000 | ||||||||||
| (3) Debt relief | 0.066 | 0.086 | 1,000 | |||||||||
| (4) corruption | 0.319 | -0.179 | -0.121 | 1,000 | ||||||||
| (5) Eco_closure | -0.216 | 0.317 | 0.354 | -0.042 | 1,000 | |||||||
| (6) Closure_trav | -0.380 | 0.074 | 0.377 | -0.381 | 0.557 | 1,000 | ||||||
| (7) Com_séjdomi | -0.404 | 0.105 | 0.477 | -0.450 | 0.432 | 0.648 | 1,000 | |||||
| (8) index_confi | -0.221 | 0.153 | 0.572 | -0.064 | 0.774 | 0.699 | 0.715 | 1,000 | ||||
| (9) hand_wash | -0.417 | 0.384 | -0.228 | -0.309 | 0.195 | 0.334 | 0.184 | 0.089 | 1,000 | |||
| (10) Restrict_rassem | -0.090 | 0.174 | 0.231 | 0.139 | 0.665 | 0.457 | 0.441 | 0.734 | 0.277 | 1,000 | ||
| (11) Trans_com | -0.149 | -0.130 | 0.370 | 0.100 | 0.372 | 0.399 | 0.335 | 0.571 | -0.157 | 0.312 | 1,000 | |
| (12) Con_voyinter | -0.125 | 0.236 | 0.274 | -0.034 | 0.612 | 0.282 | 0.231 | 0.491 | 0.141 | 0.348 | 0.324 | 1,000 |
Source: Authors
Table 11.
Correlation matrix for the recovery or return to equilibrium index
| Variables | (1) | (2) | (3) | (4) | (5) | (6) | (7) | (8) | (9) | (10) | (11) | (12) |
|---|---|---|---|---|---|---|---|---|---|---|---|---|
| (1) IR_pib | 1,000 | |||||||||||
| (2) Support_rev | -0.154 | 1,000 | ||||||||||
| (3) all_debt | -0.241 | 0.485 | 1,000 | |||||||||
| (4) corruption | -0.120 | -0.183 | -0.253 | 1,000 | ||||||||
| (5) Eco_closure | -0.264 | 0.120 | 0.200 | -0.017 | 1,000 | |||||||
| (6) Closure_trav | -0.274 | 0.260 | 0.276 | -0.236 | 0.433 | 1,000 | ||||||
| (7) Com_séjdomi | 0.004 | -0.082 | 0.178 | -0.407 | 0.353 | 0.323 | 1,000 | |||||
| (8) index_confi | -0.225 | 0.146 | 0.256 | -0.214 | 0.509 | 0.517 | 0.656 | 1,000 | ||||
| (9) hand_wash | -0.386 | -0.140 | -0.183 | 0.555 | -0.083 | -0.078 | -0.129 | -0.018 | 1,000 | |||
| (10) Restrict_rassem | -0.152 | 0.150 | 0.169 | 0.178 | 0.343 | 0.372 | 0.317 | 0.728 | 0.273 | 1,000 | ||
| (11) Trans_com | -0.130 | 0.062 | 0.200 | -0.187 | 0.373 | 0.290 | 0.382 | 0.523 | 0.036 | 0.327 | 1,000 | |
| (12) Con_voyinter | 0.118 | 0.098 | 0.113 | -0.127 | 0.066 | 0.021 | 0.030 | 0.226 | -0.168 | 0.018 | -0.020 | 1,000 |
Source: Authors
Fig. 2.

Correlation between the sensitivity or resistance index and the factors influencing resilience. Source: Authors
Fig. 3.

Correlation between the recovery index and factors influencing resilience. Source: Authors
Authors’ contributions
The first author AMN and MHD worked on the analysis of the results and interpretation as well as summary and the general form of the document. i.e. Section 3 and 4. AMN, BEON and CEA dealt with the introduction, the literature review and the methodology. i.e. Section 1 and 2.
Funding
Not applicable.
Data availability
https://github.com/OxCGRT/covid-policy-tracker”
The datasets used and/or analyzed during the current study available from the corresponding author on reasonable request.
Declarations
Ethics approval and consent to participate
Not applicable.
Consent for publication
Not applicable.
Competing interests
The authors declare no competing interests.
Footnotes
The recovery point here is observed at the same time as the second peak P 2 m therefore we will consider the year of the last peak.
Gross domestic product.
Publisher’s Note
Springer Nature remains neutral with regard to jurisdictional claims in published maps and institutional affiliations.
References
- 1.Apergis E, Apergis N. The impact of covid-19 on economic growth: evidence from a Bayesian panel vector autoregressive (BPVAR) model. Appl Econ. 2021;53(58):6739–51. [Google Scholar]
- 2.Acemoglu D, Chernozhukov V, Werning I, Whinston MD et al. A multi-risk SIR model with optimally targeted lockdown, vol. 2020. Cambridge: National Bureau of Economic Research; 2020.
- 3.McKibbin W, Fernando R. The globalmacroeconomic impacts of COVID-19: Seven scenarios. Asian Econ Papers. 2021;20(2):1–30.
- 4.World Bank & International Monetary Fund. Joint statement regarding a call to action on the debt of IDA countries. 2020. https://www.imf.org/en/News/Articles/2020/03/25/pr20103-joint-statement-world-bank-group-and-imf-call-to-action-on-debt-of-ida-countries.
- 5.Ziemba EW, Eisenbardt M. The effect of the Covid-19 pandemic on ICT usage by academics. J Comput Inf Syst. 2022;62(6):1154–68. [Google Scholar]
- 6.Papaioannou SK. ICT and economic resilience: evidence from the COVID-19 pandemic. Econ Model. 2023;128: 106500. [Google Scholar]
- 7.Pokhrel S, Chhetri R. A literature review on impact of COVID-19 pandemic on teaching and learning. Higher education for the future. 2021;8(1):133–41. [Google Scholar]
- 8.Byrnes KG, Kiely PA, Dunne CP, McDermott KW, Coffey JC. Communication, collaboration and contagion: “Virtualization” of anatomy during COVID-19. Clin Anat. 2021;34(1):82–9. [DOI] [PMC free article] [PubMed]
- 9.Sardar T, Jianqiu Z, Bilal M, Syed N. Impact of ICT on entrepreneurial self-efficacy in emerging economy: sustaining lock-down during COVID-19 pandemic. Hum Syst Manag. 2021;40(2):299–314. [Google Scholar]
- 10.Canadian Institute of Actuaries & World Health Organization. The risks of pandemic: A challenge for the actuarial profession. Canadian Institute of Actuaries; 2009.
- 11.Briguglio L, Cordina G, Farrugia N, Vella S. Economic vulnerability and resilience: concepts and measurements. Oxf Dev Stud. 2009;37(3):229–47. [Google Scholar]
- 12.Briguglio L, Cordina G, Farrugia N, Vella S. et al. Conceptualizing and measuring economic resilience. Building the economic resilience of small states, Malta: Islands and Small States Institute of the University of Malta and London: Commonwealth Secretariat, 2006. pages 265–288.
- 13.Martin R. Regional economic resilience, hysteresis and recessionary shocks. J Econ Geogr. 2012;12(1):1–32. [Google Scholar]
- 14.Talandier M, Calixte Y. Economic resilience and territorial disparity: what lessons can be learned from the 2008 crisis? Revue d’Économie Régionale Urbaine. 2021;3:361–96.
- 15.Van de Ven WP, Van Der Gaag J. Health as an unobservable: a mimic-model of demand for health care. J Health Econ. 1982;1(2):157–83. [DOI] [PubMed] [Google Scholar]
- 16.North DC. Institutions, institutional change and economic performance. Cambridge University Press; 1990. [Google Scholar]
- 17.Leff NH. Economic development through bureaucratic corruption. Am Behav Sci. 1964. 10.1177/000276426400800303. [Google Scholar]
- 18.Hiroi T, Schober GS. Corruption, patronage, and avertable child deaths in developing countries. Polit Policy. 2023;51(6):1174–94. [Google Scholar]
- 19.Ormerod P. Corruption and economic resilience: recovery from the financial crisis in western economies. Econ Aff. 2016;36(3):348–55. [Google Scholar]
- 20.Somych M, Opaliuk T, Potapiuk I, Ovcharuk E, Oliinyk A. Economic security of Ukraine: Management aspect through the prism of socio-economic development in the context of international ratings. Polit Policy. 2022;50(4):810–33. [Google Scholar]
- 21.Anyanwu JC, Salami AO. The impact of COVID-19 on African economies: an introduction. Afr Dev Rev. 2021;33(Suppl 1):S1. [DOI] [PMC free article] [PubMed] [Google Scholar]
- 22.Guerrieri V, Lorenzoni G, Straub L, Werning I. Macroeconomic implications of covid-19: can negative supply shocks cause demand shortages? Am Econ Rev. 2022;112(5):1437–74. [Google Scholar]
- 23.Barro RJ, Ursúúa JF, Weng J. The coronavirus and the great influenza pandemic: Lessons from the “Spanish flu” for the coronavirus’s potential effects on mortality and economic activity (No. w26866). National Bureau of Economic Research; 2020.
- 24.Pongou R, Ahinkorah BO, Mabeu MC, Agarwal A, Maltais S, Yaya S. Examining the association between reported covid-19 symptoms and testing for covid-19 in Canada: a cross-sectional survey. BMJ Open. 2022;12(3): e056229. [DOI] [PMC free article] [PubMed] [Google Scholar]
- 25.Siefu DD. Infrastructures de transport routier: Facteur de croissance economique et des echanges en zone CEMAC-cas du Cameroun, du Congo et de la RCA, de 1995 a 2017. Revue Française d'Economie et de Gestion. 2022;3(6).
- 26.Holling CS. Resilience and stability of ecological systems. Annu Rev Ecol Syst. 1973;4(1):1–23. [Google Scholar]
- 27.Elton CS. The ecology of invasions by animals and plants. Springer Nature; 2020.
- 28.Rose A, Liao S-Y. Modeling regional economic resilience to disasters: a computable general equilibrium analysis of water service disruptions. J Reg Sci. 2005;45(1):75–112. [Google Scholar]
- 29.Simmie J, Martin R. The economic resilience of regions: towards an evolutionary approach. Camb J Reg Econ Soc. 2010;3(1):27–43. [Google Scholar]
- 30.Smith A. An inquiry into the nature and causes of the wealth of nations: Volume One. London: printed for W. Strahan; and T. Cadell. 1776.
- 31.Solow RM. A contribution to the theory of economic growth. Q J Econ. 1956;70(1):65–94. [Google Scholar]
- 32.Walras L. Économique et mécanique. Bull Soc Vaudoise Sci Nat. 1909;45:313–25.
- 33.Keynes JM. The generaltheory of employment. Q J Econ. 1937;51(2):209–23.
- 34.Stiglitz J, Ocampo JA, Spiegel S, Ffrench-Davis R, Nayyar D. Stability with growth: macroeconomics, liberalization and development. OUP Oxford; 2006.
- 35.Bristow G, Healy A, editors. Economic crisis and the resilience of regions: A European study. Edward Elgar Publishing; 2018.
- 36.Diop S, Asongu SA, Nnanna J. COVID-19 economic vulnerability and resilience indexes: global evidence. Int Soc Sci J. 2021;71(S1):37–50. [DOI] [PMC free article] [PubMed] [Google Scholar]
- 37.Fornaro L, Wolf M. Covid-19 coronavirus and macroeconomic policy. 2020.
- 38.Faria-e-Castro M. Fiscal policy during a pandemic. J Econ Dynam Control. 2021;125:104088. [DOI] [PMC free article] [PubMed]
- 39.Cepoi CO, Dumitrescu, BA, Leonida I. (2022). Investigating the Impact of COVID-19 Policy Decisions on Economic Growth: Evidence from EU Countries. In International Conference on Economic Scientific Research-Theoretical, Empirical and Practical Approaches (pp. 241–248). Cham: Springer Nature Switzerland.
- 40.Xu L, Shen Y, Chen J, Xiao G, Liu L. Assessing the impact of the Covid-19 epidemic on the resilience of Chinese coastal ports. J Sea Res. 2024;202: 102554. [Google Scholar]
- 41.Jangam BP, Venkatesh H, Tiwari AK. Global value chains and economic growth: a study of resilience during the covid-19 pandemic. J Int Dev. 2024. 10.1002/jid.3895. [Google Scholar]
- 42.Sheng H, He C, Dai X, Zhang Y. Who died, who survived? COVID-19 epidemic, industrial dynamics and urban economic resilience. Sustain Cities Soc. 2024;107: 105469.
- 43.Chippaux J-P. Impact of COVID-19 on public health in sub-Saharan Africa. Bull Natl Acad Med. 2023;207(2):150–64. [DOI] [PMC free article] [PubMed] [Google Scholar]
- 44.Dauvin M, Ducoudré B, Heyer É, Madec P, Plane M, Sampognaro R, Timbeau X. Evaluation as of 26 June 2020 of the economic impact of the Covid-19 pandemic and of the lockdown and end-of-lockdown measures in France. Revue de l'OFCE. 2020;166(2):111–60.
- 45.Eboko F, Schlimmer S. Covid-19: Africa facing a global crisis. Politique étrangère. 2020;4:123–34. [Google Scholar]
- 46.Kaftan V, Kandalov W, Molodtsov I, Sherstobitova A, Strielkowski W. Socio-economic stability and sustainable development in the post-COVID era: lessons for the business and economic leaders. Sustainability. 2023;15(4): 2876. [Google Scholar]
- 47.Kim J, Estrada G, Jinjarak Y, Park D, Tian S. Ict and economic resilience during COVID-19: cross-country analysis. Sustainability. 2022;14(22): 15109.
- 48.Li H, Hameed J, Khuhro RA, Albasher G, Alqahtani W, Sadiq MW, Wu T. The impact of the economic corridor on economic stability: a double mediating role of environmental sustainability and sustainable development under the exceptional circumstances of COVID-19. Front Psychol. 2021;11: 634375. [DOI] [PMC free article] [PubMed]
- 49.Jensen MC, Meckling WH. Theory of the firm: Managerial behavior, agency costs and ownership structure. In: Corporate governance. Gower; 2019. p. 77–132.
- 50.Buchanan JM, Tullock G. The calculus of consent: Logical foundations of constitutional democracy, vol. 100. University of Michigan press; 1965.
- 51.Acemoglu D, Verdier T. Property rights, corruption and the allocation of talent: A general equilibrium approach. Econ J. 1998;108(450):1381–403.
- 52.Mauro P. Corruption and growth. Q J Econ. 1995;110(3):681–712. [Google Scholar]
- 53.Méon PG, Sekkat K. Does corruption grease or sand the wheels of growth? Public Choice. 2005;122:69–97. [Google Scholar]
- 54.Ugur M, Dasgupta N. Corruption and Economic Growth: A Meta-Analysis of the Evidence on Low-Income Countries and Beyond. EPPI-Centre: Social Science Research Unit, Institute of Education, University of London; 2011. [Google Scholar]
- 55.Chêne M, Hodess R. The impact of corruption on growth and inequality. Transparency Int. 2014;15:2014.
- 56.Tsiotas D, Katsaiti MS. A 3D index for measuring economic resilience with application to modern financial crises. J Int Dev. 2024. 10.1002/jid.3957. [Google Scholar]
- 57.Mlambo VH, Masuku MM. Governance, corruption and COVID-19: the final nail in the coffin for South Africa’s dwindling public finances. J Public Adm. 2020;55(3–1):549–65.
- 58.Arabiat O, Abu-Asabeh S, Alshurafat H. Between freedom and corruption: the interplay of total reserves during the COVID-19 epoch–a cross-country inquiry. Int J Emerg Markets. 2024.
- 59.Duval R, Vogel L. Economic resilience to shocks: the role of structural policies. OECD J Econ Stud. 2008;2008(1):1–38. [Google Scholar]
- 60.Ang JB. Are modern financial systems shaped by state antiquity? J Banking Finance. 2013;37(11):4038–58.
- 61.Ndoya H, Okere D, Belomo ML, Atangana M. Do ICTs reduce the spread of the informal economy in Africa? Telecommunications Policy. 2023;47(2):102485.
- 62.Theil H. Economic forecasts and policy. (No Title). 1961.
- 63.Basmann R. A generalized classical method of linear estimation of coefficients in a structural equation. Econometrica. 1957. 10.2307/1907743. [Google Scholar]
- 64.Wooldridge JM. Econometric Analysis of Cross Section and Panel Data. MIT Press; 2010. [Google Scholar]
- 65.Jöreskog KG. A general method for analysis of covariance structures. Biometrika. 1970;57(2):239–51.
- 66.Driscoll JC, Kraay A. Spatial correlations in panel data (No. 1553). World Bank Publications; 1995.
- 67.Lewbel A. Using heteroscedasticity to identify and estimate mismeasured and endogenous regressor models. J Bus Econ Stat. 2012. 10.1080/07350015.2012.643126. [Google Scholar]
- 68.Ashraf BN, Goodell JW, Butt S. SDGs and economic resilience: evidence from the COVID-19 shock. J Sustain Finance Account. 2024;4: 100015. [Google Scholar]
- 69.Zhang Y, Zhang J, Wang K, Wu X. Anempirical perception of economic resilience in response to the COVID-19 outbreak in the Beijing–Tianjin–Hebei urban agglomeration, China. Int J Environ Res Public Health. 2021;18(19):10532. [DOI] [PMC free article] [PubMed]
- 70.Dube A, Horvey SS. Institutional quality and renewable energy capital flows in Africa. Future Bus J. 2023;9(1):55.
- 71.Fernandes JR, Chamusca P. Urban policies, planning and retail resilience. Cities. 2014;36:170–77.
- 72.Larson JL, Zhou W, Veliz PT, Smith S. Symptom clusters in adults with post-COVID-19: A cross-sectional survey. Clin Nurs Res. 2023;32(8):1071–80. [DOI] [PubMed]
- 73.Tanzi V, Davoodi H. Corruption, public investment, and growth. IMF Work Pap. 1997. 10.5089/9781451929515.001. [Google Scholar]
- 74.Sengupta K, Das PK. Detection of financial fraud: Comparisons of some tree-based machine learning approaches. J Data Inform Manage. 2023;5(1):23–37.
- 75.McCartney G, Pinto J, Liu M. Cityresilience and recovery from COVID-19: The case of Macao. Cities. 2021;112:103130. [DOI] [PMC free article] [PubMed]
- 76.Clark B. Workplacedemocracy in action? Assessing employee board representation in Australian governmentagencies. Aust J Public Adm. 2024;83(3):475–95.
Associated Data
This section collects any data citations, data availability statements, or supplementary materials included in this article.
Data Availability Statement
https://github.com/OxCGRT/covid-policy-tracker”
The datasets used and/or analyzed during the current study available from the corresponding author on reasonable request.