

Abstract
Cyanobacteria are constructors of biological soil crusts (BSCs); their motility is thought to be crucial for surviving burial and BSC expansion. In this study, X-ray computed microtomography in combination with machine-learning-based image processing was employed to investigate cyanobacteria-dominated BSCs. The structural changes in these BSCs, as well as the behaviors of the dominant cyanobacterium Microcoleus vaginatus therein, in response to changes in water availability and particle burial were visualized and quantitatively analyzed. Hygroscopic swelling of cyanobacteria biomaterials increased pore-network complexity and reduced the porosity and hydraulic radius. Trichomes of M. vaginatus inside BSCs were connected to the surface by tunnel-like structures made of extracellular polymeric substances (EPSs), through which the trichomes migrated to and from the surface in bundles. Despite the generally negative effects of EPSs on hydraulic conductivity, EPS tunnels have the potential to enhance water transfer to the trichomes. Extensive hydration and particle burial led to the spreading migration of individual trichomes, forming net-like structures inside the newly deposited layer. The results highlight the significance of the structural organization of EPSs within BSCs and the importance of cyanobacterial migration in BSC expansion.
Keywords: biological soil crusts, terrestrial cyanobacteria, X-ray microtomography, extracellular polymeric substances, cyanobacteria migration
Graphical abstract
Public summary
-
•
In situ structural changes and cyanobacteria migration inside biological soil crusts (BSCs) were visualized.
-
•
Hydration-induced swelling of cyanobacterial biomaterials altered pore geometry of BSCs significantly.
-
•
Trichome bundles of cyanobacteria migrated via tunnels made of extracellular polymeric substances within BSCs.
-
•
Spreading migration of individual cyanobacterial trichomes, but not trichome bundles, expanded BSC structure.
Introduction
Biological soil crusts (BSCs) are composites of soil particles and micro- and macroorganisms that occupy the surface and the top few centimeters of soil.1,2 They play important roles in shaping both past and present environments of the Earth, especially in drylands.1,3,4,5,6 BSC organisms increase soil fertility through carbon (C) and nitrogen (N) fixation and by solubilizing other important nutrients such as phosphorus.1,7 Among the BSC microorganisms, cyanobacteria, in particular filamentous cyanobacteria, are of crucial importance because they are the pioneers who initiate the natural BSC formation process, fixing soil particles by wrapping their trichomes and gluing the secreted extracellular polymeric substances (EPSs).2,8,9,10,11,12,13,14,15 Accumulation of cyanobacterial EPSs in the topsoil could trigger runoff during precipitation, which is crucial for the redistribution of water.16,17,18 Although the structural organization of EPSs at the BSC surface and the effects thereof have been studied previously, the structural organization of EPSs within BSCs is yet to be clarified.19
Microcoleus vaginatus, a motile filamentous and non-N-fixing cyanobacterium, can be commonly found in BSCs on all continents and is thought to encompass more than 25% of the BSC community in early successional stages.9,13,14,15 M. vaginatus is capable of forming multi-trichomous filaments, i.e., bundles of trichomes enclosed in a common sheath made of EPSs.15,20 This bundle-forming behavior is thought to be an adaptation strategy developed in response to environmental stresses, contributing to substrate stabilization and N acquisition and buffering abrupt changes in water availability.15,21,22,23 The possession of a sheath is postulated to play a crucial role in the desiccation resistance of M. vaginatus, which does not produce spores or akinetes before entering dehydration-induced dormancy.24 By prolonging the drying time, the sheaths give the cyanobacteria more time to prepare for the upcoming desiccation.23,25 However, the exact structural implications on BSCs as a result of the existence of these bundled cyanobacterial filaments, as well as their full responses with respect to changing water availability, are yet to be elucidated.
In the desiccated state, cyanobacteria in BSCs remain dormant but can be rapidly reactivated once water becomes available.22,26,27 Under favorable conditions, some filamentous cyanobacteria in BSCs, most notably M. vaginatus, among other cyanobacteria from the families Microcoleaceae and Oscillatoriaceae, are able to migrate from the inside to the surface once supplied with water and retract back when dehydration sets in.22,26,28,29,30 This migration phenomenon is considered to be another survival strategy, which enables these cyanobacteria to actively access more favorable environmental conditions.22,26,28,29,30 Besides other factors (e.g., illumination), previous studies found that during the drying process, gradients of water content along the general direction perpendicular to the BSC surface caused the cyanobacteria to migrate back into the BSC and postulated that a similar mechanism applies to their directional migration to the BSC surface during wetting.28,29 Motility of filamentous cyanobacteria has also been suggested to be the key for their ability to survive sand burial, as well as the means by which cyanobacterial BSCs expand laterally.30,31,32,33 However, the exact routes of cyanobacterial migration inside BSCs, as well as details of the cyanobacterial BSC expansion process, are yet to be revealed.
X-ray computed microtomography (X-ray micro-CT) utilizes the penetrating power of X-rays to obtain a series of two-dimensional (2D) projections of a sample on the μm scale from different angles. These projections are fed into reconstruction algorithms to recreate the 3D internal structure of the sample.34 The major benefits of X-ray micro-CT are that it is non-invasive and requires little to no sample preparation, making in situ investigations possible.34 X-ray micro-CT has been used previously to investigate BSCs, although most existing studies focused on resolving the abiotic structure (i.e., particle packing) rather than the implications and responses of biological components.23,35,36,37,38 One previous study investigated the drying dynamics of thick M. vaginatus filament nodes, showing that the sheaths were able to keep the cyanobacteria wet after the drying of the surrounding BSC matrix.23 The study showcased the potential of using X-ray micro-CT for investigating cyanobacterial components within BSCs. However, X-ray irradiation appeared to deactivate cyanobacteria, and as a result, only physical responses were reported. Another difficulty encountered while applying X-ray micro-CT to visualize BSC biomaterials in μm scale is the low contrast of these materials against the surrounding matrix, especially if water is present, as the attenuation of X-rays by water-saturated, mineral-poor, low-density biomaterials (e.g., EPSs) is similar to that of water.39 Synchrotron-based X-ray micro-CT appeared to suffer from such limitations to a lesser extent; however, specialized facilities and significant organizational effort are required for such systems, limiting their availability.23 A possible solution could be the staining of the sample with X-ray dense dyes (e.g., osmium), which enhances the contrast of the target component and has already been applied to investigate the distribution of soil organic matter.40 Further difficulties arise from image analysis, especially if the image data are to be analyzed quantitatively, which requires segmentation (i.e., separation) of different components.39 Manual segmentation is labor intensive and not suitable for analyzing large sequences of image data (e.g., time series). Automated or semi-automated methods based on machine learning, on the other hand, have the ability to process large datasets with acceptable manual input (i.e., training). The machine learning platform The Weka Workbench, together with its implementation in the ImageJ software, provides free and convenient access to such methods.41,42
In the present study, a staining procedure for enhancing the contrasts of different biological components in cyanobacterial BSCs for X-ray micro-CT imaging, as well as machine-learning-based image processing pipelines, was, therefore, developed. The goal was to elucidate the detailed structural and biological responses of BSCs dominated by bundle-forming cyanobacteria M. vaginatus to changes in water availability and particle burial.
Materials and methods
Site description and sampling
The Gurbantunggut Desert, a typical temperate desert, is located in the transition zone between Central and East Asia and has an area of approximately 4.88 × 10⁴ km. The annual precipitation ranges from 80 to 150 mm. The desert is largely covered by snow from December to February, followed by a quick snowmelt event lasting approximately 1 week in early to mid-March and then a lengthy arid period from April to October with sporadic and sparse precipitation.43 The average annual temperature varies between 6°C and 10°C, with the maximum summer temperature exceeding 40°C, and the prevailing wind direction is from the west in the winter and the west or northwest during the rest of the year.43,44,45 The landscape is characterized by large semi-fixed sand dunes, typically 30 to 50 m high.46 Natural vegetation in the area is dominated by Haloxylon with a total vegetation cover of less than 30%. BSC coverage is estimated to be more than 40%, with lichen- and moss-dominated crusts occupying mainly the interdune areas, while cyanobacteria-dominated crusts occur most frequently on sand dune slopes and have an estimated BSC coverage fraction of 11.24%.43,44,45,47 These cyanobacteria crusts have been shown by a previous study to be dominated by M. vaginatus; this was confirmed again in the present study (Figure S1).48
Samples were collected in October 2023 from the Gurbantunggut Desert within a 1 km radius of 44°36′22″ N, 88°15′16″ E on the leeward slopes of the prevailing wind direction about 1–2 m below the highest ridge on a series of dunes, as BSCs at these locations are most prone to sand burial (Figure S2). The cyanobacteria-dominated BSCs are well developed in the sampling area. These BSCs had a relatively smoother surface and were of lighter color compared to cyanobacterial BSCs located lower on the slope or in the interdune regions. There was no precipitation event in the sampling area at least 2 weeks prior to the sampling. Cyanobacteria BSCs were identified visually. Samples were cut from the dried crusts using a bladed scraper in approximately 7 × 7 cm2 squares, which were lifted from below with the help of the scraper, and the sand particles which loosely attached to the bottom of the crust layer were removed. The thickness of the samples ranged from approximately 2 to 4 mm (Figure S2). Samples were placed in plastic containers cushioned with bubble wrap and then transported back to the laboratory and exposed to room air to remove possible residual moisture under room temperature in shade for 24 h. These samples were finally stored in sealed containers at room temperature until the experiments were performed. Free-flowing sand was also collected from near the BSC sampling sites and sealed in plastic bags, transported back to the laboratory, and then dried and stored under the same conditions as the BSC samples.
Crust rehydration-dehydration and particle burial experiments
To investigate the structural and cyanobacterial responses in situ, intact crust samples were used. For crust rehydration-dehydration experiments, pieces of intact BSC samples were positioned onto 5-cm-thick dry sand, which filled the inside of an opaque plastic container. This setup was placed under white light-emitting diode (LED) lights (6,000 K) with a photosynthetically active radiation (PAR) intensity of 300 ± 20 μmol m−2 s−1 reaching the BSC surface. This light intensity was selected based on the solar irradiance measured during rainy conditions in the field. The surface of the BSC samples was exposed directly to the air, and the room temperature was 23°C ± 2°C. Lateral air flow above the samples was provided by a small electric fan with a wind speed of approximately 0.3–0.5 m s−1 to control the BSC temperature and mimic the air flow encountered in the field. Rainfall was simulated by spraying deionized water onto the top of the sample with a handheld nebulizer. Every 2–3 min in the first hour of the experiment, a fixed volume of deionized water was applied uniformly onto all sample surfaces in order to simulate a typical short rainfall event with an approximately 2–3 mm precipitation volume (the wetting phase). After the first hour, the water supply was halted, and the setup was allowed to air dry while the other conditions remained the same (the drying phase). X-ray computed tomography (CT) scans are known to deactivate cyanobacteria in BSCs, and individual scans usually last more than 1 h, which is too long for the analysis of cyanobacteria migration.22,23,26,28,29 As a result, subsampling at time intervals appropriate for observing cyanobacteria migration was performed on larger BSC samples, which underwent wetting/drying undisturbed. Squares of subsamples approximately 4 × 4 mm2 in size were cut out using a sharp narrow-blade scalpel without disturbing the central region of the subsamples (Figure 1A). Each subsample was taken at least 4 mm away from the others. The first subsamples (i.e., at 0 min) were taken immediately before the wetting phase while the BSCs were still dry. The subsampling was done at 10 min intervals in the first hour and then in 30 min intervals until the BSCs were deemed desiccated based on visual inspection at 180 min.
Figure 1.

Schematic illustrations of the scanning setups for different sample types, training pixel selection, and the pipeline for component class distribution analysis
(A) Acquisitions, preparations, and scanning setups for different sample types: GA, PTA, and Lugol’s represent glutaraldehyde aqueous solution, phosphor tungstic acid aqueous solution, and Lugol’s solution, respectively; the scanning parameters applied to different types of samples can be found in Table 1.
(B and C) Examples for training pixel selection for wet-scan images (B) and dry-scan images (C). Green, red, yellow, and blue arrows indicate examples of trichome/biomaterial, pore, particle, and extracellular polymeric substance (EPS) components, respectively. Manual identification of the class components was performed based on the following guidelines in three dimensions: trichome (wet)/biomaterial (dry) - filamentous objects with any diameter and of the highest intensity values; pore (wet/dry) - pixels of coherent volumes with the lowest intensity values; particle (wet/dry) - non-filamentous independent objects with any intensity values higher than pore; EPS (wet) - pixels with intensity values higher than pore pixels but lower than trichome and particle, continuous and with clear boundaries, usually connect to trichomes.
(D–I) For component class distribution analysis, a reconstructed region-of-interest stack (D) was first segmented (E, green: trichomes, brown: sand, cyan: EPS, black inside the bonding box: pore). Then, a binary mask sub-stack was created from the target class with the value of pixels occupied by the target class set to 1 and everything else to 0 (an example using the trichome class is presented in F). The mask stack is then converted to 16-bit and divided into 16 sub-stacks excluding the edges (i.e., 4 division each along the x and y axes respectively, blue solid lines), thus each sub-stack has a square base area of 400 × 400 μm2 on the x-y axis planes. Intensity distribution of the target class in sub-stacks (G, depicted in two dimensions for clarity) in which the surface position of each sub-stack was determined individually using the sand class of the corresponding sub-stack as the position reference (indicated by the gray shadow and horizontal blue dotted lines, respectively). The sum of slices Z project function of the Fiji software was applied to each sub-stack along the x axis to generate the depth distribution of the targeted class. The depth distribution plot of the intensity values of the target class was then generated using Plot Profile of Fiji on the summed projections. Each mark in (H) represents the mean value at the same distance to the surface reference from all sub-stacks. Distribution heatmap of the targeted class was finally generated by summing the intensity values along the depth direction in 50 μm intervals (I); the sums were normalized by dividing each of them by the maximum of the interval sums. The blue arrows from (D)–(I) indicate the flow of the processing pipeline.
The particle burial experiment was performed using an identical setup as described above. However, in this experiment, the crust samples and the sand underneath were kept wet throughout the experimental period by injecting deionized water into the sand until the sand reached maximum water holding capacity and then replenishing water if needed. To distinguish between the original BSC particles and newly deposited particles, sand burial was simulated by sprinkling a thin layer of glass beads uniformly onto the crust surface 1 h after wetting until the original crust surface was completely covered (approximately 0.5 mm thick). Glass beads of different sizes (batches with mean diameters from 50 to 500 μm) were mixed before application to simulate the size variation of the sand particles. For this experiment, subsamples were only taken immediately after glass bead application and 5 h after the start of the experiment.
Hydration of isolated filaments
Filaments excised from the crusts were used to better visualize the migrational behaviors of the trichomes within more defined 3D porous structures. For this purpose, single strands and nodes of cyanobacterial filaments were isolated from crushed dry crust samples with the help of tweezers. Then, the isolated filament was inserted into a dry hydrophilic melamine sponge placed inside a cut section of a pipette tip, which had an inner diameter of approximately 2 mm. This was glued onto the top of a cylindrical hydrophilic melamine sponge with a diameter of 1 cm and a thickness of 5 mm (Figure 1A). The setup was placed under white LED lights (6,000 K) with a PAR of 80 ± 10 μmol m−2 s−1, and the bottom sponge piece was wetted with deionized water until saturation, then incubated for 1 h in a closed Petri dish at 23°C ± 2°C. The humidity inside the Petri dish was maintained close to saturation throughout the incubation period by placing water-saturated sponges next to the setup inside the Petri dish.
Filaments excised from the crusts were also used to investigate the physical changes of cyanobacterial biomaterial in response to hydration. To achieve this, 9 sections from a total of 6 filaments with different appearances were imaged; these included filaments containing a single bundle of trichomes and filaments containing multiple bundles of trichomes, and some sections of these filaments were without any visible trichome (i.e., empty sheath sections). These filaments were fixed separately onto the sharper end of a needle with instant glue at one end, and then the filament, together with the part of the needle onto which the filaments were fixed, was put into a small cup made from cut pipette tips (approximately 2 mm inner diameter). The bottom of this cup was sealed with glue so it could hold water during the wet-state scan (Figure 1A).
Sample preparation and staining of biomaterials
To enhance the contrast of biomaterials in X-ray micro-CT-generated images, a staining method was developed. The cut-out crust subsamples were submerged immediately in 1 mL 2.5% glutaraldehyde (GA) aqueous solution and kept submerged for 1 h to fix the sample. After fixation, the samples were washed by replacing the GA solution with deionized water and allowed to stand for 10 min; this process was then repeated 2 more times. A two-stage staining protocol with Lugol’s solution and phosphor tungstic acid (PTA) aqueous solution was employed for enhancing contrasts of the biological materials; for more details regarding the development of the staining protocol, refer to the first section in the discussion and the supplemental information (Figures S3–S5). After washing, the samples were first stained by submerging them in 5% Lugol’s solution for 3 h and then washed 4 times as described above. Subsequently, the samples were submerged in 1% PTA solution for 5 h for the second staining phase, after which the samples were washed 4 times. The stained and washed samples were then allowed to air dry (no less than 4 h). All procedures described above were performed at room temperature (if not specifically stated, this was also the case for all subsequent operations). Finally, the dried samples were stored sealed in a 4°C refrigerator until scanning (the storage period lasted no longer than 24 h). The above-described procedure resulted in the detachment of some particles from the bottom and the sides of the samples, but the upper surface was not visibly affected except in the case of glass-bead-covered samples (for more details, refer to the results section).
For isolated filaments in the sponge, the water inside the sponge was removed with a syringe after the incubation period and rinsed with 2.5% GA solution once, and then the whole setup was saturated with fresh 2.5% GA solution. After 1 h fixation, the setup was washed 3 times and then saturated with 1% PTA solution for 5 h. After another 4 washing cycles, the setups were allowed to air dry (no less than 4 h) and stored sealed in a 4°C refrigerator until scanning. For visualizing the volume change of isolated filaments, the staining was performed using the same procedure as for the BSC samples before the dried filaments were fixed onto the needle head.
X-ray micro-CT scan and image acquisition
The prepared crust samples were placed right side up onto hydrophilic melamine sponges inserted in inversely placed 2 mL centrifuge tube caps. The cap was then fixed with glue onto the sample holder for scanning. The sample was first scanned in the dry state. Then, for wet-state scans, the sponge beneath the sample was saturated with deionized water, such that the crust was visibly wet but without the appearance of a continuous water film at the surface. The cap was sealed by installing the tube body on top to prevent excessive evaporation during the scan. For filaments in the sponge, the whole setup was placed onto the sample holder directly for the dry scan. For filaments fixed on the needle, the end of the needle without the filament was clamped onto the sample holder; for the wet scan, deionized water was injected into the cup containing the samples, after which the top opening was sealed with Parafilm. Preparations and the scanning setup for different sample types are shown schematically in Figure 1A.
A Zeiss Xradia 515 Versa X-ray microscope (Zeiss, Germany) and Scout&Scan v.15.0 software package (Zeiss, Germany) were used to perform the X-ray micro-CT scans. The scanning parameters are listed in Table 1; all scans were performed without optical filters. After the CT scan, a stack of horizontal (i.e., parallel to the bottom surface of the sample holder) slices was reconstructed (reconstructed stacks/slices) using the Scout&Scan software for each scanned sample, with the smoothing sigma and the beam hardening constant set to 0.5 and 0.01, respectively. The reconstruction was performed using the software’s built-in automated center finding function and checked visually for misalignment, in which case the drift was corrected by manually adjusting the center shift. The reconstructed stacks were exported as 16-bit.tiff sequences.
Table 1.
Parameters applied for X-ray microtomography
| Sample type | Crust samplesa | Filaments incubated in sponge | Filaments fixed on needle | |
|---|---|---|---|---|
| Parameters | ||||
| Objective | 4′ | 20′ | 20′ | 20′ |
| Source voltage (kV) | 50 | 100 | 90 | 70 |
| Source power (W) | 4 | 9 | 8 | 6 |
| Source/detector distance (mm) | 15/15 | 14/12 | 14/12 | 11/8 |
| Number/angle of projections | 1,601/180° | 3,201/360° | 2,001/180° | 2,001/180° |
| Bin number | 2 | 2 | 2 | 2 |
| Exposure time (s) | 1 | 2.5 | 1 | 1 |
| Resolution (μm) | 3.3428 | 0.7284 | 1.4568 | 0.783 |
Note that 2 sets of scanning parameters were applied for crust samples to achieve different resolutions.
Image processing and machine-learning-based pipelines
The Fiji package of ImageJ 1.54f was used for image processing and quantification.42 The brightness and contrast of all images were adjusted to enable manual identification of different components (i.e., particles, trichomes, EPSs, and pores) and/or for greater clarity. If needed, the stacks were resliced in the vertical direction using the reslice function of Fiji to yield vertical slices.42
Machine-learning-based pipelines were developed to segment different components of the sample image stacks. For BSC samples, a 500 × 500 pixel (approximately 1,671 × 1,671 μm2)-sized region of interest (ROI) was selected away from the edge of each reconstructed stack. Then, the stack was cropped to remove slices from the top of a stack that did not contain any crust component, and the bottom slices were removed until the BSC filled the ROI completely. The ROI stack was then segmented using the trainable Weka segmentation 3D plugin of Fiji.49 Training pixels of different crust component classes were identified based on results presented in a previous study and experience: a stack was first inspected in 3D with the orthogonal views function of Fiji, and then pixels were identified according to their intensity, appearance, and relative positions (Figures 1B and 1C).23 The training pixels were then selected using the Fiji ROI selection tools and fed to the segmentation models. In total, 3 (pore, biomaterials, and particles) and 4 (pore, EPSs, trichomes, and particles) different component classes were used for classifying images generated by the dry and wet scans of BSC samples, respectively. The biomaterials class of the dry-scan image included both EPSs and trichomes, since in the dry state, the shrunken EPSs could not be differentiated from the trichomes contained therein. For images of isolated filaments, biomaterials (including trichomes and EPSs), sponge (if present), and other (empty space, water, and occasionally sand particles) classes were defined.
For the semi-automated segmentation, the filters applied to generate classification feature stacks were Gaussian blur, Hessian, structure, edges, difference of Gaussian, mean, variance, and the minimum and maximum sigma set to 1 and 8, respectively. Random forest models with a branch size of 100, 7 features per node, and 200 trees with unlimited tree depth were trained separately using the manually selected training pixels for dry- and wet-scan data, respectively. The trained models were applied to generate segmented stacks.49 The efficiency of the segmentation models was evaluated using the experimenter module of The Weka Workbench v.3.8.41 The train/test percentage split mode with numerical training pixel fractions from 10−6 to 10−1 was applied to no less than 109 manually identified pixels to determine the optimal ratio of training pixels to total pixels. The manually identified pixels included all component classes, with the distribution of the pixels from any class roughly corresponding to its occurrence frequency. Five runs for each training pixel fraction with randomized data were performed. Based on the results, for any single BSC sample stack, no less than 8‰ of the total pixels were utilized for training. Images of isolated filaments were segmented using the same processes described above, but no test was performed, as visual inspection showed that the different classes can be relatively easily and cleanly separated.
To analyze the distribution of classes in the depth direction, the processing pipeline outlined in Figures 1D–1I was applied. To quantify the effects of hydration on pore-geometry-related variables, segmented stacks generated by dry and wet scans of the same samples were compared. First, the ROI stacks from three BSC samples before and after hydration were cropped further to include only the top 200 slices directly below the surface of the BSC, where most of the EPSs were located. Pore pixels in these stacks were isolated using the threshold function of Fiji to generate the pore stacks. Then, the 3D volume and 3D surface function in the Fiji 3D Suite plugin was used to calculate individual pore volumes and surface areas, respectively, which were then summed to acquire the total value.50 Porosity was calculated as the total pore volume divided by the total ROI BSC volume. The Skeletonize 3D and Analyze Skeleton plugins of Fiji were applied to pore stacks to generate and analyze pore-network structures and calculate the longest shortest path, which is the path with the maximum length of all shortest paths between two nodes.51,52,53 Average 3D pore tortuosity was calculated as the mean of the x, y, and z directions using the TORT3D function with MATLAB R2021a (MathWorks, USA), with binarized pore stacks as input.54 Pore connectivity was calculated by dividing the total number of pore skeleton branches by the total number of nodes.55 The 3D volume function was also employed to calculate the volumes of each component class, which were then used to calculate the volume fractions of and volume ratios between different classes. Hydraulic conductivity at saturation was calculated based on porosity, tortuosity, and effective pore hydraulic radius (pore volume divided by pore surface area) using formulars from a previous study (refer to the supplemental information).56 3D rendering was performed using the 3D viewer plugin of Fiji.57 The surface coverage of biomaterials was calculated based on the top-down view of a given segmented and 3D-rendered ROI volume, including the surface of the BSC; the view was converted to a single image, which was then converted to grayscale and the contrast enhanced to highlight the biomaterials. Then, areas occupied by the biomaterials class were selected using the threshold function of Fiji from the image, and the coverage was calculated as the area occupied by the biomaterials class divided by the sum of all occupied areas.42
Statistical analysis
To evaluate the segmentation models, the results of the statistical analysis were generated by the Weka experimenter module.41 Statistical analyses of the quantified image data were performed using Prism 9.0 (GraphPad, USA).
Results
Image segmentation with machine-learning-based method
The 2-phase staining enhanced the contrasts of both cyanobacterial trichomes and EPSs in X-ray scanning images. In wet-scan images, EPSs and trichomes could be clearly distinguished from the surrounding matrices in most cases. In dry-scan images, however, only EPSs that were not closely associated with other higher-intensity components could be distinguished. The accuracy of the BSC image segmentation models increased with the numerical fraction of training pixels out of the to-be-classified pixels in segmented log-log relationships. The model behaviors were similar for data generated by both wet and dry scans. For wet scans, a training pixel fraction threshold could be observed at 10−5, above which the rate of model accuracy improvement decreased. For dry scans, this threshold was near 10−4. The rate of increase in accuracy for the dry-scan model appeared to be faster than that of the wet-scan model. Nevertheless, training pixel fractions greater than 2‰ and 5‰ were enough to achieve an accuracy of more than 90% for wet and dry scans, respectively (Figure 2J). Representative results generated by the segmentation models are presented in Figure 2.
Figure 2.

Representative results of segmented cyanobacterial biological soil crust sample images and accuracies of image segmentation models
(A and E) Reconstructed slices for samples scanned in wet (A) and dry (E) states.
(B and F) Slices corresponding to (A) and (E) after segmentation, respectively.
(C and G) Rendered 3D volume from reconstructed stacks for samples scanned in wet (C) and dry (G) states. The same volumes correspond to those in (C) and (G) after segmentation (D and H, respectively).
(I) Isolated component classes and their volume fractions of a segmented and rendered 3D volume of a sample scanned in wet state.
In (B), (D), and (I) (segmented images only), green: trichomes, brown: particles, cyan: extracellular polymeric substances, and black inside the bonding box: pore; in (F) and (H), green: biomaterials, brown: particles, and black inside the bonding box: pore; yellow outlines in (C), (D), (G), and (H) indicate the section planes of the 3D volumes.
(J) Percentage of correctly classified pixels vs. different numerical fractions of manually identified pixels as training pixels. Marks and errors bars are means and SDs from pentaplicates; the dotted lines depict segmented log-log curve fitting to the respective data, all with r2 values greater than 0.9, except for the lower segment of the wet model, which had a r2 value of 0.79; the green and red shadowed areas with dotted lines indicate model accuracy above 90% and training pixel fractions above 8‰, respectively.
Hygroscopic swelling of biomaterials alters BSC pore geometry significantly
Upon wetting, the volume of cyanobacterial filaments increased due to hygroscopic swelling. For exercised cyanobacterial filaments, the amount of volume change depended on the internal structure of the filaments. For filaments containing a single bundle and multiple bundles of trichomes, the volumes increased 2.35- and 4.22-fold on average, respectively. For empty sheaths, the mean volume increase was 8.25-fold (Figure 3). While the inside of the filaments appeared to be completely filled, it was not possible to determine whether the space not occupied by the trichomes was filled with water or EPSs.
Figure 3.

Changes in appearances of cyanobacterial filaments upon wetting
(A–C) Reconstructed slices of filament cross-sections containing a single trichome bundle (A), multiple trichome bundles (B), and no trichome, i.e., empty sheath (C), in dehydrated state after segmentation.
(D–F) Reconstructed slices from approximately the same position on the same filament corresponding to the images of the 1st column in hydrated state; the yellow arrowheads point to examples of trichome bundles.
(G and H) Rendered 3D volume of a filament section with multiple trichome bundles in dehydrated (G) and hydrated (H) states, respectively.
(I) Quantified fold changes in volume for different types of filaments. Bars and error bars are means and SDs from triplicates, lines with ∗ indicate two sets of data that are significantly different with p values less than 0.05, evaluated with pairwise t test.
In (A)–(H), the non-filament components in the images were removed for clarity.
After hydration, porosity close to the BSC surface decreased from 37.3% to 15.9%, which could be attributed mainly to the hygroscopic swelling of biomaterials, especially the EPSs, as the volume fraction of the biomaterials increased from 4.5% to 25.0%, with more than 20% attributed to EPSs in the wet state. Hydration also altered the pore-network structure. The total number of pore-network branches increased significantly by more than 1.41-fold, while that of pore nodes increased by 1.29-fold, although not significantly. The longest shortest path through the analyzed BSC volumes increased significantly by 1.26-fold, while the average tortuosity increased from 1.22 to 2.12. The pore-network connectivity did not change significantly. Hydration significantly reduced the effective hydraulic radius of the pore network from 11.06 to 7.79 μm. The calculated pore-network hydraulic conductivity at saturation was reduced significantly by approximately one order of magnitude as a result of hydration (Figures 4G and 4H). Visual inspection showed that, compared to the dry state, after wetting, the number of looping pores increased dramatically, as indicated by the higher density of “clumps” in pore-network skeletons (Figures 4C and 4F). The swelling of filaments was also observed to affect particle packing in BSCs, primarily as a result of particles being pushed aside by the swelling biomaterials, increasing the bulk volume of the BSC (Figures 4P and 4Q).
Figure 4.

Effects of hydration on internal structures of cyanobacterial biological soil crusts
(A–C) Rendered region of interest (ROI) 3D volume from reconstructed stacks (A), after segmentation (B), and after pore volume skeletonization (C) in dehydrated state; in (B), green: biomaterials, brown: particles, and black within the bonding box: pore.
(D–F) Rendered 3D volume of the same sample ROI with image processing corresponding to the 1st column in hydrated state, respectively; in (E), green: trichomes, brown: particles, cyan: extracellular polymeric substances (EPSs), and black within the bonding box: pore.
(G) Quantified changes of porosity and biomaterial fractions between different states; the green bar within the wet biomaterial fraction represents the trichome fraction and the rest the EPS fraction.
(H) Quantified pore-network characteristics between different sample states.
In (G) and (H), gray and cyan fill indicated dry and wet states, respectively; bars/marks and error bars are means and SDs from triplicates, respectively, and lines with ∗ indicate two sets of data that are significantly different with p values less than 0.05, evaluated with t test.
(I–N) Examples of vertical reslices of reconstructed stacks for samples scanned in dry (I–K) and wet (L–N) states; green and blue arrows indicate the position of trichome bundles and tunnel-like EPS structures, respectively.
(O) Radii of trichome-containing filaments and EPS tunnels measured from vertical reslices; F_dry, T_dry, F_wet, and T_wet represent radii of the filament in dry scan, EPS tunnels in the dry scan, filaments in the wet scan, and EPS tunnels in the wet scan, respectively; ≥50 measurements were performed for each feature; the whiskers give the maximum and minimum values; the lines in boxes and box boundaries represent medians and 25th–75th percentiles, respectively; lines with ∗ indicate two sets of data that are significantly different with p values less than 0.05, evaluated with t test; the gray and cyan dotted lines represent calculated mean effective pore hydraulic radii of BSC samples scanned in dry and wet states, respectively.
(P and Q) Details of hydration-induced change in cyanobacterial BSCs, with the same sample scanned in dry (P) and wet (Q) states, and the generated stacks resliced at the same section plane; yellow arrowheads with the same number indicate the same filament/EPS features in both images; yellow arrowed lines indicate relative position change between the same pair of particles in different states, with the numbers indicating the distances in μm; yellow dashed line enclosed area in (P) shows roughly the portion of BSC removed from the field of view due to effects of hydration. All raw data were acquired from field samples before wet incubation; images are presented as maximum intensity projection of 10 consecutive slices to enhance contrast and compensate distortions caused by the slight sample shift between scanning states in (P) and (Q).
Cyanobacteria migrate through EPS tunnels to and from BSC surface
Before the hydration of the dry BSC samples, cyanobacterial trichomes were observed to distribute from 50 μm to deeper than 1,000 μm below the surface, with the majority below 300 μm, and the highest volumetric density in this depth range at 800 to 850 μm. Between 20 and 60 min in the wetting phase and from 90 to 120 min in the drying phase, the majority of trichome-occupied volumes, i.e., the main trichome volume, were observed to distribute in an approximately 700 μm vertical band (Figure 5). The trichomes migrated upwards during the simulated rainfall, as indicated by the shifting of the trichome distribution. At 30 min, the upper boundary of the main trichome volume reached the BSC surface. The upward migration continued until the end of the wetting phase, at which point some trichomes appeared to extend to 150 μm above the surface, and the highest density had shifted to 50–100 μm below the surface. During the drying phase, the trichomes migrated back into the BSC. At 90 min, the highest trichome density was observed at 100–150 μm below the surface. After another 90 min, at which point the BSC was visibly desiccated, the location of the highest trichome density had shifted to 700–750 μm (Figure 5A). Compared to trichomes, the distribution of EPSs did not exhibit obvious temporal variation during both the wetting and drying phases. Most EPSs congregate from the surface to about 500 μm below the surface, and the highest EPS densities were observed between 100 and 300 μm below the surface (Figure 5B). The distribution of pore volume roughly reflects the inverse of that of EPSs, with the lowest porosity observed between 200 and 500 μm. Similar to EPSs, no obvious change of pore volume distribution could be observed along the time axis (Figure 5C).
Figure 5.

Depth distribution of normalized cyanobacterial biological soil crust component classes and the migration of trichomes during simulated rainfall desiccation
(A–C) Trichome volume distribution (A), extracellular polymeric substance (EPS) volume distribution (B), and pore volume distribution (C). Note that the intervals of the time axes are not equally spaced, in which 0 to 60 min is the wetting phase with simulated rainfall, and 90 to 180 min is the drying phase; the two phases are separated by the red dotted lines. The grid along the distance axes was shifted −3.343 μm to fit the data, and the raw image data used were acquired from samples scanned in the wet state and from triplicates.
(D) Time series demonstrating the migration of M. vaginatus in biological soil crust (BSC) during simulated rainfall and the desiccation that followed; the 1st row below the time axis shows images acquired with optical microscopy from the BSC surface, showing the movement of trichome bundles within a tunnel-like EPS structure (cyan arrows); the 2nd and 3rd rows show examples of rendered 3D volumes of reconstructed BSC region-of-interest stacks; the volumes were rotated and sectioned to expose the interiors and positions of trichome bundles inside their respective sheath/EPS tunnel. Raw data for images in each column were acquired from samples at the time indicated on the time axis, all in the wet state; the lengths of x and y axes in the 2nd and 3rd rows are 1,003 and 1,671 μm, respectively; yellow outlines in the 2nd and 3rd rows indicate the section planes of the 3D volume; note that some section planes are perpendicular to the views.
In undisturbed BSCs before hydration, filamentous structures made up of EPSs were observed to extend from the trichome bundles of cyanobacteria inside the BSC to the surface. These EPS structures inflated after hydration, and the vertical distances from the uppermost end of the coupled trichome bundles to the BSC surface were approximately 300 μm (Figures 4I–4Q). After hydration, these filamentous EPSs appeared to have tunnel-like structures, as X-ray imaging and light microscopy showed that the cyanobacterial trichomes could migrate through the insides of these structures to the BSC surface during wetting and back inside during drying (Figure 5D). In exercised filaments, which were less damaged, the trichome-containing section was also observed to connect to a section of empty sheaths, through which the trichomes migrated once wetted (Figure S7).
Cyanobacteria expand BSC structure by spreading trichomes
In BSCs after 1 h of saturating wet incubation, based on the diameters of the filamentous biomaterials observed, most cyanobacteria still existed as bundles, and individual trichomes were sparsely encountered (Figure 6A). After particle burial and 4 h additional wet incubation, the cyanobacterial trichomes were able to migrate from the original BSC layer into the freshly deposited glass bead layer, leaving evacuated sheaths (Figure 6H). However, instead of migrating in bundles, the trichomes spread and formed net-like 3D structures on and near the new surface, which appears to be made mostly of individual trichomes (Figures 6D and 6I). This net-like structure was found to be woven around the glass beads and fixed them tightly to the original BSC surface, thus expanding the BSC structure into the glass bead layer. This was evident because the relatively robust staining and washing procedures did not remove most of the attached glass beads after additional incubation, contrary to applied glass beads without further incubation, which were removed completely after the handling. The surface coverage by biomaterials increased significantly to 46.2% after particle burial and 4 h additional wet incubation, compared to 31.3% of 1 h incubated samples. On the other hand, the volume ratio of biomaterials to particles in the topmost 668 μm, which corresponds to the main trichome volume, did not change significantly. On the filament scale, when other environmental factors were identical, in contrast to filaments placed on a flat and relatively smooth 2D surface (i.e., nylon membrane filter), isolated filaments placed inside the 3D porous structure of the melamine sponge showed that the trichomes did not migrate as an undivided bundle but instead spread from the opening of the communal sheath in branching structures roughly shaped in a cone (Figures 6K, 6L, and S8). These trichome branches appeared to follow the fibrous structure of the sponge instead of moving inside the free space between the fibers. The spreading of cyanobacterial filaments was also observed in 5 h wet incubated BSC samples (Figure 6J).
Figure 6.

Effects of extensive wet incubation and particle burial on cyanobacteria migration in cyanobacterial biological soil crusts and in sponge
(A and D) Maximum intensity projections of reconstructed stacks along the depth direction; the projection includes the topmost 100 slices (approximately 334 μm) with biological soil crust (BSC)-occupied pixels of the stacks for 1 h wet incubated BSC immediately after glass bead application (A) and after another 4 h incubation (D). Note that in (A), glass beads were completely removed after the sample treatment process.
(B and E) Rendered 3D volume of the topmost 200 slices (approximately 668 μm) containing BSC pixels of the same samples corresponding to the images in the 1st column after segmentation; brown: particles; green: biomaterials.
(C and F) Thresholded top-down views of the rendered 3D volumes corresponding to the images in the 2nd column after conversion to grayscale and contrast enhancement; the surfaces covered by biomaterials are displayed as white, while exposed particles are in gray. (G) Quantified BSC surface coverage by biomaterials and biomaterial-to-particle volume ratio in the topmost 668 μm of the samples, quantified from regions of interest having horizontal planar (i.e., perpendicular to the depth direction) areas of 500 × 500 μm (excluding edges and BSC-pixel-free regions); + and – symbols indicate whether glass beads were fixed to the BSC surface at the indicated incubation time; marks and scale bars represent means and SDs from triplicates, respectively; lines with ∗ indicated two sets of data that are significantly different with p values less than 0.05, evaluated with t test.
(H) Optical microscopy images of vertical cross-sections of a cyanobacterial BSC sample 1 h wet incubated then covered with glass beads and incubated for 4 more hours; local magnifications within the yellow rectangles are presented on the right side. Note that the sample was partially but not completely desiccated at the time point at which the images were taken.
(I) Rendered 3D volume of reconstructed stacks of a BSC sample underwent particle burial and additional wet incubation (left) and isolated trichome network after segmentation (right).
(J) Maximum intensity projection of reconstructed stacks containing a branching filament (left) and rendered 3D volume of the projected stacks after segmentation (right).
(K and L) Rendered 3D volume of reconstructed stacks of filaments incubated in sponge (left) and after segmentation (right; filaments/trichomes and sponge fibers are depicted in green and cyan, respectively). All raw data of the micro-CT scan images were acquired from samples scanned in the dry state.
Discussion
Notes on the method
Besides stopping all biological activity in the samples, as a well-known crosslinking agent for polysaccharides and proteins, GA fixation potentially prevented possible disintegration/disruption of biological structures, including that of EPSs, in the subsequent treatments by reinforcing their matrices.58 Based on comparing images of samples with and without GA fixation acquired using X-ray micro-CT, the fixation appeared not to visibly affect the appearance of BSC structure or cyanobacterial biomaterials at the relevant resolutions (Figure S3). In the 2-stage Lugol’s-PTA solution staining, Lugol’s favorably enhanced the contrast of the EPS and PTA that of the trichomes, presumably by binding to the polysaccharides and proteins therein, respectively.59,60 This created better results compared to the other protocols (Figures S4 and S5). Based on optical microscopy observations, the staining procedure also appeared not to visibly affect the appearances of M. vaginatus filaments besides a change in color as a result of the binding of iodine to the biomaterials (Figure S3). As such, the fixing and staining procedure may have affected the samples to some degree, but these effects have a negligible impact on the scales at which the samples were imaged with X-ray micro-CT.
One limitation of the X-ray micro-CT is that it resolves the samples by intensity attenuation and, as a result, produces grayscale images. Because EPS could shrink to 12% of its wet volume once dehydrated, EPSs that were visible in the wet state could “disappear” in dry scans if they were attached to higher-intensity components (e.g., sheaths of PTA-stained trichomes). Consequently, trichomes and EPSs were combined into the biomaterials class for dry-scan segmentation. This had a minimum impact on pore geometry analyses because the pore class could be separated regardless of the segmentation of the other classes. Segmentation of individual trichomes was performed only with data from dry scans, as they could not be cleanly resolved in the wet scans. Another limitation is that the strong X-ray irradiation deactivated the cyanobacteria, and subsampling has to be employed to create time series of responses. As a complex and heterogeneous matrix, BSC structures and occurrences of cyanobacteria therein may differ significantly even at mm scales. To counter this problem, quantified raw data of BSC sample images were transformed into unitless variables before between-samples comparison. Although not a perfect solution, this approach is sufficient to normalize the affected variables analyzed in the present study.
With respect to the machine-learning-based image segmentation, although more training pixels meant greater accuracy, it was not practical to select more than 1% of pixels from a single ROI stack (a BSC ROI stack has, in most cases, ≥5003 pixels) for model training. Thus, a training pixel fraction of 8‰ was employed, which achieved accuracies of no less than 90% (Figure 2J). Because the fractionation of the training dataset was optimized based on the volume fraction of each individual component, the mis-segmentation could be minimized. Moreover, as these errors presumably are distributed randomly and uniformly among samples, the results should not have been significantly impacted. The present study used a random forest model for segmentation; with a more complex model, the accuracy of segmentation will undoubtedly be improved, and stronger computational power can be employed to reduce processing time.
Hygroscopic swelling of cyanobacteria alters pore geometry dramatically
Complex heteropolysaccharides are the main components of the EPS, which is the key ingredient of the sheaths.61,62 The communal sheath is a crucial part of the M. vaginatus filament; it serves as a physical barrier for the trichomes contained within.21 As a result of the polysaccharide components, one important property of the EPSs/sheaths is that they are hygroscopically swellable. Previous studies reported increases of approximately 1.5-fold to several times their original volumes for trichome-filled M. vaginatus filaments in situ and exercised filaments upon wetting, respectively.6,23,30 The in situ value is lower compared to isolated filaments, suggesting the BSC matrix restricted filament volume expansion. Indeed, the hygroscopic swelling of biomaterials had actually pushed the adjacent particles away. The degree of volume increase of a filament was determined by the number of trichome bundles contained within. M. vaginatus-dominated filaments can possess sub-sheaths that separate multiple trichome bundles inside the communal sheath.30 Since EPS is the major component of the sheath and the primary contributor to hygroscopic swelling, the observed discrepancy could be explained by the differences in EPS quantities.63,64 Empty sheaths exhibited the greatest volume increase because they completely collapsed in a dehydrated state and became fully inflated once hydrated. It is generally recognized that BSC organisms, including cyanobacteria, promote soil pore formation.65 In the desiccated state, the pores could have promoted the aeration of the crusts as well as the subcrust layer.66 But in hydrated BSCs, the pores became clogged due to the swelling of the biomaterials, which impedes, rather than promotes, gas as well as water infiltration. On the other hand, the swollen network of biomaterials could have promoted the resistance of the crust structure against water erosion.
A previous study investigated the structural effects of EPS swelling of Nostoc colonies at the surface of the BSC.19 The results from the present study showed that although biomaterials of cyanobacterial origin, in particular EPSs, might not be continuous at the crust surface compared to lichen or moss, a continuous 3D network thereof can be found inside the crusts. The swelling of these biomaterials upon hydration changed the BSC’s internal pore geometry dramatically, with EPS being the dominant contributor. A drastic decrease in porosity was observed, which is associated with the ability of EPS to reduce hydraulic conductivity.67,68,69 The longest shortest path is the path with the maximum length of all shortest paths between nodes, and tortuosity describes the curvedness of the pore paths, both of which increased significantly upon hydration, indicating increased pore structure complexity.51 However, because of the simultaneous increases in the numbers of both pore branches and nodes, pore connectivity did not change significantly. This could be cautiously interpreted as increases in both the typical length and the number of pore paths connecting the nodes, creating more looping pores, as verified by the increase in the number of clumps observed in the pore-network skeletons. Nevertheless, the results from the present study showed that the swelling of biomaterials significantly reduced the hydraulic conductivity at saturation, not only because of decreased porosity but also as a result of reduced effective pore hydraulic radius and increased tortuosity. This is contrary to a previous observation that removing EPS reduced BSC hydraulic conductivity and might be explained by the extraction of EPS collapsing the pores, causing catastrophic disruptions of pore structures, as they are no longer supported by the EPS.11 The pore-clogging effect of EPS, in combination with significantly smaller amounts of above-ground biomass and smoother surfaces compared to moss- or lichen-dominated BSCs, may have contributed significantly to the fact that cyanobacterial crusts create runoffs more readily.17,18,65
Tunnel-like EPS structures within the crusts serve as passageways and conduits
The simulated rainfall event triggered the migration of cyanobacteria in BSC, resulting in their emergence at the surface, which then retracted back during desiccation, confirming observations made by previous studies both under laboratory conditions and in the field.22,28,29,30,70 The emergence of trichomes was also observed in wetted BSC samples placed inside a well-ventilated glass-roof greenhouse under rainy weather conditions, as well as in crusts that had been wetted and shaded in the field (Figures S6A and S6B). The motility of filamentous cyanobacteria is known to be crucial for their survival in the event of sand burial.31,32 A previous study demonstrated that exposure to frequent and heavy particle burial events during cyanobacterial crust formation favors the dominance of motile filamentous cyanobacteria, including M. vaginatus.32 Compared to other BSC cyanobacteria that live at the surface of the crust (e.g., Nostoc and Scytonema), these cyanobacteria lacked the ability to produce dark sunscreen pigments and had to rely on their motility to seek protection from strong solar radiation (i.e., by migrating below the surface).22,28,29,30,70 This led to a higher surface albedo in contrast to crusts with a higher abundance of the surface-dwelling cyanobacteria (e.g., the crusts at the interdune position) and possibly a lower amount of EPSs at the crust surface.1,2,32 The retraction of the trichomes back into the crust may further help to reduce the absorbance of solar radiation, thus impacting the rate of soil water evaporation during the initial drying. However, after the initial drying, unlike lichens and mosses, which still provide continuous surface cover after desiccation, the shrinkage of EPS as a result of dehydration created more free pores inside the crust layer, causing the evaporation rate of the subcrust layer to accelerate. This may help explain the higher and stagewise evaporation rate change of cyanobacterial crusts observed in previous studies.71
The results revealed that filamentous structures extended from the communal sheaths of cyanobacterial filaments and connected the trichomes within BSCs to the surface. Based on the fact that these structures were connected to the communal sheath, stained in a similar manner, and inflated to a comparable degree after hydration as the sheaths, it is very likely that these structures are also made of EPSs. After hydration, these structures appeared to become tunnel shaped. Because the trichomes were observed to migrate through these structures, the rates of these migrating trichomes could be translated to approximately 0.3 μm s−1. This is the same magnitude as the 0.4–0.7 μm s−1 reported from unobstructed trichomes.6 For comparison, the migration velocity of trichomes of Microcoleus chthonoplastes decreased from 0.7 μm s−1 when unobstructed to only 0.08 μm s−1 inside viscous medium.72
These EPS tunnels are possibly the evacuated sheaths left by the retreated trichome bundles after the preceding hydration-desiccation events, as sheath leftovers have been observed at the surface of the BSC after wet incubation and desiccation.28,29,32 Also, when wetted, the diameters of these tunnel structures corresponded well to the filaments that they were connected to. The mechanisms involved in the formation of the multi-trichomous filament structure are still under debate, although it has been postulated to be the result of fragmented trichomes gliding parallel to each other during the reproduction cycle, which stretches the original sheath.73 The presence of negatively charged (e.g., sulfate and uronic acids) groups within the EPS polysaccharides allows the chelation of multivalent metal ions, which may have helped mucilaginous EPSs secreted by cyanobacteria to consolidate into a sheath or other, firmer structures through crosslinking (i.e., gelation).74,75 M. vaginatus submerged in water has been shown to be embedded in amorphous mucilage instead of a firm sheath.76 Also, the sheaths of M. vaginatus were found to be firmer in limestone-derived soil compared to sandy soils, which was suspected to be caused by the incorporation of the dissolved solids into the sheath, in particular calcium.30 It is thus also possible that the tunnels were formed from the EPSs secreted by the gliding trichomes during the wet phase and consolidated during the drying phase, as evaporative drying elevated the concentrations of multivalent metal cations. Although dehydration caused these tunnels to collapse, they did not merge into a solid column, showing that they are indeed firm, tube-like structures and not amorphous.
The EPS tunnels, which can be considered a form of bio-pore, functioned as straightforward passageways to and from the surface of BSCs for the migrating trichomes during wetting and drying, respectively. Their existence might also have enhanced the motility of cyanobacteria and reduced the cost of their migration by providing a ready-to-use substrate made of EPSs.77,78,79,80,81,82 Another possible role of these tunnels is the establishment of water gradients around the trichomes, which have been shown to control the direction of M. vaginatus migration.28,29 Packed sand particles conduct and hold free water as a result of capillary effects; however, this creates channels with a binary status of wet or dry rather than water content gradients on the pore scale and can be rapidly saturated or emptied.83 On the other hand, sheaths of M. vaginatus filaments can hold water up to 12 times their own weight.84,85,86,87 As a result of their water-holding capability and relatively low hydraulic conductivity, during the initial stages of wetting and drying, water content gradients may form within the EPS continuum (i.e., EPS tunnel sheath), providing the trichomes with a directional cue. This could promote the collective response of the trichomes to changes in water availability.88,89
The general effects of EPS on BSC hydraulic conductivity are inhibitive, and the accumulation of EPSs in topsoil can generate surface runoffs.16,17,18 However, from the perspective of M. vaginatus, the tunnel-like EPS structures could have functioned as water conduits during the initial wetting stage and in the case of short, low-volume precipitation events. Because of their greater dimensions compared to the effective hydraulic radii of the BSC pore network and their hygroscopic property, the EPS tunnels might have promoted the transfer of water directly and swiftly to the trichomes inside the BSCs. In addition, they may assist in breaking the capillary barriers that exist within the BSC matrix.11,38,90 The existence of EPSs could impede soil water evaporation during the initial drying stage.71 On the filament scale, the bundle-forming behavior of M. vaginatus in BSC has been suggested to reduce the rate of water loss of the trichomes during desiccation, buffering the abrupt change in water availability.23 Because the natural desiccation process of BSCs starts from the surface, during drying, the surface opening of these EPS tunnels could rapidly seal as a result of EPS shrinkage, thus further promoting the water retention capabilities of the cyanobacteria, leading to their dominance in hyperarid environments, or in locations where water availability is severely reduced.20,48,65,85,86,91 Also, in this respect, cyanobacterial BSCs may be better prepared (i.e., buffered) for the more frequent wetting-drying cycles due to a higher frequency of low-volume precipitation events as a result of climate change, which could induce significant mortality in BSC mosses.92
Spreading migration of individual trichomes fixes particles and expands crust structure
The trichomes of M. vaginatus in the communal sheath could spread after reaching the open ends of the sheath, as observed in both the present and previous studies.20,76,93 In the present study, this phenomenon was observed in BSC after the simulated particle burial and protracted wet incubation, both under the controlled experimental condition and in crust samples placed inside the greenhouse and wetted under rainy conditions (Figure S6C). It might be that lattices with “free” surfaces were also required in order for the trichome to spread, i.e., the sponge and the packed glass beads in the present study, as the spread was not observed on smooth, continuous, and wet surfaces. The EPSs that already existed on the BSC surface at the time of the simulated burial appeared to bind the beads only loosely, if at all, contrary to the previous hypothesis.94 This is possibly because, at this time, although some beads were in contact with the EPSs, the contact area was limited due to the shape of the beads and the surface roughness of the BSCs, and the trichome did not have the time to migrate into the deposited layer. In the case of extended wet incubation, trichomes spread and migrated along the surface of the glass beads; besides trichome wrapping, EPS was also secreted to fit the contour of the beads.6,72,77,78,79,80,95 This would create a sufficient contact area to generate enough coherent forces, which could be sufficient to hold the particles in place even after the trichomes moved away.30 Although most wetting events are relatively short in the temperate deserts, they do experience week-long wetting during the snow melt and occasional hour-long rainfall events, and it is likely that the expansion of cyanobacterial BSCs occurs mainly during these relatively long wetting periods.43,44,47,96
A lack of significant increase in the biomaterial-to-particle ratio indicates that significant growth did not occur during the entire wet incubation period. This suggests that the spreading migration of trichomes was the major contributor to the observed increase in the BSC surface coverage by the biomaterials. This was further confirmed by the observation that after protracted wet incubation, most of the trichomes in the original BSC were translocated into the newly deposited glass bead layer, leaving evacuated sheaths behind. It has been postulated that the dispersion of M. vaginatus during the lateral expansion of BSCs most likely relies on the movement of individual trichomes instead of the trichomes moving as bundles.33 One previous study had observed networks made of what were likely individual M. vaginatus trichomes in BSCs from the same region and suggested that individual trichomes act as the constructors of the aggregate structure in BSCs.20 The results from the present study supported and connected all these hypotheses, showing that the spreading and upward migration of individual trichomes were responsible for the fixation of newly deposited particles and the expansion of the BSC structure. As a result of the active migrational response of cyanobacteria, they are able to form, maintain, and expand the crust structure in environments where frequent and heavy sand burial occurs. Also, unlike lichens or mosses, which rely solely on growth/reproduction to expand, motile filamentous cyanobacteria can stabilize unconsolidated substrates and form the crust structure much more rapidly, although it is less resistant to erosion.97,98 This was demonstrated by the formation of a crust-like matrix within 8 h in a wet incubated mixture of crushed cyanobacterial crust and free-flowing sand (Figure S9). As a result, disrupted cyanobacterial crusts would recover faster compared to lichen and moss crusts, as long as the disturbances did not remove or deactivate the organisms.99
Conclusion
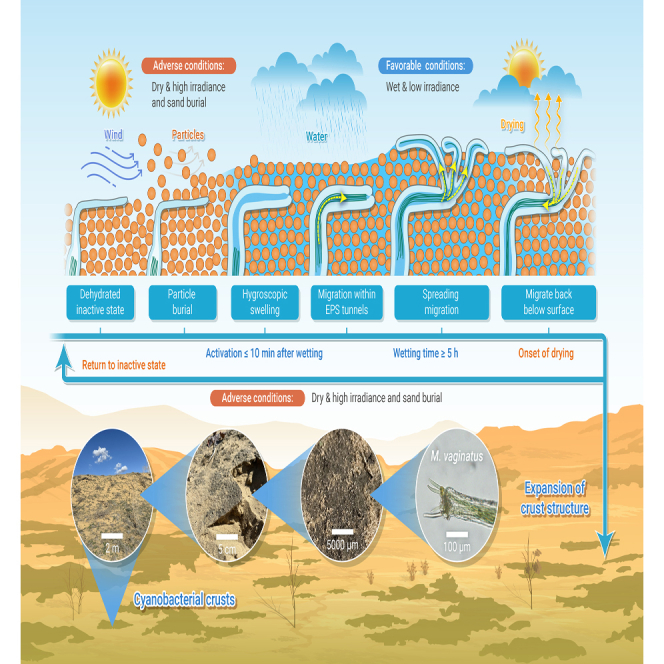
The present study visualized and quantitatively analyzed the structural changes and cyanobacterial migration inside BSCs in response to changes in water availability and particle burial. Hydration-induced hygroscopic swelling of cyanobacterial biomaterials dramatically decreased porosity and significantly increased pore-network complexity. However, the presence of EPSs may not necessarily hinder the water supply to the cyanobacteria within the BSCs but rather enhance it. Because EPS tunnels extend from the communal sheath of M. vaginatus filaments to the surface of the BSC, which not only serve as passageways for the migrating trichomes but could also potentially conduct water to the trichomes, a short wetting-drying event was enough to activate the migration of cyanobacteria but not sufficient to achieve their expansion. It was also confirmed that under prolonged wetting and particle burial, the spreading migration of individual trichomes was predominantly responsible for the fixation of deposited particles and the expansion of the BSC structure. Combining the observations made in the present and previous studies, the migration of bundle-forming cyanobacteria in BSCs in response to hydration/dehydration and particle burial is summarized in Figure 7. The present study not only visually sheds light on the internal biological and structural responses of cyanobacterial BSCs to one of the most important environmental factors in arid regions but also highlights the importance of promoting migration in restorative biotechnologies utilizing cyanobacterial BSCs. The results showcased the importance of the microscopic structure of cyanobacterial origin within BSCs, which likely also holds true for BSCs dominated by M. vaginatus or other bundle-forming cyanobacteria in arid regions around the globe. Future studies should focus on connecting the missing links, e.g., the formation process of the EPS tunnels and trichome bundles, exploring in detail the hydrological properties of the EPS tunnels as well as their possible implications in soil hydraulic and nutrient-exchanging processes. Also, from an applicational perspective, efficient methods that promote the spreading of trichomes in cyanobacteria-based land surface stabilization efforts will have to be developed.
Figure 7.

Schematic illustration depicting responses of bundle-forming cyanobacteria in biological soil crusts
Reponses to hydration/dehydration and the expansion of biological soil crust (BSC) structure as a result of the spreading migration of cyanobacterial trichomes after wetting and particle burial. Red solid arrows and dashed arrows with text indicate the observations made in the present study and postulated responses based on literature/field observations, respectively.
Resource availability
Materials availability
No material was generated in the present study.
Data and code availability
All data are available in the main text or the supplemental information. The raw image data and the segmentation models are available upon request.
Funding and acknowledgments
The authors thank Prof. Dr. Olaf Hellwich and Prof. Dr. Hongwei Zheng for their insightful comments and input. This study was supported by the Leading Talents in Sci-Technological Innovation Project of “Tianshan Talent” Training Plan of the Xinjiang Uygur Autonomous Region (2022TSYCLJ0058); the Youth Talent Training Program of Xinjiang Institute of Ecology and Geography, Chinese Academy of Sciences (E328010701); and the “Tianshan Talent” Training Program (2023TSYCCX0089). The funders had no role in study design, data collection and analysis, decision to publish, or preparation of the manuscript.
Author contributions
Conceptualization, T.L., Y.Z., and M.M.; methodology, T.L., X.Z., and H.Y.; investigation, T.L., Y. Fang, and Y. Fan; visualization, T.L. and Y. Fan; writing – original draft, T.L.; writing – review & editing, T.L., Y.Z., and M.M. All authors contributed to the manuscript and approved the final version.
Declaration of interests
The authors declare no conflicts of interest.
Published Online: May 12, 2025
Footnotes
Supplemental information can be found online at https://doi.org/10.1016/j.xinn.2025.100947.
Supplemental information
References
- 1.Belnap J., Weber B., Büdel B. In: Biological Soil Crusts: An Organizing Principle in Drylands. Weber B., Büdel B., Belnap J., editors. Springer International Publishing; 2016. Biological soil crusts as an organizing principle in drylands; pp. 3–13. [DOI] [Google Scholar]
- 2.Garcia-Pichel F. The microbiology of biological soil crusts. Annu. Rev. Microbiol. 2023;77:149–171. doi: 10.1146/annurev-micro-032521-015202. [DOI] [PubMed] [Google Scholar]
- 3.Rodriguez-Caballero E., Belnap J., Büdel B., et al. Dryland photoautotrophic soil surface communities endangered by global change. Nat. Geosci. 2018;11:185–189. doi: 10.1038/s41561-018-0072-1. [DOI] [Google Scholar]
- 4.Beraldi-Campesi H., Garcia-Pichel F. The biogenicity of modern terrestrial roll-up structures and its significance for ancient life on land. Geobiology. 2011;9:10–23. doi: 10.1111/j.1472-4669.2010.00258.x. [DOI] [PubMed] [Google Scholar]
- 5.Beraldi-Campesi H., Farmer J.D., Garcia-Pichel F. Modern terrestrial sedimentary biostructures and their fossil analogs in mesoproterozoic subaerial deposits. Palaios. 2014;29:45–54. doi: 10.2110/palo.2013.084. [DOI] [Google Scholar]
- 6.Campbell S.E. Soil stabilization by a prokaryotic desert crust: Implications for Precambrian land biota. Orig. Life. 1979;9:335–348. doi: 10.1007/BF00926826. [DOI] [PubMed] [Google Scholar]
- 7.Beraldi-Campesi H., Hartnett H.E., Anbar A., et al. Effect of biological soil crusts on soil elemental concentrations: implications for biogeochemistry and as traceable biosignatures of ancient life on land. Geobiology. 2009;7:348–359. doi: 10.1111/j.1472-4669.2009.00204.x. [DOI] [PubMed] [Google Scholar]
- 8.Belnap J., Gillette D.A. Vulnerability of desert biological soil crusts to wind erosion: the influences of crust development, soil texture, and disturbance. J. Arid Environ. 1998;39:133–142. doi: 10.1006/jare.1998.0388. [DOI] [Google Scholar]
- 9.Zheng Y., Xu M., Zhao J., et al. Effects of inoculated Microcoleus vaginatus on the structure and function of biological soil crusts of desert. Biol. Fertil. Soils. 2011;47:473–480. doi: 10.1007/s00374-010-0521-5. [DOI] [Google Scholar]
- 10.Büdel B., Dulić T., Darienko T., et al. In: Biological Soil Crusts: An Organizing Principle in Drylands. Weber B., Büdel B., Belnap J., editors. Springer International Publishing; 2016. Cyanobacteria and Algae of Biological Soil Crusts; pp. 55–80. [DOI] [Google Scholar]
- 11.Rossi F., Potrafka R.M., Pichel F.G., et al. The role of the exopolysaccharides in enhancing hydraulic conductivity of biological soil crusts. Soil Biol. Biochem. 2012;46:33–40. doi: 10.1016/j.soilbio.2011.10.016. [DOI] [Google Scholar]
- 12.Baldauf S., Cantón Y., Tietjen B. Biocrusts intensify water redistribution and improve water availability to dryland vegetation: insights from a spatially-explicit ecohydrological model. Front. Microbiol. 2023;14:1179291. doi: 10.3389/fmicb.2023.1179291. [DOI] [PMC free article] [PubMed] [Google Scholar]
- 13.Kuske C.R., Yeager C.M., Johnson S., et al. Response and resilience of soil biocrust bacterial communities to chronic physical disturbance in arid shrublands. ISME J. 2012;6:886–897. doi: 10.1038/ismej.2011.153. [DOI] [PMC free article] [PubMed] [Google Scholar]
- 14.Sergio V.A.A.G.S., Nelson C., Barger N.N., et al. Microbial nursery production of high quality biological soil crust biomass for restoration of degraded dryland soils. Appl. Environ. Microbiol. 2017;83:e02179-16. doi: 10.1128/AEM.02179-16. [DOI] [PMC free article] [PubMed] [Google Scholar]
- 15.Garcia-Pichel F., Wojciechowski M.F. The evolution of a capacity to build supra-cellular ropes enabled filamentous cyanobacteria to colonize highly erodible substrates. PLoS One. 2009;4 doi: 10.1371/journal.pone.0007801. [DOI] [PMC free article] [PubMed] [Google Scholar]
- 16.Kidron G.J., Ying W., Starinsky A., et al. Drought effect on biocrust resilience: High-speed winds result in crust burial and crust rupture and flaking. Sci. Total Environ. 2017;579:848–859. doi: 10.1016/j.scitotenv.2016.11.016. [DOI] [PubMed] [Google Scholar]
- 17.Kidron G.J., Lichner L., Fischer T., et al. Mechanisms for biocrust-modulated runoff generation – A review. Earth Sci. Rev. 2022;231 doi: 10.1016/j.earscirev.2022.104100. [DOI] [Google Scholar]
- 18.Kidron G.J., Wang Y., Herzberg M. Exopolysaccharides may increase biocrust rigidity and induce runoff generation. J. Hydrol. 2020;588 doi: 10.1016/j.jhydrol.2020.125081. [DOI] [Google Scholar]
- 19.Malam Issa O., Défarge C., Trichet J., et al. Microbiotic soil crusts in the Sahel of Western Niger and their influence on soil porosity and water dynamics. Catena. 2009;77:48–55. doi: 10.1016/j.catena.2008.12.013. [DOI] [Google Scholar]
- 20.Xiao J., Lan S., Farías M.E., et al. The living forms of Microcoleus vaginatus and their contributions to the aggregate structure of biocrusts. FEMS Microbiol. Ecol. 2023;99:fiad040. doi: 10.1093/femsec/fiad040. [DOI] [PubMed] [Google Scholar]
- 21.Nelson C., Dadi P., Shah D.D., et al. Spatial organization of a soil cyanobacterium and its cyanosphere through GABA/Glu signaling to optimize mutualistic nitrogen fixation. ISME J. 2024;18:wrad029. doi: 10.1093/ismejo/wrad029. [DOI] [PMC free article] [PubMed] [Google Scholar]
- 22.Rajeev L., da Rocha U.N., Klitgord N., et al. Dynamic cyanobacterial response to hydration and dehydration in a desert biological soil crust. ISME J. 2013;7:2178–2191. doi: 10.1038/ismej.2013.83. [DOI] [PMC free article] [PubMed] [Google Scholar]
- 23.Couradeau E., Felde V.J.M.N.L., Parkinson D., et al. In Situ X-Ray tomography imaging of soil water and cyanobacteria from biological soil crusts undergoing desiccation. Front. Environ. Sci. 2018;6 doi: 10.3389/fenvs.2018.00065. [DOI] [Google Scholar]
- 24.Fernandes V.M.C., Machado de Lima N.M., Roush D., et al. Exposure to predicted precipitation patterns decreases population size and alters community structure of cyanobacteria in biological soil crusts from the Chihuahuan Desert. Environ. Microbiol. 2018;20:259–269. doi: 10.1111/1462-2920.13983. [DOI] [PubMed] [Google Scholar]
- 25.Adessi A., Cruz de Carvalho R., De Philippis R., et al. Microbial extracellular polymeric substances improve water retention in dryland biological soil crusts. Soil Biol. Biochem. 2018;116:67–69. doi: 10.1016/j.soilbio.2017.10.002. [DOI] [Google Scholar]
- 26.Garcia-Pichel F., Belnap J. Microenvironments and microscale productivity of cyanobacterial desert crusts. J. Phycol. 1996;32:774–782. doi: 10.1111/j.0022-3646.1996.00774.x. [DOI] [Google Scholar]
- 27.Scherer S., Ernst A., Chen T.-W., et al. Rewetting of drought-resistant blue-green algae: Time course of water uptake and reappearance of respiration, photosynthesis, and nitrogen fixation. Oecologia. 1984;62:418–423. doi: 10.1007/BF00384277. [DOI] [PubMed] [Google Scholar]
- 28.Garcia-Pichel F., Pringault O. Cyanobacteria track water in desert soils. Nature. 2001;413:380–381. doi: 10.1038/35096640. [DOI] [PubMed] [Google Scholar]
- 29.Pringault O., Garcia-Pichel F. Hydrotaxis of cyanobacteria in desert crusts. Microb. Ecol. 2004;47:366–373. doi: 10.1007/s00248-002-0107-3. [DOI] [PubMed] [Google Scholar]
- 30.Belnap J., Gardner J.S. Soil microstructure in soils of the Colorado Plateau: The role of the cyanobacterium Microcoleus vaginatus. Great Basin Nat. 1993;53:40–47. [Google Scholar]
- 31.Rao B., Liu Y., Lan S., et al. Effects of sand burial stress on the early developments of cyanobacterial crusts in the field. Eur. J. Soil Biol. 2012;48:48–55. doi: 10.1016/j.ejsobi.2011.07.009. [DOI] [Google Scholar]
- 32.Scott B., Zaloumis J., Garcia-Pichel F. Aeolian dust deposition as a driver of cyanobacterial community structure in biological soil crusts. Soil Biol. Biochem. 2025;202 doi: 10.1016/j.soilbio.2024.109654. [DOI] [Google Scholar]
- 33.Sorochkina K., Velasco Ayuso S., Garcia-Pichel F. Establishing rates of lateral expansion of cyanobacterial biological soil crusts for optimal restoration. Plant Soil. 2018;429:199–211. doi: 10.1007/s11104-018-3695-5. [DOI] [Google Scholar]
- 34.Withers P.J., Bouman C., Carmignato S., et al. X-ray computed tomography. Nat. Rev. Methods Primers. 2021;1:18. doi: 10.1038/s43586-021-00015-4. [DOI] [Google Scholar]
- 35.Menon M., Yuan Q., Jia X., et al. Assessment of physical and hydrological properties of biological soil crusts using X-ray microtomography and modeling. J. Hydrol. 2011;397:47–54. doi: 10.1016/j.jhydrol.2010.11.021. [DOI] [Google Scholar]
- 36.Kratz A.M., Maier S., Weber J., et al. Reactive nitrogen hotspots related to microscale heterogeneity in biological soil crusts. Environ. Sci. Technol. 2022;56:11865–11877. doi: 10.1021/acs.est.2c02207. [DOI] [PMC free article] [PubMed] [Google Scholar]
- 37.Raanan H., Felde V.J.M.N.L., Peth S., et al. Three-dimensional structure and cyanobacterial activity within a desert biological soil crust. Environ. Microbiol. 2016;18:372–383. doi: 10.1111/1462-2920.12859. [DOI] [PubMed] [Google Scholar]
- 38.Felde V.J.M.N.L., Peth S., Uteau-Puschmann D., et al. Soil microstructure as an under-explored feature of biological soil crust hydrological properties: case study from the NW Negev Desert. Biodivers. Conserv. 2014;23:1687–1708. doi: 10.1007/s10531-014-0693-7. [DOI] [Google Scholar]
- 39.Rawson S.D., Maksimcuka J., Withers P.J., et al. X-ray computed tomography in life sciences. BMC Biol. 2020;18:21. doi: 10.1186/s12915-020-0753-2. [DOI] [PMC free article] [PubMed] [Google Scholar]
- 40.Peth S., Chenu C., Leblond N., et al. Localization of soil organic matter in soil aggregates using synchrotron-based X-ray microtomography. Soil Biol. Biochem. 2014;78:189–194. doi: 10.1016/j.soilbio.2014.07.024. [DOI] [Google Scholar]
- 41.Ian H., Witten E.F., Hall M.A., et al. Data Mining. 4th Edition. Morgan Kaufmann; 2016. Appendix B - The WEKA workbench; pp. 553–571. [Google Scholar]
- 42.Schindelin J., Arganda-Carreras I., Frise E., et al. Fiji: an open-source platform for biological-image analysis. Nat. Methods. 2012;9:676–682. doi: 10.1038/nmeth.2019. [DOI] [PMC free article] [PubMed] [Google Scholar]
- 43.Chen R., Yin B., Yang W., et al. Mapping the successional stages of biological soil crusts at 3-m resolution in the Gurbantunggut Desert, China through hydration-induced spectral response. Remote Sensing of Environment. 2024;310 doi: 10.1016/j.rse.2024.114230. [DOI] [Google Scholar]
- 44.Chen R., Tan X., Zhang Y., et al. Monitoring rainfall events in desert areas using the spectral response of biological soil crusts to hydration: Evidence from the Gurbantunggut Desert, China. Remote Sensing of Environment. 2023;286 doi: 10.1016/j.rse.2022.113448. [DOI] [Google Scholar]
- 45.Zhou X., Tao Y., Yin B., et al. Nitrogen pools in soil covered by biological soil crusts of different successional stages in a temperate desert in Central Asia. Geoderma. 2020;366 doi: 10.1016/j.geoderma.2019.114166. [DOI] [Google Scholar]
- 46.Qian Y., Wu Z., Zhao R., et al. Vegetation patterns and species—environment relationships in the Gurbantunggut Desert of China. J. Geogr. Sci. 2008;18:400–414. doi: 10.1007/s11442-008-0400-2. [DOI] [Google Scholar]
- 47.Zhang Y.M., Chen J., Wang L., et al. The spatial distribution patterns of biological soil crusts in the Gurbantunggut Desert, Northern Xinjiang, China. J. Arid Environ. 2007;68:599–610. doi: 10.1016/j.jaridenv.2006.06.012. [DOI] [Google Scholar]
- 48.Zhang B., Zhang Y., Downing A., et al. Distribution and composition of cyanobacteria and microalgae associated with biological soil crusts in the Gurbantunggut Desert, China. Arid Land Res. Manag. 2011;25:275–293. doi: 10.1080/15324982.2011.565858. [DOI] [Google Scholar]
- 49.Arganda-Carreras I., Kaynig V., Rueden C., et al. Trainable Weka Segmentation: a machine learning tool for microscopy pixel classification. Bioinformatics. 2017;33:2424–2426. doi: 10.1093/bioinformatics/btx180. [DOI] [PubMed] [Google Scholar]
- 50.Ollion J., Cochennec J., Loll F., et al. TANGO: a generic tool for high-throughput 3D image analysis for studying nuclear organization. Bioinformatics. 2013;29:1840–1841. doi: 10.1093/bioinformatics/btt276. [DOI] [PMC free article] [PubMed] [Google Scholar]
- 51.Polder G., Hovens H.L.E., Zweers H. In: Proceedings of the ImageJ User and Developer. Tudor H., Jahnen A., Moll C., editors. Luxembourg Institute of Science and Technology; 2010. Measuring shoot length of submerged aquatic plants using graph analysis; pp. 172–177. [Google Scholar]
- 52.Arganda-Carreras I., Fernández-González R., Muñoz-Barrutia A., et al. 3D reconstruction of histological sections: Application to mammary gland tissue. Microsc. Res. Tech. 2010;73:1019–1029. doi: 10.1002/jemt.20829. [DOI] [PubMed] [Google Scholar]
- 53.Lee T.C., Kashyap R.L., Chu C.N. Building skeleton models via 3-D medial surface axis thinning algorithms. CVGIP Graph. Models Image Process. 1994;56:462–478. doi: 10.1006/cgip.1994.1042. [DOI] [Google Scholar]
- 54.Al-Raoush R.I., Madhoun I.T. TORT3D: A MATLAB code to compute geometric tortuosity from 3D images of unconsolidated porous media. Powder Technol. 2017;320:99–107. doi: 10.1016/j.powtec.2017.06.066. [DOI] [Google Scholar]
- 55.Lawrence T.J., Carr S.J., Manning A.J., et al. A novel 3D volumetric method for directly quantifying porosity and pore space morphology in flocculated suspended sediments. MethodsX. 2023;10 doi: 10.1016/j.mex.2022.101975. [DOI] [PMC free article] [PubMed] [Google Scholar]
- 56.Lebron I., Schaap M.G., Suarez D.L. Saturated hydraulic conductivity prediction from microscopic pore geometry measurements and neural network analysis. Water Resour. Res. 1999;35:3149–3158. doi: 10.1029/1999WR900195. [DOI] [Google Scholar]
- 57.Schmid B., Schindelin J., Cardona A., et al. A high-level 3D visualization API for Java and ImageJ. BMC Bioinf. 2010;11:274. doi: 10.1186/1471-2105-11-274. [DOI] [PMC free article] [PubMed] [Google Scholar]
- 58.Alavarse A.C., Frachini E.C.G., da Silva R.L.C.G., et al. Crosslinkers for polysaccharides and proteins: Synthesis conditions, mechanisms, and crosslinking efficiency, a review. Int. J. Biol. Macromol. 2022;202:558–596. doi: 10.1016/j.ijbiomac.2022.01.029. [DOI] [PubMed] [Google Scholar]
- 59.Watson M.L. Staining of tissue sections for electron microscopy with heavy metals: II. Application of solutions containing lead and barium. J. Biophys. Biochem. Cytol. 1958;4:727–730. doi: 10.1083/jcb.4.6.727. [DOI] [PMC free article] [PubMed] [Google Scholar]
- 60.Gaillard B.D.E., Thompson N.S., Morak A.J. The interaction of polysaccharides with iodine: Part I. Investigation of the general nature of the reaction. Carbohydr. Res. 1969;11:509–519. doi: 10.1016/S0008-6215(00)81259-8. [DOI] [Google Scholar]
- 61.Pereira S., Zille A., Micheletti E., et al. Complexity of cyanobacterial exopolysaccharides: composition, structures, inducing factors and putative genes involved in their biosynthesis and assembly. FEMS Microbiol. Rev. 2009;33:917–941. doi: 10.1111/j.1574-6976.2009.00183.x. [DOI] [PubMed] [Google Scholar]
- 62.De Philippis R., Vincenzini M. Exocellular polysaccharides from cyanobacteria and their possible applications. FEMS Microbiol. Rev. 1998;22:151–175. doi: 10.1111/j.1574-6976.1998.tb00365.x. [DOI] [Google Scholar]
- 63.Nishanth S., Bharti A., Gupta H., et al. In: Microbial and Natural Macromolecules. Das S., Dash H.R., editors. Academic Press; 2021. Cyanobacterial extracellular polymeric substances (EPS): Biosynthesis and their potential applications; pp. 349–369. [DOI] [Google Scholar]
- 64.Oliveira H. R. J.M., Reis R.L. In: Polysaccharides of Microbial Origin: Biomedical Applications. Joaquim H.R., Oliveira M., Reis R.L., editors. Springer; Cham: 2020. Cyanobacterial extracellular polymeric substances (EPS) pp. 139–165. [DOI] [Google Scholar]
- 65.Belnap J. The potential roles of biological soil crusts in dryland hydrologic cycles. Hydrol. Process. 2006;20:3159–3178. doi: 10.1002/hyp.6325. [DOI] [Google Scholar]
- 66.Sun F., Xiao B., Kidron G.J., et al. Insights about biocrust effects on soil gas transport and aeration in drylands: Permeability, diffusivity, and their connection to hydraulic conductivity. Geoderma. 2022;427 doi: 10.1016/j.geoderma.2022.116137. [DOI] [Google Scholar]
- 67.Bouazza A., Gates W.P., Ranjith P.G. Hydraulic conductivity of biopolymer-treated silty sand. Geotechnique. 2009;59:71–72. doi: 10.1680/geot.2007.00137. [DOI] [Google Scholar]
- 68.Durrell L.W., Shields L.M. Characteristics of Soil Algae Relating to Crust Formation. Trans. Am. Microsc. Soc. 1961;80:73–79. doi: 10.2307/3223709. [DOI] [Google Scholar]
- 69.Kidron G.J., Yaalon D.H., Vonshak A. Two causes for runoff initiation on microbiotic crusts: hydrophobicity and pore clogging. Soil Sci. 1999;164:18–27. doi: 10.1097/00010694-199901000-00004. [DOI] [Google Scholar]
- 70.Brock T.D. Effect of water potential on a microcoleus (cyanophyceae) from a desert crust. J. Phycol. 1975;11:316–320. doi: 10.1111/j.1529-8817.1975.tb02786.x. [DOI] [Google Scholar]
- 71.Kidron G.J., Fischer T., Xiao B. The ambivalent effect of biocrusts on evaporation: Can the contradictory conclusions be explained? A review. Geoderma. 2022;416 doi: 10.1016/j.geoderma.2022.115805. [DOI] [Google Scholar]
- 72.Whale G.F., Walsby A.E. Motility of the cyanobacterium Microcoleus chthonoplastes in mud. Br. Phycol. J. 1984;19:117–123. doi: 10.1080/00071618400650121. [DOI] [Google Scholar]
- 73.Seong-Joo L., Golubic S. Multi-trichomous cyanobacterial microfossils from the Mesoproterozoic Gaoyuzhuang Formation, China: Paleoecological and taxonomic implications. Lethaia. 1998;31:169–184. doi: 10.1111/j.1502-3931.1998.tb00505.x. [DOI] [PubMed] [Google Scholar]
- 74.Cuellar-Bermudez S.P., Bleus D., Mees M.A., et al. Isolation, purification, and metal-induced gelation of released polysaccharides from spent culture medium of Arthrospira. Algal Res. 2023;70 doi: 10.1016/j.algal.2023.103010. [DOI] [Google Scholar]
- 75.Nakagawa M., Takamura Y., Yagi O. Isolation and characterization of the slime from a cyanobacterium, Microcystis aeruginosa K-3A. Agric. Biol. Chem. 1987;51:329–337. doi: 10.1080/00021369.1987.10868065. [DOI] [Google Scholar]
- 76.Drouet F. Gomont's Ecophenes of the Blue-Green Alga, Microcoleus vaginatus (Oscillatoriaceae) Proc. Acad. Nat. Sci. Phila. 1962;114:191–205. [Google Scholar]
- 77.Halfen L.N., Castenholz R.W. Gliding in a blue–green alga: a possible mechanism. Nature. 1970;225:1163–1165. doi: 10.1038/2251163a0. [DOI] [PubMed] [Google Scholar]
- 78.Hoiczyk E. Gliding motility in cyanobacteria: observations and possible explanations. Arch. Microbiol. 2000;174:11–17. doi: 10.1007/s002030000187. [DOI] [PubMed] [Google Scholar]
- 79.McBride M.J. Bacterial gliding motility: Multiple mechanisms for cell movement over surfaces. Annu. Rev. Microbiol. 2001;55:49–75. doi: 10.1146/annurev.micro.55.1.49. [DOI] [PubMed] [Google Scholar]
- 80.Hoiczyk E., Baumeister W. The junctional pore complex, a prokaryotic secretion organelle, is the molecular motor underlying gliding motility in cyanobacteria. Curr. Biol. 1998;8:1161–1168. doi: 10.1016/S0960-9822(07)00487-3. [DOI] [PubMed] [Google Scholar]
- 81.Häder D.-P., Hoiczyk E. In: Algal Cell Motility. Melkonian M., editor. Springer US; 1992. Gliding motility; pp. 1–38. [DOI] [Google Scholar]
- 82.Wilde A., Mullineaux C.W. Motility in cyanobacteria: polysaccharide tracks and Type IV pilus motors. Mol. Microbiol. 2015;98:998–1001. doi: 10.1111/mmi.13242. [DOI] [PubMed] [Google Scholar]
- 83.Abdallah A.M. The effect of hydrogel particle size on water retention properties and availability under water stress. Int. Soil Water Conserv. Res. 2019;7:275–285. doi: 10.1016/j.iswcr.2019.05.001. [DOI] [Google Scholar]
- 84.Caiola M.G., Billi D., Friedmann E.I. Effect of desiccation on envelopes of the cyanobacterium Chroococcidiopsis sp (Chroococcales) Eur. J. Phycol. 1996;31:97–105. doi: 10.1080/09670269600651251. [DOI] [Google Scholar]
- 85.Mazor G., Kidron G.J., Vonshak A., et al. The role of cyanobacterial exopolysaccharides in structuring desert microbial crusts. FEMS Microbiol. Ecol. 1996;21:121–130. doi: 10.1111/j.1574-6941.1996.tb00339.x. [DOI] [Google Scholar]
- 86.Madsen M.A., Semerdzhiev S., Twigg J.D., et al. Environmental modulation of exopolysaccharide production in the cyanobacterium Synechocystis 6803. Appl. Microbiol. Biotechnol. 2023;107:6121–6134. doi: 10.1007/s00253-023-12697-9. [DOI] [PMC free article] [PubMed] [Google Scholar]
- 87.Colica G., Li H., Rossi F., et al. Microbial secreted exopolysaccharides affect the hydrological behavior of induced biological soil crusts in desert sandy soils. Soil Biol. Biochem. 2014;68:62–70. doi: 10.1016/j.soilbio.2013.09.017. [DOI] [Google Scholar]
- 88.Burriesci M., Bhaya D. Tracking phototactic responses and modeling motility of Synechocystis sp. strain PCC6803. J. Photochem. Photobiol., B. 2008;91:77–86. doi: 10.1016/j.jphotobiol.2008.01.012. [DOI] [PubMed] [Google Scholar]
- 89.Varuni P., Menon S.N., Menon G.I. Phototaxis as a collective phenomenon in cyanobacterial colonies. Sci. Rep. 2017;7 doi: 10.1038/s41598-017-18160-w. [DOI] [PMC free article] [PubMed] [Google Scholar]
- 90.Al-Maktoumi A., Al-Ismaily S., Kacimov A., et al. Soil substrate as a cascade of capillary barriers for conserving water in a desert environment: lessons learned from arid nature. J. Arid Land. 2014;6:690–703. doi: 10.1007/s40333-014-0068-7. [DOI] [Google Scholar]
- 91.Liu Y., Lu J., Ma Y., et al. Spatial differentiation of microbial communities in Gurbantunggut Desert algae crust, Xinjiang, China. Acta Ecol. Sin. 2023;43:1923–1935. doi: 10.5846/stxb202112313720. [DOI] [Google Scholar]
- 92.Reed S.C., Coe K.K., Sparks J.P., et al. Changes to dryland rainfall result in rapid moss mortality and altered soil fertility. Nat. Clim. Chang. 2012;2:752–755. doi: 10.1038/nclimate1596. [DOI] [Google Scholar]
- 93.Mehda S., Muñoz-Martín M.Á., Oustani M., et al. Microenvironmental conditions drive the differential cyanobacterial community composition of biocrusts from the Sahara Desert. Microorganisms. 2021;9:487. doi: 10.3390/microorganisms9030487. [DOI] [PMC free article] [PubMed] [Google Scholar]
- 94.Garcia-Pichel F., Felde V.J.M.N.L., Drahorad S.L., et al. In: Biological Soil Crusts: An Organizing Principle in Drylands. Weber B., Büdel B., Belnap J., editors. Springer International Publishing; 2016. Microstructure and weathering processes within biological soil crusts; pp. 237–255. [DOI] [Google Scholar]
- 95.Khayatan B., Meeks J.C., Risser D.D. Evidence that a modified type IV pilus-like system powers gliding motility and polysaccharide secretion in filamentous cyanobacteria. Mol. Microbiol. 2015;98:1021–1036. doi: 10.1111/mmi.13205. [DOI] [PubMed] [Google Scholar]
- 96.Zhang J., Zhang Y.-m., Downing A., et al. The influence of biological soil crusts on dew deposition in Gurbantunggut Desert, Northwestern China. J. Hydrol. 2009;379:220–228. doi: 10.1016/j.jhydrol.2009.09.053. [DOI] [Google Scholar]
- 97.Wang X.Z.Y., Zhang W., Xu X., et al. Comparison of erodibility on four types biological crusts in Gurbantunggut Desert from wind tunnel experiments. Journal of Arid Land Studies. 2009;19:237–240. [Google Scholar]
- 98.Faist A.M., Herrick J.E., Belnap J., et al. Biological soil crust and disturbance controls on surface hydrology in a semi-arid ecosystem. Ecosphere. 2017;8 doi: 10.1002/ecs2.1691. [DOI] [Google Scholar]
- 99.Belnap J. Surface disturbances: Their role in accelerating desertification. Environ. Monit. Assess. 1995;37:39–57. doi: 10.1007/BF00546879. [DOI] [PubMed] [Google Scholar]
Associated Data
This section collects any data citations, data availability statements, or supplementary materials included in this article.
Supplementary Materials
Data Availability Statement
All data are available in the main text or the supplemental information. The raw image data and the segmentation models are available upon request.