Abstract
The TCL1 gene at 14q32.1 is involved in chromosomal translocations and inversions in mature T cell leukemias. These leukemias are classified either as T prolymphocytic leukemias, which occur very late in life, or as T chronic lymphocytic leukemias, which often arise in patients with ataxia telangiectasia (AT) at a young age. In transgenic animals, the deregulated expression of TCL1 leads to mature T cell leukemia, demonstrating the role of TCL1 in the initiation of malignant transformation in T cell neoplasia. Expression of high levels of Tcl1 have also been found in a variety of human tumor-derived B cell lines ranging from pre-B cell to mature B cell. Here we describe the phenotype of transgenic mice, Eμ-TCL1, established with TCL1 under the control of a VH promoter-IgH-Eμ enhancer to target TCL1 expression to immature and mature B cells. Flow cytometric analysis reveals a markedly expanded CD5+ population in the peritoneal cavity of Eμ-TCL1 mice starting at 2 mo of age that becomes evident in the spleen by 3–5 mo and in the bone marrow by 5–8 mo. Analysis of Ig gene rearrangements indicates monoclonality or oligoclonality in these populations, suggesting a preneoplastic expansion of CD5+ B cell clones, with the elder mice eventually developing a chronic lymphocytic leukemia (CLL)-like disorder resembling human B-CLL. Our findings provide an animal model for CLL, the most common human leukemia, and demonstrate that deregulation of the Tcl1 pathway plays a crucial role in CLL pathogenesis.
B cell chronic lymphocytic leukemia (B-CLL) is the most common leukemia in the Western world, with as many as 10,000 new cases reported each year in the United States (1, 2). Characteristically, B-CLL is a disease of elderly people resulting from the progressive accumulation of a leukemic clone that may be derived from a normal CD5+ B lymphocyte (3). B-CLL has a consistent association with CD5 expression (3), and, although there is still a debate on the role and significance of CD5 expression on B cells, it remains reasonable to consider CD5+ B cells as the normal counterpart of B-CLL (4, 5).
Human hematopoietic malignancies are often caused by chromosome translocations involving either T cell receptor (TCR) or immunoglobulin loci (6). These chromosome breakpoints juxtapose enhancer elements of TCR and Ig loci to protooncogenes, leading to tumor initiation through oncogene deregulation (7, 8). We have previously identified the T cell leukemia-1 (TCL1) gene at chromosome 14q32.1 (9) that is commonly activated by inversions or translocations that juxtapose it to a T cell receptor locus at 14q11 or 7q35. TCL1 has been found to be overexpressed in sporadic and ataxia telangiectasia-associated T prolymphocytic leukemia (T-PLL; refs. 10 and 11). We also provided evidence that TCL1 is a bona fide oncogene, developing a transgenic mouse model where ectopic expression driven by the lck promoter in the T cell compartment results in the development of mature T cell leukemias after a long latency period, in a pattern closely resembling human mature T cell leukemia (12). In normal T cells, TCL1 is expressed only at the very early CD4−/CD8− double negative stage, whereas more mature T cells lack TCL1 expression (9). In the B cell lineage, the product of the TCL1 gene, Tcl1, has been found in pre-B cells, surface IgM-expressing virgin B cells, mantle cells and germinal center B cells, whereas it is down-regulated at later stages of B cell differentiation, i.e., plasma cells (9). Interestingly, high levels of Tcl1 have been found in a broad variety of human tumor-derived B cell lines and in many cases of B cell neoplasias (13, 14). To elucidate the role of TCL1 in B cell development and in B cell neoplasia, we generated transgenic mice under the control of a promoter and enhancer whose activity specifically targets expression of the transgene to the B cell compartment (15). Here, we show that Eμ-TCL1 transgenic mice develop a disease resembling human CLL. The mice develop at first a preleukemic state evident in blood, spleen, bone marrow, peritoneal cavity, and peripheral lymphoid tissue, developing later a frank leukemia with all characteristics of CLL. These findings strongly indicate that TCL1 and/or other gene(s) in the TCL1 pathway are responsible for the initiation of human CLL.
Materials and Methods
Eμ-TCL1 Transgenic Mice.
A 350-bp fragment possessing the entire human TCL1 coding region was generated by PCR and cloned into the EcoRV and SalI sites of the pBSVE6BK (pEμ) plasmid containing a mouse VH promoter (V186.2) and the IgH-μ enhancer along with the 3′ untranslated region and the poly(A) site of the human β-globin gene. The construct containing TCL1 free from vector sequences was injected into fertilized oocytes from B6C3 animals. Mice were screened for the presence of the transgene by Southern blot analysis on tail DNAs digested with XhoI. Blots were hybridized with the same BssHII DNA fragment used to inject the oocytes. Two founders were obtained (F3 and F10) and bred. Transgenic heterozygote mice issued from these founders were studied and compared with nontransgenic siblings raised in identical conditions. Genotyping was performed on tail DNAs by PCR.
Western Blot Analysis.
Cell proteins were extracted with Nonidet P-40 lysis buffer, quantified by using the BCA kit (Pierce), size fractionated on 15% Tris-glycine SDS/PAGE gels, and electrotransferred onto nitrocellulose (Immobilon-P, Millipore). The membrane was blocked overnight in 10% nonfat dried milk in PBST (7.6 g/liter NaCl/0.7 g/liter Na2PO4/0.2 g/liter KPO4/0.1% Tween 20). Expression was detected with the MoAb 27D6/20 for human Tcl1 protein (14) according to ECL protocol (Amersham Pharmacia). Ponceau-S staining was used to verify equivalent protein loading.
Cell Preparations.
Bone marrow cells were isolated by flushing the cavities of the femur and tibia with ice cold staining medium (Deficient RPMI, Irvine Scientific) containing 10 mM Hepes, 0.1% NaN3, and 3% FCS. Spleens were dissociated in staining medium between two frosted slides. Peritoneal cells were removed by injection of 10 ml of staining medium into the peritoneal cavity followed by withdrawal of the peritoneal exudates. Erythrocytes were lysed by brief treatment with 0.165 M ammonium chloride, and the cells then washed in staining medium.
WBC Preparation.
Blood was collected from the cavernous sinus with a capillary tube in a tube coated with EDTA (Becton Dickinson). Smears were immediately prepared and stained with May-Grünwald-Giemsa. Full counts were made on a cell counter (Beckman). For immunofluorescence staining, cells were treated with 0.165 M ammonium chloride to eliminate red cells and washed in staining medium.
Immunofluorescence Analysis and Cell Sorting.
Single cell suspensions of the indicated cell type were prepared and stained for surface expression as described previously (16). Cells were stained for surface expression of IgM and CD5, then fixed and permeabilized by using the Fix&Perm kit (Caltag, South San Francisco, CA) and stained for expression of Tcl1 by using a phycoerythrin-labeled anti-Tcl1 monoclonal antibody 27D6/20 (14). IgM/CD5 distributions were gated as indicated, and histograms of the Tcl1 staining were determined. Plots were done with flowjo software (Tree Star, San Carlos, CA). Exclusion of propidium iodide (PI) was used to eliminate dead cells, and samples shown were also gated by forward and right angle scatter to exclude non-lymphoid cells and debris. Flow cytometry and sorting were done on a dual-laser dye-laser FACStarPlus equipped with detectors for five color immunofluorescence. Samples were held on ice during sorting. Preparation of labeled reagents has been described previously (17).
Analysis of VH11 Sequences.
Cells were stained for IgM/CD5 expression, and 1 × 10⁵ IgM+CD5+ cells were sorted directly into lysis/denaturation buffer. RNA and cDNA were prepared as described previously (18), and a VH11-Cμ fragment was amplified by using a VH11 leader and Cμ primer using Pfu polymerase and PCR. The amplified material was cloned by using the TOPO TA cloning kit (Invitrogen) following the manufacturer's instruction. Colonies with insert were expanded, and plasmid DNA was isolated and sequenced by using an Applied Biosystems ABI 377 automated sequencer as described previously (19).
Cell Cycle.
For PI staining, 105 cells were sorted directly into ice cold 95% ethanol, and nuclei were pelleted and then resuspended in PI-labeling solution (1 mg/ml RNase A/20 μg/ml PI in PBS containing 0.01% Nonidet P-40). After 30 min, cells were analyzed for PI fluorescence on a FACScan (Becton Dickinson) using doublet discrimination gating.
Cell Proliferation.
Mice were injected i.p. with BrdUrd in PBS at a dose of 50 μg per gram of body weight daily for 4 days. Mice were killed, and cells were stained for expression of IgM and CD5, then sorted to obtain the indicated populations. Cells (5 × 10⁵) were fixed and permeabilized, then treated with DNase in acid buffer and stained with an anti-BrdUrd monoclonal antibody labeled with FITC. Samples were analyzed on a FACScan for BrdUrd staining.
IgH Gene Rearrangement.
Southern blots of DNA digested with EcoRI and StuI were prepared following conventional methods and hybridized with a 32P-labeled DNA probe PJ3 representing the JH4 region of the IgH locus. The probe was synthesized by PCR amplification from mouse DNA with primers F2 (5′-TGTGGTGACATTAGAACTGAAGTA-3′) and R1 (5′-CAAGATTAGTCTGCAATGCTCAGA-3′).
Long Distance Inverse PCR (LDI-PCR).
High molecular weight DNA was digested with StuI. LDI-PCR was performed as described (20). Primers designed within the mouse JH and IGH enhancer regions were used to amplify the purified DNA, and the gel-purified products were ligated into pCR 2.1-TOPO vector (Invitrogen). Plasmids containing the correct size insert were sequenced by using an ABI 377 automated sequencer and compared with the GenBank database by using the blast program (http://www.ncbi.nlm.nih.gov/blast/). The VH, DH and JH segments were identified by using the GenBank database.
Histopathology and Immunohistochemistry.
Animals were autopsied, and tissues were fixed in 10% buffered formalin and embedded in paraffin. Sections were stained with hematoxylin and eosin according to standard protocols and analyzed by mouse pathologists (University of Missouri, Research Animal Diagnostic Laboratory). Immunohistochemistry was performed on representative sections. For the dewaxing step, the sections were heated for 1 h at 55°C, followed by rehydration steps through a graded ethanol series and distilled water, immersed in PBS, and then treated with 0.1% trypsin solution in Tris buffer for 30 min at 37°C. Endogenous peroxidase was blocked with 10% normal serum. The 27D6/20 MoAb specific for recombinant human Tcl1 protein (14) was used as a primary antibody, and the immunohistochemical staining was performed by using streptavidin-biotin peroxidase labeling method according to the manufacturer's instructions (Histomouse-SP kit, Zymed).
Results and Discussion
Production and Characterization of Eμ-TCL1 Transgenic Mice.
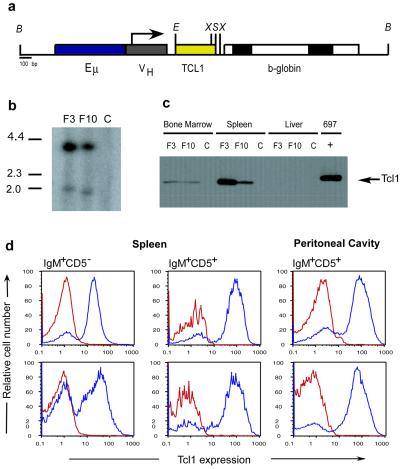
We generated transgenic mice in which the expression of TCL1 was under the control of a VH promoter-IgH-Eμ enhancer whose activity specifically targets expression of the transgene to immature and mature B cells (ref. 15; Fig. 1a). Two transgenic founders on a B6C3 background, designated F3 and F10, were generated and bred to establish two transgenic lines (Fig. 1b). The expression of the transgene in each was evaluated by Western blot of total protein extracted from spleen, bone marrow, and liver of 3-mo-old mice, by using a monoclonal antibody specific for human Tcl1 protein (14). The two transgenic lines expressed Tcl1 in spleen and bone marrow whereas no expression was detected in liver or in nontransgenic siblings (Fig. 1c). We also used fluorescence-activated cell sorting (FACS) to investigate the distribution of TCL1 expression on gated subsets of B cells derived from spleen and peritoneal cavity of 3-mo-old mice, in both transgenic lines. The combination of cell surface markers with intracellular detection of Tcl1 revealed a high level of TCL1 expression in normal resting B cells, with a 2.5-fold higher level in the CD5+ cells (Fig. 1d).
Figure 1.
Production of Eμ-TCL1 transgenic (TG) mice. (a) Schematic representation of the construct used to generate the mice. Restriction sites: X, XhoI; S, SalI; E, EcoRV; B, BssHII. (b) Southern blot analysis of DNA isolated from the tails of the first TG progeny for both founders and non-TG control. (c) Immunoblot analysis on protein extracts from TG (F3 and F10) and non-TG (C = control) mouse tissues. 697 = pre-B leukemic cell line 697, which expresses high levels of Tcl1 protein (9). (d) TCL1 expression on gate subsets of splenic B cells. (Upper) Refers to the F3 progeny. (Lower) F10 progeny (Blue = TG, Red = non-TG).
The Immunophenotyping of Eμ-TCL1 Transgenic Mice Reveals an Expanded CD5+/IgM+ Population.
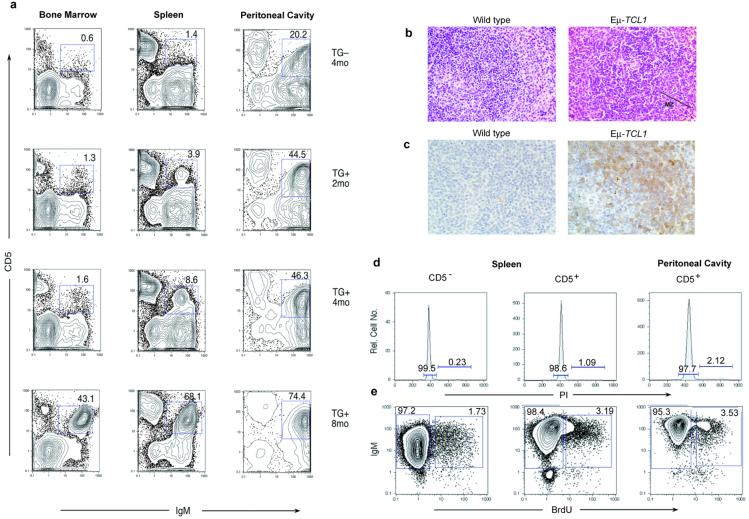
We used flow cytometry to monitor the immunophenotypic profile of peripheral blood lymphocytes from mice of these two lines between 1 and 9 mo of age. The results revealed the presence of a B220low/IgM+ population that was detected starting at 6 mo of age in 100% of the transgenic mice, but in the absence of any sign of disease. A normal distribution of B cell populations was found in the nontransgenic controls. T cell subsets were normal and identical between transgenic animals and their littermate controls. Eμ-TCL1 transgenic mice were further characterized to identify the B cell subsets affected. The expanded B220low/IgM+ population was found to coexpress CD5 and Mac-1/CD11b. This result suggested that the Eμ-TCL1 transgenic mice had an expanded population of CD5+/B1 cells in peripheral blood, where such cells are normally infrequent (21). In mice, CD5 is a pan-T cell surface marker that is also present on a subset of B lymphocytes that appear during fetal/neonatal time, and whose development appears quite distinct from the majority of B cells (19, 22). CD5 is also frequently expressed on murine B cell lymphomas and leukemias (23, 24). We analyzed a group of animals at 2, 4, and 8 mo of age to assess the expansion of the CD5+/IgM+ population in bone marrow, spleen, and peritoneal cavity. FACS analysis revealed a phenotypically homogeneous population markedly expanded in the peritoneal cavity of the transgenic mice starting at 2 mo of age (44%) that became evident in spleen (8.6%) by 4 mo and bone marrow by 8 mo (43%; Fig. 2a).
Figure 2.
Characterization of Eμ-TCL1 mice. (a) Correlation between IgM and CD5 expression in single cell suspensions from bone marrow, spleen, and peritoneal cavity in TG animals and a non-TG littermate. (b) Hematoxylin and eosin-stained spleen of mouse showing an expanded MZ in Εμ-TCL1 animals. (c) Immunodetection of Tcl1 protein in lymphoid cells of the MZ. (d) Cell cycle analysis on IgM and CD5 subsets of cells by PI-labeling. (e) Cell proliferation analysis by BrdUrd incorporation.
Histological and Immunocytochemical Analysis of the Transgenic Mice.
Eight-month-old transgenic mice presented a slightly enlarged spleen, 1.5-fold compared with littermate controls and moreover a very high cellularity in the peritoneal cavity, ranging between 50- to 100-fold increased. Histopathology of enlarged spleens of Eμ-TCL1 mice demonstrated a consistent increase in the size of the marginal zone (MZ; Fig. 2b). Immunostaining of lymphoid cells in the white pulp of the spleen showed Tcl1 staining more intensely in the MZ. As expected, no immunostaining was observed in the spleen of littermate controls (Fig. 2c). Interestingly, the anatomical localization of the expanded CD5+ cells was in the MZ whereas they did not have the precise phenotype of typical MZ B cells, i.e., not CD21-high but rather CD21-low, like a normal CD5+ B cell (25). The histological analysis of other tissues from the same animals—including thymus, liver, kidney, and intestine—did not reveal any pathologic alteration (not shown).
Analysis of VH11 Sequences in the Expanded CD5+ Population.
The increased frequency of CD5+ B cells in these transgenic mice could represent either the induction of CD5 expression on cells normally not CD5+ or else the expansion of normally generated CD5+ B cells. To distinguish between alternatives, we investigated V gene usage in the expanded cell population. Recurrent expression of certain VHVL combinations is a characteristic feature of normal and neoplastic CD5+ B cells (19, 26). Using antibodies specific for variable regions, we found that one of these combinations, VH11Vk9, was repeatedly represented at 5–10% in the expanded CD5+ B cell population in all mice analyzed, similar to the frequency seen in normal CD5+ B cells (data not shown). Furthermore, analysis of VH11 sequences from sorted IgM+/CD5+ cells from the spleen of a 3-mo-old transgenic mouse (Table 1) showed normal VH11 rearrangements, with low levels of N-region addition, typical of CD5+ B cells that are predominantly generated fetally/neonatally when levels of TdT are low (27).
Table 1.
Analysis of VH11 sequences in CD5+ splenic B cells
| Seq. ID | VH11 | N | DH | N | JH | DH | JH |
|---|---|---|---|---|---|---|---|
| TCL1-4 | TGTATGAGA | TA | TAGTAGC | TACTGGTACTTC | DFL16.1 | JH1 | |
| TCL1-11 | TGTATGAGA | TATGGTAAC | TACTGGTACTTC | DSP2.8 | JH1 | ||
| TCL1-17 | TGTATGAGA | TACGGTAGT AGC | TACTGGTACTTC | DFL16.1 | JH1 | ||
| TCL1-42 | TGTATGAGA | TATGGTAAC | TACTGGTACTTC | DSP2.8 | JH1 | ||
| TCL1-44 | TGTATGAGA | TATGGTAACTAC | TACTGGTACTTC | DSP2.1 | JH1 | ||
| TCL1-46 | TGTATGAGA | TACGGTAGTAGC | TACTGGTACTTC | DFL16.1 | JH1 | ||
| TCL1-47 | TGTATGAGA | TATGATGGTTAC | TACTGGTACTTC | DSP2.9 | JH1 | ||
| TCL1-52 | TGTATGAGA | TATAGTAAC | TACTGGTACTTC | DSP2.X | JH1 |
IgM+/CD5+ Populations Are Arrested in the G0/G1 Phase of the Cell Cycle and Do Not Actively Divide.
Chronic lymphocytic leukemia cells are characterized by a low proliferative activity and by the progressive accumulation of clonal B lymphocytes blocked in the early phases (G0/G1) of the cell cycle (28, 29). We investigated the cell cycle distribution and the rate of cell proliferation in spleen and peritoneal cavity of four transgenic mice and four littermate controls at 7 mo of age. Detection of DNA content in replicating cells by PI labeling and analysis of cell proliferation from the distribution of BrdUrd incorporation in IgM+CD5+ sorted populations revealed that most of these cells are not actively cycling in the transgenic mice (Fig. 2 d and e).
IgH Gene Configuration in Transgenic Mice with the Expanded CD5+ Population.
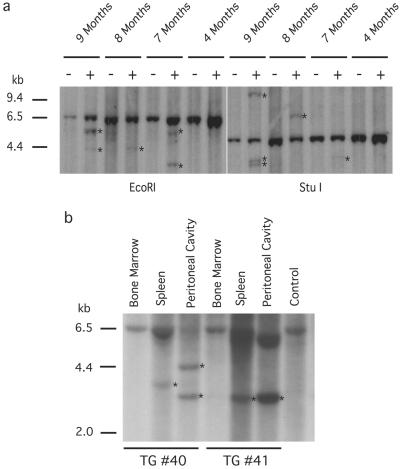
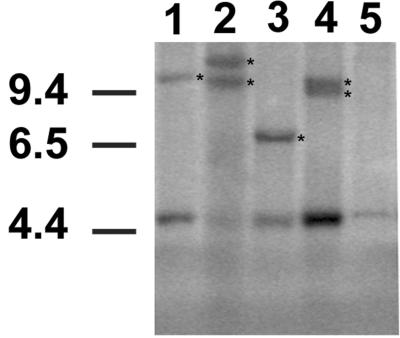
Analysis of Ig gene rearrangement revealed the presence of preleukemic or leukemic clones consistently in Eμ-TCL1 mice over 7 mo of age. No clonality was observed in the youngest transgenics or in nontransgenic mice (Fig. 3a). The detection of clonal JH rearrangements indicated that there could be a clonal expansion without evidence of disease. Further analysis of Ig gene rearrangement in bone marrow, spleen, and peritoneal cavity from 8-mo-old mice with a markedly expanded CD5+/IgM+ population showed an identical size JH band detected in spleen and peritoneal cavity, but not bone marrow (Fig. 3b). The clonal JH band was not always shared between spleen and peritoneal cavity, as for example mouse no. 40 (Fig. 3b) with two independent clonal populations, suggesting multiple independent events in some cases. Clonal rearrangements were subsequently confirmed in some samples by cloning and sequencing the rearranged band by using LDI-PCR (20). Using this approach, the transgenic mice exhibited additional clonal rearrangements, compared with the littermate controls. Table 2 shows sequence data referring to the (+) samples marked as 9m and 8m in Fig. 3a, StuI digested. Some sequences had a low level of N addition, whereas others had a higher level (Table 2), as has been noted in sequence analyses of normal CD5+ B cells (30). The clonal population suggested by Southern blot for the transgenic no. 41 (Fig. 3b) in spleen and peritoneal cavity was also confirmed by LDI-PCR (Table 2).
Figure 3.
Analysis of IgH gene configuration. (a) IgH gene rearrangements were analyzed by Southern blot on EcoRI and StuI-digested splenocyte DNAs. Transgenic mice (+) of 7, 8, and 9 mo show rearranged bands (asterisks). No predominant rearrangement is observed in the youngest mice. Controls (−) are non-TG mice with the genomic 6.5-kb EcoRI and 4.7-kb StuI fragments. (b) Southern blots on DNA isolated from bone marrow, spleen, and peritoneal cavity of TG mice (nos. 40 and 41) with the CD5+/IgM+ expanded population. IgH gene predominant rearrangements were detected in spleen and peritoneal cavity (asterisks). DNA from spleen of non-TG mouse was used as control.
Table 2.
Results of VDJ rearrangements in selected cases of Eμ-TCL1 transgenic mice
| Mouse | VH | DH | JH | VH | DH | JH |
|---|---|---|---|---|---|---|
| 9 m | TACTGTGCCAG A | aATGGTTAC GA | CTATGCTATGGACTAC TGGGGTCAAGGAACCT CAGTCACCGTCTCCTC A | Vox-1 | DSP2.6 | JH4 |
| 9 m | TACTGTGCCAG A | ACGGTAGTA GCcct | CTATGCTATGGACTAC TGGGGTCAAGGAACCT CAGTCACCGTCTCCTC A | Vox-1 | DFL16.1 | JH4 |
| 8 m | GTCTATTACTG T | actccccACTAC GGTAGTAGC ct | CTGGTACTTCGATGTC TGGGGCACAGGGACC ACGGTCACCGTCTCCT CA | V130 | DFL16.1 | JH1 |
| No. 41 PerC | GCAGGAGACA GA | TATGGTTA | CTGGTACTTCGATGTC TGGGGCACAGGGACC ACGGTCACCGTCTCCT CA | NC1-A7 | DSP2.6 | JH1 |
| No. 41 Spleen | GCAGGAGACA GA | TATGGTTA | CTGGTACTTCGATGTC TGGGGCACAGGGACC ACGGTCACCGTCTCCT CA | NC1-A7 | DSP2.6 | JH1 |
Variations from the germ-line sequence are underlined. N regions are in lowercase.
Eμ-TCL1 Mice Developed Lymphocytic Leukemia on Aging.
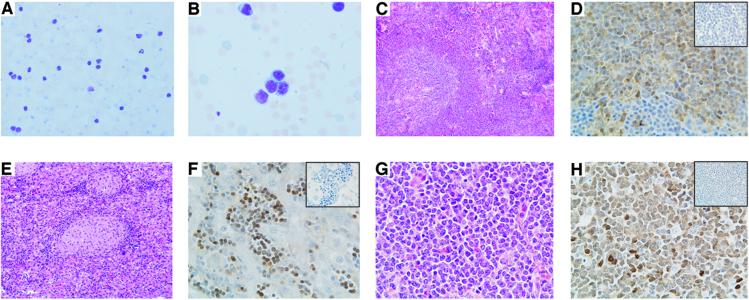
The onset of a frank leukemia in the elderly mice provided further evidence of the establishment of a murine model for B-CLL. All mice around the age of 13–18 mo became visibly ill and presented with enlarged spleens and livers associated with high WBC counts. The weight of the transgenic spleens was between 1.5 g and 2.3 g (normal splenic weight was 0.07 ± 0.01 g), and the mean of the WBC was 180.0 × 10⁶ cells/ml (the mean WBC/ml blood for normal adult mice was 2.8 × 10⁶ cells/ml). In addition, the mice also developed advanced lymphoadenopathy, a hallmark of human CLL. Cytological examination of blood smears showed an increase in circulating lymphocytes, with many of them displaying a clumped nuclear chromatin (Fig. 4 A and B). The predominant cell type was represented by large lymphoid cells, and smudged cells were also present. Histopathological examination demonstrated consistent infiltration of spleen, liver, and lymph nodes by small and large lymphocytes (Fig. 4 C, E, and G). Positive staining for Tcl1 protein was observed primarily in lymphocytes found in these tissues (Fig. 4 D, F, and H), and flow cytometric analysis confirmed the expansion of the CD5+/IgM+ population in all tissues (data not shown). Clonality was shown by Southern blot analysis of DNA isolated from leukemic splenocytes by using the PJ3 probe (Fig. 5). DNA from spleens of littermate controls showed the IgH gene in its germ-line configuration, whereas DNA from leukemic splenocytes presented extra-rearranged bands, indicating the presence of clonal B cell populations.
Figure 4.
Histopathological analysis of the Eμ-TCL1 mice. (A) Blood smear stained with Wright Giemsa showing an increased number of circulating lymphocytes. (B) High magnification of the blood smear. (C) Histology of spleen, liver (E), and cervical lymph node (G) after hematoxylin-eosin staining. (D) Immunodetection of Tcl1 protein in spleen, liver (F), and cervical lymph node (H). (Insets) Negative control in which the primary antibody has been omitted.
Figure 5.
Southern blot analysis of IgH gene rearrangements in leukemias from TG mice. DNAs from leukemic mice and a littermate control were digested with StuI. The strong 4.7-kb bands represent the gene in its germ-line configuration. Clonal rearrangements are indicated by asterisks. Lanes 1 and 2, Leukemic mice from TG line F3; lanes 3 and 4, leukemic mice from TG line F10; lane 5, non-TG mouse.
Conclusions
B-CLL is the most common leukemia in humans, and its pathogenesis is still unknown. Transgenic mice in which we targeted the expression of TCL1 in B cells develop a lymphoproliferative disease closely resembling human CLL. Our data strongly indicate that TCL1 and/or other gene(s) in the TCL1 pathway are responsible for the initiation of human B-CLL. The present findings provide an adequate animal model to investigate the mechanisms underlying the initiation and progression of human B-CLL, and we hope that ultimately this model may aid in the development and test of novel anti CLL therapeutics.
Acknowledgments
We thank A. Shaw for the gift of the expression vector, T. Manser and J. Rothestein for valuable suggestions, D. Remotti for reviewing some spleen sections, J. Letofsky and S. Rattan for expert technical assistance, J. Faust and A. Acosta for the preliminary flow cytometric analysis, and the transgenic mouse facility and the laboratory animal services at the Kimmel Cancer Center. This study was supported by National Institutes of Health grants to R.R.H., by Associazione Italiana Ricerca sul Cancro grants to G.R., and by National Cancer Institute grants to C.M.C.
Abbreviations
- TCL-1
T cell leukemia 1
- B-CLL
B chronic lymphocytic leukemia
- PI
propidium iodide
- LDI-PCR
long distance inverse PCR
- MZ
marginal zone
References
- 1.Rai K, Patel D C. In: Hematology: Basic Principles and Practice. Hoffman R, Banz E J Jr, Shattil S J, editors. New York: Churchill Livingstone; 1995. pp. 1308–1321. [Google Scholar]
- 2.Landis S H, Murray T, Bolden S, Wingo P A. CA Cancer J Clin. 1998;48:6–29. doi: 10.3322/canjclin.48.1.6. [DOI] [PubMed] [Google Scholar]
- 3.Caligaris-Cappio F, Gobbi M, Bofill M, Janossy G. J Exp Med. 1982;155:623–628. doi: 10.1084/jem.155.2.623. [DOI] [PMC free article] [PubMed] [Google Scholar]
- 4.Boumsell L, Bernard A, Lepage V, Degos L, Lemerle J, Dausset J, L. Eur J Immunol. 1978;8:900–904. doi: 10.1002/eji.1830081214. [DOI] [PubMed] [Google Scholar]
- 5.Kantor A B. Immunol Today. 1991;12:389–391. doi: 10.1016/0167-5699(91)90136-H. [DOI] [PubMed] [Google Scholar]
- 6.Croce C M. Cell. 1987;49:155–156. doi: 10.1016/0092-8674(87)90552-6. [DOI] [PubMed] [Google Scholar]
- 7.Dalla-Favera R, Bregni M, Erikson J, Patterson D, Gallo R C, Croce C M. Proc Natl Acad Sci USA. 1982;79:7824–7827. doi: 10.1073/pnas.79.24.7824. [DOI] [PMC free article] [PubMed] [Google Scholar]
- 8.ar-Rushdi A, Nishikura K, Erikson R W, Rovera G, Croce C M. Science. 1983;222:390–393. doi: 10.1126/science.6414084. [DOI] [PubMed] [Google Scholar]
- 9.Virgilio L, Narducci M G, Isobe M, Billips L G, Cooper M D, Croce C M, Russo G. Proc Natl Acad Sci USA. 1994;91:12530–12534. doi: 10.1073/pnas.91.26.12530. [DOI] [PMC free article] [PubMed] [Google Scholar]
- 10.Narducci M G, Stoppacciaro A, Imada K, Uchiyama T, Virgilio L, Lazzeri C, Croce C M, Russo G. Cancer Res. 1997;57:5452–5456. [PubMed] [Google Scholar]
- 11.Thick J, Metacalfe J A, Mak Y-F, Beatty D, Minegishi, Dyer M J S, Lucas G, Taylor A M R. Oncogene. 1996;12:379–386. [PubMed] [Google Scholar]
- 12.Virgilio L, Lazzeri C, Bichi R, Nibu K, Narducci M G, Russo G, Rothstein J L, Croce C M. Proc Natl Acad Sci USA. 1998;95:3885–3889. doi: 10.1073/pnas.95.7.3885. [DOI] [PMC free article] [PubMed] [Google Scholar]
- 13.Takizawa J, Suzuki R, Kuroda H, Utsunomiya A, Kagami Y, Joh T, Aizawa Y, Ueda R, Seto M. Jpn J Cancer Res. 1998;89:712–718. doi: 10.1111/j.1349-7006.1998.tb03275.x. [DOI] [PMC free article] [PubMed] [Google Scholar]
- 14.Narducci M G, Pescarmona E, Lazzeri C, Signoretti S, Lavinia A M, Remotti D, Scala E, Baroni C D, Stoppacciaro A, Croce C M, et al. Cancer Res. 2000;60:2095–2100. [PubMed] [Google Scholar]
- 15.Shaw A C, Swat W, Ferrini R, Davidson L, Alt F W. J Exp Med. 1999;189:123–129. doi: 10.1084/jem.189.1.123. [DOI] [PMC free article] [PubMed] [Google Scholar]
- 16.Hardy R R, Carmack C E, Shinton S A, Kemp J D, Hayakawa K. J Exp Med. 1991;173:1213–1225. doi: 10.1084/jem.173.5.1213. [DOI] [PMC free article] [PubMed] [Google Scholar]
- 17.Hardy R R. In: The Handbook of Experimental Immunology. 4th Ed. Weir D M, Herzenberg L A, Blackwell C C, Herzenberg L A, editors. Edinburgh: Blackwell Scientific; 1986. pp. 31.1–31.12. [Google Scholar]
- 18.Li Y S, Wasserman R, Hayakawa K, Hardy R R. Immunity. 1996;5:527–535. doi: 10.1016/s1074-7613(00)80268-x. [DOI] [PubMed] [Google Scholar]
- 19.Hardy R R, Carmack C E, Li Y S, Hayakawa K. Immunol Rev. 1994;137:91–118. doi: 10.1111/j.1600-065x.1994.tb00660.x. [DOI] [PubMed] [Google Scholar]
- 20.Willis T G, Jadayel D M, Coignet L J A, Abdul-Rauf M, Treleaven J G, Catovsky D, Dyer M J S. Blood. 1997;90:2456–2464. [PubMed] [Google Scholar]
- 21.Kantor A B, Herzenberg L A. Annu Rev Immunol. 1993;11:501–538. doi: 10.1146/annurev.iy.11.040193.002441. [DOI] [PubMed] [Google Scholar]
- 22.Hayakawa K, Hardy R R. Annu Rev Immunol. 1988;6:197–218. doi: 10.1146/annurev.iy.06.040188.001213. [DOI] [PubMed] [Google Scholar]
- 23.Lanier L L, Warner N L, Ledbetter J A, Herzenberg L A. J Exp Med. 1981;153:998–1003. doi: 10.1084/jem.153.4.998. [DOI] [PMC free article] [PubMed] [Google Scholar]
- 24.Phillips J A, Mehta K, Fernandez C, Raveché E S. Cancer Res. 1992;52:437–443. [PubMed] [Google Scholar]
- 25.Chen X, Martin F, Forbush K A, Perlmutter R M, Kearney J F. Int Immunol. 1997;9:27–41. doi: 10.1093/intimm/9.1.27. [DOI] [PubMed] [Google Scholar]
- 26.Pennell C A, Arnold L W, Haughton G, Clarke S H. J Immunol. 1988;141:2788–2796. [PubMed] [Google Scholar]
- 27.Li Y S, Hayakawa K, Hardy R R. J Exp Med. 1993;178:951–960. doi: 10.1084/jem.178.3.951. [DOI] [PMC free article] [PubMed] [Google Scholar]
- 28.Andreeff M, Darzynkiewicz Z, Sharpless T K, Clarkson B D, Melamed M R. Blood. 1980;55:282–293. [PubMed] [Google Scholar]
- 29.Nilsson K. In: Chronic Lymphocytic Leukemia: Scientific Advances & Clinical Development. Cheson B D, editor. New York: Dekker; 1992. pp. 33–45. [Google Scholar]
- 30.Kantor A B, Merrill C E, Herzenberg L A, Hillson J L. J Immunol. 1997;158:1175–1186. [PubMed] [Google Scholar]


