

Abstract
The triple combination modulator therapy (ETI, elexacaftor (ELX), tezacaftor (TEZ), and ivacaftor (IVA)) is a recent advancement for the care of patients with cystic fibrosis. To aid in the development of clinical pharmacokinetics studies of this treatment, we developed a liquid chromatography tandem mass spectrometry (LC-MS/MS) assay for quantifying the component compounds in human plasma and cell lysate. This assay was optimized for small volumes (10 µL), uses stably labeled isotopes of the ETI compounds as internal standards, and employs a simple methanol protein precipitation method. Chromatography was performed on an ACE Excel C18, 2.1 × 50 mm, reversed phase analytical column, using a step or bump isocratic method, with mobile phases consisting of 0.1 % formic acid in water for A, and 0.1 % formic acid in acetonitrile for B. Analyte and internal standard detection was conducted with ESI positive ionization tandem mass spectrometry. The precursor/product transitions (m/z) monitored were 598.0/422.0 for ELX, 521.0/449.0 for TEZ, 393.0/172.0 for IVA, 601.0/422.0 for IS-ELX, 525.0/453.0 for IS-TEZ, and 399.0/178.0 for IS-IVA, respectively. The assay has a dynamic range of 10 to 10,000 ng/mL, with a mean coefficient of determination (r2, mean ± SD) of 0.9970 ± 0.0027 (ELX), 0.9989 ± 0.0004 (TEZ), 0.9981 ± 0.0003 (IVA), regardless of specimen matrix. The mean precision values for all calibration standards ranged from 0.0 to 10.8% (ELX), 0.0 to 6.7 % (TEZ), and 0.2 to 5.6 % (IVA), while the accuracy for calibration standards was within the range of −5.7 to 3.5 % (ELX), −3.2 to 6.0 % (TEZ), and −3.8 to 5.2% (IVA). Validation results demonstrated high accuracy (≤ 7.3, ≤ 9.8, ≤ 10.6 % deviation) and high precision (≤ 11.5, ≤ 6.3, ≤ 11.0 % CV) for the respective ETI quality control samples. This method provides a fully validated assay for ETI quantitation for use in clinical research.
Keywords: Ivacaftor, Tezacaftor, Elexacaftor, Cystic Fibrosis, CFTR, LC-MS/MS
1. Introduction
Genetic variants in the Cystic Fibrosis Transmembrane conductance Regulator gene (CFTR) cause abnormal function of the CFTR ion channel, abnormal secretions in several organs, and limited life span. [1] To ameliorate the ion channel dysfunction caused by CFTR mutations, four small molecule therapies are currently approved in the United States: ivacaftor, a CFTR potentiator, used as monotherapy for a subset of patients with surface localized CFTR channels[2]; ivacaftor/lumacaftor, which adds a CFTR corrector to partially correct the misfolding of the most common mutant, the F508del CFTR protein[3]; ivacaftor/tezacaftor (TI), which introduces a second-generation corrector(4, 5); and ivacaftor/tezacaftor/elexacaftor, or ETI, a triple combination therapy that adds another corrector, which provides a highly effective modulator therapy (HEMT) to ~90% of patients with CF. [4, 5] Therapy with ETI elicits an average ppFEV1 response of approximately 14%.[6] The components of ETI are small molecule compounds; ivacaftor and elexacaftor are highly lipophilic and are optimally absorbed with fat-containing foods, whereas tezacaftor is less affected by food effect.[6–8] All three compounds are highly protein bound (≥99%), to albumin and alpha-1-acid glycoprotein and readily distribute into tissues.[6–8] All three compounds are readily metabolized by the cytochrome P450 (CYP) 3A family of isozymes and are eliminated by biliary excretion in feces.[6–8]
Variation in drug exposure among CF patients, due to altered absorption, metabolism and transport, is well-recognized and known to have a pronounced impact on efficacy and side effects.[9–14] The advent of ETI has created a new era of CF care because of its effectiveness. However, there is still a substantial proportion of patients who do not experience a robust response [4, 5] as well as those who may not tolerate ETI due to side effects.[15–22] There are clinical trial data on the pharmacokinetics of ETI, but no such data during typical clinical use, and no published patient data on altered dosing regimens. Currently, the approved dose is 200mg elexacaftor daily/100mg tezacaftor daily/75mg ivacaftor twice daily for all children and adults ages 6 years and 30 kilograms or above,[6] with adjustments for drug interactions and liver disease only. However, providers implement altered dosing regimens to manage side effects (such as elevated transaminases, headaches, or mental health changes) with published and anecdotally-reported positive clinical outcomes (such as improved lung function and weight gain).[23] Therapeutic drug monitoring (TDM) in plasma and target tissues may be required to optimize dosing and account for inter-individual variability in drug response and/or side effects.
To this end, we have developed and fully validated a liquid chromatography mass spectrometry (LC-MS/MS) analytical method for ETI, similar to our previously reported assay for ivacaftor (and its predominant metabolites, tezacaftor, and lumacaftor[24]) and comparable to other LC-MS/MS assays for the compounds, but with a wider dynamic range for ivacaftor and in a single multiplex assay.[6, 25] This assay is optimized to quantify these compounds from small volumes (10μL) relative to other published quantitation reports.[25, 26] This affords accurate quantitation in specimens from infants and young children or other limited sampling strategies. This assay is well suited for pharmacokinetic studies as it was developed and validated according to the United States Food and Drug Administration (FDA) standards, utilizing internal standards for all three compounds, and having a large dynamic range (10 to 10,000 ng/mL) to better capture concentrations ranges observed during typical clinical use.[6] Pharmacokinetic parameters for these compounds have previously been determined.[6]
2. Materials and Methods
2.1. Reagents
All chemicals used were analytical grade, and all solvents used were optima or certified LC-MS. Acetonitrile (ACN), dimethyl sulfoxide (DMSO), isopropanol (IPA), methanol (MeOH), Water (H2O) and formic acid (FA) were purchased from Fisher Scientific (Fairlawn, NJ). Multiple lots of human plasma, K2 and K3 EDTA, serum, and cellular lysate were purchased from Bioreclamation IVT (Westbury, NY). ELX and TEZ were obtained from Selleck Chemicals (Houston, TX); IVA was obtained from Toronto Research Chemicals (Toronto, ON). Stably labeled isotopes of ELX (Elexacaftor-2H3, ELX-IS) and TEZ (Tezacaftor-2H4, TEZ-IS) served as an internal standards and were obtained from Toronto Research Chemicals (Toronto, ON). The stably labeled isotope of IVA (Ivacaftor-13C6, IVA-IS) was obtained from AlsaChim (Illkirch-Graffenstaden, France). The chemical structures of the compounds are depicted in Figure 1.
Figure 1.

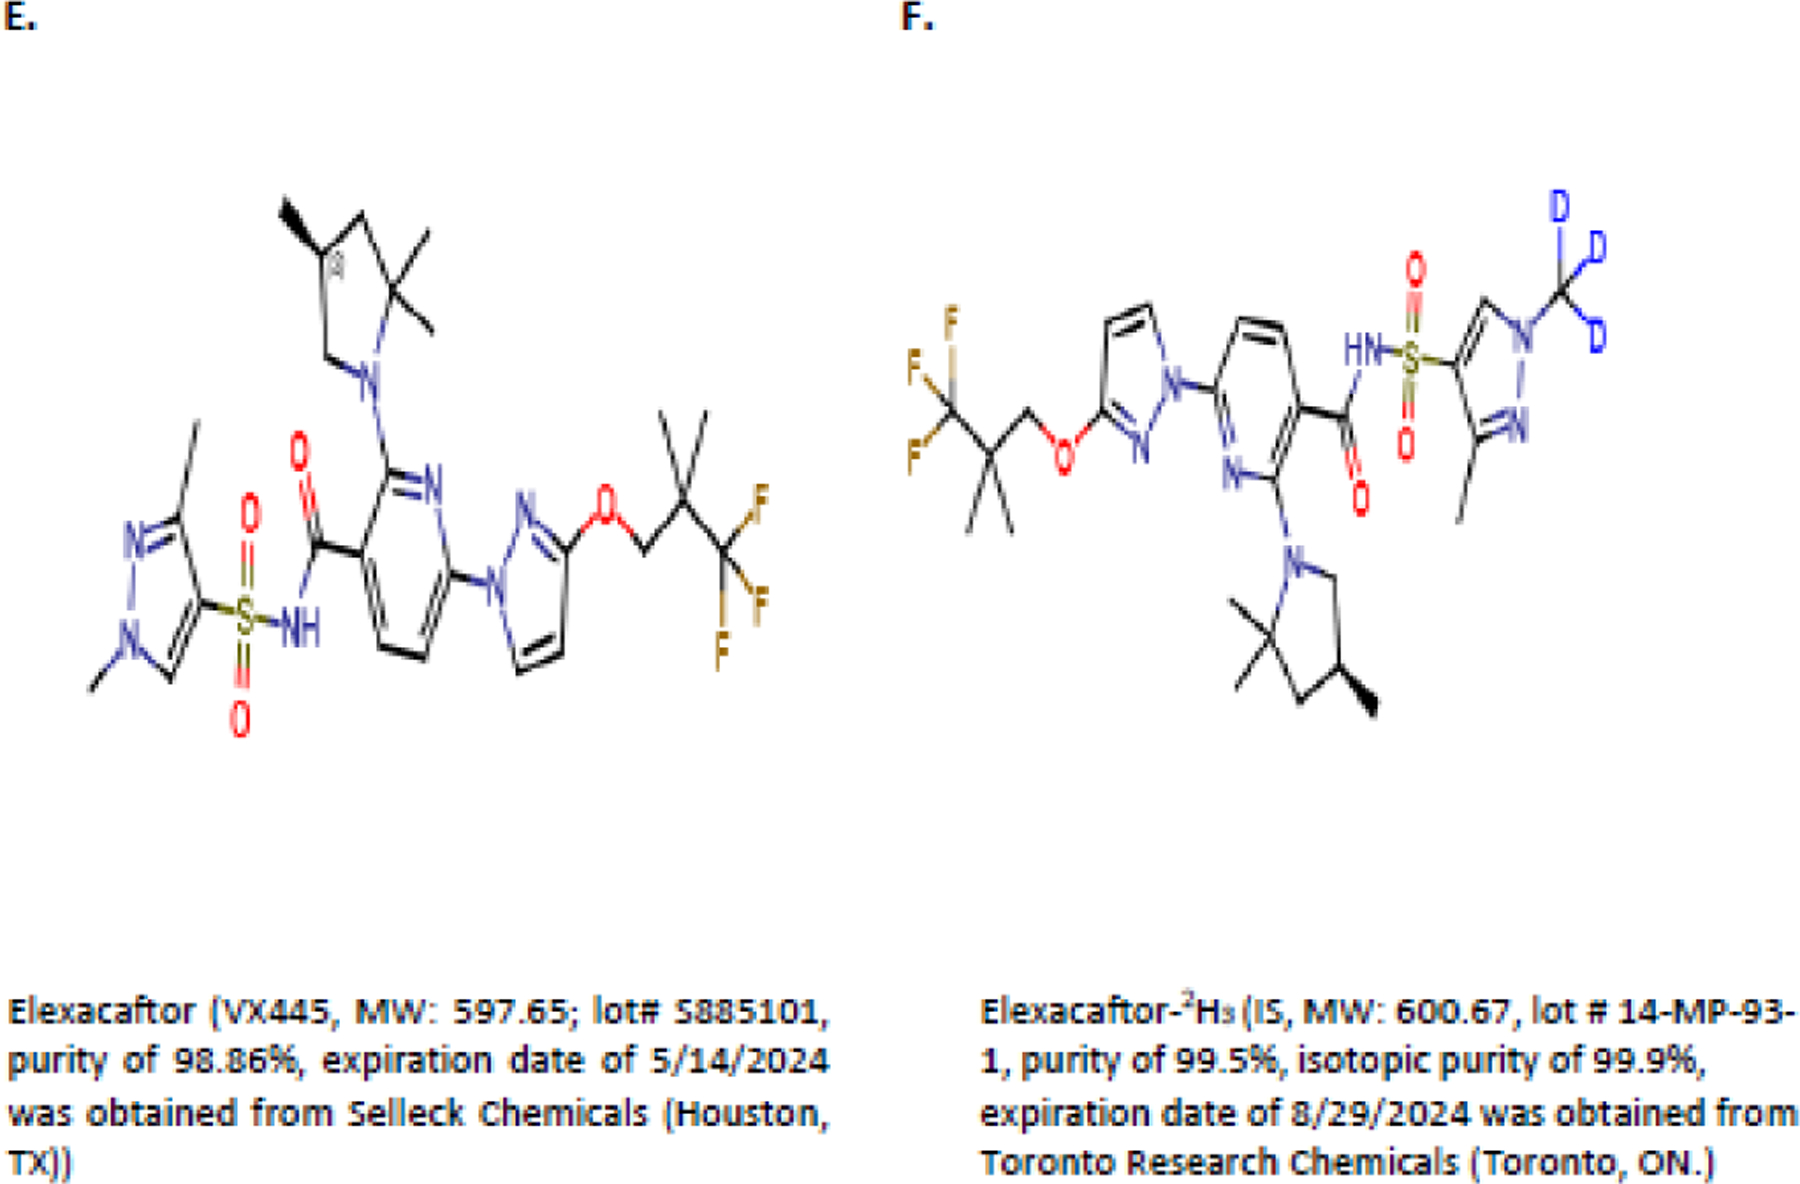
Chemical Structures of (A) Ivacaftor, (B) Ivacaftor-IS, (C) Tezacaftor, (D) Tezacaftor-IS, (E) Elexacaftor, and (F) Elexacaftor-IS
2.2. Instrumentation and Software
An Exion AD Integrated UPLC system (consisting of a controller, 2 AD pumps, a degasser, a cooled autosampler, and a column oven) was coupled to a Sciex QTrap 6500+ mass spectrometer (AB Sciex Instruments, Foster City, CA) used in ESI+ mode. Data acquisition, processing, and analysis were performed with the validated Analyst Software (Version 1.6.3) and the MultiQuant module (Version 3.0.3) that accompanies the instrument. Additional UPLC supplies consisted of a MacMod ACE Excel C18 column (2.1 × 50 mm, 3 µm, MacMod Analytical, Chadds Ford, PA). Other analytical equipment consisted of an analytical micro balance (Mettler Toledo MX5, Fisher Scientific), benchtop micro-centrifuge (Eppendorf 5430, Fisher Scientific), vortex mixer (Vortex Genie 2, Fisher Scientific), and a micro-centrifuge shaker (Vibrax Orbital Shaker, Fisher Scientific).
2.3. HPLC separation and MS-MS detection
Samples were extracted and chromatographically separated with a MacMod ACE Excel C18 column (2.1 × 50 mm, 3 µm, MacMod Analytical, Chadds Ford, PA) utilizing a step or bump isocratic profile at 50°C and at a flow rate of 0.6 mL/min. The mobile phase, composed of 0.1% formic acid in water (A) and 0.1% formic acid in acetonitrile (B), was initially run at 50% B for 1 minute before stepping to 60% B for 1 minute, followed by a step to 70% B for an additional 1 minute, before returning to 50% B for the final 30 seconds to re-equilibrate the column for the next injection. Samples were maintained at 15°C in the autosampler. Detection is accomplished by multiple reaction monitoring (MRM). ELX, TEZ, and IVA and their internal standards were detected using the following transitions for protonated products [M+H]+: 598.0/422.0 for ELX, 521.0/449.0 for TEZ, 393.0/172.0 for IVA, 601.0/422.0 for ELX-IS, 525.0/453.0 for TEZ-IS, and 399.0/178.0 for IVA-IS. The Sciex QTrap 6500+ instrument was operated in ESI+ mode with a source temperature of 600°C and nitrogen being used as the nebulizer, auxiliary, collision, and curtain gas.
2.4. Stock solutions, working solutions, plasma calibration and control samples
Duplicate master stock (MS) solutions for each ETI drug were prepared in DMSO at a concentration of 1 mg/mL, referred to as MSA and MSB solutions, and were compared to verify concentrations. Each MSA solution was further diluted in DMSO to make a series of eight calibration curve working stock solutions (containing all three drugs) at 0.1, 0.2, 1, 5, 10, 50, 90, and 100 µg/mL. The MSB solution was further diluted in DMSO to prepare four quality control (QC) working stock solutions (containing all three drugs) at 0.2, 0.6, 40 and 160 µg/mL. Independent stock solutions of ELX-IS, TEZ-IS, and IVA-IS were also prepared in DMSO at a concentration of 1 mg/mL and subsequently diluted in DMSO to a single 50 µg/mL solution containing all three internal standards. Calibration curves were prepared for each run by diluting the appropriate level of calibration working stock (by 10x) into freshly thawed plasma, or cell lysate, resulting in final concentrations of 10, 20, 100, 500, 1000, 5000, 9000, and 10,000 ng/mL. Bulk QC samples were prepared by the diluting the appropriate level of QC working stock into plasma or cell lysate, with final QC concentrations of 10, 30, 2000, 8000, and 30,000 ng/mL. DMSO solutions, along with 100 µL aliquots of the prepared QCs, were stored at either −80°C or room temperature, respectively.
2.5. Sample preparation
Plasma was collected from patients receiving ETI as part of their clinical care who were enrolled in an ongoing study. Nasal brushings were processed and cells lysed as previously described.[24] Briefly, the inferior turbinate of each nare was brushed using a sterile 5 mm cytobrush (Medical Packaging Corp., Panorama, CA) and immediately placed into a tube of RPMI media on ice. The cells were removed from the brush by agitating through a large bore pipet tip several times, and resuspended as a single-cell suspension. Cells were counted using a hemocytometer, centrifuged, and lysed in NP-40 lysis buffer. Samples were immediately frozen at −80°C until quantitation. ETI and their respective IS were extracted from 10 µL of sample, originating from calibrators, QCs, or unknown (patient) samples, using protein precipitation with 300 µL of methanol containing IS at 10 ng/mL. In order to provide complete and consistent precipitation, all samples were vortexed using an orbital shaker (1500 rpm for 3 min) before centrifugation for 5 min at 10,000 x g. An aliquot of the resulting extract supernatant was transferred to an autosampler vial before injection onto the UPLC-MS/MS for analysis.
2.6. Analytical Method Validation
The validation of this method was similar to other assays from our laboratory[27] based on the May 2018 revision of the FDA Bioanalytical Method Validation publication.[28] Cell lysate from human cells falls under the rare matrices rules from FDA Guidance for Industry[28], which requires a partial or supplemental validation when completing a full validation in a different matrix within the same species. After extraction, the bioanalytical assay for cell lysate is identical to that of plasma.
2.6.1. Accuracy and Precision
Validation runs included two double blank samples (blank plasma without IS), one blank sample (blank plasma with IS only), and eight calibration standards at 10, 20, 100, 500, 1000, 5000, 9000, and 10,000 ng/mL. In addition, replicates (n=6) of each QC sample per run were used for precision and accuracy determinations. Four different QC concentrations were chosen to cover the assay range, the lower limit of quantitation (LLOQ, 10 ng/mL), low at ≤3x LLOQ (30 ng/mL), mid (2000 ng/mL), and high (8000 ng/mL) which is ≥75% of the ULOQ. Precision was calculated as the coefficient of variation (%CV) within a single run (intra-assay) and across three runs (inter-assay), and accuracy as the percentage of deviation between the nominal and calculated concentration. The calibration curve was fit using weighted (1/x2) quadratic regression analysis of the analyte/IS peak area ratio versus the analyte concentration from 10.0–10,000 ng/mL. Concentrations of incurred (unknown) and quality control samples were calculated with the same regression analysis and results are reported in ng/mL of each respective analyte. Assay acceptance criteria were such that calibration curves required an r or r2 ≥0.98, the latter is reported herein. The back-calculated concentrations were required to be within ± 15% (except at the LLOQ where 20% is acceptable) of the nominal concentration, and at least 75% of the calibrators should meet the defined criteria in order for the run to be accepted. Standards not meeting the defined criteria could be rejected from calibration curve fitment, but two sequential points could not be rejected. Concentrations of the QC samples were determined from calibration curves created with each run and across all runs, and each level of concentrations had to be within 15% of the nominal value, except for LLOQ where 20% was accepted.
2.6.2. Anticoagulant Counter-Ion equivalence (K2 vs K3)
To assess the impact of anticoagulant counter-ions and demonstrate the equivalence of K2 and K3EDTA plasma, QCs were prepared using both K2 and K3 EDTA plasma at 5, 30, 2000, and 8000 ng/mL and frozen at −80°C. K2EDTA QCs were extracted and quantitated against a standard curve prepared in K3EDTA plasma and conversely K3EDTA QCs were extracted and quantitated against a standard curve prepared in K2EDTA plasma. The mean, standard deviation, precision and accuracy were calculated from the replicates (n=6) and included as part of the inter-assay precision and accuracy.
2.6.3. Sample dilution and Limited Volume Compensation
The ability to accurately dilute a sample that has a concentration above the ULOQ was examined using a previously prepared and stored diluted quality control (DQC) sample at 24,000 ng/mL, which is 240% of the highest calibrator. The DQC sample was processed using a 5x dilution ratio to assess dilution integrity precision and accuracy. Additionally, the ability to compensate samples for insufficient volume (e.g., pediatric samples) was examined by using a 2 µL partial volume of QC Mid (2,000 ng/mL) plus 8 µL of blank plasma in the extraction solvent. Thus, the overall result is a 5x dilution of the original sample to determine limited sample volume precision and accuracy.
2.6.4. Matrix Effects, Recovery, Process Efficiency, and Selectivity
Matrix effect, recovery, and process efficiency were investigated by comparing ETI concentrations obtained from neat analyte solutions (Set 1), post-extraction spiked plasma samples (Set 2), and pre-extraction spiked plasma samples (Set 3) at low, mid, and high concentrations (30, 2000, and 8000 ng/mL, respectively) across six independent plasma lots. Matrix effect is determined by Set 2/Set 1; recovery is determined by Set 3/Set 2; and process efficiency is determined by Set 3/Set 1, with each ratio multiplied by 100. Assay selectivity was assessed using nine individual sources (lots) of blank plasma or serum, and six individual lots of plasma that were visually lipemic or hemolyzed (≈550 mg/dL). These samples were extracted and analyzed as blank samples without IS. For comparison purposes, aliquots of each matrix lot containing all three ETI drugs were spiked at the LLOQ concentration with IS added. Each matrix source was evaluated for interference with the analyte and IS peaks. Carryover was assessed by comparing the peak area of the double blank immediately following the high standard to the peak area of the LLOQ.
2.7. Analyte stability
Analyte stability was evaluated for various conditions in both solution and plasma preparations. Master stock and working stock solutions were assessed at ambient and −80°C conditions, whereas plasma preparation stability assessments included short and long term storage, freeze-thaw, and post-preparative performance in injection matrix.
2.7.1. Master Stock and Working solution stability
Freshly prepared vs. previously prepared ETI master stock solutions, prepared at 1 mg/mL in DMSO, demonstrated stability for up to 50 days when stored at −80°C. Stability of ETI working solutions, prepared at 0.1, 0.2, 1, 5, 10, 50, 90, and 100 µg/mL in DMSO, was determined to be 41 days when stored at room temperature. Peak areas were used for comparison and the percentage difference was calculated between the fresh and stored solutions.
2.7.2. Plasma stability
Aliquots of each QC (low, mid, and high) were prepared and stored at −80°C in order to mimic ETI patient plasma sample storage. An aliquot of QC low and high were then subjected to a series of freezing and thawing, where samples were placed at room temperature for at least one hour and then returned to the freezer overnight. A total of ten freeze-thaw cycles was completed before replicate samples (n=6) were extracted and compared against freshly thawed QC control samples. Aliquots were also maintained at −80°C for extended periods of time to monitor long-term plasma stability. An aliquot of QC low and high were removed after 324 days and replicates (n=6) were extracted and compared to newly prepared QC control samples of the same concentrations. Plasma sample ambient temperature stability was assessed using QC low and QC high, where plasma samples were maintained at room temperature, with light exposure, for at least 240 hours; to mimic delayed shipment without proper or insufficient dry ice. After ambient storage, replicates (n=6) were extracted and compared to freshly thawed QC control samples.
2.7.3. Post-preparative stability
The ability to re-inject samples following storage in the autosampler was investigated by extracting and running a full validation assay. The unused volume remained in the autosampler for at least 96 hours and all samples were re-analyzed in order to simulate equipment failure. The resulting calibration curves and QC sample values were calculated within each run and between runs (the calibration curve from run 1 was used to calculate sample values from run 2). This experimental design verified the integrity of results obtained after samples sat over a set period of time for both a full run. We also assessed post-preparative stability by removing a single sample from a previously completed run and placing it into a new assay run. This demonstrates the ability to reacquire individual samples across separate runs. These experiments are important for re-analysis of partially obtained data if equipment failed and/or patient sample volumes were inadequate for re-preparation (i.e., some data were obtained on a day 1 and the remaining data acquired on day 4).
2.8. Pilot study of patient samples.
Nine subjects with CF with known genotypes participated in this study after providing written informed consent (IRB F151030001, University of Alabama at Birmingham). Plasma or nasal brushing were collected from patients as previously described [24]. All participants were prescribed CFTR modulators by their clinical providers: combination 100mg tezacaftor/150mg ivacaftor in the morning and ivacaftor 150 mg in the evening (TI) or combination 200mg elexacaftor/100mg tezacaftor/150mg ivacaftor in the morning and ivacaftor 150mg in the evening (ETI). Patients reported adherence with their medication as prescribed by their physician. Blood samples were collected at 9 timepoints over 12 hours (0, 1, 2, 4, 5, 6, 8, 10, and 12 hours) and nasal samples at two timepoints (0 and 2–6h).
3. Results
3.1. Chromatography, detection, and quantitation of ETI
ETI detection was first optimized for the respective compound parent ion using a Q1 single quadrupole mode scan which caused substantial peaks at [M+H]+ for ETI at 598.0, 521.0, or 393.0 m/z, respectively. These values were consistent with the expected molecular ion mass of each drug. Product ion scans revealed dominant ions found at m/z 422.0 (ELX), 449.0 (TEZ, and 172.0 (IVA), which were used to optimize parameters for detection (Table 1). Extraction procedures and instrument conditions were further optimized using ETI spiked plasma samples. Ultimately, a single MRM transition for each drug and internal standard was selected for quantitation (Figure 2).
Table 1.
Summary of MS/MS Parameters Optimized for ELX, TEZ, and IVA Detection
| MS Settings | ||
|---|---|---|
| General | TEM | 500 |
| IS | 5000 | |
| GS1 | 70 | |
| GS2 | 70 | |
| CUR | 30 | |
| CAD | 6 (Low) | |
| EP | 10 | |
|
| ||
| ELX Specific | CE | 35 |
| DP | 250 | |
| CXP | 10 | |
|
| ||
| ELX-IS Specific | CE | 25 |
| DP | 50 | |
| CXP | 5 | |
|
| ||
| TEZ Specific | CE | 40 |
| DP | 150 | |
| CXP | 10 | |
|
| ||
| TEZ-IS Specific | CE | 40 |
| DP | 50 | |
| CXP | 10 | |
|
| ||
| IVA Specific | CE | 40 |
| DP | 150 | |
| CXP | 10 | |
|
| ||
| IVA-IS Specific | CE | 40 |
| DP | 50 | |
| CXP | 10 | |
Figure 2A.
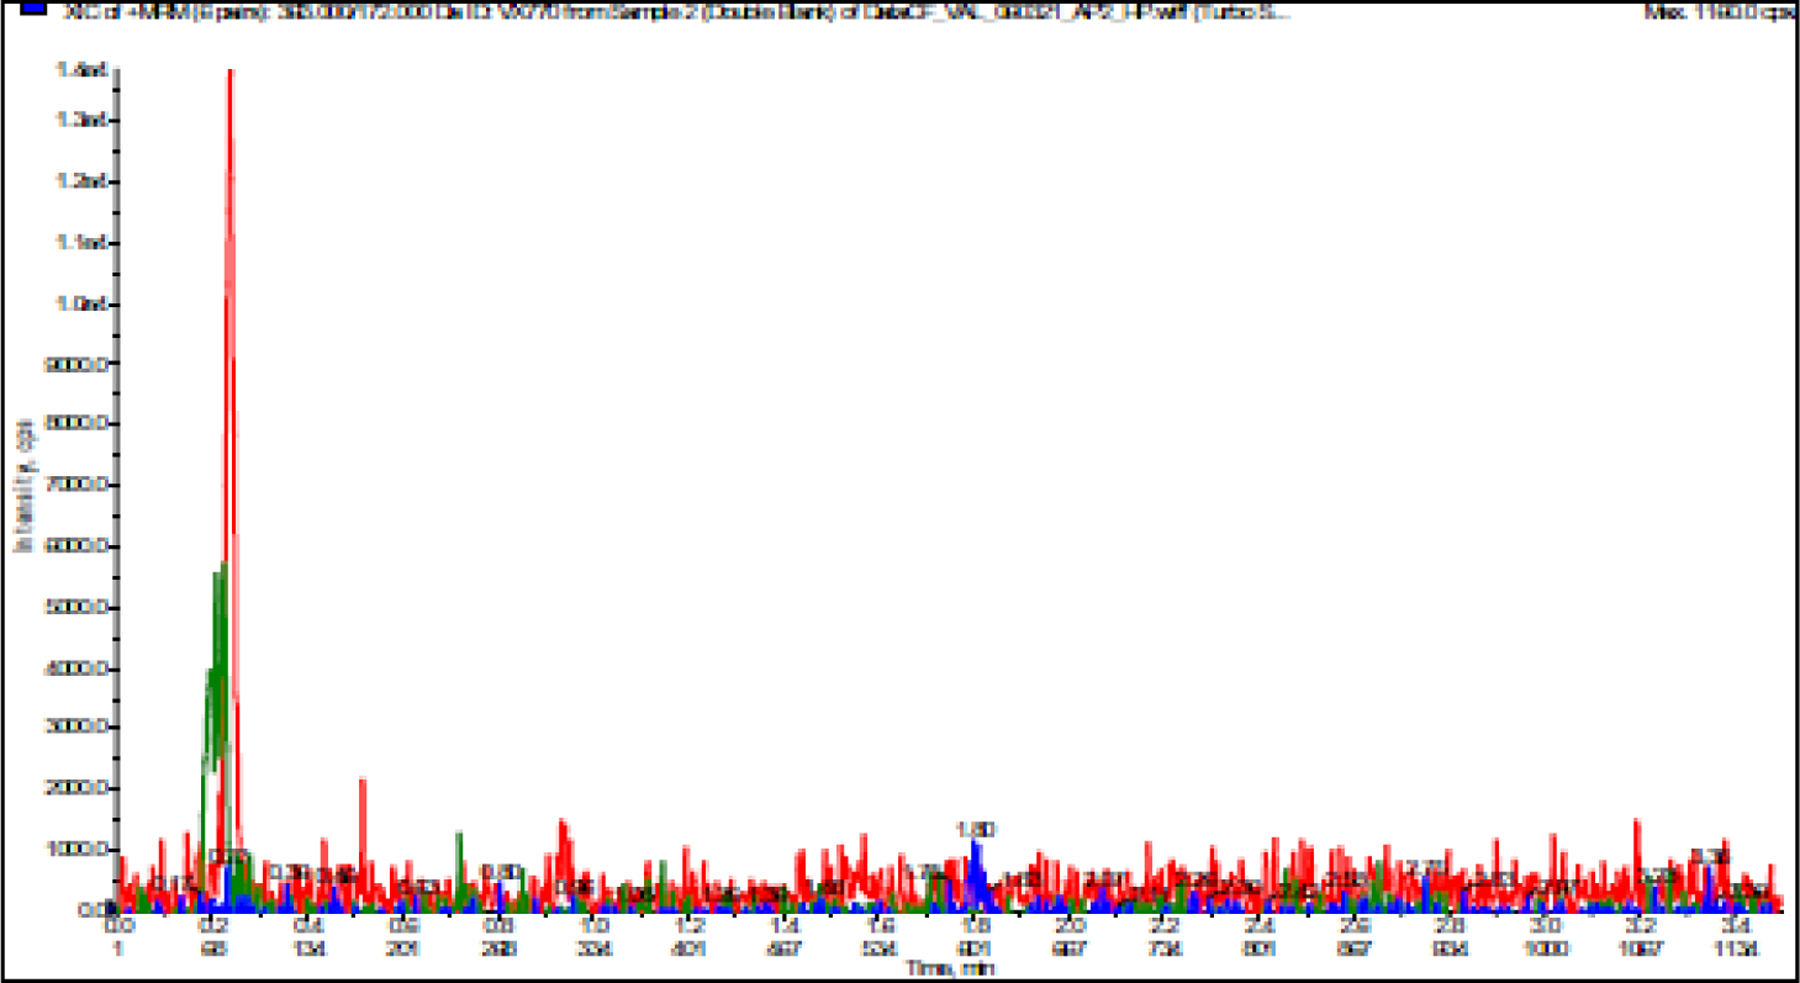
A. LC-MS/MS Chromatogram of ELX, TEZ, and IVA in Blank Plasma
The optimized parameters resulted in successful chromatographic separation of ETI and their respective internal standards from human plasma components (Figure 2). To assess for interfering peaks, extracted blank samples of human plasma were evaluated, with no unwanted peaks identified. No analyte/IS crosstalk was observed as evidenced by the absence of the IS peak for plasma samples after addition of ETI (9000 ng/mL final concentration) without IS. Plasma samples with IS added but no ETI were also observed to have no ETI peak. The coefficient of determination (r2, mean ± SD) for the three validation runs was at least 0.9970 ± 0.0027 (ELX), 0.9989 ± 0.0004 (TEZ), 0.9981 ± 0.0003 (IVA), regardless of specimen matrix (Table 2).
Figure 2B.
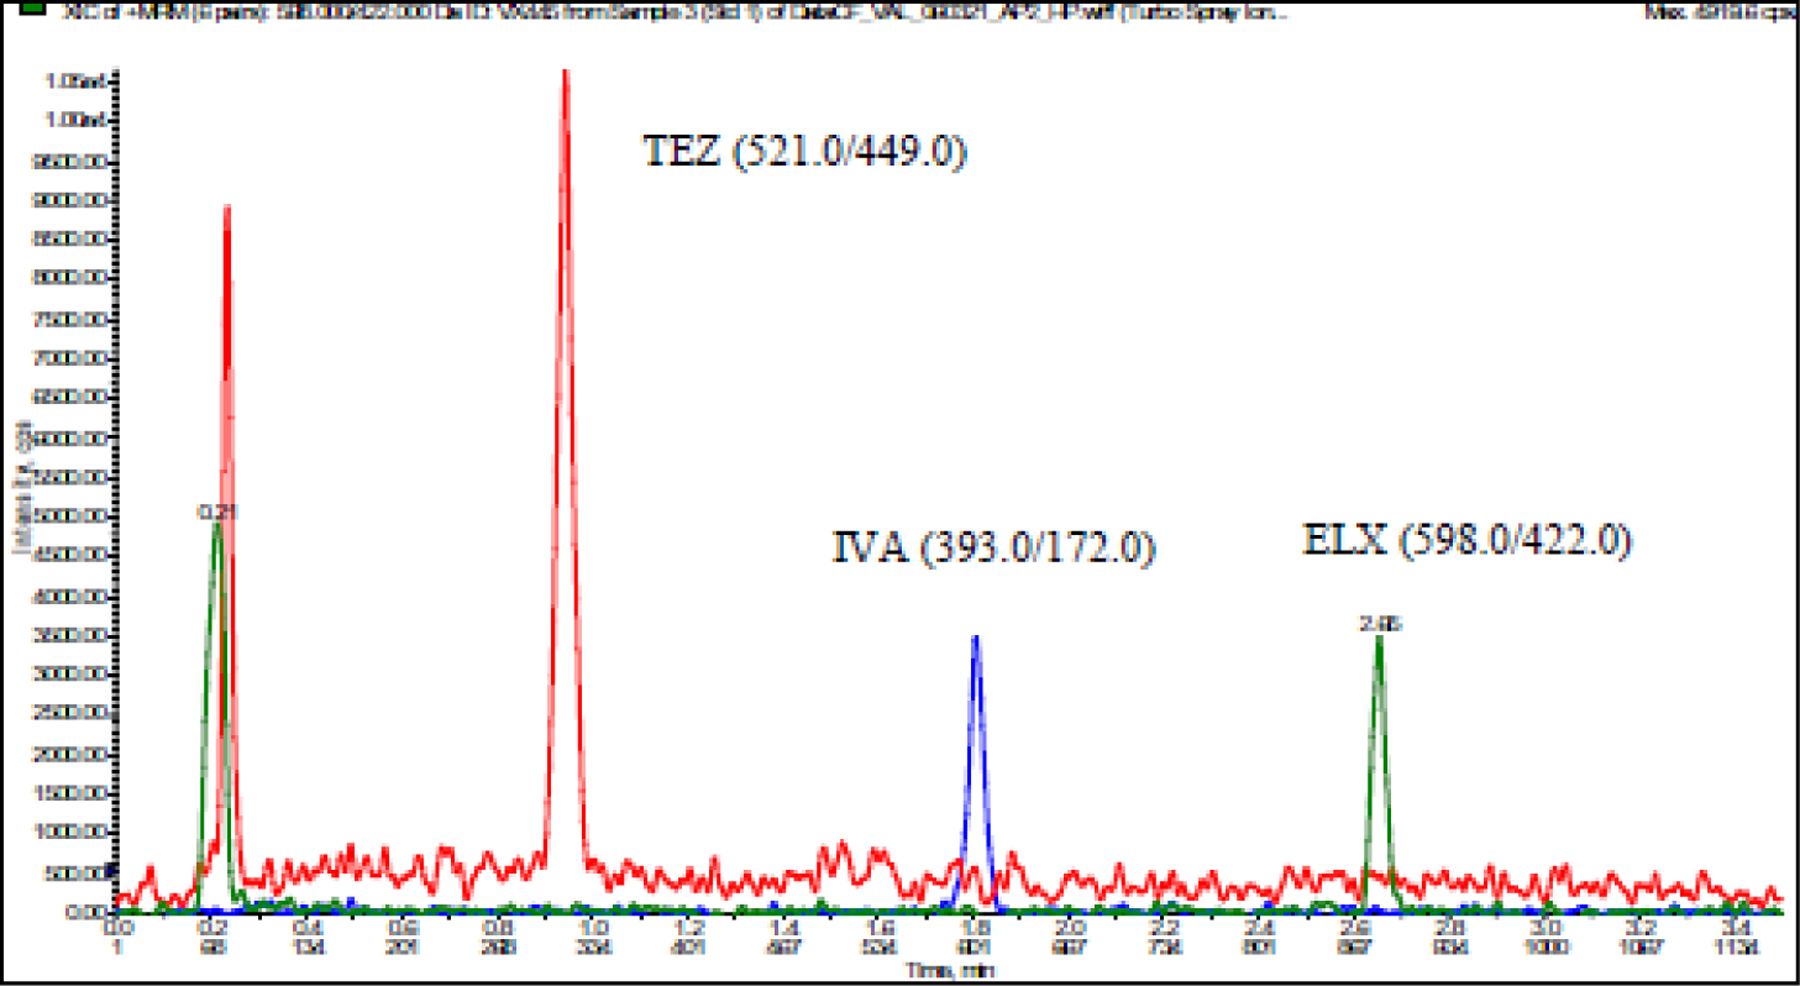
A. LC-MS/MS Chromatogram of ELX, TEZ, and IVA in low standard (10 ng/mL)
Table 2.
Summary of Calibration Curves for ELX, TEZ, and IVA Detection
| 10 ng/mL | 20 ng/mL | 100 ng/mL | 500 ng/mL | 1,000 ng/mL | 5,000 ng/mL | 9,000 ng/mL | 10,000 ng/mL | r2 | ||
|---|---|---|---|---|---|---|---|---|---|---|
| ELX Calibration Curve (inter-day) matrix: plasma |
mean | 10.0 | 19.8 | 102.0 | 494.4 | 1001.6 | 4976.4 | 8722.2 | 10346.2 | 0.9970 |
| SD | 0.53 | 2.14 | 2.11 | 9.53 | 41.6 | 254.8 | 518.1 | 263.5 | 0.0027 | |
| %CV | 5.3 | 10.8 | 2.1 | 1.9 | 4.2 | 5.1 | 5.9 | 2.5 | - | |
| %DEV | 0.0 | −0.8 | 2.0 | −1.1 | 0.2 | −0.5 | −3.1 | 3.5 | - | |
|
| ||||||||||
| TEZ Calibration Curve (inter-day) matrix: plasma |
mean | 10.1 | 19.6 | 98.5 | 501.9 | 1032.7 | 4952.1 | 8715.7 | 10298.7 | 0.9990 |
| SD | 0.00 | 0.15 | 2.46 | 5.88 | 9.4 | 242.3 | 273.4 | 44.6 | 0.0004 | |
| %CV | 0.0 | 0.8 | 2.5 | 1.2 | 0.9 | 4.9 | 3.1 | 0.4 | - | |
| %DEV | 1.0 | −2.2 | −1.5 | 0.4 | 3.3 | −1.0 | −3.2 | 3.0 | - | |
|
| ||||||||||
| IVA Calibration Curve (inter-day) matrix: plasma |
mean | 9.7 | 21.0 | 98.6 | 492.4 | 1008.1 | 4977.6 | 8654.6 | 10365.5 | 0.9983 |
| SD | 0.15 | 0.50 | 1.30 | 6.59 | 10.2 | 277.8 | 324.0 | 58.8 | 0.0004 | |
| %CV | 1.6 | 2.4 | 1.3 | 1.3 | 1.0 | 5.6 | 3.7 | 0.6 | - | |
| %DEV | −2.7 | 5.2 | −1.4 | −1.5 | 0.8 | −0.4 | −3.8 | 3.7 | - | |
|
| ||||||||||
| ELX Calibration Curve (inter-day) matrix: cell lysate |
mean | 10.3 | 18.9 | 101.5 | 503.2 | 1013.9 | 4957.3 | 9144.1 | 9878.9 | 0.9986 |
| SD | 0.00 | 0.21 | 2.05 | 3.32 | 0.4 | 75.0 | 59.4 | 142.3 | 0.0007 | |
| %CV | 0.0 | 1.1 | 2.0 | 0.7 | 0.0 | 1.5 | 0.6 | 1.4 | - | |
| %DEV | 3.0 | −5.7 | 1.5 | 0.6 | 1.4 | −0.9 | 1.6 | −1.2 | - | |
|
| ||||||||||
| TEZ Calibration Curve (inter-day) matrix: cell lysate |
mean | 9.8 | 21.2 | 98.5 | 490.3 | 1012.1 | 4890.7 | 9276.5 | 9830.9 | 0.9989 |
| SD | 0.35 | 1.41 | 2.76 | 2.97 | 8.1 | 37.3 | 150.3 | 127.2 | 0.0004 | |
| %CV | 3.6 | 6.7 | 2.8 | 0.6 | 0.8 | 0.8 | 1.6 | 1.3 | - | |
| %DEV | −2.5 | 6.0 | −1.6 | −1.9 | 1.2 | −2.2 | 3.1 | −1.7 | - | |
|
| ||||||||||
| IVA Calibration Curve (inter-day) matrix: cell lysate |
mean | 10.2 | 19.3 | 98.7 | 496.7 | 1044.0 | 4960.2 | 9051.7 | 9952.9 | 0.9981 |
| SD | 0.14 | 0.71 | 0.49 | 2.62 | 14.8 | 53.5 | 83.1 | 19.2 | 0.0003 | |
| %CV | 1.4 | 3.7 | 0.5 | 0.5 | 1.4 | 1.1 | 0.9 | 0.2 | - | |
| %DEV | 2.0 | −3.5 | −1.3 | −0.7 | 4.4 | −0.8 | 0.6 | −0.5 | - | |
Calculations determined from n=3 replicates across n=3 runs
3.2. Assay validation
Validation runs were executed over multiple days. All validation runs contained double blanks and blank samples as controls; an 8-point curve; six replicates each for QC standards (10/LLOQ, 30/low, 2000/mid, and 8000 ng/mL/high). Overall, inter-day precision (%CV) results were determined from back-calculated concentrations for all calibration curve standards. These ranged from 0.0 to 10.8% (ELX), 0.0 to 6.7% (TEZ), and 0.2 to 5.6% (IVA), while accuracy (%DEV) ranged from −5.7 to 3.5% (ELX), −3.2 to 6.0% (TEZ), and −3.8 to 5.2% (IVA) (Table 2). Inter-day precision and accuracy results (Table 3) were determined from the quality control standards. Mean inter-day precision were 2.8 to 11.5% (ELX), 2.8 to 6.3% (TEZ), and 1.0 to 11.0% (IVA), while the mean accuracy values were −6.0 to 7.3% (ELX), −6.6 to 9.8% (TEZ), −4.5 to 10.6% (IVA), regardless of specimen matrix.
Table 3.
Summary of Stability Parameters for ELX, TEZ, and IVA Detection
| %DEV (%CV) | ||||||
|---|---|---|---|---|---|---|
| 10 ng/mL | 30 ng/mL | 2000 ng/mL | 8000 ng/mL | 30,000 ng/mL | ||
|
| ||||||
| A&P (intra-day) matrix: plasma |
ELX | −6.8 (9.3) | −8.3 (6.6) | −4.7 (8.8) | −0.5 (3.1) | - |
| TEZ | −10.2 (5.6) | −9.3 (3.4) | −3.5 (8.6) | 0.9 (4.1) | - | |
| IVA | 6.8 (5.1) | −1.9 (4.6) | −5.2 (2.0) | −2.0 (0.8)_ | - | |
|
| ||||||
| A&P (intra-day) matrix: cell lysate |
ELX | −5.4 (6.1) | −1.1 (8.2) | 3.2 (7.8) | 2.9 (6.3) | - |
| TEZ | −4.9 (5.8) | 5.4 (3.3) | 4.6 (6.4) | 3.3 (7.1) | - | |
| IVA | −3.1 (4.6) | 6.2 (3.8) | 4.9 (5.3) | 1.3 (2.9) | - | |
|
| ||||||
| A&P (inter-day) matrix: plasma |
ELX | −2.3 (8.9) | −4.7 (5.6) | −6.0 (5.4) | −2.2 (2.8) | - |
| TEZ | −6.6 (6.3) | −5.0 (4.8) | −4.3 (4.9) | −0.8 (2.8) | - | |
| IVA | −2.6 (11.0) | −4.5 (6.9) | −4.1 (5.2) | −0.5 (3.1) | - | |
|
| ||||||
| A&P (inter-day) matrix: cell lysate |
ELX | −1.0 (3.9) | 4.3 (11.5) | 5.9(7.3) | 7.3 (4.1) | - |
| TEZ | −2.0 (3.7) | 9.8 (3.7) | 7.0 (5.2) | 6.2 (2.9) | - | |
| IVA | 0.8 (3.1) | 10.6 (4.6) | 7.6 (1.1) | 2.1 (1.0) | - | |
|
| ||||||
| Partial Volume/Dilution Integrity | ELX | - | - | −8.4 (5.6) | - | −6.1 (2.5) |
| TEZ | - | - | −11.1 (4.2) | - | −4.2 (2.0) | |
| IVA | - | - | −8.9 (4.3) | - | −3.3 (1.5) | |
|
| ||||||
| Freeze/Thaw 10 cycles |
ELX | - | −2.2 (3.4) | - | −0.2 (2.1) | - |
| TEZ | - | −1.2 (2.4) | - | −3.3 (1.9) | - | |
| IVA | - | −0.6 (4.4) | - | −5.3 (3.4) | - | |
|
| ||||||
| Plasma Stability 324 days @ −80°C |
ELX | - | 5.3 (4.7) | - | 6.7 (5.1) | - |
| TEZ | - | −0.8 (1.7) | - | −1.0 (4.8) | - | |
| IVA | - | −2.0 (2.9) | - | 0.7 (3.9) | - | |
|
| ||||||
| Plasma Stability 667 hours @ Ambient (≈24°C) |
ELX | - | −1.4 (4.1) | - | 4.6 (0.8) | - |
| TEZ | - | 0.1 (2.7) | - | 0.8 (1.2) | - | |
| IVA | - | 3.1 (4.2) | - | 2.4 (2.8) | - | |
|
| ||||||
| −11.2 | ||||||
| Post Preparative Reinjection Stability 96 hours @ 15°C Original Curve |
ELX | - | (4.3) | - | −8.6 (2.6) | - |
| TEZ | - | −7.3 (3.7) | - | −4.7 (1.6) | - | |
| IVA | - | 0.8 (3.3) | - | −2.6 (1.3) | - | |
|
| ||||||
| Post Preparative Reinjection Stability 96 hours @ 15°C Reinjected Curve |
ELX | - | −0.7 (4.3) | - | 0.7 (2.5) | - |
| TEZ | - | −6.1 (3.7) | - | −2.2 (1.6) | - | |
| IVA | - | 2.4 (3.3) | - | −0.7 (1.3) | - | |
| Post Preparative Stability 99 hours @ 15°C |
ELX | - | −1.6 (3.7) | - | −0.8 (1.4) | - |
| TEZ | - | 0.7 (2.5) | - | −0.5 (0.8) | - | |
| IVA | - | 1.9 (5.3) | - | −0.3 (1.0) | - | |
Calculations determined from n=6 replicates from n=1 run, except inter-day A&P which had n=18 replicates across n=3 runs
The ability to use dilution to quantify partial volume samples, low volume samples, or samples above the ULQ was tested using 5x dilutions of a 2000 ng/mL sample (limited volume), or a 30,000 ng/mL sample (dilution integrity). Mean accuracy values for partial volume assessment ranged from −11.1 and −8.4%, and precision values ranged from 4.2 to 5.6% (Table 3). Mean accuracy values for dilutional integrity assessment ranged from −6.1 and −3.3%, and precision values ranged from 1.5 to 2.5% (Table 3). These data confirm that samples can be accurately quantified after dilution up to 5x and are likely to encompass the ranges of concentrations observed from patient specimens.
Assay validation procedures included establishing analyte plasma stability under typical experimental conditions, including: long- and short-term storage, short-term post-preparative stability in the injection matrix, and freeze-thaw stability. After preparation, the plasma samples from patients were stored at −80°C; QC aliquots after preparation were also stored at this temperature. Aliquots that had been frozen and thawed 10 times were compared to fresh-thawed QC control samples, run in replicates (n=6). As seen in Table 3, the mean accuracy results for the tested low and high quality control samples were −2.2 or −0.2% (ELX), −1.2 or −3.3% (TEZ), and −0.6 or −5.3% (IVA), while the mean precision values were 3.4 or 2.1% (ELX), 2.4 or 1.9% (TEZ), and 4.4 or 3.4% (IVA). These data provide evidence that ELX, TEX, and IVA are stable through ten freeze-thaw cycles under these conditions.
Two QC concentrations (30 and 8000 ng/mL) in plasma were stored at −80°C to test long-term stability in this matrix. Replicate (n=6) QC samples were analyzed 324 days after preparation and nominal concentrations were compared between the stability test and freshly prepared QC samples. For the 324 day storage period evaluated the deviation from the actual concentration was within ± 6.7% for ELX, ± 1.0% for TEZ, and ± 2.0 for IVA (Table 3), suggesting stability of the compounds over this time period at −80°C.
Short-term stability in plasma was determined using two QC concentrations (30 and 8000 ng/mL) when stored at ambient temperature (≈24°C) for an extended period of time. Replicate (n=6) QC samples were analyzed at 667 hours after preparation and were compared with control samples. After 667 hours, the deviation from the nominal concentration was within ± 4.6% for ELX, ± 0.8 % for TEZ, and ± 3.1 for IVA (Table 3). Therefore, ELX, TEZ, and IVA are considered to be stable for at least 667 hours at ambient temperature.
To assess conditions that may occur in a testing laboratory, such as instrument failure over a weekend, an analytical run was re-injected after the uninjected volume had remained in the autosampler for 96 hours at 15°C. The data from both the initial analytical run and the re-injected analytical run were compared. The original analytical run data was used for calculating the QC standards. The comparison showed calibration curves that were nearly identical, and the difference between the determined mean values for LQC and HQC samples ranged from −6.1 to 2.4% (Table 3). To further assess differences in data acquired several days apart, samples were divided and tested separately. In this experiment, results varied from −1.6 to 1.9% (Table 3). These data provide evidence that re-injection or sample division results in equivocal results even if acquisition is conducted over multiple days.
To determine if stock solutions required fresh preparation with each analytic run or if they could be stored long-term in DMSO (1mg/mL), stock solutions were quantified with 5 replicate injections of two separate stock solutions stored at −80°C. The master stock solutions after 50 days of storage were compared to newly prepared stock solutions after dilution. Peak area difference between the two were 0.0% (ELX), −1.7% (TEZ), and −1.2% (IVA) (Table 4). Additionally, long-term stability in spiking solutions prepared at 100 ng/mL and 100 µg/mL in DMSO was determined, using 5 replicate injections of two spiking preparations at ambient temperature (≈24°C) that were prepared 41 days apart. The peak areas of the two spiking solutions were compared and showed a 7.1% or −1.0% (ELX), 6.8% or 0.2% (TEZ), and 7.8% or −2.4% (IVA) difference (Table 4).
Table 4.
Summary of Stability Parameters for ELX, TEZ, and IVA Spiking Solutions
| 100 ng/mL | 100 µg/mL | 1.0 mg/mL | ||
|---|---|---|---|---|
| Master Stock in DMSO 50 days @ −80°C |
ELX | - | - | 0.0% diff |
| TEZ | - | - | −1.7% diff | |
| IVA | - | - | −1.2% diff | |
|
| ||||
| Spiking Solutions in DMSO 41 days @ Ambient (≈24°C) |
ELX | 7.1% diff | −1.0% diff | - |
| TEZ | 6.8% diff | 0.2% diff | - | |
| IVA | 7.8% diff | −2.4% diff | - | |
Calculations determined from n=5 replicates from n=1 run
3.3. Matrix effects, Recovery, Process Efficiency and Selectivity
In mass spectrometry, matrix effects are effects from unknown substances present in the sample. These effects may arise from analytes other than those of interest, or other substances, that impair accurate quantitation of the target analytes. To assess for these matrix effects, independent lots of plasma (n=6) were spiked with ETI. The concentrations of the pre-extraction and post-extraction spiked samples were determined (Table 5). Recovery ranged from 98.8 to 101.5% for ELX, 98.3 to 103.7% for TEZ, and 100.2 to 102.2% for IVA across the experimental concentration range. To determine the matrix effects, the mean concentrations of pre- and post-extraction were compared. The mean matrix effect ranged from 105.3 to 112.8% for ELX, 106.6 to 107.1% for TEZ, and 105.4 to 106.2% for IVA. Extraction recover and matrix effects together determine process efficiency. The mean extraction process efficiency ranged from 104.9 to 114.5% for ELX, 105.2 to 111.1% for TEZ, and 106.3 to 108.5% for IVA. Assay selectivity was demonstrated in that all nine individual sources (lots) of blank plasma or serum and all six lots of lipemic or hemolyzed blank plasma demonstrated acceptability meeting ±20% of the LLOQ criteria (Table 6) and show a cumulative ≤ 0.0, 0.0, or 1.4 % response for the LLOQ, respectively. Moreover, all fifteen lots show insignificant interference of the IS response at its retention time. No significant carryover (0.045%) was observed for ELX, TEX, or IVA as well as their respective internal standards.
Table 5.
Plasma Recovery and Matrix Effects
| ELX/ELX-IS | |||
|
| |||
| 30 ng/mL | 2000 ng/mL | 8000 ng/mL | |
|
| |||
| Matrix Effect | 112.8% | 105.3% | 107.2% |
| Recovery | 101.5% | 99.6% | 98.8% |
| Process Efficiency | 114.5% | 104.9% | 105.9% |
|
| |||
| Matrix Effect Slope Precision (n=6 EDTA lots) | 0.000800 (mean) | 0.0000193 (SD) | 2.4% (CV) |
|
| |||
| TEZ/TEZ-IS | |||
|
| |||
| 30 ng/mL | 2000 ng/mL | 8000 ng/mL | |
|
| |||
| Matrix Effect | 107.1% | 107.0% | 106.6% |
| Recovery | 103.7% | 98.3% | 98.8% |
| Process Efficiency | 111.1% | 105.2% | 105.4% |
|
| |||
| Matrix Effect Slope Precision (n=6 EDTA lots) | 0.001687 (mean) | 0.0000316 (SD) | 1.9% (CV) |
|
| |||
| IVA/IVA-IS | |||
|
| |||
| 30 ng/mL | 2000 ng/mL | 8000 ng/mL | |
|
| |||
| Matrix Effect | 106.2% | 105.4% | 106.1% |
| Recovery | 102.2% | 100.9% | 100.2% |
| Process Efficiency | 108.5% | 106.3% | 106.4% |
|
| |||
| Matrix Effect Slope Precision (n=6 EDTA lots) | 0.000479 (mean) | 0.0000127 (SD) | 2.7% (CV) |
Table 6.
Selectivity
| Matrix | Anticoagulant | ELX | ELX-IS | TEZ | TEZ-IS | IVA | IVA_IS |
|---|---|---|---|---|---|---|---|
| Plasma | K3EDTA | 0.0 | 0.0 | 0.0 | 0.0 | 1.9 | 0.0 |
| Plasma | K3EDTA | 0.0 | 0.2 | 0.0 | 0.0 | 1.2 | 0.0 |
| Plasma | K3EDTA | 0.0 | 0.0 | 0.0 | 0.0 | 1.5 | 0.0 |
| Plasma | K3EDTA | 0.0 | 0.0 | 0.0 | 0.0 | 1.4 | 0.0 |
| Plasma | K3EDTA | 0.0 | 0.0 | 0.0 | 0.0 | 2.3 | 0.0 |
| Plasma | K3EDTA | 0.0 | 0.0 | 0.0 | 0.0 | 1.3 | 0.0 |
| Plasma* | K2EDTA | 0.0 | 0.0 | 0.0 | 0.0 | 2.3 | 0.0 |
| Plasma* | K2EDTA | 0.0 | 0.1 | 0.0 | 0.0 | 0.0 | 0.0 |
| Plasma* | K2EDTA | 0.0 | 0.0 | 0.0 | 0.0 | 2.6 | 0.0 |
| Plasma** | K2EDTA | 0.0 | 0.2 | 0.0 | 0.0 | 0.0 | 0.0 |
| Plasma** | K2EDTA | 0.0 | 0.1 | 0.0 | 0.0 | 0.0 | 0.0 |
| Plasma** | K2EDTA | 0.0 | 0.1 | 0.0 | 0.0 | 1.5 | 0.0 |
| Serum | - | 0.0 | 0.0 | 0.0 | 0.0 | 2.1 | 0.0 |
| Serum | - | 0.0 | 0.0 | 0.0 | 0.0 | 2.5 | 0.0 |
| Serum | - | 0.0 | 0.0 | 0.0 | 0.1 | 0.0 | 0.0 |
|
| |||||||
| mean response (% LLOQ) | 0.0 | 0.1 | 0.0 | 0.0 | 1.4 | 0.0 | |
indicates hemolyzed (~550mg/dL)
indicates visual lipemia
3.4. Application of the analytical method
To evaluate clinical application of the analytical method, three patients on TI and six patients on ETI were recruited to a clinical study to evaluate concentrations of these compounds during typical clinical use. All participants were on the modulator therapy for a minimum of two weeks prior to participation and thus expected to be at steady-state concentrations. No patients were on any medications contraindicated for concurrent use, or that would require a dosing alteration. For patients on TI, none had detectable ELX. Concentrations of TEZ ranged from 18–9062 ng/mL, with a median of 4363 ng/mL. Concentrations of IVA ranged from 174–1630 ng/mL, with a median of 877 ng/mL. For patients on ETI, ELX concentrations ranged from 1465–9969 ng/mL with a median of 4964 ng/mL. TEZ concentrations ranged from 1359–10613 ng/mL (median 4684 ng/mL) and IVA from 249–1785 ng/mL (median 731 ng/mL). Representative concentration-time curves from these six patients are shown in Figure 3. Each of the three compounds were also evaluated in whole cell lysate, which was collected and prepared as previously described.[24] Mean concentrations of ELX in lysate ranged from 0–5454 ng/mL; TEZ from 0–2038 ng/mL; and IVA from 0–9356 ng/mL. ELX concentrations in lysate increased significantly over the sampling period (p=0.02), whereas TEZ trended up over the sampling period (p=0.08). There was no difference in ivacaftor concentrations over time (p=0.66) in lysates.
Figure 3.

Concentration-time curves. A.ELX B. TEZ and C. IVA patients taking either the triple combination of ELX/TEZ/IVA (black circles) or the double combination (TEZ/IVA) (white squares) modulator therapy. Note that one patient (black circles) lost IV access and did not complete 12h timepoint. In A, the axis is split because one patient was taking triple combination therapy at a reduced dose, and had lower concentrations of ELX that would otherwise not be seen without this change. The dotted line and shaded area represent the Cmin and Cmax reported for those compounds for triple combination therapy reported by the manufacturer.
4. Discussion
ETI is the latest approved treatment combination for cystic fibrosis, indicated for patients with at least one F508del mutation or those shown to be responsive to the combination in vitro.[6] As ETI is approved for younger ages, and as new modulator therapies come on the market, the ability to use plasma quantitation of these compounds in concert with biomarkers of response or toxicity will help elevate precision dosing in the CF population.
In this report, we describe a quantitative assay for ETI in plasma that is fully validated for clinical use. The plasma assay has a wide dynamic range (10–10,000 ng/mL), which sufficiently covers the concentration variability seen clinically in patients taking this therapy. The assay is precise and reproducible, and is performed in a laboratory under Good Laboratory Practices [30]) and Clinical Laboratory Improvement Amendment [31] standard operating procedures for use in clinical decision making and for regulatory approvals as needed. It requires a minimum of 10 µL plasma for simultaneous quantitation of all three compounds, allowing detection in very small sample sizes in concert with other routine laboratory testing. This is especially critical as modulator dosing is being used in younger patients with subsequent approvals. Furthermore, in utero treatment of infants with CF, or infants of mothers with CF, is occurring but with unknown effects of the pharmacology of these compounds.[32–35] The ability to accurately quantify these compounds as these practices increase will improve our knowledge on the safety and pharmacology of these compounds in even the youngest patients.
We have demonstrated proof-of-concept with samples from patients currently taking CFTR modulator compounds, which will be useful for titrating patient dosage to balance side effects with clinical outcomes; for clinical research in under-studied populations (such as infants, transplant recipients and pregnant women) who may have been excluded in clinical trials. Assays to include the ELX metabolites and TEZ metabolites will be developed once standards can be reliably obtained. These tools will facilitate additional studies of these compounds in a variety of populations and clinical settings.
Figure 4.
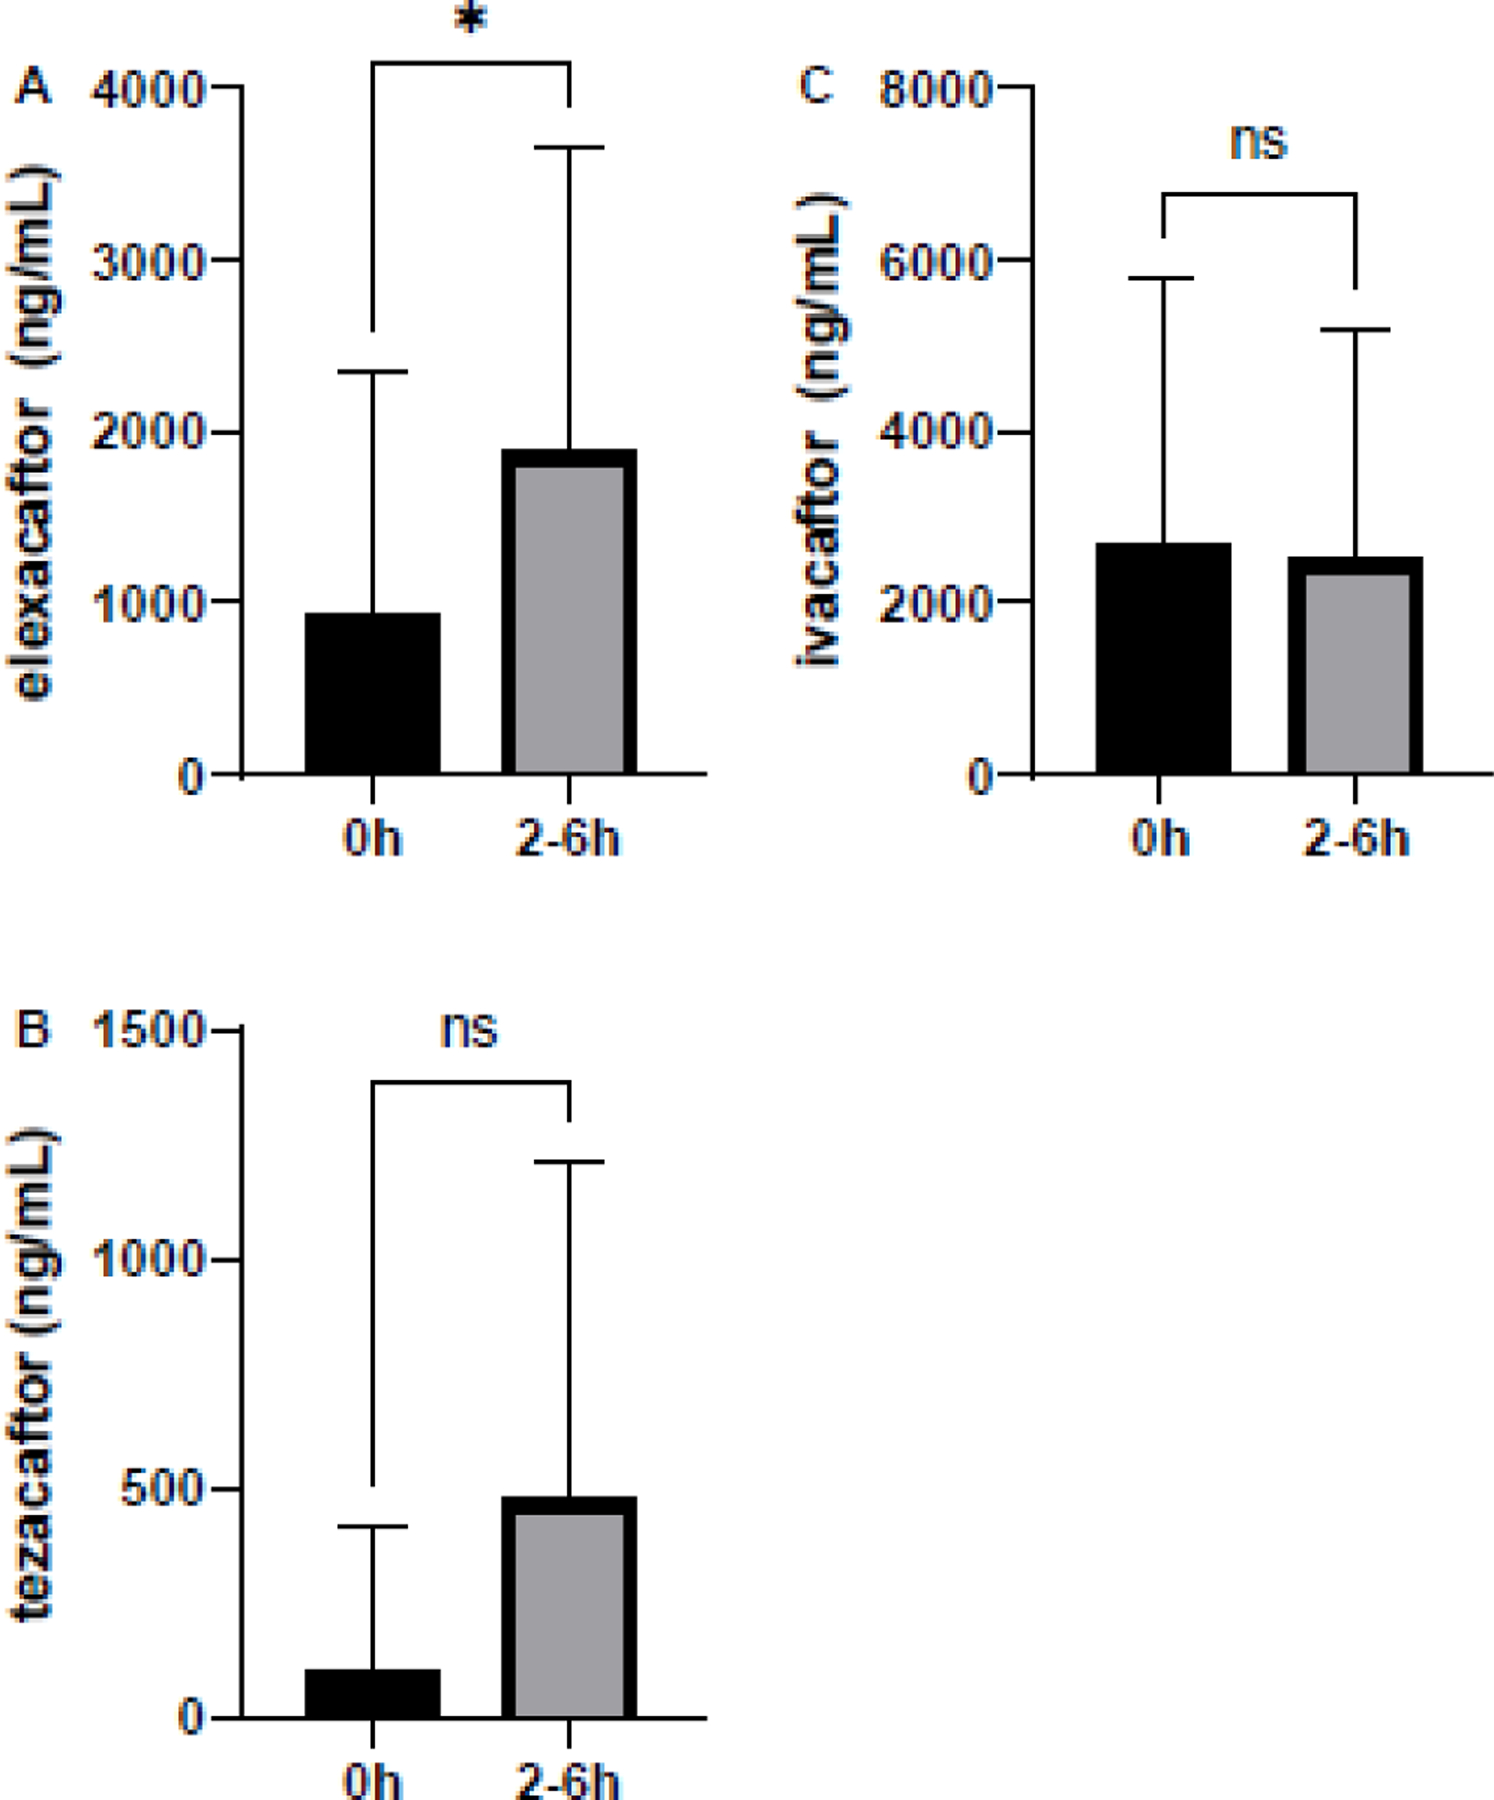
Cellular concentrations. A.ELX B. TEZ and C. IVA patients taking triple double combination modulator therapy who consented to donate cells for quantitation. Samples were collected at 0h prior to ingestion, and from 2–6 h after ingestion, of the morning triple combination. *p=0.02
Highlights.
Quantifies CFTR modulators in plasma and cellular lysate for research and clinical care
Highly sensitive and optimized for very small sample volumes
Critical for studying dose-adjustments for precision treatment optimization
6. ACKNOWLEDGEMENTS.
We thank the volunteers and their families who participated in this study; the director and clinical research staff in the Cystic Fibrosis Research Center, including Steven M. Rowe, Heather Hathorne, and Jennifer Natt, and Hina Amanullah from the Clinical Research Support Program.
7. SOURCES OF FUNDING:
The authors gratefully acknowledge support for this work from the CFF (GUIMBE18A0-Q, GUIMBE20A0-KB, and 1K23HL143167 to J.S.G.); the Gregory Fleming James Cystic Fibrosis Research Center (director Steven M. Rowe), supported by the NIH (DK072482 to S.M.R.) and CFF (R35HL135816 to S.M.R.), and the UAB Center for Clinical and Translational Science (UL1TR003096).
Abbreviations used in this manuscript:
- ACN
acetonitrile
- AUC
area under the concentration-time curve
- CV
coefficient of variation
- CFTR
cystic fibrosis transmembrane conductance regulator
- DMSO
dimethyl sulfoxide
- EDTA
ethylenediamine tetraacetic acid
- ELX
elexacaftor
- ESI+
electro spray ionization positive polarity
- ETI
Elexacaftor/Tezacaftor/Ivacaftor
- IPA
isopropanol
- IS
internal standard
- IVA
ivacaftor
- LC-MS/MS
liquid chromatography tandem mass spectrometry
- LLOQ
lower limit of quantitation
- MeOH
methanol
- MRM
multiple reaction monitoring
- PK
pharmacokinetic
- QC
quality control
- TEZ
tezacaftor
- ULQ
upper limit of quantitation
Footnotes
Publisher's Disclaimer: This is a PDF file of an unedited manuscript that has been accepted for publication. As a service to our customers we are providing this early version of the manuscript. The manuscript will undergo copyediting, typesetting, and review of the resulting proof before it is published in its final form. Please note that during the production process errors may be discovered which could affect the content, and all legal disclaimers that apply to the journal pertain.
Declaration of interests
The authors declare the following financial interests/personal relationships which may be considered as potential competing interests:
Jennifer S. Guimbellot reports a relationship with American Academy of Pediatrics that includes: board membership.
References
- [1].Lubamba B, Dhooghe B, Noel S, Leal T, Cystic fibrosis: insight into CFTR pathophysiology and pharmacotherapy, Clin Biochem, 45 (2012) 1132–1144. [DOI] [PubMed] [Google Scholar]
- [2].Ramsey BW, Davies J, McElvaney NG, Tullis E, Bell SC, Drevinek P, Griese M, McKone EF, Wainwright CE, Konstan MW, Moss R, Ratjen F, Sermet-Gaudelus I, Rowe SM, Dong Q, Rodriguez S, Yen K, Ordonez C, Elborn JS, Group VXS, A CFTR potentiator in patients with cystic fibrosis and the G551D mutation, N Engl J Med, 365 (2011) 1663–1672. [DOI] [PMC free article] [PubMed] [Google Scholar]
- [3].Wainwright CE, Elborn JS, Ramsey BW, Marigowda G, Huang X, Cipolli M, Colombo C, Davies JC, De Boeck K, Flume PA, Konstan MW, McColley SA, McCoy K, McKone EF, Munck A, Ratjen F, Rowe SM, Waltz D, Boyle MP, Lumacaftor–Ivacaftor in Patients with Cystic Fibrosis Homozygous for Phe508del CFTR, New England Journal of Medicine, 373 (2015) 220–231. [DOI] [PMC free article] [PubMed] [Google Scholar]
- [4].Heijerman HGM, McKone EF, Downey DG, Van Braeckel E, Rowe SM, Tullis E, Mall MA, Welter JJ, Ramsey BW, McKee CM, Marigowda G, Moskowitz SM, Waltz D, Sosnay PR, Simard C, Ahluwalia N, Xuan F, Zhang Y, Taylor-Cousar JL, McCoy KS, Group VXT, Efficacy and safety of the elexacaftor plus tezacaftor plus ivacaftor combination regimen in people with cystic fibrosis homozygous for the F508del mutation: a double-blind, randomised, phase 3 trial, Lancet, DOI 10.1016/S0140-6736(19)32597-8(2019). [DOI] [PMC free article] [PubMed] [Google Scholar]
- [5].Middleton PG, Mall MA, Drevinek P, Lands LC, McKone EF, Polineni D, Ramsey BW, Taylor-Cousar JL, Tullis E, Vermeulen F, Marigowda G, McKee CM, Moskowitz SM, Nair N, Savage J, Simard C, Tian S, Waltz D, Xuan F, Rowe SM, Jain R, Group VXS, Elexacaftor-Tezacaftor-Ivacaftor for Cystic Fibrosis with a Single Phe508del Allele, N Engl J Med, 381 (2019) 1809–1819. [DOI] [PMC free article] [PubMed] [Google Scholar]
- [6].Drug Approval Package: Trikafta, Food and Drug Administration, Food and Drug Administration. [Google Scholar]
- [7].Symdeko (tezacaftor/ivacaftor) Oral Tablet, Food and Drug Administration, https://www.accessdata.fda.gov/drugsatfda_docs/nda/2018/210491Orig1s000TOC.cfm. [Google Scholar]
- [8].Drug Approval Package: Kalydeco (ivacaftor), Food and Drug Administration, https://www.accessdata.fda.gov/drugsatfda_docs/nda/2012/203188s000TOC.cfm. [Google Scholar]
- [9].Dalboge CS, Nielsen XC, Dalhoff K, Alffenaar JW, Duno M, Buchard A, Uges DR, Jensen AG, Jurgens G, Pressler T, Johansen HK, Hoiby N, Pharmacokinetic variability of clarithromycin and differences in CYP3A4 activity in patients with cystic fibrosis, J Cyst Fibros, 13 (2014) 179–185. [DOI] [PubMed] [Google Scholar]
- [10].Schultz AN, Hoiby N, Nielsen XC, Pressler T, Dalhoff K, Duno M, Buchard A, Johansen HK, Wang H, Dalboge CS, Individual pharmacokinetic variation leads to underdosing of ciprofloxacin in some cystic fibrosis patients, Pediatr Pulmonol, 52 (2017) 319–323. [DOI] [PubMed] [Google Scholar]
- [11].Parsons RL, Paddock GM, Absorption of two antibacterial drugs, cephalexin and co-trimoxazole, in malabsorption syndromes, J Antimicrob Chemother, 1 (1975) 59–67. [DOI] [PubMed] [Google Scholar]
- [12].Dove AM, Szefler SJ, Hill MR, Jusko WJ, Larsen GL, Accurso FJ, Altered prednisolone pharmacokinetics in patients with cystic fibrosis, J Pediatr, 120 (1992) 789–794. [DOI] [PubMed] [Google Scholar]
- [13].Rey E, Treluyer JM, Pons G, Drug disposition in cystic fibrosis, Clin Pharmacokinet, 35 (1998) 313–329. [DOI] [PubMed] [Google Scholar]
- [14].Jeyaratnam J, van der Meer R, Berkers G, Heijerman HG, Beekman JM, van der Ent CK, Breast development in a 7 year old girl with CF treated with ivacaftor: An indication for personalized dosing?, J Cyst Fibros, 20 (2021) e63–e66. [DOI] [PubMed] [Google Scholar]
- [15].Balijepally R, Kwong D, Zhu L, Camacho JV, Liu A, Elexacaftor/tezacaftor/ivacaftor outpatient desensitization, Ann Allergy Asthma Immunol, DOI 10.1016/j.anai.2021.08.010(2021). [DOI] [PubMed] [Google Scholar]
- [16].Lowry S, Mogayzel PJ, Oshima K, Karnsakul W, Drug-induced liver injury from elexacaftor/ivacaftor/tezacaftor, J Cyst Fibros, DOI 10.1016/j.jcf.2021.07.001(2021). [DOI] [PubMed] [Google Scholar]
- [17].Stylemans D, Francois S, Vincken S, Verbanck S, Vanderhelst E, A case of self-limited drug induced liver injury under treatment with elexacaftor/tezacaftor/ivacaftor: When it is worth taking the risk, J Cyst Fibros, 20 (2021) 712–714. [DOI] [PubMed] [Google Scholar]
- [18].Rotolo SM, Duehlmeyer S, Slack SM, Jacobs HR, Heckman B, Testicular pain following initiation of elexacaftor/tezacaftor/ivacaftor in males with cystic fibrosis, J Cyst Fibros, 19 (2020) e39–e41. [DOI] [PubMed] [Google Scholar]
- [19].Hu MK, Wood G, Dempsey O, ‘Triple therapy’ (elexacaftor, tezacaftor, ivacaftor) skin rash in patients with cystic fibrosis, Postgrad Med J, DOI 10.1136/postgradmedj-2020-139264(2020). [DOI] [PubMed] [Google Scholar]
- [20].Leonhardt K, Autry EB, Kuhn RJ, Wurth MA, CFTR modulator drug desensitization: Preserving the hope of long term improvement, Pediatr Pulmonol, 56 (2021) 2546–2552. [DOI] [PubMed] [Google Scholar]
- [21].Safirstein J, Grant JJ, Clausen E, Savant D, Dezube R, Hong G, Biliary disease and cholecystectomy after initiation of elexacaftor/ivacaftor/tezacaftor in adults with cystic fibrosis, J Cyst Fibros, 20 (2021) 506–510. [DOI] [PubMed] [Google Scholar]
- [22].Dagenais RVE, Su VCH, Quon BS, Real-World Safety of CFTR Modulators in the Treatment of Cystic Fibrosis: A Systematic Review, J Clin Med, 10 (2020). [DOI] [PMC free article] [PubMed] [Google Scholar]
- [23].G.G. Spoletini L;Pollard K; Shaw N; Williams E; Etherington C; Clifton IJ; Peckham DG, Dose adjustments of Elexacaftor/Tezacaftor/Ivacaftor in response to mental health side effects in adults with cystic fibrosis, Journal of Cystic Fibrosis, DOI 10.1016/j.jcf.2022.05.001(2022). [DOI] [PubMed] [Google Scholar]
- [24].Guimbellot JS, Ryan KJ, Anderson JD, Liu Z, Kersh L, Esther CR, Rowe SM, Acosta EP, Variable cellular ivacaftor concentrations in people with cystic fibrosis on modulator therapy, J Cyst Fibros, 19 (2020) 742–745. [DOI] [PMC free article] [PubMed] [Google Scholar]
- [25].Habler K, Kalla AS, Rychlik M, Bruegel M, Teupser D, Nahrig S, Vogeser M, Paal M, Isotope dilution LC-MS/MS quantification of the cystic fibrosis transmembrane conductance regulator (CFTR) modulators ivacaftor, lumacaftor, tezacaftor, elexacaftor, and their major metabolites in human serum, Clin Chem Lab Med, DOI 10.1515/cclm-2021-0724(2021). [DOI] [PubMed] [Google Scholar]
- [26].Reyes-Ortega F, Qiu F, Schneider-Futschik EK, Multiple Reaction Monitoring Mass Spectrometry for the Drug Monitoring of Ivacaftor, Tezacaftor, and Elexacaftor Treatment Response in Cystic Fibrosis: A High-Throughput Method, ACS Pharmacol Transl Sci, 3 (2020) 987–996. [DOI] [PMC free article] [PubMed] [Google Scholar]
- [27].Bennetto-Hood C, Tabolt G, Savina P, Acosta EP, A sensitive HPLC-MS/MS method for the determination of dolutegravir in human plasma, J Chromatogr B Analyt Technol Biomed Life Sci, 945-946 (2014) 225–232. [DOI] [PMC free article] [PubMed] [Google Scholar]
- [28].C.f.D.E.a.R.C. Food and Drug Administration, Bioanalytical Method Validation Guidance for Industry, in: U.S.D.o.H.a.H. Services; (Ed.), https://www.fda.gov/files/drugs/published/Bioanalytical-Method-Validation-Guidance-for-Industry.pdf, 2018. [Google Scholar]
- [29].Smith M, Ryan KJ, Gutierrez H, Sanchez LHG, Anderson JN, Acosta EP, Benner KW, Guimbellot JS, Ivacaftor-elexacaftor-tezacaftor and tacrolimus combination in cystic fibrosis, J Cyst Fibros, DOI 10.1016/j.jcf.2021.05.008(2021). [DOI] [PMC free article] [PubMed] [Google Scholar]
- [30].Code of Federal Regulations Code of Federal Regulations, https://www.ecfr.gov/, United States of America, 2022. [Google Scholar]
- [31].Code of Federal Regulations Code of Federal Regulations https://www.ecfr.gov/, United States of America, 2022. [Google Scholar]
- [32].Taylor-Cousar JL, CFTR Modulators: Impact on Fertility, Pregnancy, and Lactation in Women with Cystic Fibrosis, J Clin Med, 9 (2020). [DOI] [PMC free article] [PubMed] [Google Scholar]
- [33].Szentpetery S, Foil K, Hendrix S, Gray S, Mingora C, Head B, Johnson D, Flume PA, A case report of CFTR modulator administration via carrier mother to treat meconium ileus in a F508del homozygous fetus, J Cyst Fibros, 21 (2022) 721–724. [DOI] [PubMed] [Google Scholar]
- [34].Fortner CN, Seguin JM, Kay DM, Normal pancreatic function and false-negative CF newborn screen in a child born to a mother taking CFTR modulator therapy during pregnancy, J Cyst Fibros, 20 (2021) 835–836. [DOI] [PubMed] [Google Scholar]
- [35].Collins B, Fortner C, Cotey A, Esther CRJ, Trimble A, Drug exposure to infants born to mothers taking Elexacaftor, Tezacaftor, and Ivacaftor, J Cyst Fibros, 21 (2022) 725–727. [DOI] [PMC free article] [PubMed] [Google Scholar]