

ABSTRACT
Proper brain wiring relies on the precise distribution of axonal projections to specific subcellular domains of their target neurons. These spatially confined connections establish the anatomical foundation for neural circuit assembly. The mossy fiber (MF)–CA3 pathway in the hippocampus is an excellent system to study the mechanisms underlying lamina‐specific connectivity. In rodents, MF projections develop postnatally and reach their mature configuration by the end of the second postnatal week. MF axons synapse on the proximal segments of the dendrites but avoid the somas of CA3 pyramidal neurons. As dentate gyrus granule neurons are continuously generated and integrated into the existing hippocampal circuit throughout the postnatal period and adulthood, the mechanisms that guide MF axons to achieve lamina‐specific targeting of these later‐born granule neurons remain unclear. Here, we show that deletion of the neurodevelopmental disorder‐associated protein capicua (CIC) results in abnormal MF targeting in the mouse hippocampus. Notably, this defect emerges after the second postnatal week and persists into adulthood, distinguishing it from classical MF guidance defects, which typically manifest during the first postnatal week. We also demonstrate that this miswiring is due to CIC loss in dentate gyrus granule neurons rather than CA3 pyramidal neurons. Single‐nucleus transcriptomics and trajectory analysis reveal a loss of a mature granule neuron subtype and dysregulation of axon guidance genes that are normally downregulated as granule neurons mature. Our findings uncover a previously unrecognized role for CIC in hippocampus development and offer insights into the regulation of lamina‐specific MF connectivity in the postnatal brain.
Keywords: capicua, CIC‐related neurodevelopmental disorder, dentate gyrus, hippocampus, mossy fiber, neurodevelopment
Loss of the neurodevelopmental disorder‐associated protein capicua (CIC) disrupts axon targeting in the late postnatal mouse hippocampus. Single‐nucleus transcriptomics and trajectory analysis reveal the absence of a mature granule neuron subtype and aberrant expression of axon guidance genes that are typically downregulated during granule neuron maturation.

1. Introduction
Brain wiring and cognitive functions are defined by synaptic specificity at both cellular and subcellular levels. In many regions of the vertebrate central nervous system, afferent projections are confined to specific laminae enriched for distinct dendritic domains [1, 2, 3]. The dentate gyrus mossy fiber (MF)–CA3 synapse in the hippocampus is a prime example of a system exhibiting lamina‐specific connectivity. MF axons, emanating from dentate gyrus granule neurons, form two distinct bundles: the suprapyramidal and infrapyramidal bundles (Figure 1A). These bundles selectively target the proximal regions of the apical and basal dendrites of CA3 pyramidal neurons, while avoiding the somas located in the stratum pyramidale [4, 5, 6, 7]. In rodents, MF projections begin forming shortly after birth and achieve their mature configuration by postnatal day (P) 14 [8]. Both repulsive and attractive molecular cues are essential for establishing lamina‐specific MF–CA3 connectivity during the first two postnatal weeks [4, 6, 7, 9, 10]. However, dentate gyrus granule neurons are continuously generated by progenitor cells in the subgranular zone. These newly born neurons undergo morphological maturation and integrate functionally into the hippocampal network [11, 12]. The mechanisms regulating axonal targeting of these later‐born granule neurons to maintain MF lamina‐specific patterning remain largely unknown. Notably, abnormal MF–CA3 connections have been implicated in learning deficits and epilepsy in animal models [10, 13, 14], underscoring the importance of understanding how lamina‐restricted MF targeting is achieved.
FIGURE 1.

CIC expression in the early postnatal hippocampus. (A) Immunofluorescence staining for CIC in the hippocampus at postnatal day (P) 5. CA1, cornu ammonis 1; CA3, cornu ammonis 3; DG, dentate gyrus. Scale bar = 250 μm. The white box denotes the region shown in (B, C). (B, C) Immunofluorescence staining of CIC in the dentate gyrus at P5 (B) and P10 (C). Calretinin marks immature granule neurons. CIC is strongly expressed in calretinin‐negative mature granule neurons (white arrows) and weakly or not expressed in calretinin‐positive immature granule neurons (yellow arrowheads). In Emx1‐Cre; Cic flox/flox mice, CIC is efficiently deleted from granule neurons, though CIC immunoreactivity remains detectable (asterisks) in non‐Emx1‐lineage cells, such as inhibitory neurons and microglia. Scale bars = 25 μm for left panels and 5 μm for right panels.
The identification of neurodevelopmental disorder genes often presents unique opportunities to uncover previously unappreciated mechanisms regulating brain development. One such gene is capicua (CIC), a transcriptional repressor broadly expressed in the brain [15, 16, 17]. Heterozygous pathogenic loss‐of‐function variants in CIC result in CIC‐related neurodevelopmental disorder (MIM #617600), characterized by neurobehavioral phenotypes including learning disabilities, attention‐deficit/hyperactivity disorder (ADHD), autism, and epilepsy [15, 18, 19, 20, 21, 22, 23, 24]. As CIC‐related neurodevelopmental disorder is rare, mouse models have been developed to study the role of Cic in brain development. While germline homozygous knockout of Cic results in perinatal lethality in mice, heterozygous mice show no overt abnormalities [15], suggesting that humans are more sensitive to partial loss of CIC. To better understand the role of CIC in neurodevelopment, conditional knockout mouse models targeting specific brain regions or cell types have been generated [15, 16, 17]. For example, deleting Cic from forebrain excitatory neurons using the Emx1‐Cre driver results in ADHD‐like behaviors and learning and memory deficits, validating this model as relevant to the human disorder [15]. Cellular characterization of these mice has demonstrated the role of CIC in the postnatal maintenance of cortical projection neurons in layers 2–4, with mutant mice exhibiting reduced dendritic complexity and neuron numbers. Moreover, pan‐neural Cic knockout mice show impaired neuronal differentiation [16], and our recent work has identified a requirement for CIC in dendritic maturation of adult‐born hippocampal neurons [25]. Collectively, these findings underscore the important role of CIC in neuronal differentiation and dendrite development. However, whether CIC regulates other aspects of neuronal maturation, such as axon guidance and/or targeting, cell adhesion, or synaptogenesis, remains unknown.
In this study, we demonstrate that CIC plays a key role in granule neurons to promote precise MF targeting in the late postnatal mouse hippocampus. Loss of CIC leads to dysregulation of axon guidance genes during granule neuron maturation. Our study provides insights into the role of CIC in hippocampus development and the neurobiology underlying the CIC‐related neurodevelopmental disorder.
2. Materials and Methods
2.1. Sex as a Biological Variable
Our study examined male and female animals, and similar findings are reported for both sexes.
2.2. Mice
Emx1‐Cre mice [B6.129S2‐Emx1 tm1(cre)Krj /J, #005628], Grik4‐Cre mice [C57BL/6‐Tg(Grik4‐cre)G32‐4Stl/J, #006474], and Ai9 mice [B6.Cg‐Gt(ROSA)26Sor tm9(CAG‐tdTomato)Hze /J, #007909] were obtained from The Jackson Laboratory. Generation of the Cic flox mice was previously described [15]; the Cic flox mice were also available from The Jackson Laboratory (#030555). Wildtype mice were originally obtained from The Jackson Laboratory (#000664) and subsequently bred in‐house. Rbp4‐Cre mice [STOCK Tg(Rbp4‐cre)KL100Gsat/Mmucd, #031125‐UCD] were obtained from The Mutant Mouse Resource and Research Center. Mice were group‐housed in a 12‐h light–12‐h dark cycle, with all experiments performed during the light period. Ages are indicated where applicable. The experimenters were blinded to the genotypes of the mice during the experiment and/or when assessing the outcome. All procedures in mice were approved by the Animal Care and Use Committee of the University of Alberta (AUP 2665 and AUP 3930). All methods were performed in accordance with the relevant guidelines and regulations.
2.3. Tissue Preparations
Mice were deeply anesthetized using i.p. injection of sodium pentobarbital (Euthanyl, 240 mg/mL, Bimeda‐MTC, Cambridge, ON), then transcardially perfused with phosphate buffered saline (PBS, Fisher Bioreagents, Cat# BP399‐20) followed by 4% paraformaldehyde (Electron Microscope Sciences, Cat# 19202) in PBS. The brains were dissected and further immersed in 4% paraformaldehyde overnight at 4°C, followed by sequential submersion in 15% and then 30% sucrose in PBS, each for 24 h at 4°C. Brain tissues were cut using a coronal brain matrix, embedded into Optimal Cutting Temperature (OCT) compound (Fisher HealthCare, Cat# 4585), and frozen at −80°C. Coronal brain sections (40 μm‐thick) were cut using a cryostat (Leica Microsystems Inc., Cat# CM1520) and kept at 4°C in PBS with 0.02% sodium azide (BICCA, Cat# 7144.8‐16). When desired, coronal sections were transferred onto Superfrost Plus Microscope slides (Fisher Scientific, Cat# 12‐550‐5) and air‐dried overnight. Once the slides were dry, they were used immediately for immunofluorescence staining or stored at −80°C.
2.4. Immunohistochemistry
Slides were post‐fixed in 10% phosphate buffered formalin (Fisher Chemicals, Cat# SF100‐4) for 10 min at room temperature and then washed in PBS. Antigen retrieval was performed with citric‐acid based antigen unmasking solution (VectorLabs, Cat# H‐3300) for 30 min at 95°C in a water bath. Once the slides were cooled to room temperature, they were washed twice with PBS, permeabilized with PBST (PBS + 0.3% Triton X‐100, Fisher Bioreagents, Cat# BP151‐500) for 20 min at room temperature and then blocked with 5% normal donkey serum (Sigma, Cat# D9663‐10ML) diluted in PBST (blocking solution) for 20 min at room temperature. Primary antibodies were diluted in blocking solution, added onto the slides, and incubated overnight at 4°C in a humid chamber. Sections were washed three times with PBST prior to incubating for 2 h at room temperature in secondary antibody diluted in blocking buffer. Afterwards, the slides were washed in PBST then PBS and autofluorescence was quenched using the Vector TrueView autofluorescence quenching kit, prepared as per the manufacturer's instructions (VectorLabs, Cat# SP8400). The slides were washed, counterstained with DAPI (5 μg/mL, Invitrogen, Cat# D3571) for a 10‐min incubation at room temperature, then washed with PBS. The slides were then mounted using VectaShield Vibrance antifade mounting media (VectorLabs, Cat# H170010) and covered with a cover slip. The slides were left to dry overnight, sealed with transparent nail polish, then further dried prior to being imaged with a confocal microscope. The following primary antibodies were used: goat anti‐tdTomato (SICGEN Cat# AB8181‐200, RRID:AB_2722750, 1:500), rabbit anti‐CALB1 (Swant Cat# CB38, RRID:AB_10000340, 1:500), mouse anti‐ZnT3 (Synaptic Systems Cat# 197011, RRID:AB_2189665, 1:500); rabbit anti‐CIC ([15]; RRID:AB_2721281; 1:500); guinea pig anti‐SYP (Synaptic Systems Cat# 101308, RRID:AB_2924959; 1:500); rabbit anti‐SYN3 (Synaptic Systems Cat# 106303, RRID:AB_2619775, 1:500); mouse anti‐Tau‐1 (Sigma‐Aldrich Cat# MAB3420, RRID:AB_3068606, 1:500); goat anti‐NRP1 (R and D Systems Cat# AF566, RRID:AB_355445, 1:200). The secondary antibodies used were donkey anti‐rabbit AlexaFluor488 (Invitrogen Cat# A21206, RRID:AB_2535792, 1:1000), donkey anti‐goat AlexaFluor555 (Invitrogen Cat# A21432, RRID:AB_2535853, 1:1000), donkey anti‐mouse AlexaFluor647 (Invitrogen Cat# A31571, RRID:AB_162542, 1:1000), donkey anti‐guinea pig AlexaFluor647 (Jackson ImmunoResearch Labs Cat# 706‐605‐148, RRID:AB_2340476, 1:1000).
2.5. Adeno‐Associated Viruses and Neonatal Intracerebroventricular Injections
pAAV‐hSyn‐Cre‐P2A‐dTomato was a gift from Rylan Larsen (Addgene viral prep # 107738‐AAV8; http://n2t.net/addgene:107738; RRID:Addgene_107738). Viruses were aliquoted and stored at −80°C until use. Thawed viruses were kept at 4°C and used within a week. All viruses were diluted to 1.0 × 10¹² genome copy (GC)/mL using PBS before injection into mice. Neonatal intracerebroventricular injections were performed as previously described [26]. Briefly, newborn pups (within 6 h of birth) and dam were transported to the surgery suite in their home cage. Half of the litter was removed from the cage and transferred to a biological safety cabinet. Each pup was anesthetized using hypothermia, and the cranial surface was disinfected with a 70% ethanol wipe (Becton Dickinson Canada Inc., Cat# 326910). Using a gas‐tight syringe (Hamilton, Cat# 361025642) with a 32G 1.25‐cm needle (Hamilton, Cat# 7762‐03), 2 μL of AAV was injected into the lateral ventricles of each hemisphere by hand. The pup was then placed on a 37°C heating pad until recovered, and the remaining half of the litter was completed. The injected pups were then returned to the home cage, followed by removing the second half to the litter for AAV injection.
2.6. Protein Extraction and Immunoblotting
Tissues (one dentate gyrus per extraction) were homogenized using Dounce Tissue Grinders (DWK Life Sciences, Cat# 8853000002) and 300 μL of cold T‐PER Tissue Protein Extraction Reagent (Thermo Fisher Scientific, Cat# 78510) supplemented with fresh protease and phosphatase inhibitors (Thermo Fisher Scientific, Cat# A32953 and Cat# A32957, respectively). Lysates were incubated on ice for 10 min and then cleared by centrifugation at 16 000 g for 10 min at 4°C. Protein concentrations were quantified using the BCA Protein Assay Kit (Thermo Fisher Scientific, Cat# 23227). For each lysate, 30 μg of protein was mixed with an equal volume of 4× Laemmli sample buffer (Bio‐Rad, Cat# 1610747), and the samples were boiled for 10 min at 75°C before loading onto a 4%–15% Mini‐PROTEAN TGX Precast Gel (Bio‐Rad, Cat# 1610747). After electrophoresis, proteins were transferred onto a nitrocellulose membrane (Cytiva, Cat# 10600002) before primary and secondary antibody incubation and image acquisition using a Li‐Cor Odyssey CLx Imager. Quantifications of relevant protein levels were performed using the Li‐Cor ImageQuant Studio software. The primary antibodies used were rabbit anti‐SYN3 (Synaptic Systems Cat#106303, RRID:AB_2619775; 1:2000) and mouse anti‐VCL (MilliporeSigma Cat# V9131, RRID:AB_477629; 1:10 000). The secondary antibodies used were: donkey anti‐mouse IgG (H + L) DyLight 800 (Thermo Fisher Scientific Cat# SA5‐10172, RRID:AB_2556752; 1:10 000) and donkey anti‐rabbit IgG (H + L) DyLight 680 (Thermo Fisher Scientific Cat# SA5‐10066, RRID:AB_2556646; 1:10 000).
2.7. Single‐Nucleus RNA Sequencing
Three Cic flox/flox and three Emx1‐Cre; Cic flox/flox mice (littermates, two males and one female for each genotype) at P19 were euthanized with sodium pentobarbital, and their hippocampus micro‐dissected in ice‐cold HBSS (Gibco, 14175103). The dissected tissues were snap‐frozen in liquid nitrogen until nuclei extraction. One hippocampus from each mouse was used for nuclei extraction (i.e., three hippocampi per genotype). Nuclei were isolated using the 10× Genomics Chromium Nuclei Isolation Kit (10× Genomics, Cat# 1000493) lysis buffer, and the debris was removed using Miltenyi Anti‐Nucleus beads (Miltenyi Biotec, Cat# 130‐132‐997). Briefly, frozen tissue pieces were pooled, weighed, and chopped into small pieces on dry ice before adding Lysis Reagent (10× Genomics, Cat# 2000558), Reducing Agent B (10× Genomics, Cat# 2000087), and Surfactant A (10× Genomics, Cat# 2000559). The tissue was homogenized using a glass douncer (MilliporeSigma, Cat# D9063) and lysed for 5 min on ice. A total of 500 μL of lysate was transferred to the Nuclei Isolation Column (10× Genomics, Cat# 2000562) to remove leftover tissue. The sample was then spun at 500 g for 3 min at 4°C, and the nuclei pellet was resuspended in Nuclei Separation buffer composed of Nuclei Extraction buffer (Miltenyi Biotec, Cat# 130‐128‐024), PBS, 10% BSA, and RNase Inhibitor (MilliporeSigma, Cat# 3335402001). Miltenyi anti‐nucleus beads (Cat# 130‐132‐997) were then added to the sample (50 μL per million nuclei) and incubated for 15 min on ice, followed by an additional 2 mL of the Nuclei Separation buffer. Then the sample was purified using an LS column (Miltenyi Biotec, Cat#130‐042‐401) attached to the MACS MultiStand (Miltenyi Biotec, Cat# 130‐042‐303) with a QuadroMACS separator (Miltenyi Biotec, Cat# 130‐042‐302). The purified nuclei were spun at 500 g for 5 min, and the nuclei pellet was washed with wash buffer comprised of PBS, 10% BSA, and RNase Inhibitor. The nuclei suspension was centrifuged at 4°C for 5 min at 500 g again, and the nuclei pellet was resuspended in wash buffer. Nuclei counting was done using a 1:1 dilution with acridine orange and propidium iodide on a hemocytometer (Thermo Fisher, Cat# 22‐600‐100). Following counting, the appropriate volume for each sample was calculated for a target capture of 20 000 nuclei, and then the nuclei were loaded onto the 10× 3′ GEM‐X chip. cDNA libraries were prepared as outlined by the Chromium GEM‐X Single Cell 3′ Reagent Kits v4 user guide with modifications to the PCR cycles based on the calculated cDNA concentration. The molarity of each library was calculated based on library size as measured by bioanalyzer (Agilent Technologies) and qPCR amplification data (Roche, Cat# 07960140001). Gene Expression libraries were sequenced on Illumina's NovaSeqX with the following run parameters: read 1–28 cycles, read 2–90 cycles, index 1–10 cycles, and index 2–10 cycles.
2.8. Single‐Nucleus RNA Sequencing Data Analysis
FASTQ files were converted to count matrix files using Cell Ranger Count with Mouse (mm39) as the reference genome. Quality control, dimensionality reduction, and initial clustering were performed in RStudio (2023.12.0 Build 369) using Seurat (v4.4.0; https://github.com/satijalab/seurat). Quality controls for both the control and knockout datasets were performed separately by removing nuclei with high or low mitochondrial content (±3 median absolute deviation [MAD] from the median), low gene counts (log10(nFeature_RNA) < median − 3 × MAD), or high transcript counts (log10(nCount_RNA) > median + 3 × MAD), and excluded cells deviating from the expected nCount/nFeature relationship. Doublets were identified and removed using DoubletFinder with parameters pN = 0.25, pK = 0.005, and a 16% expected doublet rate adjusted for homotypic proportions. The two datasets were then combined, and transcripts associated with low‐quality or contaminant signals, including high‐abundance lncRNAs, mitochondrial genes (^mt‐), and ribosomal or rRNA‐related genes were removed. The two datasets were then split and independently normalized, with 2000 variable features selected per dataset using the “vst” method. Integration anchors were identified using these features, followed by data integration to correct batch effects. Downstream analysis was performed on the integrated assay using 30 PCs (principal components), with clustering at a resolution of 0.5 and visualization by UMAP based on the first 20 PCs. Granule neuron clusters based on Prox1 expression were subset from the integrated dataset based on UMAP clustering. Granule neuron clusters were re‐integrated by first reverting to the uncorrected RNA assay and splitting the dataset by condition. Each subset was independently normalized and processed using 2000 variable features, followed by anchor‐based integration and dimensionality reduction via PCA. Clustering and UMAP or t‐SNE visualization were performed using the first 20 PCs, with a clustering resolution of 0.25.
Differentially expressed genes (DEGs) between conditions within each cluster were determined using the Seurat FindMarkers function (with min.pct = 0.25). Gene Ontology (GO) enrichment analysis was performed on DEGs using the enrichGO function from clusterProfiler, focusing on biological processes (BP) with p.adjust < 0.05 and qvalue < 0.2. Top GO terms were visualized per cluster using dot plots to highlight shared and unique biological pathways across clusters. Gene set enrichment analysis was performed using the Enrichr‐KG [27] web server (https://maayanlab.cloud/enrichr‐kg). To integrate Seurat and Monocle3 to infer developmental trajectories of granule cell subtypes in samples [28, 29, 30], after converting the Seurat object to a cell_data_set, cluster and UMAP coordinates were transferred, and Monocle3 was used to learn the trajectory and calculate pseudotime. Ligand–receptor pairs analysis was performed using LIANA with the mouse consensus resource [31]. Granule cell and CA3 neuron clusters were subsetted, re‐integrated, and re‐clustered from control and knockout samples using the Seurat integration workflow. Key parameters include using 2000 variable features (nfeatures = 2000), principal component analysis with 30 PCs (npcs = 30), UMAP and clustering based on the first 20 PCs (dims = 1:20), and a low clustering resolution (resolution = 0.02) to yield 3 clusters (one immature granule neuron cluster, one mature granule neuron cluster, and one CA3 cluster). The dataset was then split into control and knockout datasets and analyzed separately using the LIANA framework with the MouseConsensus resource to infer and aggregate cell–cell communication interactions from the RNA assay.
2.9. Confocal Microscopy and Image Analyses
Immunofluorescent images were acquired using laser‐scanning confocal microscopes: a Leica SP8 system (used for Figures 3 and 7, with Lightning deconvolution) and a Zeiss LSM 700 system (used for all other images). For each animal, z‐stacked images of the dentate gyrus and/or CA3 areas were acquired from at least two comparable coronal sections, and analyses were performed on images of these sections. Each data point represents the average value from multiple sections per animal. CALB1+ area measurements were carried out using ImageJ and were restricted to the CA3 stratum pyramidale region.
FIGURE 3.

Enlarged mossy fiber terminals in the CA3 stratum pyramidale of Emx1‐Cre; Cic flox/flox knockout mice. (A) Representative confocal images showing co‐labeling of mossy fiber (MF) terminals with CALB1 and the presynaptic marker synaptophysin (SYP, yellow arrows). Scale bars = 10 μm. Quantification of CALB1+ SYP+ MF terminal size is shown on the right. (B) Representative confocal images showing co‐labeling of MF terminals with CALB1 and the axonal marker Tau (yellow arrows). Scale bars = 5 μm. Quantification of CALB1+ Tau+ MF terminal size is shown on the right. Data are presented in scatter plots with error bars representing +SD. Statistical analysis was performed using Welch's t‐test. *p < 0.05; ****p < 0.0001.
FIGURE 7.
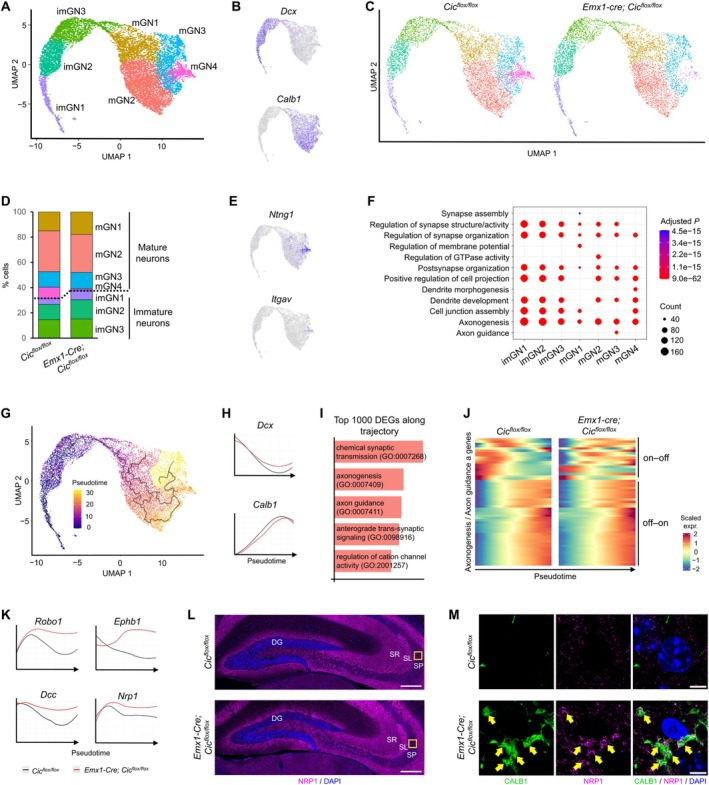
Dysregulation of axonogenesis genes during granule neuron maturation in Emx1‐Cre; Cic flox/flox knockout mice. (A) 2D uniform manifold approximation and projection (UMAP) plot showing seven clusters of granule neurons, including immature (imGN) and mature (mGN) granule neurons. (B) UMAP feature plots illustrating the expression of Dcx and Calb1, markers for immature and mature granule neurons, respectively. (C) UMAP plots comparing the distribution of granule neuron clusters in control (Cic flox/flox ) versus knockout (Emx1‐Cre; Cic flox/flox ) mice. (D) A bar plot showing the proportion of cells within each cluster across the two datasets. (E) UMAP feature plots revealing the expression of Ntng1 and Itgav within the mature neuron cluster mGN4. (F) A dot plot highlighting the top seven gene ontology (GO) terms for differentially expressed genes (DEGs) across all clusters. (G) UMAP plot depicting the maturation trajectory of granule neurons, with cells colored according to pseudotime values. (H) Pseudotime expression plots showing the gene expression profiles of Dcx and Calb1 across the granule neuron maturation trajectory. (I) The top five GO terms associated with the top 1000 DEGs along the granule neuron trajectory in control mice. (J) Heatmap analysis of axonogenesis and axon guidance genes across pseudotime. “On–off” genes refer to those with high expression in immature granule neurons and low expression in mature neurons, while “off–on” genes are highly expressed only in mature granule neurons. (K) Pseudotime expression plots for Robo1, Ephb1, Dcc, and Nrp1, revealing their expression dynamics throughout granule neuron maturation. (L) Representative confocal images showing NRP1 immunostaining in the dentate gyrus (DG) and CA3 region of control and knockout mice. The yellow box denotes the region shown in (M). SL, stratum lucidum; SP, stratum pyramidale; SR, stratum radiatum. Scale bars = 250 μm. (M) Representative confocal images showing co‐labeling (arrows) of mossy fiber terminals with CALB1 and NRP1 in the CA3 SP of knockout mice, but not in control mice. Scale bars = 5 μm.
To quantify the total area of CALB1+, SYN3+, or tdT+ MF terminals within the region of interest, we first processed the images by applying an automatic thresholding method to the single‐channel fluorescence signal for CALB1. Specifically, the “Huang” thresholding algorithm in ImageJ was used to standardize signal detection across samples, minimizing user bias. Following thresholding, we performed particle analysis by restricting the particle size to a range of 4–36 μm2 and the circularity to a range of 0.30–0.70. These parameters were chosen to selectively capture MF terminal structures while excluding background noise and non‐relevant signals such as thick dendrites from CALB+ interneurons. The total CALB1+ MF terminal area was then calculated based on the cumulative area of all particles that met these criteria. The size of individual CALB1+ ZnT3+ MF terminals located in the CA3 SP was measured manually. Double‐positive puncta were identified by their co‐localization in merged fluorescence images, and each MF terminal was outlined manually using the polygon selection tool in ImageJ. The area of each traced terminal was then quantified to assess terminal size.
To quantify the size of CALB1+ SYP+ or CALB1+ Tau+ MF terminals, deconvolved images were taken using the Leica SP8 Falcon confocal microscope (Leica Microsystems, Wetzlar, Germany) in lightning mode using a 100× oil objective. At least two comparable sections were imaged for each animal. For image acquisition, the z‐stack (0.34 μm) and step number [11] were kept consistent across samples. The size of CALB1+ SYP+ or CALB1+ Tau+ MF terminals in the CA3 stratum pyramidale was measured manually using ImageJ. Briefly, maximum projection images were created to visualize double‐positive terminals, which were then defined and measured using the polygon tool. This manual approach was necessary to ensure accurate identification and measurement of complex, overlapping double‐labeled structures less amenable to automated analysis.
2.10. Statistics
Statistical analyses were performed using GraphPad Prism. Detailed information on statistical analysis and sample size is provided in the figures and their legends.
3. Results
3.1. Loss of CIC Leads to Abnormal Mossy Fiber Spreading to the CA3 Stratum Pyramidale Region
To assess the role of CIC in the developing hippocampus, we first examined its expression pattern and found that, at P5, CIC was expressed in CA1, CA3, and the dentate gyrus (Figure 1A). CIC expression appeared to be ubiquitous throughout the CA1 and CA3 but was most concentrated in cells at the outer edge of the granular layer of the dentate gyrus, where mature granule neurons reside. To determine whether CIC expression correlates with neuronal maturation, we used calretinin as a marker for immature neurons [32]. At P5, CIC was highly expressed in calretinin‐negative (mature) granule neurons, while its expression was low to undetectable in calretinin‐positive (immature) neurons (Figure 1B). This pattern became even more pronounced at P10, as the spatial segregation of immature and mature granule neurons within the granular layer became more distinct (Figure 1C). The upregulation of CIC from immature to mature neurons indicates a role for CIC in neuronal maturation in the developing dentate gyrus.
To further explore the role of CIC in the early postnatal hippocampus, we utilized the Emx1‐Cre; Cic flox/flox mice, in which Cre‐mediated recombination begins in neural progenitors at embryonic day 9.5 [15, 25, 33]. Consequently, CIC is deleted from dentate gyrus granule neurons and CA neurons in the hippocampus (Figure 1B,C, Figure S1). In rodents, MF axons develop from P0 to P14 [8] and bifurcate into the suprapyramidal and infrapyramidal bundles that synapse on either side of the CA3 stratum pyramidale (SP), where CA3 neuron cell bodies reside (Figure 2A). To investigate the impact of CIC deletion on hippocampal development, we compared the MF pathway in control (Cic flox/flox ) and Emx1‐Cre; Cic flox/flox knockout mice using calbindin (CALB1) immunostaining, a common marker for mature granule neurons and their MF projections [4, 6, 9, 34]. At P20, when MF pathfinding is complete, control mice exhibited a lamina‐specific projection of the MF suprapyramidal bundle, which primarily innervated the stratum lucidum (SL), where the apical dendrites of CA3 pyramidal neurons are located, with few CALB1+ MF terminals found in the SP (Figure 2B–D). In knockout mice, this pattern was altered. Although the suprapyramidal bundle still projected to the SL, numerous CALB1+ MF terminals abnormally spread into the SP (Figure 2B–D). These aberrant MF terminals co‐expressed the zinc transporter ZnT3 (Figure 2E,F), typically localized to MF axon terminals [34, 35, 36], as well as the pre‐synaptic marker synaptophysin (Figure 3A) and the axonal marker Tau (Figure 3B). Our quantifications further revealed a significant increase in both the number (Figure 2F) and size (Figure 3) of the CALB1+ MF terminals in the knockout SP compared to controls. Additionally, immunostaining and immunoblotting for synapsin III (SYN3), a protein highly enriched in MF synapses [37, 38], demonstrated increased SYN3 levels in the SP of knockout mice (Figure S2).
FIGURE 2.

Abnormal mossy fiber targeting in Emx1‐Cre; Cic flox/flox knockout mice. (A) Schematic of the mouse hippocampus illustrating the mossy fiber (MF) pathway. DG, dentate gyrus; IPB, infrapyramidal bundle; SL, stratum lucidum; SP, stratum pyramidale; SPB, suprapyramidal bundle. (B) Representative confocal images of calbindin (CALB1) immunostaining in coronal sections of the hippocampus from postnatal day (P) 20 mice. Scale bars = 200 μm. (C) The CA3a area (white box in B) is shown at a higher magnification. Dotted lines demarcate the SP and SL of CA3a. Arrows indicate aberrant MF invasion into the SP in knockout mice. SR, stratum radiatum. Scale bars = 50 μm. (D) Quantification of CALB1+ immunoreactive areas in the SP. (E) Co‐localization of CALB1 and zinc transporter 3 (ZnT3) (arrows) confirms the presence of abnormal MF axon terminals in the SP in knockout mice. Scale bars = 25 μm. (F) Quantification of the number of CALB1+ ZnT3+ MF terminals in the SP. Data are presented in scatter plots with error bars representing ±SD. Statistical analysis was performed using Welch's t‐test. *p < 0.05; ****p < 0.0001.
Next, we investigated when the abnormal MF innervation becomes evident in the Emx1‐Cre; Cic flox/flox knockout mice. At P11, CALB1 immunostaining revealed similar MF projections between control and knockout mice (Figure 4A). By P14, however, a mild but significant increase in MF terminals was observed in the SP of knockout mice, although the difference was not as pronounced as at P20, indicating that abnormal MF targeting becomes more prominent during the third postnatal week (Figure 4B). This abnormal MF spreading peaks around 11 weeks of age and appears to stabilize thereafter till at least 1 year of age. Altogether, our data demonstrate that ectopic MF terminals begin forming in the CA3 SP of Emx1‐Cre; Cic flox/flox knockout mice around the second postnatal week and persist throughout adulthood.
FIGURE 4.

Persistent aberrant mossy fiber–CA3 innervation in Emx1‐Cre; Cic flox/flox knockout mice. (A) Representative confocal images from postnatal day (P) 11, P14, P20, 11 weeks, and 1‐year‐old mice, showing abnormal calbindin (CALB1)‐positive mossy fiber terminals in the stratum pyramidale (SP) of the CA3a region in Emx1‐Cre; Cic flox/flox knockout mice. SL, stratum lucidum. Scale bars = 50 μm. (B) Quantification of CALB1+ immunoreactive area within the SP across different ages. Data are presented as a scatter plot with error bars indicating mean ± SD. Statistical analysis was performed using mixed‐model two‐way ANOVA, followed by Holm‐Sidak post hoc test for multiple comparisons. ns, not significant; *p < 0.05; **p < 0.01; ***p < 0.001; ****p < 0.0001.
3.2. CIC Is Required in Dentate Gyrus Granule Neurons to Promote Lamina‐Specific Mossy Fiber Innervation
Since CIC is deleted from both dentate gyrus granule neurons and CA3 pyramidal neurons in the Emx1‐Cre; Cic flox/flox mice (Figure S1), the abnormal MF terminals observed in the CA3 SP of these mice could be due to CIC loss in either neuron type. To distinguish between these possibilities, we utilized the Rbp4‐Cre driver line to selectively delete CIC from dentate gyrus granule neurons [4, 39, 40]. Using a Cre‐dependent tdTomato (tdT) reporter line, we validated that Cre‐mediated recombination was restricted to granule neurons at P20, with no tdT‐expressing CA3 neurons detected (Figure 5A). Furthermore, tdT expression was limited to a subset of CALB1+ mature granule neurons and excluded immature neurons (Figure S3A), consistent with prior reports that Rbp4‐Cre specifically targets mature granule cells [41]. Next, we generated Rbp4‐Cre; Cic flox/flox ; tdT knockout mice and confirmed efficient CIC deletion in 92.1% ± 7.2% (N = 3 animals) of tdT‐expressing granule neurons at P20 (Figure 5B). However, because Rbp4‐Cre targets only a subset of granule neurons, CIC deletion was restricted to this population. The expression of tdT in granule neurons enabled us to compare the MF pathway in control versus knockout mice. At P20, tdT+ MF projections in control mice were predominantly confined to the SL of the CA3, with minimal terminals in the SP, resembling the pattern of CALB1 expression (Figure 5C). In contrast, tdT+ MF projections extended into the SP in the Rbp4‐Cre; Cic flox/flox knockout mice, and these abnormally projecting MF terminals co‐expressed CALB1 and synaptophysin (Figure 5C–E). Ectopic MF projections persisted in adult knockout mice at 8 weeks of age (Figure S3B). Interestingly, the relative area of SP occupied by aberrant MF terminals was smaller in the Rbp4‐Cre; Cic flox/flox mice compared to the Emx1‐Cre; Cic flox/flox mice (comparing Figures 4B and 5D, Figure S3C). This may be because CIC was deleted from nearly all granule neurons in the Emx1‐Cre; Cic flox/flox mice (Figure 1), whereas only a subset of granule neurons was affected in the Rbp4‐Cre; Cic flox/flox mice (Figure 5B, Figure S3A). Overall, our data demonstrate that CIC deletion in dentate gyrus granule neurons alone is sufficient to induce persistent ectopic MF innervation to the SP.
FIGURE 5.

CIC is required in dentate gyrus granule neurons to promote lamina‐specific mossy fiber innervation. (A) Confocal images of the hippocampus in Rbp4‐Cre; tdT mice at postnatal day (P) 20. Scale bar = 250 μm. CA1, cornu ammonis 1; CA3, cornu ammonis 3; MF, mossy fiber. (B) Efficient CIC deletion in tdT+ granule neurons (arrowheads) is observed in Rbp4‐Cre; Cic flox/flox ; tdT mice. Scale bars = 25 μm. (C) In Rbp4‐Cre; Cic flox/flox ; tdT mice, mossy fiber (MF) axon terminals, marked by CALB1 and tdT, abnormally innervate the stratum pyramidale (SP) of the CA3a region. SL, stratum lucidum. Scale bars = 50 μm. (D) Quantification of CALB+ TdT+ MF terminal area in the SP. Data are presented as a scatter plot with error bars indicating mean ± SD. Statistical analysis was performed using Welch's t‐test. *p < 0.05. (E) Co‐localization of CALB1, tdT, and synaptophysin (SYP) identifies presynaptic MF terminals in the SP. Scale bar = 10 μm.
3.3. Loss of CIC in CA3 Neurons Does Not Affect Mossy Fiber Projections
To investigate whether CIC is also required in CA3 neurons for precise MF targeting, we initially attempted to delete CIC from CA3 neurons using the Grik4‐Cre line [42]. Incorporating the Cre‐dependent tdT allele, we observed extensive Cre‐mediated reporter recombination not only in CA3 neurons but also in dentate gyrus granule neurons by P20 (Figure S4A), consistent with previous reports [42, 43]. However, Cre activity was insufficient to mediate recombination of the Cic flox/flox alleles, as no CIC deletion was detected in tdT+ granule neurons in Grik4‐Cre; Cic flox/flox mice (Figure S4B). On the other hand, we observed CIC loss in a modest (~25%) number of CA3 neurons (Figure S4C). Therefore, CIC deletion in the Grik4‐Cre; Cic flox/flox mice was restricted to CA3 neurons. Analysis of the MF pathway using CALB1 immunostaining revealed no differences between control and knockout mice at P20 (Figure S4D), suggesting that partial loss of CIC in CA3 neurons does not affect lamina‐restricted MF targeting.
To further assess the role of CIC in CA3 neurons, we employed a viral approach to delete Cic in these cells. We performed intracerebroventricular injections of adeno‐associated virus (AAV) carrying a Cre recombinase and tdT reporter under a neuron‐specific promoter (AAV8/hSyn‐Cre‐P2A‐tdTomato or AAV8/Cre for short) into Cic flox/flox pups at P0 (Figure 6A). Due to the high proliferative activity of granule neuron precursors at P0, this approach more efficiently targets post‐mitotic CA3 neurons [44, 45]. By adjusting the viral titer, we generated a mosaic system that allows for the transduction of only a small subset of granule neurons and some, but not all, CA3 neurons. In control animals (Cic flox/+ pups injected with AAV8/Cre), CIC expression remained detectable in AAV‐transduced CA3 neurons, marked by tdT expression (Figure 6B, yellow arrowheads). In contrast, CIC immunoreactivity was absent in tdT+ CA3 neurons of Cic flox/flox pups injected with AAV8/Cre (Figure 6B, white arrowheads), confirming efficient gene deletion. This mosaic system enabled us to determine whether the soma of a single transduced CA3 neuron was aberrantly surrounded by MF terminals. If CIC is required in CA3 neurons for proper MF projections, we would expect wild‐type MF axons to innervate CIC‐deleted, tdT‐expressing CA3 neuron somas. However, this was not observed in any of the AAV‐transduced, CIC‐deleted CA3 neurons (Figure 6C). Collectively, these results indicate that CIC is not required in CA3 neurons to maintain lamina‐specific MF targeting.
FIGURE 6.
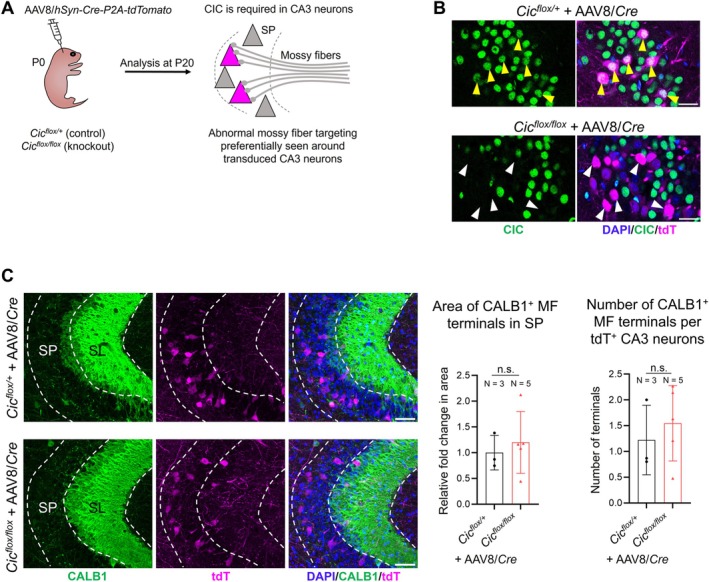
Adeno associated virus (AAV)‐mediated genetic mosaicism for studies of cell‐autonomy. (A) A schematic diagram outlines the experimental approach. Intraventricular injection of AAV to postnatal day (P) 0 pups is used to deliver the bicistronic Cre recombinase and tdTomato (tdT) reporter under the neuronal human synapsin promoter (hSyn). AAV‐injected animals were analyzed at P20. (B) Representative confocal images demonstrate that CA3 neurons are sparsely transduced. CIC remains expressed in AAV8/Cre‐transduced CA3 neurons in the Cic flox/+ mice (yellow arrowheads), but it is efficiently deleted from AAV8/Cre‐transduced neurons in the Cic flox/flox mice (white arrowheads). Scale bars = 25 μm. (C) Confocal images of immunostaining for CALB1 and tdT in the CA3a region. Note the lack of strong tdT signal in the stratum lucidum (SL), indicating that granule neurons are minimally transduced in this system. Mosaic ablation of CIC from CA3 neurons does not cause wildtype (non‐transduced) mossy fiber (MF) to abnormally innervate the cell bodies of CIC‐deleted (tdT+, transduced) CA3 neurons. Quantification of the CALB1+ MF terminal area and number in CA3 stratum pyramidale (SP) is shown on the right. Data are presented in scatter plots with error bars representing ±SD. Statistical analysis was performed using Welch's t‐test. n.s., not significant.
3.4. Dysregulation of Axon Guidance Genes During Granule Neuron Maturation in the Emx1‐Cre; Cic flox/flox Knockout Mice
To gain insights into the molecular mechanism by which CIC sculpts the MF pathway, we performed single‐nucleus RNA sequencing (snRNA‐seq) on hippocampal tissue from P19 control (Cic flox/flox ) and Emx1‐Cre; Cic flox/flox knockout mice. After quality control, we retained 17 749 nuclei from the control dataset, including 5871 granule neuron lineage cells (identified by Prox1 expression), and 16 871 nuclei from the knockout dataset, consisting of 5627 granule neuron lineage cells. Dimensionality reduction and clustering using uniform manifold approximation and projection (UMAP) revealed seven distinct granule neuron clusters (Figure 7A, Figure S5A–C, Table S1), which we categorized into three immature (imGN1–3) and four mature (mGN1–4) subsets based on their expression of the immature neuron marker Dcx and the mature neuron marker Calb1 (Figure 7B). Gene ontology (GO) analysis of cluster markers revealed that imGN1 was enriched for terms related to transcription, imGN2 and imGN3 for axon development, and mGN1–4 for synaptic transmission, supporting their maturation stages (Table S2). Strikingly, we found a dramatic reduction in the mGN4 cluster in knockout mice, while the cell numbers in other clusters were comparable (Figure 7C,D). The mGN4 cluster uniquely expressed Ntng1 (netrin G1) and Itgav (integrin alpha‐V) (Figure 7E), both with spatial and temporal expression patterns consistent with a mature granule neuron subtype [46] (Figure S5D). Similar clustering results were obtained using t‐distributed stochastic neighbor embedding (t‐SNE) as an alternative dimensionality reduction approach (Figure S5E–H).
We then compared gene expression between the control and knockout datasets and examined pathways associated with differentially expressed genes (DEGs). In Emx1‐Cre; Cic flox/flox knockout mice, we observed upregulation of CIC target genes Etv1, Etv4, and Etv5 [47] across all seven clusters, validating the knockout model and sequencing approach (Figure S6A,B). GO analysis revealed that “axonogenesis” was the most enriched term among DEGs across all clusters (Figure 7F), despite axon‐related terms not being enriched in mature granule neuron subsets (Table S2). This led us to hypothesize that axonogenesis genes may be upregulated in mature granule neurons in the knockout mice. To test this, we performed pseudotime analysis of gene expression dynamics along the granule neuron maturation trajectory (Figure 7G). This analysis confirmed Dcx expression decreased while Calb1 expression increased along pseudotime in both control and knockout mice, indicating a similar overall maturation trajectory (Figure 7H). This was further supported by similar expression trends in additional markers, including Prox1 (a general granule neuron marker), nuclear factor one (NFI) family transcription factors (preferentially expressed in immature granule neurons), and the maturation marker Bcl11b (encoding CTIP2) (Figure S6C).
GO analysis of the top 1000 DEGs along the granule neuron trajectory in control mice showed enrichment for axon‐ and synapse‐related terms (Figure 7I). Heatmap analysis of axonogenesis‐related genes in control mice revealed two patterns: genes highly expressed in immature neurons but downregulated in mature neurons (“on–off” genes) and genes upregulated during granule neuron maturation (“off–on” genes) (Figure 7J). In knockout mice, “off–on” gene expression was preserved, but the dynamics of “on–off” genes were specifically disrupted, with many being expressed later in pseudotime and remaining elevated throughout maturation. These genes included key axon guidance receptors such as Robo1, Ephb1, Dcc, and Nrp1 (Figure 7K). Although overall NRP1 immunoreactivity in the dentate gyrus and CA3 appeared comparable between control and knockout mice (Figure 7L), NRP1 aberrantly colocalized with CALB1 at ectopic MF terminals in the CA3 SP of knockout mice (Figure 7M), suggesting a potential role in misdirected MF targeting. To investigate potential upstream signals from CA3 neurons, we analyzed the expression of putative ligands for these receptors. While most ligand levels were unchanged, Slit2—a ligand for ROBO1—was downregulated, and Sema3e—a ligand for NRP1—was upregulated in knockout CA3 neurons (Figure S7A). We next asked whether the upregulation of axon‐related genes affected interactions between granule neurons and their downstream target CA3 neurons. To this end, we re‐clustered the hippocampus snRNA‐seq data to include CA3 pyramidal neurons alongside immature (imGN1–3) and mature (mGN1–4) granule neurons. Using a cell–cell communication analysis framework [31], we found that CA3 neurons exhibited increased interaction with mature granule neurons and decreased interaction with immature granule neurons in the knockout mice (Figure S7B,C). Overall, our findings suggest that CIC loss impedes the development of a specific mature granule neuron cluster and disrupts the expression dynamics of axon‐related genes, particularly those with the highest expression in immature granule neurons.
4. Discussion
Significant headway has been made in defining the mechanisms that initially establish the lamina‐specific MF pathway in the early postnatal hippocampus. But what regulates MF pathfinding in later‐born granule neurons remains elusive. Here, we demonstrate that loss of CIC in dentate gyrus granule neurons results in aberrant MF terminals in the CA3. This defect is associated with dysregulation of a distinct set of axonogenesis genes during granule neuron maturation. Our findings not only provide insights into the poorly understood process of lamina‐specific MF–CA3 circuit assembly in the juvenile and adult hippocampus but also shed light on the neurobiology of CIC‐related neurodevelopmental disorders.
In the developing hippocampus, MF axons first innervate the CA3 around P0, with their lamina‐restricted distribution established by the end of the second postnatal week [8]. This early developmental pathfinding is primarily guided by repulsive interactions between class A plexins and their semaphorin ligands [6, 9, 10]. Complete loss of semaphorin or plexin function results in global disruption of MF targeting, typically evident by P5–P10 [6, 9]. In contrast, the MF mis‐targeting phenotype in Cic knockout mice emerges after P14 without affecting the overall MF pathway, suggesting a distinct mechanism beyond semaphorin/plexin‐mediated repulsion. Indeed, aside from Nrp1, an essential co‐receptor for class 3 semaphorin signaling [48, 49, 50], we did not observe prominent dysregulation of other semaphorin or plexin family members. This suggests that semaphorin–plexin signaling establishes the initial “blueprint” for MF pathfinding during the first two postnatal weeks, while a CIC‐dependent mechanism refines MF targeting at later stages. This notion aligns with the ongoing neurogenesis of granule neurons, where new neurons born from progenitors integrate into existing hippocampal circuits, with MF targeting potentially relying on different cues in juvenile and adult‐born neurons compared to perinatally generated ones [11, 12]. Given that CIC is more highly expressed in mature granule neurons, it may play a role in refining MF terminals as neurons mature. Notably, MF axon terminals continuously remodel in response to experience and aging [51], raising the possibility that CIC may be involved in maintaining proper MF–CA3 connectivity throughout life.
We observe that CIC level is low in immature granule neurons but upregulated in mature ones, a pattern that persists from early postnatal development into adulthood [25]. The increasing prevalence of MF mis‐targeting in Cic knockout mice over time suggests a continuous role for CIC in maintaining precise MF targeting. GO analysis of cluster markers indicates a functional shift from an axonogenesis program in immature granule neurons to neurotransmission in mature neurons. Upregulation of CIC in mature granule neurons may be necessary for this transition. Pseudotime analysis supports this idea, demonstrating that in the absence of CIC, this switch is impaired, leading to the persistent expression of axonogenesis genes. Strikingly, only axonogenesis genes with an “on–off” expression pattern are disrupted, while those with an “off–on” pattern are spared, suggesting CIC plays a role in repressing specific genes as granule neurons mature. The precise contribution of these dysregulated genes to the MF mis‐targeting phenotype remains unclear. Some, like Robo1, Ephb1, Dcc, and Nrp1, are well‐known for their roles in axon guidance [3, 52, 53, 54, 55, 56, 57]. Interestingly, we also detected changes in the expression of guidance cues in CA3 pyramidal neurons of knockout mice, including downregulation of Slit2 and upregulation of Sema3e. Slit proteins serve as repulsive ligands for Robo receptors, inducing growth cone collapse and axon repulsion [58, 59]. Thus, the reduction of Slit2 in CA3 neurons may represent a compensatory response to increased Robo1 expression in knockout granule neurons. The interaction between Sema3E and its receptor plexin‐D1 is modulated by the co‐receptor NRP1; in the absence of NRP1, Sema3E functions as a repellent, whereas in its presence, it acts as an attractant [60]. Therefore, the upregulation of Nrp1 in knockout granule neurons may shift Sema3E–plexin‐D1 signaling toward attraction, potentially promoting aberrant targeting to the CA3 cell body layer. Another receptor of particular interest is Ephb1, which mediates reverse signaling in CA3 neurons to control MF pruning and targeting [34]. How upregulation of Ephb1 in mature granule neurons in the Cic knockout mice affects these processes requires further investigation. Future studies should aim to delineate the exact roles of these receptors, with a focus on their localization in granule neuron lineage cells and the signaling pathways involved.
We also uncovered a drastic reduction in a subset of mature granule neurons expressing Ntng1 in the Cic knockout mice at P19, the time of our snRNA‐seq analysis. Previous research indicates that Ntng1‐positive cells are sparse before P16 but increase significantly by P24 and become widely distributed throughout the granular layer by P37 [46]. The Ntng1‐positive cell cluster we identified likely represents an emerging subset of mature granule neurons that later become more prevalent in the dentate gyrus. The function of these Ntng1‐expressing mature granule neurons remains to be determined. Interestingly, NTNG1 and its ligand NGL‐1 have been shown to regulate lamina‐specific subdendritic segments in the entorhinal cortex to dentate gyrus pathway, whereby entorhinal cortex axons express NTNG1 while granule neuron dendrites express NGL‐1 [61]. Our data, together with data from others [46], raise the possibility that Ntng1‐expressing granule neurons may regulate lamina‐specific MF targeting in a similar fashion. The reduction of Ntng1‐expressing neurons in Cic knockout mice suggests a developmental block or delay in the maturation of this specific granule neuron subset. Whether this defect persists into adulthood and how it contributes to the MF mis‐targeting phenotype remain open questions. Importantly, gene expression trajectory analysis of multiple granule neuron maturation markers indicates that overall granule neuron development is not grossly impaired by CIC deletion. Combined with our observation that CIC loss in a subset of mature granule neurons (as modeled by Rbp4‐Cre; Cic flox/flox mice) is sufficient to induce MF mis‐targeting, these findings support a model in which CIC functions within mature granule neurons—particularly those transitioning from immature to mature states—to ensure proper MF innervation. The availability of single‐cell and single‐nucleus transcriptomic datasets, including our own, may enable the development of targeted genetic tools to dissect the functional roles of specific granule neuron subsets in MF targeting in future studies.
Individuals with the CIC‐related neurodevelopmental disorder exhibit learning disabilities, and ~30%–40% of them also have epilepsy [15, 18, 19, 22]. Given the essential role of the hippocampus in learning, memory, and seizure regulation, disruption of MF–CA3 connections and the loss of Ntng1‐expressing granule neurons may impair hippocampal function, contributing to the cognitive and epileptic phenotypes seen in these individuals. Our findings therefore not only lend new insight into hippocampus development and brain wiring, but also identify key molecular and cellular pathways that may contribute to the pathophysiology of the CIC‐related neurodevelopmental disorder.
Author Contributions
Q.T. conceptualized the project and designed experiments. All authors performed research and analyzed data. All authors wrote and edited the paper.
Conflicts of Interest
The authors declare no conflicts of interest.
Supporting information
Figures S1–S7: fsb271067‐sup‐0001‐FigureS1‐S7.docx.
Table S1: fsb271067‐sup‐0002‐TableS1.xlsx.
Table S2: fsb271067‐sup‐0003‐TableS2.xlsx.
Acknowledgments
We thank Dr. Sarah Hughes (University of Alberta, Edmonton, AB) for her assistance with confocal microscopy. We acknowledge the use of Princess Margaret Genomics Centre at the University Health Networks for single‐nucleus RNA‐seq services. The mouse strain used for this research project, B6.FVB(Cg)‐Tg(Rbp4‐cre)KL100Gsat/Mmucd, RRID:MMRRC_037128‐UCD, was obtained from the Mutant Mouse Resource and Research Center (MMRRC) at University of California at Davis, an NIH‐funded strain repository, and was donated to the MMRRC by MMRRC at University of California, Davis. Made from the original strain (MMRRC:032115) donated by Nathaniel Heintz, Ph.D., The Rockefeller University, GENSAT, and Charles Gerfen, Ph.D., National Institutes of Health, National Institute of Mental Health.
van Bruggen R., Manzanet Freyre K., Wang M., and Tan Q., “Capicua Refines Mossy Fiber–CA3 Axon Targeting in the Late Postnatal Hippocampus,” The FASEB Journal 39, no. 18 (2025): e71067, 10.1096/fj.202403229R.
Rebekah van Bruggen and Karla Manzanet Freyre co‐first authors.
Funding: Qiumin Tan receives support from the Natural Sciences and Engineering Research Council of Canada (RGPIN‐2019‐06153) and the Canada Foundation for Innovation (Award 38985). This work was supported by a grant from the Scottish Rite Charitable Foundation of Canada. Qiumin Tan is a Tier 2 Canada Research Chair in Neurodevelopmental Disorders. This study was undertaken, in part, thanks to funding from the Canada Research Chairs program.
Data Availability Statement
All data and materials for this manuscript are included in Section 2 and Supporting Information. Single‐nucleus RNA‐seq datasets have been deposited into GEO (GSE280854). This manuscript does not report original code.
References
- 1. Kolodkin A. L. and Tessier‐Lavigne M., “Mechanisms and Molecules of Neuronal Wiring: A Primer,” Cold Spring Harbor Perspectives in Biology 3 (2011): a001727. [DOI] [PMC free article] [PubMed] [Google Scholar]
- 2. Agi E., Kulkarni A., and Hiesinger P. R., “Neuronal Strategies for Meeting the Right Partner During Brain Wiring,” Current Opinion in Neurobiology 63 (2020): 1–8. [DOI] [PMC free article] [PubMed] [Google Scholar]
- 3. Stoeckli E. T., “Understanding Axon Guidance: Are We Nearly There Yet?,” Development 145 (2018): dev151415. [DOI] [PubMed] [Google Scholar]
- 4. Van Battum E. Y., Gunput R. A., Lemstra S., et al., “The Intracellular Redox Protein MICAL‐1 Regulates the Development of Hippocampal Mossy Fibre Connections,” Nature Communications 5 (2014): 4317. [DOI] [PubMed] [Google Scholar]
- 5. Evstratova A. and Toth K., “Information Processing and Synaptic Plasticity at Hippocampal Mossy Fiber Terminals,” Frontiers in Cellular Neuroscience 8 (2014): 28. [DOI] [PMC free article] [PubMed] [Google Scholar]
- 6. Suto F., Tsuboi M., Kamiya H., et al., “Interactions Between Plexin‐A2, Plexin‐A4, and Semaphorin 6A Control Lamina‐Restricted Projection of Hippocampal Mossy Fibers,” Neuron 53 (2007): 535–547. [DOI] [PubMed] [Google Scholar]
- 7. Seki T. and Rutishauser U., “Removal of Polysialic Acid‐Neural Cell Adhesion Molecule Induces Aberrant Mossy Fiber Innervation and Ectopic Synaptogenesis in the Hippocampus,” Journal of Neuroscience 18 (1998): 3757–3766. [DOI] [PMC free article] [PubMed] [Google Scholar]
- 8. Amaral D. G. and Dent J. A., “Development of the Mossy Fibers of the Dentate Gyrus: I. A Light and Electron Microscopic Study of the Mossy Fibers and Their Expansions,” Journal of Comparative Neurology 195 (1981): 51–86. [DOI] [PubMed] [Google Scholar]
- 9. Tawarayama H., Yoshida Y., Suto F., Mitchell K. J., and Fujisawa H., “Roles of Semaphorin‐6B and Plexin‐A2 in Lamina‐Restricted Projection of Hippocampal Mossy Fibers,” Journal of Neuroscience 30 (2010): 7049–7060. [DOI] [PMC free article] [PubMed] [Google Scholar]
- 10. Zhao X. F., Kohen R., Parent R., et al., “PlexinA2 Forward Signaling Through Rap1 GTPases Regulates Dentate Gyrus Development and Schizophrenia‐Like Behaviors,” Cell Reports 22 (2018): 456–470. [DOI] [PMC free article] [PubMed] [Google Scholar]
- 11. Toda T., Parylak S. L., Linker S. B., and Gage F. H., “The Role of Adult Hippocampal Neurogenesis in Brain Health and Disease,” Molecular Psychiatry 24 (2019): 67–87. [DOI] [PMC free article] [PubMed] [Google Scholar]
- 12. Kempermann G., “What Is Adult Hippocampal Neurogenesis Good for?,” Frontiers in Neuroscience 16 (2022): 852680. [DOI] [PMC free article] [PubMed] [Google Scholar]
- 13. Lipp H. P., Schwegler H., and Driscoll P., “Postnatal Modification of Hippocampal Circuitry Alters Avoidance Learning in Adult Rats,” Science 225 (1984): 80–82. [DOI] [PubMed] [Google Scholar]
- 14. Parent J. M., Yu T. W., Leibowitz R. T., Geschwind D. H., Sloviter R. S., and Lowenstein D. H., “Dentate Granule Cell Neurogenesis Is Increased by Seizures and Contributes to Aberrant Network Reorganization in the Adult Rat Hippocampus,” Journal of Neuroscience 17 (1997): 3727–3738. [DOI] [PMC free article] [PubMed] [Google Scholar]
- 15. Lu H. C., Tan Q., Rousseaux M. W., et al., “Disruption of the ATXN1‐CIC Complex Causes a Spectrum of Neurobehavioral Phenotypes in Mice and Humans,” Nature Genetics 49 (2017): 527–536. [DOI] [PMC free article] [PubMed] [Google Scholar]
- 16. Hwang I., Pan H., Yao J., Elemento O., Zheng H., and Paik J., “CIC Is a Critical Regulator of Neuronal Differentiation,” JCI Insight 5 (2020): e135826. [DOI] [PMC free article] [PubMed] [Google Scholar]
- 17. Ahmad S. T., Rogers A. D., Chen M. J., et al., “Capicua Regulates Neural Stem Cell Proliferation and Lineage Specification Through Control of Ets Factors,” Nature Communications 10 (2019): 2000. [DOI] [PMC free article] [PubMed] [Google Scholar]
- 18. Tan Q. and Zoghbi H. Y., “Mouse Models as a Tool for Discovering New Neurological Diseases,” Neurobiology of Learning and Memory 165 (2019): 106902. [DOI] [PubMed] [Google Scholar]
- 19. Kishnani S., Riley K., Mikati M. A., and Jiang Y.‐H., “Phenotypic Variability of an Inherited Pathogenic Variant in CIC Gene: A New Case Report in Two‐Generation Family and Literature Review,” Journal of Pediatric Neurology 19 (2020): 193–201. [Google Scholar]
- 20. Cao X., Wolf A., Kim S. E., et al., “CIC De Novo Loss of Function Variants Contribute to Cerebral Folate Deficiency by Downregulating FOLR1 Expression,” Journal of Medical Genetics 58 (2020): 484–494. [DOI] [PMC free article] [PubMed] [Google Scholar]
- 21. Vissers L. E., de Ligt J., Gilissen C., et al., “A De Novo Paradigm for Mental Retardation,” Nature Genetics 42 (2010): 1109–1112. [DOI] [PubMed] [Google Scholar]
- 22. Sharma S., Hourigan B., Patel Z., et al., “Novel CIC Variants Identified in Individuals With Neurodevelopmental Phenotypes,” Human Mutation 43 (2022): 889–899. [DOI] [PubMed] [Google Scholar]
- 23. Ruiz I., Wiltrout K., Stredny C., and Mahida S., “CIC‐Related Neurodevelopmental Disorder: A Review of the Literature and an Expansion of Genotype and Phenotype,” Genes 15 (2024): 1425. [DOI] [PMC free article] [PubMed] [Google Scholar]
- 24. Almutair M., Thabet F., Hundallah K., and Tabarki B., “CIC Variants and Folinic Acid‐Responsive Seizures,” Molecular Genetics and Metabolism 143 (2024): 108574. [DOI] [PubMed] [Google Scholar]
- 25. Hourigan B., Balay S. D., Yee G., Sharma S., and Tan Q., “Capicua Regulates the Development of Adult‐Born Neurons in the Hippocampus,” Scientific Reports 11 (2021): 11725. [DOI] [PMC free article] [PubMed] [Google Scholar]
- 26. van Bruggen R., Patel Z. H., Wang M., Suk T. R., Rousseaux M. W. C., and Tan Q., “A Versatile Strategy for Genetic Manipulation of Cajal‐Retzius Cells in the Adult Mouse Hippocampus,” eNeuro 10 (2023): ENEURO.0054‐23.2023. [DOI] [PMC free article] [PubMed] [Google Scholar]
- 27. Evangelista J. E., Xie Z., Marino G. B., Nguyen N., Clarke D. J. B., and Ma'ayan A., “Enrichr‐KG: Bridging Enrichment Analysis Across Multiple Libraries,” Nucleic Acids Research 51 (2023): W168–W179. [DOI] [PMC free article] [PubMed] [Google Scholar]
- 28. Qiu X., Mao Q., Tang Y., et al., “Reversed Graph Embedding Resolves Complex Single‐Cell Trajectories,” Nature Methods 14 (2017): 979–982. [DOI] [PMC free article] [PubMed] [Google Scholar]
- 29. Trapnell C., Cacchiarelli D., Grimsby J., et al., “The Dynamics and Regulators of Cell Fate Decisions Are Revealed by Pseudotemporal Ordering of Single Cells,” Nature Biotechnology 32 (2014): 381–386. [DOI] [PMC free article] [PubMed] [Google Scholar]
- 30. Cao J., Spielmann M., Qiu X., et al., “The Single‐Cell Transcriptional Landscape of Mammalian Organogenesis,” Nature 566 (2019): 496–502. [DOI] [PMC free article] [PubMed] [Google Scholar]
- 31. Dimitrov D., Turei D., Garrido‐Rodriguez M., et al., “Comparison of Methods and Resources for Cell‐Cell Communication Inference From Single‐Cell RNA‐Seq Data,” Nature Communications 13 (2022): 3224. [DOI] [PMC free article] [PubMed] [Google Scholar]
- 32. Tian C., Gong Y., Yang Y., et al., “Foxg1 Has an Essential Role in Postnatal Development of the Dentate Gyrus,” Journal of Neuroscience 32 (2012): 2931–2949. [DOI] [PMC free article] [PubMed] [Google Scholar]
- 33. Gorski J. A., Talley T., Qiu M., Puelles L., Rubenstein J. L., and Jones K. R., “Cortical Excitatory Neurons and Glia, but Not GABAergic Neurons, Are Produced in the Emx1‐Expressing Lineage,” Journal of Neuroscience 22 (2002): 6309–6314. [DOI] [PMC free article] [PubMed] [Google Scholar]
- 34. Liu X. D., Zhu X. N., Halford M. M., Xu T. L., Henkemeyer M., and Xu N. J., “Retrograde Regulation of Mossy Fiber Axon Targeting and Terminal Maturation via Postsynaptic Lnx1,” Journal of Cell Biology 217 (2018): 4007–4024. [DOI] [PMC free article] [PubMed] [Google Scholar]
- 35. Wenzel H. J., Cole T. B., Born D. E., Schwartzkroin P. A., and Palmiter R. D., “Ultrastructural Localization of Zinc Transporter‐3 (ZnT‐3) to Synaptic Vesicle Membranes Within Mossy Fiber Boutons in the Hippocampus of Mouse and Monkey,” Proceedings of the National Academy of Sciences of the United States of America 94 (1997): 12676–12681. [DOI] [PMC free article] [PubMed] [Google Scholar]
- 36. Sindreu C., Palmiter R. D., and Storm D. R., “Zinc Transporter ZnT‐3 Regulates Presynaptic Erk1/2 Signaling and Hippocampus‐Dependent Memory,” Proceedings of the National Academy of Sciences of the United States of America 108 (2011): 3366–3370. [DOI] [PMC free article] [PubMed] [Google Scholar]
- 37. Apostolo N., Smukowski S. N., Vanderlinden J., et al., “Synapse Type‐Specific Proteomic Dissection Identifies IgSF8 as a Hippocampal CA3 Microcircuit Organizer,” Nature Communications 11 (2020): 5171. [DOI] [PMC free article] [PubMed] [Google Scholar]
- 38. Pieribone V. A., Porton B., Rendon B., Feng J., Greengard P., and Kao H. T., “Expression of Synapsin III in Nerve Terminals and Neurogenic Regions of the Adult Brain,” Journal of Comparative Neurology 454 (2002): 105–114. [DOI] [PubMed] [Google Scholar]
- 39. Gerfen C. R., Paletzki R., and Heintz N., “GENSAT BAC Cre‐Recombinase Driver Lines to Study the Functional Organization of Cerebral Cortical and Basal Ganglia Circuits,” Neuron 80 (2013): 1368–1383. [DOI] [PMC free article] [PubMed] [Google Scholar]
- 40. Gong S., Zheng C., Doughty M. L., et al., “A Gene Expression Atlas of the Central Nervous System Based on Bacterial Artificial Chromosomes,” Nature 425 (2003): 917–925. [DOI] [PubMed] [Google Scholar]
- 41. Lorente‐Echeverría B., Daaboul D., Vandensteen J., et al., “A Dynamic Gene Regulatory Code Drives Synaptic Development of Hippocampal Granule Cells,” bioRxiv, 2025, 2025.2003.2027.645686.
- 42. Nakazawa K., Quirk M. C., Chitwood R. A., et al., “Requirement for Hippocampal CA3 NMDA Receptors in Associative Memory Recall,” Science 297 (2002): 211–218. [DOI] [PMC free article] [PubMed] [Google Scholar]
- 43. Ubina T., Vahedi‐Hunter T., Agnew‐Svoboda W., et al., “ExBoX—A Simple Boolean Exclusion Strategy to Drive Expression in Neurons,” Journal of Cell Science 134 (2021): 1–15. [DOI] [PMC free article] [PubMed] [Google Scholar]
- 44. Kim J. Y., Grunke S. D., Levites Y., Golde T. E., and Jankowsky J. L., “Intracerebroventricular Viral Injection of the Neonatal Mouse Brain for Persistent and Widespread Neuronal Transduction,” Journal of Visualized Experiments 91 (2014): 51863. [DOI] [PMC free article] [PubMed] [Google Scholar]
- 45. Kim J. Y., Ash R. T., Ceballos‐Diaz C., et al., “Viral Transduction of the Neonatal Brain Delivers Controllable Genetic Mosaicism for Visualising and Manipulating Neuronal Circuits In Vivo,” European Journal of Neuroscience 37 (2013): 1203–1220. [DOI] [PMC free article] [PubMed] [Google Scholar]
- 46. Hochgerner H., Zeisel A., Lonnerberg P., and Linnarsson S., “Conserved Properties of Dentate Gyrus Neurogenesis Across Postnatal Development Revealed by Single‐Cell RNA Sequencing,” Nature Neuroscience 21 (2018): 290–299. [DOI] [PubMed] [Google Scholar]
- 47. Lee Y., “Regulation and Function of Capicua in Mammals,” Experimental & Molecular Medicine 52 (2020): 531–537. [DOI] [PMC free article] [PubMed] [Google Scholar]
- 48. Kolodkin A. L., Levengood D. V., Rowe E. G., Tai Y. T., Giger R. J., and Ginty D. D., “Neuropilin Is a Semaphorin III Receptor,” Cell 90 (1997): 753–762. [DOI] [PubMed] [Google Scholar]
- 49. He Z. and Tessier‐Lavigne M., “Neuropilin Is a Receptor for the Axonal Chemorepellent Semaphorin III,” Cell 90 (1997): 739–751. [DOI] [PubMed] [Google Scholar]
- 50. Takahashi T., Fournier A., Nakamura F., et al., “Plexin‐Neuropilin‐1 Complexes Form Functional Semaphorin‐3A Receptors,” Cell 99 (1999): 59–69. [DOI] [PubMed] [Google Scholar]
- 51. Galimberti I., Gogolla N., Alberi S., Santos A. F., Muller D., and Caroni P., “Long‐Term Rearrangements of Hippocampal Mossy Fiber Terminal Connectivity in the Adult Regulated by Experience,” Neuron 50 (2006): 749–763. [DOI] [PubMed] [Google Scholar]
- 52. Seeger M. A. and Beattie C. E., “Attraction Versus Repulsion: Modular Receptors Make the Difference in Axon Guidance,” Cell 97 (1999): 821–824. [DOI] [PubMed] [Google Scholar]
- 53. Evans T. A. and Bashaw G. J., “Axon Guidance at the Midline: Of Mice and Flies,” Current Opinion in Neurobiology 20 (2010): 79–85. [DOI] [PMC free article] [PubMed] [Google Scholar]
- 54. Castellani V., “Building Spinal and Brain Commissures: Axon Guidance at the Midline,” International Scholarly Research Notices 2013 (2013): 315387. [Google Scholar]
- 55. Van Battum E. Y., Brignani S., and Pasterkamp R. J., “Axon Guidance Proteins in Neurological Disorders,” Lancet Neurology 14 (2015): 532–546. [DOI] [PubMed] [Google Scholar]
- 56. Verhagen M. G. and Pasterkamp R. J., “Chapter 5—Axon Guidance: Semaphorin/Neuropilin/Plexin Signaling,” in Cellular Migration and Formation of Axons and Dendrites, 2nd ed., ed. Rubenstein J., Rakic P., Chen B., Kwan K. Y., Kolodkin A., and Anton E. (Academic Press, 2020), 109–122. [Google Scholar]
- 57. Weth F. and Kania A., “Chapter 6—Ephrin/Eph Signaling in Axon Guidance,” in Cellular Migration and Formation of Axons and Dendrites, 2nd ed., ed. Rubenstein J., Rakic P., Chen B., Kwan K. Y., Kolodkin A., and Anton E. (Academic Press, 2020), 123–146. [Google Scholar]
- 58. Brose K., Bland K. S., Wang K. H., et al., “Slit Proteins Bind Robo Receptors and Have an Evolutionarily Conserved Role in Repulsive Axon Guidance,” Cell 96 (1999): 795–806. [DOI] [PubMed] [Google Scholar]
- 59. Nguyen Ba‐Charvet K. T., Brose K., Marillat V., et al., “Slit2‐Mediated Chemorepulsion and Collapse of Developing Forebrain Axons,” Neuron 22 (1999): 463–473. [DOI] [PubMed] [Google Scholar]
- 60. Chauvet S., Cohen S., Yoshida Y., et al., “Gating of Sema3E/PlexinD1 Signaling by Neuropilin‐1 Switches Axonal Repulsion to Attraction During Brain Development,” Neuron 56 (2007): 807–822. [DOI] [PMC free article] [PubMed] [Google Scholar]
- 61. Nishimura‐Akiyoshi S., Niimi K., Nakashiba T., and Itohara S., “Axonal Netrin‐Gs Transneuronally Determine Lamina‐Specific Subdendritic Segments,” Proceedings of the National Academy of Sciences of the United States of America 104 (2007): 14801–14806. [DOI] [PMC free article] [PubMed] [Google Scholar]
Associated Data
This section collects any data citations, data availability statements, or supplementary materials included in this article.
Supplementary Materials
Figures S1–S7: fsb271067‐sup‐0001‐FigureS1‐S7.docx.
Table S1: fsb271067‐sup‐0002‐TableS1.xlsx.
Table S2: fsb271067‐sup‐0003‐TableS2.xlsx.
Data Availability Statement
All data and materials for this manuscript are included in Section 2 and Supporting Information. Single‐nucleus RNA‐seq datasets have been deposited into GEO (GSE280854). This manuscript does not report original code.