

ABSTRACT
The early postnatal period is critical for cortical development, with prematurity disrupting neurodevelopmental trajectories and increasing long‐term vulnerability. However, cortical morphological and morphometric similarity network (MSN) research in East Asian preterm neonates is limited. Using structural MRI in 159 Chinese neonates (109 preterm [median GA at birth: 34.6 weeks], 50 term [median GA at birth: 38.8 weeks]) scanned at near‐term equivalent PMA (36–42 weeks), we analyzed cortical morphometry and constructed individualized MSNs. Compared to term neonates, preterm neonates exhibited significant region‐specific morphological alterations: reduced surface area in the left precuneus and supramarginal gyrus, decreased mean curvature in the left inferior parietal, parahippocampal, and right superior temporal cortices, and increased cortical thickness in the right caudal middle frontal gyrus (FDR‐corrected p < 0.05). Within preterm neonates, surface area and gray matter volume showed widespread positive correlations with PMA at scan (FDR‐corrected p < 0.05 in multiple regions). Regional MSN analysis revealed significantly increased morphometric similarity in the right medial orbitofrontal cortex (FDR‐corrected p = 0.026). Although global MSN topology showed no statistically significant group differences, preterm neonates displayed trends suggesting reduced MSN‐based integration and segregation, reflecting less coordinated cortical morphological patterns across distant and local regions. Within the preterm group, developmental analysis indicated progressive trends toward enhanced global MSN integration and segregation with increasing PMA, alongside a significant decrease in betweenness centrality within the right precuneus (Spearman's ρ = −0.337). This study comprehensively characterizes cortical morphology and MSN development in East Asian preterm neonates, identifying region‐specific disruptions and dynamic postnatal cortical morphological and network maturation trajectories.
Keywords: brain development, cortical morphology, graph theory, morphometric similarity network, preterm neonates
This first characterization of cortical morphology and morphometric similarity network (MSN) development in East Asian preterm neonates reveals enhanced regional morphometric similarity in the right medial orbitofrontal cortex and reduced MSN‐based global network integration and segregation during early postnatal development.

Summary.
First characterization of cortical morphology and MSN development in East Asian preterm neonates.
Preterm neonates showed enhanced regional morphometric similarity in the right medial orbitofrontal cortex.
Preterm neonates exhibited a trend toward reduced MSN‐based integration and segregation, reflecting less coordinated cortical morphological patterns across regions.
1. Introduction
The human brain undergoes profound anatomical and functional changes during early development, particularly from the final trimester of gestation through the first two postnatal years (Gilmore et al. 2018; Kostović et al. 2019; Li et al. 2019). Critical neurodevelopmental processes—such as rapid dendritic arborization, synaptogenesis, thalamocortical afferent ingrowth, the disappearance of radial glia, and the dissolution of the subplate—collectively drive cortical expansion and increase cytoarchitectural complexity (Sidman and Rakic 1973; Kostović and Jovanov‐Milosević 2006). Given the importance of this period, the cerebral cortex is especially vulnerable to disruption; deviations in these developmental processes may result in atypical cortical maturation, potentially leading to long‐term behavioral and cognitive consequences (Volpe 2019). Premature birth, defined as delivery before 37 weeks of gestation, can dramatically alter the normal trajectory of cortical development. It is frequently associated with both structural and functional brain abnormalities and is a well‐established risk factor for adverse neurodevelopmental outcomes (Lapidaire et al. 2024; Kelly et al. 2022). As such, detailed characterization of cortical morphology in preterm neonates is essential for comprehending their neurodevelopmental challenges and for informing early intervention strategies.
Quantifying myeloarchitectural and cytoarchitectural development in living neonates remains challenging. However, magnetic resonance imaging (MRI)‐based methods offer a powerful, non‐invasive approach to study these complex processes in vivo. Quantitative MRI‐derived metrics—including cortical surface area (SA), thickness, and volume—provide valuable insights into brain developmental trajectories (Kelly et al. 2024; Bethlehem et al. 2022; Moeskops et al. 2015). Furthermore, microstructural and morphological brain features measured during the neonatal period have been shown to predict motor and cognitive outcomes in preterm neonates during infancy and later childhood (Ullman et al. 2015; Pannek et al. 2020).
The human brain functions as a highly integrated network, relying on coordinated synaptic connectivity to support complex cognition and behavior (Pessoa 2014). With the emergence of the “human connectome” concept, structural MRI has increasingly been used to construct brain morphological networks, providing a novel framework to investigate brain morphological connectivity (Sporns 2013; Cai et al. 2023; Wang and He 2024). Early approaches such as population‐level structural covariance networks (SCNs) were limited by their reliance on single morphometric features, hindering individualized analyses and biological interpretability (Carmon et al. 2020; Hosseini et al. 2012). To overcome these limitations, Seidlitz et al. introduced the morphometric similarity network (MSN) approach, which integrates multiple morphometric features to construct individualized morphological networks (Seidlitz et al. 2018). By combining both macro‐ and micro‐scale information, MSNs offer a richer representation of cortical organization. Notably, MSN structures have been found to correspond with patterns of gene co‐expression linked to cortical architecture and neuronal function (Seidlitz et al. 2018; Fenchel et al. 2020). This method has since been widely applied in psychiatric research, as well as in studies of brain development and aging (Zhao et al. 2023; Wang et al. 2024; Niu et al. 2024; Joo et al. 2024; Xu et al. 2025). In perinatal research, Galdi et al. were the first to employ MSNs to predict neonatal brain age and examine anatomical variability associated with prematurity (Galdi et al. 2020). Subsequently, Fenchel et al. extended this approach, employing MSN to map the cortical structure of the neonatal brain, thereby advancing our understanding of its developmental trajectory (Fenchel et al. 2020). They further demonstrated that MSNs of healthy term neonates could be used to predict developmental outcomes at 18 months (Fenchel et al. 2022). More recently, graph theory‐based analyses using MSN have provided detailed insights into cortical morphological development during the perinatal period (Wang et al. 2024). Collectively, these studies highlight the potential of MSNs in characterizing early brain development. However, much of the existing work relies on datasets from the Developing Human Connectome Project (dHCP), which primarily represents Western populations. As a result neurodevelopmental trajectories in East Asian preterm neonates remain underexplored. Although some small‐sample studies have reported topological alterations in morphological networks of preterm neonates, comprehensive analyses of cortical morphological characteristics in this population are still limited (Wang et al. 2024). To address this gap, we constructed individualized MSNs in a large cohort of Chinese preterm neonates using structural MRI data acquired at near‐term age. We compared morphometric features and graph‐theoretic network properties between preterm and term neonates and depicted the developmental trajectories of these properties in preterm neonates across the postmenstrual age (PMA) at scan range of 36–42 weeks. This work aims to provide new insights into the cortical morphological development of East Asian preterm neonates and inform future clinical strategies for early neurodevelopmental support.
2. Materials and Methods
2.1. Participants
This study was approved by the Ethics Committee of the Children's Hospital. Written informed consent was obtained from the parents of all participants. A total of 371 neonates were recruited between January 2023 and September 2024 at the Children's Hospital. Demographic information collected for each participant included gestational age (GA) at birth, PMA at scan, birth weight, and sex. To investigate cortical morphology in relatively healthy preterm neonates, the following strict exclusion criteria were applied: (1) Neonates with neurological disorders (e.g., brain injury, intracranial hemorrhage, encephalitis, brain cysts, hydrocephalus), perinatal complications (e.g., respiratory failure, severe birth asphyxia, intrauterine growth restriction), major congenital diseases, or a history of surgery (n = 166); (2) Participants with missing or poor‐quality T1‐weighted imaging (T1WI) (n = 3); (3) Individuals with poor segmentation quality (n = 5); (4) Individuals with severe head motion during scanning (n = 12); (5) Individuals with PMA at scan outside the range of 36–42 weeks (n = 13); (6) In cases where both twins met the inclusion criteria, the one with lower birth weight was excluded to minimize bias from shared genetic and environmental factors (n = 13). After applying these criteria, 159 neonates were included in the final analysis, comprising 50 term and 109 preterm neonates. A detailed flowchart of the inclusion and exclusion criteria is illustrated in Figure 1a, and the distribution of PMA at scan for both groups is shown in Figure 1b.
FIGURE 1.

Flowchart of study population selection and distribution of postmenstrual age at scan. (a) Stepwise illustration of the inclusion and exclusion criteria applied to the study cohort. (b) Distribution of PMA at scan for all included neonates (preterm and term groups).
2.2. MRI Acquisition and Data Preprocessing
MRI scans were performed using a 3.0 T scanner (uMR890, United Imaging, Shanghai, China) equipped with a standard 64‐channel adult head coil at the Children's Hospital. Although neonatal neuroimaging studies often favor T2‐weighted imaging due to its sensitivity to white matter water content, this study utilized high‐resolution 3D T1WI for three key reasons: (1) The gradient echo fast spoiled gradient echo (GRE‐FSP) sequence with 0.8 mm isotropic resolution provides superior anatomical detail for cortical surface reconstruction; (2) The United Imaging deep learning segmentation model used in this study is optimized specifically for neonatal T1WI data; (3) The combination of real‐time motion monitoring and advanced preprocessing pipelines effectively mitigates T1WI's known susceptibility to motion artifact in neonates.
To minimize head motion, foam padding and noise‐canceling headphones were used during scanning, and participants' sleep schedules were adjusted to encourage natural sleep throughout the procedure. All MRI scans were performed within a controlled PMA window of 36–42 weeks for both term and preterm neonates, ensuring that preterm neonates were scanned at near‐term‐equivalent developmental stages. This standardization allowed us to control for rapid cortical developmental changes occurring during this critical period.
T1WI was acquired with the following parameters: repetition time = 6.7 ms, echo time = 2.3 ms, flip angle = 8°, acquisition matrix = 320 × 300, field of view = 256 × 240 mm, slice thickness = 0.8 mm, and voxel size = 0.8 × 0.8 × 0.8 mm. Real‐time motion monitoring was implemented using the scanner's built‐in Motion Curve system, which automatically flagged scans with head displacements exceeding 0.5 mm.
All scans were reviewed by two experienced neuroradiologists to exclude cases with poor image quality, excessive head motion, or abnormal cranial structure. Structural MRI preprocessing pipeline included the following steps: (1) Image format conversion; (2) Tissue segmentation using the United Imaging deep learning model, which robustly identified white matter, gray matter, and cerebrospinal fluid; (3) Cortical surface reconstruction using infant Freesurfer software (version 7.1.1; https://surfer.nmr.mgh.harvard.edu/fswiki/infantFS) (Zöllei et al. 2020); (4) Manual quality control of segmentation and reconstruction outputs by a neuroradiologist.
2.3. Extraction of Cortical Morphometric Features
Surface‐based morphometry was used to extract cortical morphometric features for each participant, including: SA, mean curvature (MC), Gauss curvature (GC), sulcal depth (SD), cortical thickness (CT), and gray matter volume (GMV). The neonatal cortex was parcellated into 68 regions (34 per hemisphere) based on the Desikan‐Killiany (DK) atlas. For each participant, regional average values were computed for each morphometric feature across the 68 cortical regions.
2.4. Construction of Morphometric Similarity Network
Based on the extracted cortical features, five morphometric indices—SA, MC, GC, CT, and GMV—were selected for MSN construction (Niu et al. 2024; Long et al. 2023). For each neonate, the feature values were standardized using Z‐scores across regions. Then, Pearson correlation coefficients were computed between all pairs of cortical regions based on the five‐feature vectors, resulting in an individualized 68 × 68 MSN matrix. The regional morphometric similarity for each brain region was calculated as the average of correlation values between that region and the remaining 67 regions. To evaluate the stability of the MSN construction, a leave‐one‐feature‐out method was applied, as described in Figure S1.
2.5. Network Property Analysis
Graph‐theoretical analysis was conducted on individual MSNs to characterize their topological organization. A sparsity threshold range of 0.28–0.40, with a step size of 0.01, was selected to minimize information redundancy while preserving meaningful network structure. The lower bound (0.28) ensured that each node was connected to at least one other node, thereby preventing network fragmentation (Zhao et al. 2023). The upper bound (0.40) ensured that the small‐worldness index (Sigma) remained above 1.1 for all participants. In line with established practices in morphological network studies, self‐connections and negative connections were excluded prior to graph‐theoretical analysis (Wang et al. 2024; Xu et al. 2025; Zheng et al. 2020). Only positive correlations were retained to ensure the biological plausibility and mathematical stability of network topology metrics. Notably, this exclusion was applied only to the calculation of global and nodal graph measures. In contrast, all pairwise morphometric similarity values—including negative correlations—were retained in regional analyses and statistical comparisons, thereby preserving relevant information about cortical dissimilarity. Graph‐theoretical metrics of the weighted MSN were calculated using the Graph‐theoretical Network Analysis (GRETNA) toolbox (Wang et al. 2015). Global metrics included characteristic path length (Lp), global efficiency (Eg), clustering coefficient (Cp), local efficiency (Eloc), and Sigma. Nodal metrics included betweenness centrality (Bc) and degree centrality (Dc). Calculations of all metrics followed those of previous studies (He et al. 2008; Rubinov and Sporns 2010). It is important to note that unlike functional or diffusion‐based structural networks—where edges represent direct physical or information‐transmitting connections—MSNs reflect morphometric similarity between regions. Therefore, interpretations of graph‐theoretical metrics in this context require careful adaptation. To support clarity, we summarize conventional definitions and their analogous interpretations in MSNs in Table 1. To ensure robustness and mitigate sparsity dependence, area under the curve (AUC) values were computed across the full sparsity range for all global and nodal metrics. These AUC values served as the basis for all subsequent statistical analyses.
TABLE 1.
Interpretation of graph metrics in conventional brain networks versus morphometric similarity networks.
| Graph metric | Conventional interpretation (functional/structural networks) | Interpretation in MSN (morphometric similarity network) |
|---|---|---|
| Characteristic path length (Lp) | Average shortest path length between all node pairs; reflects global integration efficiency. | Integration of morphometric similarity across brain regions; shorter Lp suggests regions are linked via morphologically similar bridges. |
| Global efficiency (Eg) | Average inverse shortest path length; higher Eg indicates faster information transfer across the network (integration). | Indicates the brain‐wide integration of morphometric similarity; high Eg suggests that any two regions are connected via morphologically similar shortcuts. |
| Clustering coefficient (Cp) | Measures the interconnectedness among a node's neighbors; indicates local clustering or network tightness (segregation). | Reflects the cohesion among regions morphologically similar to a given region; high Cp suggests mutual similarity among them. |
| Local efficiency (Eloc) | Efficiency of information exchange among a node's neighbors; indicates local information processing ability (segregation). | Reflects the consistency and redundancy of morphometric features among a node's neighbors. High Eloc suggests stable local morphometric similarity. |
| Small‐worldness index (Sigma) | Ratio of normalized Cp to normalized Lp; Sigma > 1.1 indicates small‐worldness topology. | Combines high local morphometric clustering (high Cp) with efficient global integration (low Lp). Sigma > 1.1 indicates small‐worldness organization of morphometric features. |
| Degree centrality (Dc) | Reflects the number of direct connections of a node, indicating its influence or activity; nodes with high Dc are often network hubs. | Reflects the average morphometric similarity of a brain region to others; high Dc indicates resemblance to multiple regions. |
| Betweenness centrality (Bc) | Frequency with which a node lies on shortest paths between others; high Bc indicates a bridging role in the network. | Indicates the role of a brain region in linking morphometric similarity among others; high Bc suggests it connects regions with differing morphometric features. |
2.6. Statistical Analysis
All statistical analyses were performed using R software (version 4.2.3). Group differences in demographic characteristics (e.g., birth weight, PMA at scan, sex) between term and preterm neonates were assessed using the Mann–Whitney U test for continuous variables and the Chi‐square test for categorical variables. To examine developmental associations within each group, partial Spearman correlations were conducted separately in preterm and term neonates. For cortical morphometric features, correlations with PMA at scan were adjusted for GA at birth, sex, and estimated total intracranial volume (eTIV). For graph‐theoretical metrics, correlations were adjusted for GA at birth and sex. These within‐group analyses aimed to characterize developmental variation rather than between‐group comparison. Group comparisons of brain features were performed using analysis of covariance (ANCOVA) to account for differences in PMA at scan between groups. Specifically, ANCOVA models for morphometric features included PMA at scan, sex, and eTIV as covariates; models for regional MSN measures and graph‐theoretical metrics included PMA at scan and sex. This approach ensured that group differences reflected effects beyond those attributable to differences in PMA at scan. Multiple comparisons were corrected using the false discovery rate (FDR) method. A two‐tailed threshold of p < 0.05 (FDR‐corrected) was considered statistically significant.
3. Results
3.1. Demographic Characteristics
Demographic characteristics of the study sample are summarized in Table 2. A total of 159 neonates were included, comprising 50 term neonates (GA at birth: 37–41 weeks) and 109 preterm neonates (GA at birth: 26–36 weeks). Sex distribution was comparable between the two groups (χ 2 = 1.307, p = 0.304). Due to earlier postnatal clinical care, most preterm neonates underwent MRI closer to full‐term age; nonetheless, their PMA at scan remained significantly lower than that of term neonates (Z = −8.808, p < 0.001).
TABLE 2.
Demographic characteristics of term and preterm neonates.
| Characteristics | All (n = 159) | Term (n = 50) | Preterm (n = 109) | p |
|---|---|---|---|---|
| GA at birth (weeks) | 35.1 (33.7, 37.7) | 38.8 (38.0, 39.8) | 34.6 (32.5, 35.3) | p < 0.001 |
| Birth weight (grams) | 2350 (1950, 3000) | 3375 (3000, 3508) | 2100 (1655, 2385) | p < 0.001 |
| PMA at scan (weeks) | 37.9 (36.9, 39.3) | 40.0 (38.9, 41.0) | 37.1 (36.7, 38.1) | p < 0.001 |
| Sex (M/F) | 88/71 | 31/19 | 57/52 | p = 0.304 |
Abbreviations: F, female; GA, gestational age; M, male; PMA, postmenstrual age.
3.2. Group Differences in Morphometric Features Between Preterm and Term Neonates
We compared five cortical morphometric features—SA, MC, SD, CT, and GMV—between preterm and term neonates. Regional group differences are presented in Figure 2 and detailed in Table S1. After FDR correction, term neonates exhibited significantly greater SA in the left precuneus (t = 3.548, p = 0.018) and left supramarginal gyrus (t = 3.643, p = 0.018). MC was notably higher in three regions in term neonates: the left inferior parietal (t = 3.512, p = 0.015), left parahippocampal (t = 3.486, p = 0.015), and right superior temporal cortices (t = 3.550, p = 0.015). Conversely, CT was significantly lower in term neonates in the right caudal middle frontal gyrus (t = −3.822, p = 0.013).
FIGURE 2.
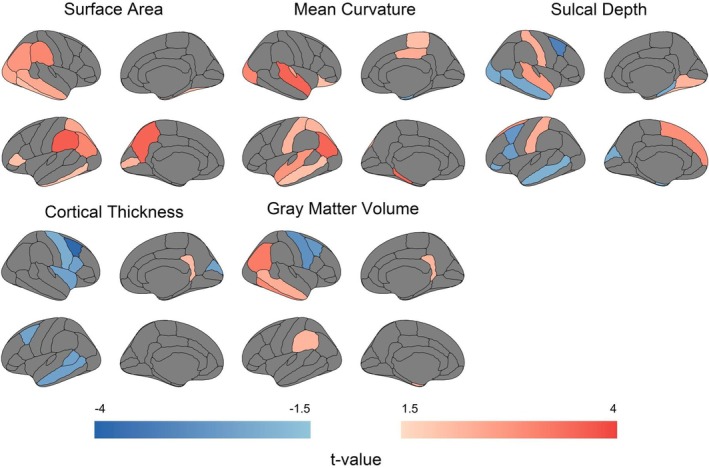
Group differences in morphometric features between preterm and term neonates. Region‐wise comparison of five morphometric features (SA, MC, SD, CT, GMV) between term and preterm neonates, visualized as t‐maps (p < 0.05, uncorrected). Analyses were adjusted for PMA at scan, sex, and eTIV. The color bar represents t‐values, with warm colors indicating higher values in term neonates and cool colors indicating higher values in preterm neonates.
3.3. Developmental Associations Between Morphometric Features and PMA at Scan in Preterm Neonates
To explore developmental patterns, we examined correlations between each of the five cortical morphometric features and PMA at scan in preterm neonates. Results are visualized in Figure 3 and reported in Table S2. Both SA and GMV showed widespread positive correlations with PMA at scan across numerous cortical regions. MC and CT demonstrated localized positive correlations in select regions. SD showed mixed trends, with both positive and negative correlations depending on region. After FDR correction, several of these associations remained statistically significant (Table S2). As the focus of this analysis is on preterm neonates, PMA‐related analyses in term neonates are presented in Figure S2 and Table S3 for completeness.
FIGURE 3.

Association between morphometric features and PMA at scan in preterm neonates. Partial Spearman correlation analysis was performed to assess the relationship between morphometric features and PMA at scan, adjusting for GA at birth, sex, and eTIV. The color bar represents Spearman's ρ values, where red indicates a positive correlation and blue indicates a negative correlation. Results are presented without correction for multiple comparisons.
3.4. Group Differences in Regional MSN Between Preterm and Term Neonates
We computed mean regional morphometric similarity for each cortical region and compared values between groups (Figure 4, Table S4). Preterm neonates exhibited higher regional morphometric similarity in the left caudal anterior cingulate and right medial orbitofrontal cortices and lower similarity in the left inferior parietal and left superior temporal regions. Among these regions, only the increased similarity in the right medial orbitofrontal cortex remained statistically significant after FDR correction (t = −3.634, p = 0.026).
FIGURE 4.

Group differences in regional MSN between preterm and term neonates. (a, b) Mean regional MSN values in term and preterm neonates, with warm and cool colors representing higher and lower morphometric similarity, respectively. (c) Region‐wise t‐map comparing regional MSN values between groups (p < 0.05, uncorrected), adjusted for PMA at scan and sex.
3.5. Group Differences in Topological Properties Between Preterm and Term Neonates
Graph‐theoretical analysis of global topological metrics (AUC‐based) revealed no statistically significant group differences. Specifically, comparisons yielded the following results: Sigma (t = 0.687, p = 0.493), Lp (t = −0.333, p = 0.739), Eg (t = 0.340, p = 0.734), Cp (t = 0.843, p = 0.401), and Eloc (t = 0.756, p = 0.451) (Figure 5). Although these differences were not significant, preterm neonates exhibited trends suggestive of reduced network integration and segregation. Higher Lp and lower Eg suggested reduced global integration, while lower Cp and Eloc indicated diminished network segregation. Nodal‐level metrics were also analyzed, but no statistically significant differences were identified after FDR correction (Table S5).
FIGURE 5.

Group differences in global network metrics between preterm and term neonates. Comparison of area under the curve (AUC) values for global topological metrics—including Sigma, characteristic path length (Lp), global efficiency (Eg), clustering coefficient (Cp), and local efficiency (Eloc)—between the two groups, adjusted for PMA at scan and sex. Arrow annotations (“↑” or “↓”) highlight the direction of group differences for preterm neonates relative to term neonates.
3.6. Developmental Associations Between Topological Properties and PMA at Scan in Preterm Neonates
To characterize network development, we examined the relationship between PMA at scan and global topological features in the preterm group (Figure 6). The AUC values for Sigma, Eg, Cp, and Eloc exhibited positive associations with PMA at scan, whereas Lp showed a negative trend. Although none of these associations reached statistical significance, the observed trends suggest progressive improvements in network integration and segregation with increasing PMA. As the focus of this analysis is on preterm neonates, PMA‐related analyses in term neonates are presented in Figure S3 for completeness. At the regional level, several nodal metrics were found to correlate with PMA at scan (Figure 7, Table S6). After FDR correction, a statistically significant negative correlation was observed between Bc and PMA in the right precuneus (Spearman's ρ = −0.337, p = 0.023).
FIGURE 6.

Associations between global network metrics and PMA at scan in preterm neonates. Partial Spearman correlation analyses assessing relationships between AUC‐based global network metrics and PMA at scan, controlling for GA at birth and sex.
FIGURE 7.

Associations between nodal network metrics and PMA at scan in preterm neonates. Partial Spearman correlation analyses of nodal network metrics and PMA at scan, adjusted for GA at birth and sex. The color bar represents Spearman's ρ values, with red indicating positive and blue indicating negative correlations. Results are presented without correction for multiple comparisons.
4. Discussion
Cortical morphology undergoes substantial and dynamic changes during the postnatal period, with region‐specific developmental trajectories. This study advances the current understanding of early cortical development by identifying altered morphometric features in preterm neonates and revealing region‐specific age‐related changes across the PMA window. In addition, regional MSN analysis revealed significantly increased regional morphometric similarity in the right medial orbitofrontal cortex (mOFC) in preterm neonates compared to their counterparts. Although no statistically significant group differences were observed in global topological properties, preterm neonates showed a trend toward reduced network integration and segregation. Importantly, within the preterm group, we observed age‐dependent increases in global integration and segregation metrics with advancing PMA. At the nodal level, Bc in the right precuneus showed a significant negative correlation with PMA. Together, these findings provide new insights into early cortical morphological and network alterations associated with prematurity in East Asian neonates and underscore the value of morphological network analysis in characterizing early brain development.
Previous studies utilizing neonatal data from the dHCP database have typically excluded participants with elevated radiological scores indicative of structural brain abnormalities (https://biomedia.github.io/dHCP‐release‐notes/structure.html) (Wang et al. 2024; Li et al. 2022). In contrast, our study adopted a more stringent selection strategy. Beyond excluding neonates with radiological abnormalities, we also removed those with significant clinical risk factors, including respiratory failure, severe birth asphyxia, and intrauterine growth retardation. This rigorous screening process enabled us to assemble a cohort of relatively “healthy” preterm neonates, thereby providing a clearer representation of normative developmental patterns within this population and reducing potential confounding from severe medical comorbidities.
Our study revealed significant cortical morphometric differences between preterm and term neonates in an East Asian cohort, confirming key patterns reported in predominantly Western populations while highlighting potential population‐specific variations. Specifically, we observed reduced SA in the left precuneus and left supramarginal gyrus, consistent with established findings of globally reduced SA in preterm neonates (Ajayi‐Obe et al. 2000; Engelhardt et al. 2014). We also found increased CT in the right caudal middle frontal gyrus, corroborating observations of CT elevation in frontal and other regions (Li et al. 2022; Dimitrova et al. 2021). Reduced MC in the left inferior parietal lobe, parahippocampal gyrus, and right superior temporal gyrus aligned with reports of altered MC in preterm neonates (Dimitrova et al. 2021). Furthermore, GMV was comparable between groups, consistent with reports of similar global brain volumes at term‐equivalent age (Ajayi‐Obe et al. 2000). Notable distinctions emerged in other metrics: We found no significant group differences in SD, contrasting with previous studies reporting regional SD reductions in preterm neonates (Dimitrova et al. 2021). Additionally, the specific brain regions showing significant alterations in SA, MC, and CT differed somewhat from the vulnerable areas identified in other cohorts. These early morphological alterations may persist throughout childhood and potentially into adulthood (Kelly et al. 2023; Vandewouw et al. 2020). The observed variations could be influenced by methodological differences in study design or cohort characteristics, underscoring the importance of such factors when interpreting developmental differences among populations.
Consistent with the findings of Dimitrova et al. in preterm neonates at term‐equivalent age, our study demonstrates asynchronous alterations in cortical morphology across different brain regions (Dimitrova et al. 2021). We also replicated their observation of a significantly stronger positive association between PMA at scan and SA compared to the relationship between PMA at scan and CT (Dimitrova et al. 2021). However, extending beyond these confirmatory findings, our study provides novel insights. Notably, in contrast to some existing literature, we identified significant positive correlations between PMA at scan and MC in several regions, particularly within the frontal and temporal lobes, suggesting that cortical folding remains a relatively active process during the early postnatal period in preterm neonates reaching near‐term age (Fenchel et al. 2020; Dimitrova et al. 2021). Furthermore, and to our knowledge representing the first report of its kind in a cross‐sectional study of this population, we revealed a strong positive association between PMA at scan and GMV. These findings on MC and GMV development provide new evidence for understanding ongoing cortical maturation during this critical perinatal window.
By applying morphometric similarity mapping based on multiple MRI‐derived cortical features, we aimed to capture individual‐level patterns of cortical morphological coordination. To our knowledge, this represents the first application of MSN‐based models to investigate regional morphometric similarity specifically within an East Asian neonatal cohort. Strikingly, our analysis revealed that preterm neonates exhibited significantly increased regional morphometric similarity compared to term neonates in only one region: the right mOFC. This region is noteworthy, as prior studies indicate that the mOFC typically exhibits larger surface area and greater cortical thickness during adolescence (Gorham et al. 2024; Ji et al. 2024). However, the specific finding of a regional MSN enhancement in the right mOFC during the neonatal period, as reported here, is novel. This observation may reflect an early, region‐specific adaptive or compensatory remodeling process unique to preterm neonates within this population.
Further investigation of the MSN in preterm neonates revealed no statistically significant differences in global or nodal topology compared to term neonates, although trends toward diminished integration and segregation were observed. Within the context of MSN, these trends suggest a potential delay or alteration in coordinated cortical maturation, leading to less differentiated morphometric architecture across both distant and local regions. As the first study specifically comparing preterm and term neonates using MSN topology, our findings of non‐significant differences are likely attributable to the cohort's characteristics: the predominance of relatively healthy late preterm neonates (~80%, closer to term maturity) and stringent exclusion criteria potentially filtering out cases with more pronounced abnormalities (Zhao et al. 2019). This suggests that MSNs in this specific population may exhibit subtler developmental variations than those captured by other modalities (Lee et al. 2019; Jang et al. 2023). The observed trends of reduced integration and segregation, however, warrant future investigation in larger cohorts spanning broader GAs.
Developmental analysis of MSN in preterm neonates revealed increasing Eg and decreasing Lp with advancing PMA at scan, reflecting enhanced integration of morphometric similarity across distant regions through more efficient morphological shortcuts. Concurrently, rising Cp and Eloc indicated strengthened segregation, manifested through tighter morphological cohesion within local clusters and increased consistency among neighboring nodes' morphometric features. This dual progression signifies refinement of cortical architecture, where long‐range morphological coordination and localized specialization mature synergistically during the near‐term period. While Wang et al. observed similar MSN maturation from late gestation to early infancy, Zhao et al.'s findings of increasing integration but decreasing segregation in fetal MSNs reveal a distinct prenatal pattern: initial establishment of long‐range morphological bridges precedes local cluster refinement (Zhao et al. 2023; Wang et al. 2024). Collectively, these results delineate a complex developmental trajectory, wherein preterm extrauterine exposure may accelerate morphological refinement through distinct adaptive processes (Dubois et al. 2021; Zhao et al. 2022).
Regarding nodal topological properties in preterm neonates, we observed a significant negative correlation between Bc and PMA at scan in the right precuneus. In MSN, a higher Bc indicates that a brain region serves as a hub linking morphometrically dissimilar regions, thus bridging areas with divergent morphometric features. Importantly, interpreting Bc in the context of an MSN highlights regions that mediate interactions across divergent morphometric features, a property not captured by conventional measures of structural or functional connectivity. The precuneus is a well‐established hub and a core node of the default mode network, consistently identified as central in both structural and functional networks (Dadario and Sughrue 2023; Yamaguchi and Jitsuishi 2024). The observed decrease in its Bc with advancing PMA at scan may reflect a developmental reorganization of its integrative role. Early in development, the precuneus may act as a broad integrator supporting foundational network architecture, whereas maturation is characterized by a shift toward more specialized and efficient connectivity (Keunen et al. 2017). While the exact functional implications remain to be determined, these findings provide a novel perspective on precuneus maturation in morphometric networks and highlight the need for future multimodal investigations.
Despite these valuable insights, several limitations should be acknowledged. First, the sample size of preterm neonates with a GA at birth of less than 32 weeks was relatively small, and the uneven distribution of samples may affect the accuracy and reliability of model fitting. Second, despite statistically controlling for PMA at scan in all group comparisons using ANCOVA, the earlier scan timing in preterm neonates remains a limitation. This difference may still introduce residual confounding and affect the interpretation of group differences. Future studies using PMA‐matched samples or longitudinal designs are needed to better distinguish prematurity effects from normal developmental changes. Third, due to the absence of effective methods for quantifying the morphology of subcortical nuclei, this study did not explore the characteristics of subcortical networks or cortical–subcortical similarity networks in detail. Fourth, the topological changes in perinatal brain morphological networks may be influenced by the selected features and network metrics, warranting further investigation. Finally, while the DK atlas was used to divide the neonatal cortex into 68 regions, this approach lacks the necessary resolution to fully capture the complex morphometric features of the neonatal brain cortex.
5. Conclusions
This study provides a systematic characterization of cortical development in preterm neonates from an East Asian population. We identified significant region‐specific alterations in cortical morphology, while topological properties showed no marked differences. Furthermore, we characterized the developmental trajectories of both cortical morphology and network topology across the studied postnatal period. This research addresses a critical gap in brain morphological network studies within East Asian populations and offers valuable insights into the neuroanatomical adaptations underlying preterm neonates' extrauterine catch‐up growth and early postnatal development.
Author Contributions
Ting Peng: writing – original draft, software, methodology, investigation, formal analysis, visualization. Jiaqi Li: writing – original draft, software, methodology, investigation. Miaoshuang Liu: conceptualization, investigation, data curation. Ying Lin: data curation, supervision. Xin Xu: data curation, supervision. Chunjie Jiang: software. Xianghui Huang: resources, funding acquisition. Tianli Tao: software. Xinyi Cai: software. Yajuan Zhang: software. Lin Zhang: data curation. Mingwen Yang: data curation. Zuozhen Lan: data curation. Wenhao Zhou: project administration. Han Zhang: project administration. Jungang Liu: project administration, data curation, supervision. Guoqiang Cheng: writing – review and editing, conceptualization, funding acquisition, project administration, supervision. Deyi Zhuang: writing – review and editing, funding acquisition, project administration, supervision.
Ethics Statement
The study was conducted in accordance with the Declaration of Helsinki and was approved by the Ethics Committee of Xiamen Children's Hospital (approval no. 2022‐026).
Consent
Informed consent was obtained from all participants' legal guardians prior to their inclusion in the study.
Conflicts of Interest
The authors declare no conflicts of interest.
Supporting information
Figure S1: The Leave‐One‐Feature‐Out analysis of morphometric similarity network stability. Correlation plot showing the Pearson correlation between the full‐feature MSN (using all five morphometric features) and MSNs reconstructed by iteratively excluding one feature.
Figure S2: Associations between morphometric features and PMA at scan in term neonates. Partial Spearman correlation analyses between morphometric features and PMA at scan, adjusted for GA at birth, sex, and eTIV. The color bar represents Spearman's ρ values. Results are presented without FDR correction for multiple comparisons.
Figure S3: Associations between global network metrics and PMA at scan in term neonates. Partial Spearman correlations examining relationships between global network metrics and PMA at scan in term neonates, adjusting for GA at birth and sex.
Table S1: Group differences in the five morphometric features in 68 brain regions using Desikan‐Killiany atlas.
Table S2: Association between morphometric features and PMA at scan in preterm neonates.
Table S3: Association between morphometric features and PMA at scan in term neonates.
Table S4: Regional MSN differences in preterm neonates.
Table S5: Group differences in the nodal metrics in 68 brain regions using Desikan‐Killiany atlas.
Table S6: Significant association between nodal topological features and PMA at scan in preterm neonates.
Acknowledgments
This study was supported by the National Science and Technology Ministry major program (Grant No. 2022ZD0209000), the Key Program of the Xiamen Medical and Health (Grant No. 3502Z20234013), and the Fujian Provincial Health Commission science and technology plan project (Grant No. 2021ZQNZD017). The authors would like to thank all the participants and their parents.
Peng, T. , Li J., Liu M., et al. 2025. “Cortical Morphology and Morphometric Similarity Network Topology Alterations in Preterm Neonates: Insights From an East Asian Cohort.” Human Brain Mapping 46, no. 14: e70361. 10.1002/hbm.70361.
Funding: This work was supported by the National Science and Technology Ministry Major Program, 2022ZD0209000, Key Program of the Xiamen Medical and Health, 3502Z20234013, Fujian Provincial Health Commission Science and Technology Plan Project, 2021ZQNZD017.
Ting Peng, Jiaqi Li, and Miaoshuang Liu contributed equally as cofirst authors.
Contributor Information
Jungang Liu, Email: jgliu_xmchospital@hotmail.com.
Guoqiang Cheng, Email: gqcheng_cm@fudan.edu.cn.
Deyi Zhuang, Email: zhuangdy526@163.com.
Data Availability Statement
The data that support the findings of this study are available from the corresponding author upon reasonable request.
References
- Ajayi‐Obe, M. , Saeed N., Cowan F. M., Rutherford M. A., and Edwards A. D.. 2000. “Reduced Development of Cerebral Cortex in Extremely Preterm Infants.” Lancet 356, no. 9236: 1162–1163. [DOI] [PubMed] [Google Scholar]
- Bethlehem, R. A. I. , Seidlitz J., White S. R., et al. 2022. “Brain Charts for the Human Lifespan.” Nature 604, no. 7906: 525–533. [DOI] [PMC free article] [PubMed] [Google Scholar]
- Cai, M. , Ma J., Wang Z., et al. 2023. “Individual‐Level Brain Morphological Similarity Networks: Current Methodologies and Applications.” CNS Neuroscience & Therapeutics 29, no. 12: 3713–3724. [DOI] [PMC free article] [PubMed] [Google Scholar]
- Carmon, J. , Heege J., Necus J. H., et al. 2020. “Reliability and Comparability of Human Brain Structural Covariance Networks.” NeuroImage 220: 117104. [DOI] [PubMed] [Google Scholar]
- Dadario, N. B. , and Sughrue M. E.. 2023. “The Functional Role of the Precuneus.” Brain 146, no. 9: 3598–3607. [DOI] [PubMed] [Google Scholar]
- Dimitrova, R. , Pietsch M., Ciarrusta J., et al. 2021. “Preterm Birth Alters the Development of Cortical Microstructure and Morphology at Term‐Equivalent Age.” NeuroImage 243: 118488. [DOI] [PMC free article] [PubMed] [Google Scholar]
- Dubois, J. , Alison M., Counsell S. J., Hertz‐Pannier L., Hüppi P. S., and Benders M. J. N. L.. 2021. “MRI of the Neonatal Brain: A Review of Methodological Challenges and Neuroscientific Advances.” Journal of Magnetic Resonance Imaging 53, no. 5: 1318–1343. [DOI] [PMC free article] [PubMed] [Google Scholar]
- Engelhardt, E. , Inder T. E., Alexopoulos D., et al. 2014. “Regional Impairments of Cortical Folding in Premature Infants.” Annals of Neurology 77, no. 1: 154. [DOI] [PMC free article] [PubMed] [Google Scholar]
- Fenchel, D. , Dimitrova R., Robinson E. C., et al. 2022. “Neonatal Multi‐Modal Cortical Profiles Predict 18‐Month Developmental Outcomes.” Developmental Cognitive Neuroscience 54: 101103. [DOI] [PMC free article] [PubMed] [Google Scholar]
- Fenchel, D. , Dimitrova R., Seidlitz J., et al. 2020. “Development of Microstructural and Morphological Cortical Profiles in the Neonatal Brain.” Cerebral Cortex 30, no. 11: 5767–5779. [DOI] [PMC free article] [PubMed] [Google Scholar]
- Galdi, P. , Blesa M., Stoye D. Q., et al. 2020. “Neonatal Morphometric Similarity Mapping for Predicting Brain Age and Characterizing Neuroanatomic Variation Associated With Preterm Birth.” NeuroImage: Clinical 25: 102195. [DOI] [PMC free article] [PubMed] [Google Scholar]
- Gilmore, J. H. , Santelli R. K., and Gao W.. 2018. “Imaging Structural and Functional Brain Development in Early Childhood.” Nature Reviews Neuroscience 19, no. 3: 123–137. [DOI] [PMC free article] [PubMed] [Google Scholar]
- Gorham, L. S. , Latham A. R., Alexopoulos D., et al. 2024. “Children Born Very Preterm Experience Altered Cortical Expansion Over the First Decade of Life.” Brain Communications 6, no. 5: fcae318. [DOI] [PMC free article] [PubMed] [Google Scholar]
- He, Y. , Chen Z., and Evans A.. 2008. “Structural Insights Into Aberrant Topological Patterns of Large‐Scale Cortical Networks in Alzheimer's Disease.” Journal of Neuroscience 28, no. 18: 4756–4766. [DOI] [PMC free article] [PubMed] [Google Scholar]
- Hosseini, S. M. H. , Hoeft F., and Kesler S. R.. 2012. “GAT: A Graph‐Theoretical Analysis Toolbox for Analyzing Between‐Group Differences in Large‐Scale Structural and Functional Brain Networks.” PLoS One 7, no. 7: e40709. [DOI] [PMC free article] [PubMed] [Google Scholar]
- Jang, Y. H. , Kim H., Lee J. Y., Ahn J. H., Chung A. W., and Lee H. J.. 2023. “Altered Development of Structural MRI Connectome Hubs at Near‐Term Age in Very and Moderately Preterm Infants.” Cerebral Cortex 33, no. 9: 5507–5523. [DOI] [PubMed] [Google Scholar]
- Ji, W. , Li G., Jiang F., et al. 2024. “Preterm Birth Associated Alterations in Brain Structure, Cognitive Functioning and Behavior in Children From the ABCD Dataset.” Psychological Medicine 54, no. 2: 409–418. [DOI] [PubMed] [Google Scholar]
- Joo, S. W. , Jo Y. T., Choi W., et al. 2024. “Topological Abnormalities of the Morphometric Similarity Network of the Cerebral Cortex in Schizophrenia.” Schizophrenia 10, no. 1: 57. [DOI] [PMC free article] [PubMed] [Google Scholar]
- Keunen, K. , Counsell S. J., and Benders M. J.. 2017. “The Emergence of Functional Architecture During Early Brain Development.” NeuroImage 160: 2–14. [DOI] [PubMed] [Google Scholar]
- Kelly, C. , Dhollander T., Harding I. H., et al. 2022. “Brain Tissue Microstructural and Free‐Water Composition 13 Years After Very Preterm Birth.” NeuroImage 254: 119168. [DOI] [PubMed] [Google Scholar]
- Kelly, C. E. , Shaul M., Thompson D. K., et al. 2023. “Long‐Lasting Effects of Very Preterm Birth on Brain Structure in Adulthood: A Systematic Review and Meta‐Analysis.” Neuroscience and Biobehavioral Reviews 147: 105082. [DOI] [PubMed] [Google Scholar]
- Kelly, C. E. , Thompson D. K., Adamson C. L., et al. 2024. “Cortical Growth From Infancy to Adolescence in Preterm and Term‐Born Children.” Brain 147, no. 4: 1526–1538. [DOI] [PMC free article] [PubMed] [Google Scholar]
- Kostović, I. , and Jovanov‐Milosević N.. 2006. “The Development of Cerebral Connections During the First 20‐45 Weeks' Gestation.” Seminars in Fetal & Neonatal Medicine 11, no. 6: 415–422. [DOI] [PubMed] [Google Scholar]
- Kostović, I. , Sedmak G., and Judaš M.. 2019. “Neural Histology and Neurogenesis of the Human Fetal and Infant Brain.” NeuroImage 188: 743–773. [DOI] [PubMed] [Google Scholar]
- Lapidaire, W. , Clayden J. D., Fewtrell M. S., and Clark C. A.. 2024. “Increased White Matter Fibre Dispersion and Lower IQ Scores in Adults Born Preterm.” Human Brain Mapping 45, no. 1: e26545. [DOI] [PMC free article] [PubMed] [Google Scholar]
- Lee, J. Y. , Park H. K., and Lee H. J.. 2019. “Accelerated Small‐World Property of Structural Brain Networks in Preterm Infants at Term‐Equivalent Age.” Neonatology 115, no. 2: 99–107. [DOI] [PubMed] [Google Scholar]
- Li, G. , Wang L., Yap P. T., et al. 2019. “Computational Neuroanatomy of Baby Brains: A Review.” NeuroImage 185: 906. [DOI] [PMC free article] [PubMed] [Google Scholar]
- Li, M. , Liu T., Xu X., et al. 2022. “Development of Visual Cortex in Human Neonates Is Selectively Modified by Postnatal Experience.” eLife 18, no. 11: e78733. [DOI] [PMC free article] [PubMed] [Google Scholar]
- Long, J. , Li J., Xie B., et al. 2023. “Morphometric Similarity Network Alterations in COVID‐19 Survivors Correlate With Behavioral Features and Transcriptional Signatures.” NeuroImage: Clinical 39: 103498. [DOI] [PMC free article] [PubMed] [Google Scholar]
- Moeskops, P. , Benders M. J. N. L., Kersbergen K. J., et al. 2015. “Development of Cortical Morphology Evaluated With Longitudinal MR Brain Images of Preterm Infants.” PLoS One 10, no. 7: e0131552. [DOI] [PMC free article] [PubMed] [Google Scholar]
- Niu, J. , Jiao Q., Cui D., et al. 2024. “Age‐Associated Cortical Similarity Networks Correlate With Cell Type‐Specific Transcriptional Signatures.” Cerebral Cortex 34, no. 1: bhad454. [DOI] [PubMed] [Google Scholar]
- Pannek, K. , George J. M., Boyd R. N., Colditz P. B., Rose S. E., and Fripp J.. 2020. “Brain Microstructure and Morphology of Very Preterm‐Born Infants at Term Equivalent Age: Associations With Motor and Cognitive Outcomes at 1 and 2 Years.” NeuroImage 221: 117163. [DOI] [PubMed] [Google Scholar]
- Pessoa, L. 2014. “Understanding Brain Networks and Brain Organization.” Physics of Life Reviews 11, no. 3: 400–435. [DOI] [PMC free article] [PubMed] [Google Scholar]
- Rubinov, M. , and Sporns O.. 2010. “Complex Network Measures of Brain Connectivity: Uses and Interpretations.” NeuroImage 52, no. 3: 1059–1069. [DOI] [PubMed] [Google Scholar]
- Seidlitz, J. , Váša F., Shinn M., et al. 2018. “Morphometric Similarity Networks Detect Microscale Cortical Organization and Predict Inter‐Individual Cognitive Variation.” Neuron 97, no. 1: 231–247.e7. [DOI] [PMC free article] [PubMed] [Google Scholar]
- Sidman, R. L. , and Rakic P.. 1973. “Neuronal Migration, With Special Reference to Developing Human Brain: A Review.” Brain Research 62, no. 1: 1–35. [DOI] [PubMed] [Google Scholar]
- Sporns, O. 2013. “The Human Connectome: Origins and Challenges.” NeuroImage 80: 53–61. [DOI] [PubMed] [Google Scholar]
- Ullman, H. , Spencer‐Smith M., Thompson D. K., et al. 2015. “Neonatal MRI Is Associated With Future Cognition and Academic Achievement in Preterm Children.” Brain 138, no. 11: 3251–3262. [DOI] [PMC free article] [PubMed] [Google Scholar]
- Vandewouw, M. M. , Young J. M., Mossad S. I., et al. 2020. “Mapping the Neuroanatomical Impact of Very Preterm Birth Across Childhood.” Human Brain Mapping 41, no. 4: 892–905. [DOI] [PMC free article] [PubMed] [Google Scholar]
- Volpe, J. J. 2019. “Dysmaturation of Premature Brain: Importance, Cellular Mechanisms, and Potential Interventions.” Pediatric Neurology 95: 42–66. [DOI] [PubMed] [Google Scholar]
- Wang, J. , and He Y.. 2024. “Toward Individualized Connectomes of Brain Morphology.” Trends in Neurosciences 47, no. 2: 106–119. [DOI] [PubMed] [Google Scholar]
- Wang, J. , Wang X., Xia M., Liao X., Evans A., and He Y.. 2015. “GRETNA: A Graph Theoretical Network Analysis Toolbox for Imaging Connectomics.” Frontiers in Human Neuroscience 9: 386. [DOI] [PMC free article] [PubMed] [Google Scholar]
- Wang, Y. , Zhu D., Zhao L., et al. 2024. “Profiling Cortical Morphometric Similarity in Perinatal Brains: Insights From Development, Sex Difference, and Inter‐Individual Variation.” NeuroImage 295: 120660. [DOI] [PubMed] [Google Scholar]
- Xu, Z. , Zhou Z., Tao W., et al. 2025. “Altered Topology in Cortical Morphometric Similarity Network in Recurrent Major Depressive Disorder.” Journal of Psychiatric Research 181: 206–213. [DOI] [PubMed] [Google Scholar]
- Yamaguchi, A. , and Jitsuishi T.. 2024. “Structural Connectivity of the Precuneus and Its Relation to Resting‐State Networks.” Neuroscience Research 209: 9–17. [DOI] [PubMed] [Google Scholar]
- Zhao, R. , Sun C., Xu X., et al. 2023. “Developmental Pattern of Individual Morphometric Similarity Network in the Human Fetal Brain.” NeuroImage 283: 120410. [DOI] [PubMed] [Google Scholar]
- Zhao, R. , Zhao Z., Wang J., and Wu D.. 2022. “Brain Morphological Network and Its Applications in Human Brain Development.” Chinese Science Bulletin 68, no. 1: 72–86. [Google Scholar]
- Zhao, T. , Xu Y., and He Y.. 2019. “Graph Theoretical Modeling of Baby Brain Networks.” NeuroImage 15, no. 185: 711–727. [DOI] [PubMed] [Google Scholar]
- Zheng, W. , Zhao Z., Zhang Z., et al. 2020. “Developmental Pattern of the Cortical Topology in High‐Functioning Individuals With Autism Spectrum Disorder.” Human Brain Mapping 42, no. 3: 660–675. [DOI] [PMC free article] [PubMed] [Google Scholar]
- Zöllei, L. , Iglesias J. E., Ou Y., Grant P. E., and Fischl B.. 2020. “Infant FreeSurfer: An Automated Segmentation and Surface Extraction Pipeline for T1‐Weighted Neuroimaging Data of Infants 0–2 Years.” NeuroImage 218: 116946. [DOI] [PMC free article] [PubMed] [Google Scholar]
Associated Data
This section collects any data citations, data availability statements, or supplementary materials included in this article.
Supplementary Materials
Figure S1: The Leave‐One‐Feature‐Out analysis of morphometric similarity network stability. Correlation plot showing the Pearson correlation between the full‐feature MSN (using all five morphometric features) and MSNs reconstructed by iteratively excluding one feature.
Figure S2: Associations between morphometric features and PMA at scan in term neonates. Partial Spearman correlation analyses between morphometric features and PMA at scan, adjusted for GA at birth, sex, and eTIV. The color bar represents Spearman's ρ values. Results are presented without FDR correction for multiple comparisons.
Figure S3: Associations between global network metrics and PMA at scan in term neonates. Partial Spearman correlations examining relationships between global network metrics and PMA at scan in term neonates, adjusting for GA at birth and sex.
Table S1: Group differences in the five morphometric features in 68 brain regions using Desikan‐Killiany atlas.
Table S2: Association between morphometric features and PMA at scan in preterm neonates.
Table S3: Association between morphometric features and PMA at scan in term neonates.
Table S4: Regional MSN differences in preterm neonates.
Table S5: Group differences in the nodal metrics in 68 brain regions using Desikan‐Killiany atlas.
Table S6: Significant association between nodal topological features and PMA at scan in preterm neonates.
Data Availability Statement
The data that support the findings of this study are available from the corresponding author upon reasonable request.