

ABSTRACT
Extracellular vesicles (EVs) represent a cytokine‐independent pathway though which skeletal muscle (SkM) cells influence the fate of neighbouring cells, thereby regulating SkM metabolic homeostasis and regeneration. Although SkM‐EVs are increasingly being explored as a therapeutic strategy to enhance muscle regeneration or to induce the myogenic differentiation of induced pluripotent stem cells (iPSCs), the mechanisms governing their release from muscle cells remain poorly described. Moreover, because muscle regeneration involves a tightly regulated inflammatory response it also important to determine how inflammation alters SkM‐EV cargo and function in order to design more effective EV‐based therapies. To address this knowledge gap, we isolated and characterized the large and small EVs (lEVs, sEVs) released from SkM cells under basal conditions and in response to TNF‐α, a well‐established inflammatory mediator elevated in both acute muscle injury and chronic inflammatory conditions such as type 2 diabetes. We then evaluated the regenerative roles of these EV subtypes in vivo using a mouse model of cardiotoxin‐induced muscle injury, with a specific focus on their bioactive sphingolipid content. Using transmission, scanning or cryo‐electron microscopy, lipidomic profiling and an adenoviral construct to express labelled CD63 in myotubes, we demonstrated that SkM cells release both sEVs and lEVs primarily from the plasma membrane. Notably, sEVs were generated from specialized membrane folds enriched in the EV markers ALIX (ALG‐2 interacting protein X) and TSG101, as well as lipid raft‐associated lipids. During regeneration, sEVs promoted M1 macrophage polarization and migration and muscle stem cell (MuSC) differentiation, thereby accelerating muscle repair. In contrast, lEVs inhibited and promoted MuSC proliferation and impaired the transition from the pro‐inflammatory to the anti‐inflammatory response, an essential step for promoting MuSC differentiation. Treatment of isolated muscle fibres with SkM‐EVs revealed that the distinct effects of sEVs and lEVs on MuSC behaviour and macrophage phenotype could be largely explained by differences in their lipid composition, particularly the ratio of sphingosine‐1‐phosphate (S1P) subspecies. However, TNF‐α exposure altered these ratios in sEVs and impaired their regenerative functions on MuSC and their effect on macrophage migration and polarization. These results demonstrate for the first time the importance of the sphingolipid content of EVs released by skeletal muscle in their regenerative function within muscle tissue, largely explained by their role as carriers of different subspecies of sphingosine‐1‐phosphate. This suggests that modulating the sphingolipid composition of EVs could be a viable strategy to enhance the regenerative potential of muscle tissue in addition to therapeutic interventions.
Keywords: extracellular vesicles, lipidomic, muscle stem cells, regeneration, skeletal muscle, sphingosine‐1‐phosphate
Abbreviations
- ALIX
ALG‐2 interacting protein X
- AKT
protein kinase B
- CD63
lysosomal‐associated membrane protein 3 or tetraspanin‐30
- CD86
T‐lymphocyte activation antigen CD86
- CD206
T‐lymphocyte activation antigen CD206
- CD81
tetraspanin‐28
- EEA1
early endosome antigen 1
- EV
extracellular vesicle
- EDL
extensor digitorum longus muscle
- IL‐6
interleukine 6
- ILV
intraluminal vesicle
- iPSCs
induced pluripotent stem cells
- LAMP1
lysosomal associated membrane protein 1
- LPC
lysophosphatidylcholine
- MVB
multivesicular bodies
- PM
plasma membrane
- TSG101
ESCRT‐I complex subunit tumour susceptibility gene 101 protein
- PA
phosphatidic acid
- PC
phosphatidylcholine
- PE
phosphatidylethanolamine
- PI
phosphatidylinositol
- PI3K
phosphoinositide 3‐kinase
- PS
phosphatidylserine
- S1P
sphingosine 1‐phosphate
- SkM
skeletal muscle
- SM
sphingomyelin
- SPHK
sphingosine kinase
- SS
sphingosine
- S1P
sphingosine‐1‐phosphate
- RT
room temperature
- TNF‐α
tumour necrosis factor alpha
1. Introduction
Skeletal muscles (SkM) represent 40% of body weight and are responsible for locomotion and the regulation of glucose homeostasis. In response to contractions or metabolic stimuli, SkM releases myokines, which influence broader physiological functions, immune response, brain health and fat storage. Interestingly, during the last decade, it has been demonstrated that SkM also release information embedded in lipid‐derived nanovesicles, named extracellular vesicles (EVs), which represent a cytokine‐independent pathway by which muscles can modulate the homeostasis and the fate of neighbouring recipient cells (Rome et al. 2019). Indeed, EVs have virus‐like properties and mediate intercellular communication by transferring proteins, RNAs and lipids between cells (Valadi et al. 2007). Because of the many components they contain, EVs can affect multiple signalling pathways within target cells and have a much greater impact on the physiology of recipient cells than single‐molecule mediators.
Originally, EVs were separated into two main classes: exosomes and microparticles, based on their subcompartment origin (i.e., endosomal vs. plasma membrane [PM]). Exosomes measure approximately 50–100 nm in diameter and are secreted by proliferative and metabolically active cells (Desdin‐Mico and Mittelbrunn 2017). Their formation begins with the inward budding of the limiting membrane of some late endosomes resulting in the encapsulation of cytosolic components into structures called intraluminal vesicles (ILVs), inside multivesicular bodies (MVBs). The fate of these ILVs depends on the cell metabolic condition; they may be directed to lysosomes for degradation, rerouted to the endoplasmic reticulum or Golgi apparatus or delivered to the cell surface for release. In the latter case, MVBs fuse with the plasma membrane, discharging their ILV content as exosomes into the extracellular environment. The lipids of exosomal membranes closely resemble that of plasma membrane raft domains but exhibit a higher concentration of cholesterol, sphingomyelin (SM), ether‐linked phospholipids and lysoglycerophospholipids (Skotland et al. 2025). Additionally, exosomal membranes contain elevated levels of saturated phospholipids and saturated fatty acids compared to the overall lipid profile of the parent cell (Skotland et al. 2020). Microvesicles, typically ranging from 100 to 400 nm in size, are generated during the plasma membrane repair process triggered by a sudden influx of calcium ions (Ca2⁺). Similar to the formation of intraluminal vesicles (ILVs), their biogenesis involves proteins from the ESCRT (Endosomal Sorting Complex Required for Transport) machinery (Hurley 2015). To date, the lipid composition of microvesicles remains relatively underexplored. In the case of EVs derived from adipocytes, studies have shown that exosomes contain a higher proportion of cholesterol relative to microvesicles when normalized to total EV protein content (Durcin et al. 2017). In contrast, analyses of EVs isolated from pleural effusion showed that microvesicles are enriched in ceramides with long‐chain acyl groups, as well as in phosphatidylethanolamine (PE), phosphatidic acid (PA) and phosphatidylinositol (PI), while exhibiting lower levels of sphingomyelin (SM), phosphatidylcholine (PC), lysophosphatidylethanolamine (LPE) and lysophosphatidylcholine (LPC) compared to exosomes (Luo et al. 2020).
However, over the past 5 years, many other extracellular vesicular structures have been identified (Buzas 2023; Visnovitz et al. 2025), and it turns out that this binary classification does not always reflect the diversity of EVs released by the cells. Furthermore, no purification method is totally reliable, and EV preparations are often not pure and contain subpopulations of EVs that are difficult to isolate. Therefore, since 2018, it is recommended to use the terminology of large EVs (lEVs) to refer to EVs originating from the budding of PM (microparticles, >200 nm), and small EVs (sEVs) to refer to EVs released from the endolysosomal pathway or small PM buddings (exosomes, exosome‐like vesicles, ectosomes <200 nm) (Thery et al. 2018; Welsh et al. 2024). Until now, this nomenclature has made it possible to identify subtypes of EVs with distinct lipid, RNA and protein compositions, confirming its ability to discriminate EV subpopulations with specific biological functions (Durcin et al. 2017; Haraszti et al. 2016; Ji et al. 2014; Lischnig et al. 2022). In the case of SkM cells, two EV subpopulations have been described based on their size and density, isolated using differential centrifugation and density gradient separation (Le Bihan et al. 2012). Because of their differing protein and RNA content, it has been suggested that these two populations may play distinct roles during myogenesis. It has also been proposed that mouse SkM can release sEVs directly from PM through a mechanism involving the ALIX (ALG‐2 interacting protein X) protein (Romancino et al. 2013). However, the respective biogenesis pathways of the lEVs and sEVs released from SkM are still unresolved (Anakor et al. 2022).
Importantly, the EV composition varies according to the metabolic state of the cells, and previous data have suggested that changes in muscle mass may influence both the release and composition of sEVs. For instance, muscle cell atrophy induced by dexamethasone, denervation, H2O2 or pro‐inflammatory cytokines (TNF‐α and INF‐γ) leads to the release of a new population of sEVs enriched in specific miRNAs (Hudson et al. 2014; de Gasperi et al. 2017), which altered myoblast proliferation during myogenesis (Guescini et al. 2017; Kim et al. 2018). During sarcopenia, fibre‐derived sEVs from atrophic muscles inhibited satellite cell differentiation (Shao et al. 2022). In the context of lateral sclerosis, SkM‐released sEVs induced shortened, less branched neurites and cell death in recipient motor neuron cells, but the survival of SkM recipient cells (Anakor et al. 2022; Le Gall et al. 2022; Sbarigia et al. 2024). In addition, SkM‐EVs also control the amount of fat in and around SkM by modulating the lipid storage in pre‐adipocytes (Jalabert et al. 2021; Rome 2022) or the commitment of Fibro‐Adipogenic Progenitors (FAPs) into adipocytes (Vumbaca et al. 2021).
Therefore, given that SkM‐EVs are increasingly being considered as a therapeutic strategy to accelerate muscle regeneration or to induce the myogenic differentiation of iPSCs (Baci et al. 2020), it is now important to study in more detail the biogenesis of the lEVs and sEVs released from SkM and their respective functions during muscle regeneration, in order to determine whether the selection of some subpopulations of SkM‐EVs might impact this process. In addition, as muscle regeneration also involves inflammation (Yang and Hu 2018), it is also important to determine how inflammation alters EV cargoes and functions in order to design better EV‐based therapies.
To address this current gap of knowledge, we isolated and characterized the lEVs and sEVs released from SkM cells under basal growth conditions and in response to TNF‐α, a well‐established mediator of inflammation in skeletal muscle during both acute injury and chronic inflammatory states (e.g., in muscular dystrophies, cachexia, diabetes). We then identified their respective functions during muscle regeneration in mice. For the first time, we provide evidence that SkM cells release lEVs and sEVs primarily from the plasma membrane, and demonstrate that muscle EVs spread different ratios of sphingosine‐1‐phosphate subspecies that control either the proliferation or the differentiation of muscle stem cells (MuSC) during regeneration. Furthermore, we showed that inflammation shifts the muscle EV sphingolipid profile and alters their regenerative functions, including their effects on macrophage migration and polarization. This suggests that modulating the sphingolipid composition of EVs could be a viable strategy to enhance the regenerative potential of muscle tissue in addition to therapeutic interventions.
2. Material and Methods
2.1. Culture of Skeletal Muscle Cells
Murine C2C12 myoblasts (ATCC CRL‐1772) were routinely maintained in DMEM 4.5 g/L glucose supplemented with 10% heat‐inactivated Foetal Bovine Serum (FBS), 1000 UI/mL penicillin, 1000 UI/mL streptomycin and 2 mM L‐Glutamine at 37°C in humidified air containing 5% CO2. At 100% confluence, differentiation was induced with 2% Horse Serum in DMEM 4.5 g/L glucose. C2C12 Myotubes are used 7 days post‐differenciation (Forterre et al. 2014). For transcriptomic analyses of myotubes in response to TNF‐α, human satellite cells were isolated and differentiated in myotubes as in (Bouzakri et al. 2003) from biopsies of vastus lateralis obtained from five healthy donors (Copenhagen Muscle Research Centre; all the subjects approved the study protocols; #jr. nr.H‐A‐2007–0016). For in vitro studies on human myotubes (i.e., infection with adenovirus or TEM), human Y711i immortalized myoblasts were grown and differentiated into myotubes as in Coudert et al. (2021) to avoid the use of human primary muscle cells.
2.2. Extracellular Vesicle Purification From Cell Culture or SkM Explants
As human primary myotubes derived from healthy human donors are limited and generate small amount of material yield, we used C2C12 myotubes for EV purification in this study. C2C12 myotubes were treated for 24 h with serum‐free DMEM (4.5 g/L glucose) containing BSA 2% ± 20 ng/mL TNF‐α (Figure S1A). To avoid EV contaminations with TNF‐α, cells were rinsed with serum‐free DMEM 24 h post‐treatment and incubated again in a new serum‐free DMEM for 18 h in serum‐free DMEM. The EVs released during these additional 18 h were purified from cell supernatant (Figure S1B). During this additional time without TNF‐α, myotubes did not recover from the TNF‐α treatment, as alteration of insulin‐induced AKT phosphorylation was still detected post‐18 h (Figure S1C), in addition to myotube atrophy (Figure S1D). To avoid the selection of EV subpopulations associated with the use of commercial kits, EVs were purified by differential centrifugations (Forterre et al. 2014) (e.g., selection of small EVs only by size exclusion chromatography [SEC]; co‐purification of all EV subpopulations simultaneously when using PEG; selection of small EVs when using tangential flow filtration, which can also induce shear stress and alteration of membrane integrity; and generation of ‘shaved’ EVs when using SEC due to removal of the EV corona). Briefly, dead cells were removed by centrifugation at 300 g for 15 min. The supernatant was submitted to a 2000 g centrifugation for 20 min at 15°C to pellet apoptotic bodies. The supernatant was next centrifuged at 10,000 g for 30 min at 4°C to pellet lEVs, resuspended in 1 mL PBS without calcium and magnesium, and centrifuged again at 10,000 g. The lEV pellet was resuspended in 100 µL PBS pre‐filtered at 0.1 µm. The supernatant was filtered at 0.2 µm to remove the remaining lEVs and ultracentrifuged at 100,000 g to pellet sEVs, resuspended in 1 mL PBS without calcium and magnesium and re‐pelleted at 100,000 g and resuspended in 100 µL PBS pre‐filtered at 0.1 µm (2 × 70 min, 4°C in a Beckman Coulter Ultracentrifuge Optima XE, fixed angle rotor). The procedure to purify EVs from Gastrocnemus explants from C56/Black6 mice is described in Jalabert et al. (2021). EV proteins were quantified by Bradford assay. Size distributions in PBS pre‐filtered at 0.1 µm were determined by Dynamic Light Scattering (DLS; n = 4 replicates, 20°C, 12 runs of 60 s/replicates, Dispersant RI = 1.332, Viscosity (cP) = 1.050) (Zetasizer, Malvern Panalytical). The number of sEVs was quantified by Nanotracking Analyses (NTA, Malvern Panalytical, n = 3). Capture settings are indicated on Figure S4.
After ultracentrifugation, 30 µg of sEVs (the amount used for functional studies in animals) were further processed using an Amicon Ultra Centrifugal Filter (30 kDa MWCO) to assess the presence of vesicle‐free protein. Consistent with the known purification efficiency of ultracentrifugation, only 11% of the pellet consisted of EV‐free proteins. Given that this study focuses on the lipid content of EVs, this minor level of protein contamination is not expected to impact the results and was therefore deemed irrelevant to the interpretation of our findings on EV lipids.
2.3. RNA Sequencing
Total RNA from differentiated primary human myotubes (n = 5) was extracted using the RNeasy Kit for RNA Purification (#74104, Qiagen). RNA‐seq libraries were prepared with the Illumina TruSeq protocol, following the manufacturer's instructions. Paired‐end reads (49 bp) were generated using an Illumina HiSeq 2000 sequencer. Reads were mapped to the human genome (GRCh37) and the GENCODE 19 gene annotation using GEMtools v1.6.2 (http://gemtools.github.io/). Only reads with proper orientation and a GEM mapping quality score of 150 or higher were retained for gene quantification (read counts per gene). These counts were used to calculate reads per kilobase per million mapped reads (RPKM). RNA‐seq data are available in the GEO repository under accession number GSE294455. Data were normalized using the DESeq package in R. Genes identified as significant were analyzed for biological function using g:Profiler (http://biit.cs.ut.ee/gprofiler/gost). Heatmaps were generated with MORPHEUS (https://software.broadinstitute.org/morpheus/). We used a relative colour scheme, which scales colours based on the minimum and maximum values within each row. This approach was chosen because our goal was to compare gene expression within individual replicates rather than across the entire dataset. Since the range of expression values varies greatly between replicates, using a global colour scale would obscure meaningful variation in columns with smaller dynamic ranges.
2.4. Western Blotting
Myoblasts C2C12 were lysed in lysis buffer (PBS, 0.1% SDS, 0.5% sodium deoxycholate, 1% Nonidet NP40, 5 mmol/L EDTA, 1 mmol/L Na3VO4, 20 mmol/L NaF, 1 mmol/L dithiothreitol, protease inhibitors). Denatured proteins were resolved into SDS‐PAGE 10% or 12% and transferred onto PVDF membranes. Antibodies are provided in Table S1. A. WB signals were revealed with Immunodetection kit ECL Luminata Classico (Millipore) and the imager Molecular Image ChemiDocXRS+ (Bio‐Rad). Protein quantification was achieved using ImageLab 3.0 (Bio‐Rad). Five micrograms of EV proteins were used to detect CD81, TSG101 and CD63 by Western‐blot (n = 4) and 10 µg for ALIX (Figure S6).
2.5. Fluorescent Immunolabelling of C2C12 Myoblasts or Myotubes
Cells were grown in 60 μ‐Dish IBIDI (#81156; Ibidi GmbH, Germany) and fixed in paraformaldehyde 10% in PBS for 15 min. After washing 3× in PBS, cells were blocked in BSA (gamma globulin‐free pour ELISA) 1% (w/v; 10 mg/mL) in PBS for 30 min, RT, 1 h, and then incubated overnight at 4°C with the relevant antibodies (1/10) in 0.1% (w/v) in saponin, 1% (w/v) and BSA‐PBS. After washing, the cells were incubated with the secondary fluorescent antibody. Origins of the primary or secondary antibodies are indicated in Table S1. Fluorescence was visualized with a Leica DMi8 Thunder Imager 3D cell culture microscope (Figure S1E). The same procedure was used to detect CD81 and CD63 at the surface of the C2C12 myotubes, but cells were not permeabilized (Figure S1F, left).
2.6. Quantitative Real‐Time PCR
RNA (1 µg) was reverse transcribed (PrimeScript RT reagent kit [Takara]). Real‐time PCR was performed with the SYBR qPCR Premix Ex Taq (Tli RNaseH Plus) reagents (Takara) and a Rotor‐Gene Q (Qiagen). Primers are in Table S1B.
2.7. Lipidomic Analyses
Lipid standards (19:0/19:0‐PC, 14:0‐LPC, d18:1/12:0‐SM, 17:0/17:0‐PE, 14:0‐LPE, 17:0/17:0‐PS, 17:1‐LPS, d18:1/12:0‐Cer) were obtained from Avanti Polar Lipids (Coger SAS, Paris, France). Chemicals of the highest grade available and sterol standards (epi‐coprostanol and cholesterol) were purchased from Sigma–Aldrich (Saint‐Quentin Fallavier, France). LCMSMS quality grade solvents were purchased from Fischer Scientific (Illkirch, France).
Lipids from sEVs or lEVs released from 80 × F75 of C2C12 myotubes, or 100 mg of Gastrocnemus of C57BL/6 mice (n = 4; mice protocol is described in Jalabert et al. (2021)) were extracted using the method of Folch. Briefly, samples (100–300 µg of protein in 200 µL of PBS) were spiked with 10 µL of an internal standard mixture containing 500 ng of 19:0/19:0‐PC, 50 ng of 14: 0‐LPC, 200 ng d18:1/12:0‐SM, 150 ng 17:0/17:0‐PE, 50 ng 14:0‐LPE, 500 ng 17:0/17:0‐PS, 150 ng 17:1‐LPS, 100 ng d18:1/12:0‐Cer and 5 µg epi‐coprostanol (1 µg/µL in ethanol). The extraction was followed by the addition of MeOH (300 µL) and chloroform (600 µL). The samples were then mixed for 2 h at room temperature before adding distilled water (120 µL) to induce phase separation. The samples were maintained at room temperature for 10 min and then centrifuged at 10,000 g for 10 min at 4°C. The aqueous phase (upper phase) was discarded, and the lower organic phase was transferred to a new tube and evaporated to dryness under vacuum. The dried extracts were solubilized in 100 µL of CHCl3/MeOH/H2O (60/30/4.5).
2.8. Cholesterol Targeted Quantification by GC‐MS
Fifteen microliters of the previous extract were mixed with 1.2 mL of a solution of BHT in ethanol (50 mg/L) and 60 µL of KOH 10 M and incubated at 56°C for 45 min. Sterols were extracted with distilled water (1 mL) and 5 mL of hexane (5 mL) for 5 min. After centrifugation (1000 g, 10 min at room temperature) the organic phase collected and dried down under vacuum. Sterols were derivatized with 100 µL of a mixture of bis(trimethylsilyl)trifluoroacetamide/trimethylchlorosilane 4/1 v/v for 1 h at 80°C. Samples were evaporated under a nitrogen stream and finally dissolved in hexane (100 µL). GCMS analysis was performed in a 7890A gas chromatograph coupled with a 5975C Mass Selective Detector (Agilent Technologies). Separation was achieved on a HP‐5MS 30 m × 250 µm column (Agilent Technologies) using helium as carrier gas and the following GC conditions: injection (1 µL) at 250°C using the split mode (split 10), oven temperature program: initial temperature 140°C up to 280°C at a rate of 15°C/min, up to 300°C at a rate of 2°C/min. The MSD was set up as follows: EI at 70 eV mode, source temperature at 230°C. Data acquisition was conducted using the single ion monitoring (SIM) mode, and ions m/z = 368.3 Da and m/z = 370.3 Da were used for the quantification of cholesterol and epicoprostanol, respectively. A calibration curve was obtained with cholesterol standards (1–20 µg) analyzed using the same protocol as for samples. Data acquisition was achieved using the MSD ChemStation E.02 software (Agilent Technologies).
2.9. Targeted Analysis of Phospholipids and Ceramides by LC‐MS/MS
Targeted LCMSMS analysis of phospholipids (1–4 µL) was performed by LCMSMS on a LC 1260 system coupled to a 6460 QqQ mass spectrometer equipped with an electrospray Jet Stream ionization source (Agilent Technologies). Phospholipids were separated on a ZorBAX EclipsePlus C18—2.1 mm × 100 mm, 1.8 µm (Agilent Technologies) maintained at 55°C. The mobile phases consisted of water/methanol (60/40 v/v) 10 mM ammonium acetate, 1 mM acetic acid (A) and of IPA/methanol (90/10) 10 mM ammonium acetate, 1 mM acetic acid (B). The linear gradient was as follows: 40% B for 1 min, up to 95% B in 14 min and maintained at 100% for 1 min. The column was equilibrated with 40% B for 6 min before each injection. The flow rate was 0.25 mL/min. The autosampler temperature was set at 5°C. Source parameters were set up as follows: temperature 325°C, nebulizer gas (nitrogen) flow rate 10 L/min, sheath gas (nitrogen) flow 11 L/min and sheath gas temperature 300°C. The capillary and Nozzle voltages were adjusted to 3500 and 1000 V, respectively. Phosphatidylcholines, Lysophosphatidylcholines and Sphingomyelin detection was achieved in SRM positive mode ([M+1]+ 184.1; fragmentor 160 V, collision energy 20 V). Phosphatidylethanolamines and Lysophosphatidylethanolamines detection was achieved in SRM positive mode ([M+1]+ →[M‐140]+; fragmentor 120 V, Collision energy 17 V). Phosphatidylserines and Phosphatidylinositols detection was achieved in SRM negative mode using ([M‐1]− →[M‐87]−; fragmentor 150 V, Collision energy 19 V) and ([M‐1]− → 241; fragmentor 172 V, Collision energy 50 V) parameters, respectively. Targeted LCMSMS quantification of ceramides was achieved with the same LC–MS/MS instrument. Ceramides were separated on a ZorBAX EclipsePlus C88—2.1 mm × 100 mm, 1.8 µm (Agilent Technologies) maintained at 50°C. The mobile phases consisted of water containing 1 mM ammonium formate, 0.2% formic acid (A) and of methanol containing 1 mM ammonium formate, 0.2% formic acid. The linear gradient was as follows: 85% B for 1 min, up to 100% B in 7 min and maintained at 100% for 4 min. The column was equilibrated with 85% B for 5 min before each injection. The flow rate was 0.3 mL/min. The autosampler temperature was set at 5°C. Source parameters were set up as follows: temperature 325°C, nebulizer gas (nitrogen) flow rate 10 L/min, sheath gas (nitrogen) flow 11 L/min and sheath gas temperature 300°C. The capillary and Nozzle voltages were adjusted to 3500 and 600 V, respectively. Ceramides detection was achieved in SRM positive mode using the transitions [M+1]+ → [Long chain base fragment]+ with fragmentor/collision energy voltages set at 115/20, 130/30 and 140/40 for ceramides, hexosyl‐ceramides and lactosyl‐ceramides, respectively. Data were acquired and analyzed with the MassHunter Workstation Data Acquisition and Quantitative Analysis Software version B.09.00, respectively (Agilent Technologies). The relative quantification of lipids was carried out by calculating the response ratio of a lipid under consideration in relation to its respective internal standard.
2.10. Transmission Electron Microscopy (TEM)
C2C12 or human myotubes were fixed in 2% glutaraldehyde, washed three times (saccharose 0.4 M/0.2 M Na C‐HCl‐Cacodylate‐HCl, pH = 7.4, 4°C) and post‐fixed (2% OsO4/0.3 M Na C‐HCl Cacodylate‐HCl, pH = 7.4, 4°C). Myotubes were dehydrated with ethanol gradient (5 min in 30%, 50%, 70%, 95%, and three times for 10 min in absolute ethanol). Impregnation was performed with Epon A (50%), Epon B (50%), DMP30 (1.7%). Inclusion was obtained by polymerization (60°C, 72 h). Ultrathin sections (70 nm) were cut on a UC7 (Leica) ultra‐microtome, mounted on 200 mesh copper grids coated with poly‐l lysine, stabilized for 1day at RT, and contrasted with uranyl acetate and lead citrate. Sections were examinated with a Jeol 1400JEM (Tokyo, Japan) TEM equipped with an Orius 600 camera and Digital Micrograph.
2.11. Gold Immunolabelling of C2C12 Myotubes
Cells were fixed at 4°C in 4% paraformaldehyde supplemented with 0.2% glutaraldehyde. After fixation, cells were washed three times in 0.2 M cacodylate buffer containing 0.4 M sucrose for 1 h at 4°C. Dehydration was performed through a graded ethanol series (30%, 50% and 70%), with each step lasting 5 min using ethanol pre‐chilled to 4°C. Cells were then infiltrated with London Resin White (LR White; EMS, France) using a 1:1 mixture of LR White and 4°C absolute ethanol for 60 min, followed by three successive 60‐min incubations in pure LR White at 4°C. Samples were embedded in pure LR White in gelatin capsules and polymerized at 50°C for 48 h. Then, ultrathin sections (∼70 nm thick) were cut using a UC7 ultramicrotome (Leica), mounted on 200‐mesh nickel grids coated with 1:1000 poly‐L‐lysine, and stabilized at room temperature (RT) for 1 day before further processing. Gold immunolabelling was performed by flotation the grids on drops of reactive media. Nonspecific sites were coated with 1% BSA and 1% normal goat serum in 50 mM Tris‐HCl, pH 7.4, for 20 min at RT. Thereafter, incubation was carried out overnight at 4°C in a wet chamber with primary antibodies (see Table S1). Sections were successively washed three times in 50 mM Tris‐HCl, pH 7.4 and pH 8.2 at RT. They were incubated in a wet chamber for 45 min at RT in 1% BSA, 50 mM Tris‐HCl, pH 8.2, for 20 min at RT, labelled with gold‐conjugated secondary antibody (Aurion). Sections were successively washed three times in 50 mM Tris‐HCl, pH 8.2 and pH 7.4 and three times infiltrated with distilled water. The immunocomplexes were fixed by a wash in glutaraldehyde 4% for 3 min. Sections were stained with 0.5% uranyl acetate in ethanol 50% for 5 min in the dark and observed with a transmission electron microscope JEOL 1400JEM (Tokyo, Japan) operating at 80 kV equipped with a camera Orius 600 Gatan and Digital Micrograph.
2.12. Gold Immunolabelling of Extracellular Vesicles
EVs were prepared and visualized as in Leblanc et al. (2017). EVs in PBS were adsorbed onto 200‐mesh nickel grids coated with Formvar‐C. Gold immunolabelling was performed by floating the grids on drops of reactive media. Non‐specific binding sites were blocked with 1% BSA in 50 mM Tris–HCl, pH 7.4, for 10 min at room temperature (RT). The grids were then incubated for 4 h at 4°C in a humid chamber with first CD63 and then CD81 antibodies (Table S1) diluted 1:50 in 1% BSA, 50 mM Tris–HCl, pH 7.4. Grids were subsequently washed once in 50 mM Tris–HCl at pH 7.4 and then at pH 8.2, both at RT. Next, the grids were preincubated with 1% BSA in 50 mM Tris–HCl, pH 8.2, for 10 min at RT, followed by labelling with anti‐IgG conjugated to 5 or 15 nm gold particles (Tebu Bio, France), diluted 1:80 in 1% BSA, 50 mM Tris–HCl, pH 8.2, in a humid chamber for 45 min. The grids were then washed once in 50 mM Tris–HCl at pH 8.2, followed by pH 7.4, and finally in filtered distilled water at RT. Grids were observed with a transmission electron microscope JEOL 1400JEM (Tokyo, Japan) operating at 80 kV equipped with a camera Orius 600 Gatan and Digital Micrograph.
2.13. Scanning Electron Microscopy (SEM)
C2C12 myoblasts, myotubes or EDL muscles were fixed in 0.1 M Cacodylate buffer/2% glutaraldehyde (1 h, RT), washed three times (15 min, 0.2 M Cacodylate buffer, RT) and incubated in 1% osmium tetroxide in 0.1 M Cacodylate buffer. Samples were washed three times (0.1 M Cacodylate buffer) and incubated overnight in 20% acetone at RT. Myotubes were incubated 1 h in 100% acetone before using the Leica EM CPD300 automated Critical Point Dryer. A 10 nm copper coating was applied on the samples before visualization with a FEI QUANTA 250 FEG at 2 kV (cells) or ZEISS MERLIN COMPACT VP.
2.14. Cryogenic Electron Microscopy (CryoEM)
sEV and lEV released from C2C12 in vitro were visualized by CryoEM (n = 6–8). Carbon membrane grids (Quantifoil MicroTools, Germany) were loaded with 10 µL of EVs, blotted and snap‐frozen in liquid ethane. Vitreous ice films were placed in a cooled Gatan 626 cryoholder, inserted into a LaB6 JEOL JEM2100 (JEOL, Japan) cryomicroscope operating at 200 kV, with a JEOL Minimum Dose System. Images were recorded at –180°C with an Ultrascan 1000 CCD camera (Gatan, USA). EVs were identified as circular objects with 40–3000 nm diameters and electron‐dense phospholipid bilayers.
2.15. Immunolabelling on Paraffin‐Embedded Sections
In order to detect CD81 and CD63 on the surface of muscle tissue (Figure S1F, right), freshly isolated Tibialis anterior (TA) explants from C57/Black6 mouse were immediately fixed in 4% formaldehyde for 24 h. TA were then processed through sequential ethanol washes for paraffin embedding and sectioned longitudinally into 4 µm slices using a microtome. For immunolabelling, the sections were deparaffinized, rehydrated, subjected to antigen retrieval and stained with antibodies against CD81 and CD63 (Table S1). After washes with PBS, slides were incubated with Alexa Fluor conjugated goat anti‐mouse IgG (Invitrogen, Carlsbad, CA, USA) for 30 min. Following a final PBS wash, sections were mounted and visualized using a Leica fluorescence microscope or IZEISS AXIOVERT 200 M with APOTOME (for muscle, 10× objective).
2.16. Visualization of EV Released From C2C12 Muscle Cells
The 2230 bp DNA fragment containing pHluo_M153R‐CD63‐mScarlet (Sung et al. 2020) was inserted into pCDNA3. Recombinant adenoviral genomes carrying pHluo_M153R‐CD63‐mScarlet were generated by homologous recombination and amplified as in Chaussade et al. (2003). 2.4 × 10⁶ infection particles were used to infect myotubes for 24 h. To validate that SkM‐EVs released from infected C2C12 myotubes contained the pHluo_M153R‐CD63‐mScarlet construct, 25 µL of conditioned medium (CM) conditioned medium was collected 24 h post‐infection and analyzed using ExoView technology (Breitwieser et al. 2022). CM was diluted 1:2 in manufacturer supplied incubation solution, incubated overnight on ExoView Mouse Flex Tetraspanin Chips (Unchained Labs, USA) featuring CD81 (Eat2) capture and Mouse IgG controls as per manufacturer's instructions. Chips were then processed on the Chip Washer (Unchained Labs, USA) using the exosome protocol, dried and imaged on the R200 Exoview instrument using Exoview Client v2.1. For fluorescent antibodies, the following three antibodies were used: CD63‐Phluorin (GFP) in the CF488 channel, CD81‐CF555 and CD63‐CF647. Data was analyzed using the ExoView Analysis v 2.1 software with the fluorescent cut‐off applied, based on particle counts, 95% of signal being eliminated from isotype control spots. To visualize EVs released from C2C12 myotubes in the conditioned medium, time‐lapse videos were recorded every minute with a Leica dMi8 thunder Imager equipped with a CO2‐controlled heating unit (×63).
2.17. Mouse Muscle Regeneration (Figure S2A)
Protocol on mice: Eight‐week‐old C57BL/6 mice (Harlan) were housed in a controlled environment (temperature 21°C, 12‐h light/dark cycle). Animal procedures were carried out in compliance with ARRIVE guidelines (agreement #I44273). Thirty minutes before anaesthesia, mice received analgesic premedication of Buprenorphine (0.08 mg/kg, Vetergesic). Anaesthesia was realized with 5% Isoflurane and maintained by intraperitoneal injections of Ketamine (80 mg/kg) and Xylazine (10 mg/kg). Thirty‐five microlitre Cardiotoxin (12 µM, Latoxan) were injected in Tibialis anterior (TA). Thirty microgram of EVs in 25 µL PBS were injected intramuscularly a few minutes later. Five days post‐injection, mice were euthanized, and TA were used for immunohistochemistry (Charrier et al. 2024) (Figure S2B) or RNA extraction.
Histological analysis: Images, corresponding to the whole 10 mm‐thick section of each muscle tissue sample, were acquired using a slide scanner (AxioScan.Z1, Zeiss, Jena, Germany) with fluorescence and brightfield imaging modes (Plan Apochromat 10X objective). To investigate anisocytosis corresponding to the distribution of myofibre size, the minimum Feret diameter (MinFeret; shortest distance between two parallel tangents of the myofibre edges) of the laminin‐immunolabelled myofibres was used. It is one of the most reliable parameters to measure myofibre cross‐sectional size (Briguet et al. 2004). All measurements were generated automatically from a myofibre segmentation script to promote reproducibility and optimize analysis time. Prior to this, the recognition of the myofibre perimeter was manually controlled to prevent potential errors. Myofibre size was documented by considering at least 250 individual elements per muscle sample, with the exception of one animal for which 184 fibres were considered, in at least two large microscopic fields (1000 × 1000 mm) performed on the scanned images. The quantifications and morphometric analyses of the muscle sections from animals from the different groups included in the protocol were blindly performed using Fiji software (https://fiji.sc/).
2.18. Myofibre Isolation and Treatments (Figure S5D,E)
Single myofibres were isolated from extensor digitorum longus (EDL) of 12‐week‐old Pax7CreERT2/+; R26mTmG/+ mice, as described previously (Brun et al. 2018). In brief, EDL were digested for 1 h in DMEM containing 2.8 mg/mL type II collagenase (ThermoFisher). Single EDL myofibres containing muscle stem cells (MuSC) were then isolated by gentle trituration, washed in PBS and cultured in 12‐well plates in a fibre medium containing DMEM supplemented with 10% EV‐depleted foetal bovine serum and 1% penicillin/streptomycin. A total of 500 nM (Z)−4Hydroxytamoxifen (Sigma, H7904‐5MG) was added to the fibre medium to induce the recombination of R26mTmG/+ allele in the PAX7‐expressing muscle stem cells, specifically. Two mice were pooled for each biological replicate (n = 3). Once isolated, fibres were immediately treated with SkM‐EVs, Sphingosine‐1 phosphate d18:1 or d16:1 (Cayman, #62570; #9002921, prepared as Glueck et al. (2022)). Treated‐myofibres were incubated for 72 h in a cell culture incubator and then fixed in 4%PFA/PBS prior to the immunolabelling with anti‐GFP (i.e., detection of MuSC at the surface of the fibres) and anti‐MyoG antibodies (See Table S1). For MuSC proliferation analysis, myofibres were treated with 20 µM EdU for 1 h before fixation.
2.19. Macrophage Migration
RAW 264.7 cells (ATCC TIB‐71) were grown in DMEM (2 mM Glutamine, 10%FBS) until confluence. Scratched wound lines were created with a micropipette tip, and macrophages were treated with 2 µg EVs/mL of EV‐depleted DMEM medium for 24 h. Wounded areas were measured at time 0 and 48 h. The decrease in the gap area was quantified by ImageJ software (Suarez‐Arnedo et al. 2020).
2.20. Statistical Analyses
Shapiro–Wilk test was used to test for normal distribution. Then One‐way ANOVA (multiple comparisons) or unpaired parametric t‐test were performed with GraphPad Prism (9.4.1).
3. Results
3.1. Murine Myotubes Release Two Subtypes of EVs From the Plasma Membrane
In order to understand the functions of SkM‐EVs in the control of muscle homeostasis, we first determined which subtypes of EVs were generated from SkM. Although different protocols for the purification of SkM‐EVs have been published, we chose the differential centrifugation method (DC) (Thery et al. 2006) to compare our data with previous works on murine and human myotubes (Le Bihan et al. 2012; Forterre et al. 2014). After purification, size distribution analyses by Dynamic Light Scattering (DLS) showed that lEVs pelleted at 10,000 g were more polydispersed with a large size range (50–700 nm; peak size = 205.15 nm ± 17.4), whereas the 100,000 g sEV pellet had sizes from 68 to 396 nm (peak size = 159.47 nm ± 23) (Figure 1A). This size overlap is inherent to the use of DLS which overrepresents larger particles and thus exemplifies the intrinsic heterogeneity of each EV populations. However, the observed peak sizes remained distinct and reproducible between the two fractions, suggesting that, despite some overlap, the bulk populations analyzed retain characteristic functional features of their respective EV subclasses. Western blot analyses and TEM confirmed this observation. Both lEVs and sEVs were decorated with the tetraspanins CD63 and CD81, considered as classical EV markers (Figure 1B,C) (Thery et al. 2018). However, as previously reported for human SkM‐EVs (Le Bihan et al. 2012), murine SkM‐derived sEVs, but not lEVs, contained TSG101 and ALIX (Figure 1B).
FIGURE 1.
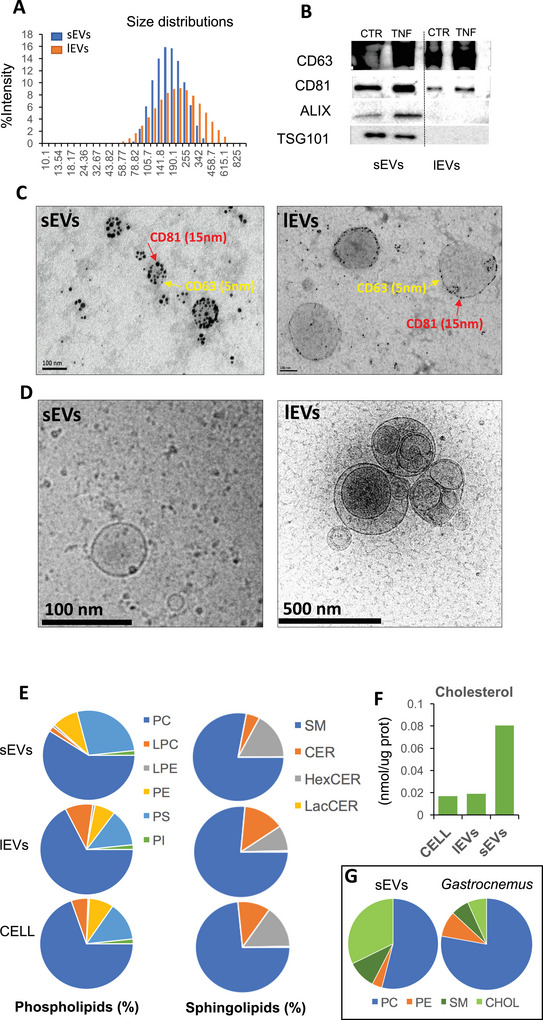
Murine muscle cells release 2 subtypes of extracellular vesicles. (A) EV size distribution analyzed by Dynamic Light Scattering using the nano‐S Zetasizer (5 µg of EVs). (B) WB analyses of EV proteins (5 µg/line except for ALIX where we used 10 µg, S6). (C) TEM images of EV gold immunolabelled with CD81 and CD63 (Scale‐100 nm). (D) CryoEM of large and small EVs released from C2C12. (E, F) Lipidomic composition of C2C12 and EVs by LCMS/MS. For EVs, the conditioned medium of 80 × F75 were pooled to extract 200 µg of lEVs or sEVs. (G) Lipidomic analyses of mouse Gastrocnemus explants (n = 4) and sEVs released from the same explants (n = 4) (mice and protocol for sEV extraction are described in Jalabert et al. (2021)). CER, ceramides; CHOL, cholesterol; HexCER, hexosylceramide; LacCER, lactosylceramides; LPC, lysophosphatidylcholine; LPE, lysophosphatidylethanolamine; PC, phosphatidylcholine; PE, phosphatidylethanolamine; PI, phosphatidylinositol; PS, phosphatidylserine; SM, sphingomyelin.
CryoEM images showed the wide range of lEV morphologies containing smaller EVs inside (Figure 1D, right), and the round aspect of sEVs (Figure 1D, left). Lipidomic analysis revealed that sEVs and lEVs contained high proportions of phosphatidylcholine (PC) and sphingomyelin (SM) (Figure 1E). LEVs had similar phospholipid and sphingolipid profiles to the producer cells. Compared to lEVs, sEVs were enriched in phosphatidylserine (PS), phosphatidylethanolamine (PE) and had reduced proportions of phosphatidylcholine (PC) and lysophosphatidylcholine (LPC) (Figure 1E). The hexosylceramide/ceramide ratio was higher in sEVs than in lEVs, and sEVs were enriched in cholesterol compared to lEVs (Figure 1F). This cholesterol enrichment was also observed in sEVs released from mouse Gastrocnemius explants (Figure 1G).
Taken together, these data indicated that mouse myotubes, similarly to human myotubes (Le Bihan et al. 2012) released two distinct subpopulations of EVs, based on their size, lipid profiles and protein content. The enrichment of sEV in cholesterol, hexosylceramide and their high proportion of sphingomyelin strongly suggested that their biogenesis was associated with specific PM regions enriched in lipid‐rafts (Pike 2009).
To further characterize the release of EVs from muscle cells, we performed SEM to visualize the surface of myotubes and muscle fibres. We observed numerous nanovesicles on the surface of myotubes (Figure 2A,B), and for the first time on muscle fibre (Figure 2C), with sizes ranging to what we previously found for lEVs and sEVs (Figure 1A). Surprisingly, we also observed numerous small PM folds on both myotubes (Figure 2D) and myoblasts (Figure 2E), which had never been described before for other cell types. To determine whether these PM folds could give rise to EVs, CD63 or CD81 were labelled with gold particles prior to the preparation for SEM, to detect their PM localization. CD63 (Figure 3A) and CD81 (Figure 3B) were both located within or near the PM folds. Using TEM we visualized the biogenesis of CD63‐containing EVs from PM (Figure 3C) and confirmed that EV biogenesis from the plasma membrane was a process conserved between mouse and human myotubes (Figure 3D,E). We also observed the presence of TSG101 and ALIX in EVs generated from the PM of C2C12 myotubes (Figure S5A,B).
FIGURE 2.
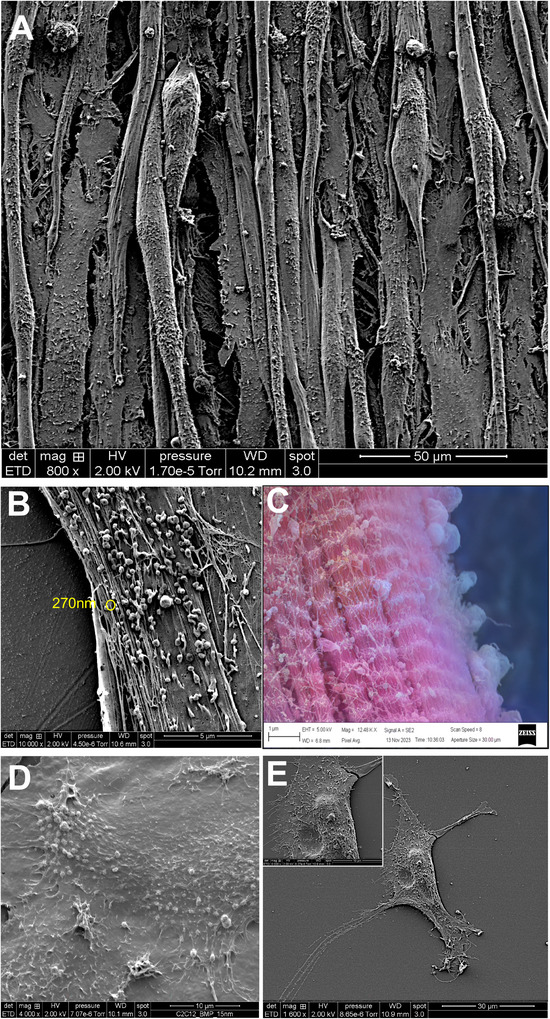
Visualization of EVs at the surface of myotubes or muscle fibres. (A, B, D) C2C12 myotubes grown in DMEM visualized by SEM. (C) Surface of a fibre from the EDL muscle visualized by SEM (AI‐coloured image: https://deepai.org/machine‐learning‐model/colorizer to highlight EVs at the surface of the muscle fibre). (D) C2C12 myoblasts grown in DMEM visualized by SEM. Scales are indicated on each picture.
FIGURE 3.

Release of EVs from the surface of myotubes. (A) White spots indicate the presence of CD63 detected by golg immunolabelling (25 nm gold particles, yellow arrows), realized before SEM preparation. (B) White spots indicate the presence of CD81 detected by gold immunolabelling (25 nm gold particles, yellow arrows), realized before SEM preparation. (C) TEM image of C2C12 myotube plasma membrane showing the presence of CD63 (gold immunolabelling) at the top of membrane folding. (D, E) Detection of membrane foldings at the surface of C2C12 myotubes (D) or human myotubes (E). (F) Detection of yellow EVs in the conditioned medium of C2C12 myotubes infected with adenoviruses expressing pHluorin_M153R‐CD63‐mScarlet during differentiation (see Figure S3 for explanation). (G) Screen capture from a video showing a burst of fluorescence appearing at the surface of C2C12 myotubes infected with adenoviruses expressing pHluorin_M153R‐CD63‐mScarlet. (H, I) TEM images of C2C12 myotubes to show the presence of MVB trafficking along with the microtubule networks. EV, extracellular vesicles; N, nucleus.
To monitor the release of SkM‐EVs from C2C12 myotubes, we generated an adenovirus to express in muscle cells a previously used EV reporter, namely CD63‐pHluorin/mScarlet (Sung et al. 2020) (Figure S3A). In acidic compartments of the cell, like lysosomes and multivesicular bodies (MVBs), the green signal from pHluorin is turned off (pH‐sensitive version of GFP), so only the red fluorescence is visible. This shows that CD63 is inside these acidic vesicles. When CD63 moves to a cell compartment with neutral pH, such as the plasma membrane (PM) or the extracellular space, the green signal becomes visible again and combines with the red signal, creating a yellow fluorescence (Figure S3B). This colour change lets us track CD63 in the cells. We validated that the adenoviral construct was expressed correctly in C2C12 myoblast (Figure S3C) and myotube (Figure S3D) (i.e., yellow in ER and PM and red in the endolysosomes and golgi). Using TEM, we validated the presence of gold‐labelled GFP in endosomes (<1 µm organelles), confirming the endosomal trafficking of labelled CD63 (Figure S3E). More importantly, we confirmed the presence of CD63 also at PM (Figure S3F, of note, the CD63 antibody detects both endogenous and labelled CD63). Using the ExoView technology, which permits the direct capture of floating EVs with coated antibodies (Figure S3G), we finally validated that labelled CD63 could be exported inside EVs. Here, EVs containing CD81 (Figure S3G) are bound to a support, and second antibodies are used to determine the co‐occurrence of other proteins (i.e., CD63 or pHluorin in Figure S3G). This experiment indicated that labelled CD63 was detected in CD81+ EVs released from myotubes (Figure S3G, right panel showing the presence of pHluorin‐positive EVs). Consistently, after infection, numerous fluorescent EVs were observed floating in the culture medium (Figure 3F), and bursts of fluorescence originating from the plasma membrane were detected (Figure 3G), indicating the release of SkM‐EVs directly from the surface of the myotubes. It should be noted that this experiment did not distinguish between the release of small EVs (sEVs) and large EVs (lEVs).
Based on these results, we concluded that sEVs and lEVs are mainly generated from PM in SkM. We cannot rule out that SkM cells also release sEVs from the exosomal pathway, as we previously showed MVBs in C2C12 myotubes (Forterre et al. 2014) and now in human myotubes (Figures 3H and S5C). However, based on TEM analyses, we found that MVBs are usually associated with the cytoskeleton, such as microtubules for their transport and fusion with endolysosomes (Figures 3H and S5C), and are not observed fusing with PM (Figures 3I and S5C).
3.2. TNF‐α Affects Lipid Composition and Release of Muscle‐EVs
Skeletal muscle (SkM) has a remarkable ability to regenerate, and previous studies, including ours, have demonstrated that SkM‐EVs played a significant role in this process through the regulation of myogenesis (Forterre et al. 2014). In vivo, one important actor influencing SkM regeneration is the proinflammatory cytokine TNF‐α (Chen et al. 2005). Interestingly, previous data have shown that TNF‐α can disrupt lipid homeostasis in skeletal muscle (Bruce and Dyck 2004; Tse et al. 2017), raising the hypothesis that TNF‐α could consequently also affect the lipid composition of SkM‐EVs and thus their functions (Rome and Tacconi 2024). To validate this, we first performed transcriptomic analyses in human myotubes from healthy donors to identify the significant gene networks modulated by TNF‐α in myotubes (Figure 4A, Table S2). In addition to the already known pathways, such as ‘protein catabolism’, ‘muscle structure/development’, ‘cell cycle’ and ‘immune response’, we identified a substantial number of genes involved in the synthesis of lipids involved in EV biogenesis (i.e., sphingomyelin/sphingosine, ceramides, phospholipids, cholesterol) (Figure 4B). Consistently, lipid profiles were affected in both muscle cells and EVs in response to TNF‐α (Figure 4C). We previously observed that in the absence of treatment, the lipid profile of lEVs was quite similar to that of cells, whereas sEVs displayed a distinct profile (Figure 1E). However, the TNF‐α treatment significantly altered the EV lipid composition, resulting in greater similarity between sEVs and cells compared to lEVs (Figure 4C,D). Indeed, in response to TNF‐α, lEVs (TNF‐lEVs) displayed a strong increase in the proportion of Lysophosphatidylcholines (LPC) compared to cells and TNF‐sEVs (Figure 4C). On the other hand, cells and sEVs derived from TNF‐α treated cells (TNF‐sEVs) had significantly decreased proportion of ceramides compared to TNF‐lEVs. In addition, muscle cells accumulated cholesterol, probably due to an increased expression of the HMG‐CoA reductase (HMGCR, Figure 4B), the rate‐limiting enzyme for cholesterol synthesis. As intracellular cholesterol increased, it accumulated in TNF‐sEVs but not in TNF‐lEVs (Figure 4D). These data demonstrated a specific selection for lipid sorting/assembly in sEVs and lEVs in response to TNF‐α, probably consistent with the fact that they may not arise from the same PM regions.
FIGURE 4.

TNF‐α modulated SkM lipid metabolism, EV release and EV lipid composition. (A) Gene ontology (GO) pathways significantly enriched in genes differentially expressed in response to TNF‐α in primary human myotubes (Table S2) were determined with g:profiler (https://biit.cs.ut.ee/gprofiler/gost). Then GO pathways were clustered by using REVIGO (http://revigo.irb.hr/) to identify the major transcriptional pathways regulated by TNF‐α in muscle cells. (B) Heat map of the genes involved in polar lipids and cholesterol metabolism regulated by TNF‐α, in primary human myotubes. For each gene, the intensity of the colour depends on the expression of this gene among the 10 samples. (C, D) Lipidomic composition of C2C12 myotubes and released EVs in response to TNF‐α by LCMS/MS. For EVs, the conditioned medium of 80 × F75 were pooled to extract 200 µg of lEVs or sEVs. (E) Quantity of EVs measured as equivalent protein, released from C2C12 (n = 3). (F) TEM images of differentiated myotubes untreated or treated with TNF‐α. Yellow dotted circle shows the increase of PM buddings at the surface of C2C12 myotubes treated with TNF‐α. CER, ceramides; HexCER, hexosylceramide; LacCER, lactosylceramides; LPC, lysophosphatidylcholine; LPE, lysophosphatidylethanolamine; PC, phosphatidylcholine; PE, phosphatidylethanolamine; PI, phosphatidylinositol; PS, phosphatidylserine; SM, sphingomyelin.
TNF‐α also enhanced the release of sEVs (Figures 4E and S4). This result was correlated with an increased number of plasma membrane folds on the surface of the TNF‐treated C2C12 myotubes compared to controls (Figure 4F) and with an enrichment for some EV markers, including TSG101 and ALIX, in TNF‐sEVs compared to CTR‐sEVs (Figure 1B). These data further confirmed that ALIX is associated with sEV biogenesis (Romancino et al. 2013) and that the plasma membrane folds on the surface of myotubes, enriched in cholesterol, were the origin of sEVs.
3.3. sEVs and lEVs Act Differentially on Muscle Stem Cells (MuSC) During Regeneration
In addition to the lipid profile, TNF‐α modified the physicochemical properties of EVs, that is, the mean diameter and size distributions of EVs were increased for both TNF‐lEVs and TNF‐sEVs (Figure 5A). TNF‐lEVs also contained more vesicle inclusions versus CTR‐lEVs (Figure 5B). We have not explantation for this observation, but we can postulate that it could be linked to their increase in lysophosphatidylcholine (LPC) content, as LPC is known to influence membrane fluidity by disrupting lipid packing, enhancing surface hydration, and widening the phase transition, all of which can promote the formation and dynamic remodeling of multilayer vesicles (Alves et al. 2008; Seu et al. 2006).
FIGURE 5.

sEVs and lEVs have opposite action on MuSC differentiation during muscle regeneration. (A) EV size distribution analyzed by DLS using a Zetasizer nano S. (5 µg of EVs were used). Data are a mean of n = 5 recordings/sample. (B) CryoEM images showing the impact of TNF‐α on lEV vesiculation. (C–F) In vivo injections of SkM‐EVs in cardiotoxin‐injured TA (see Figure S2A,B). (C) Five‐day post‐regeneration, TA were fixed, embedded and sectioned, followed by staining to visualize the fibres under a microscope. Then, muscle fibre diameters were determined (minimal Feret's diameter). (D) Percentage of MYOG+ nuclei per fibre. (E) Percentage of PAX7+ nuclei per fibre. (F) Percentage of PAX7+/Ki‐67+ nuclei per fibre. (G) Representative image used to quantify the number of MuSC per fibre on EDL isolated fibres (see Figure S4). Merged fluorescence: Empty array = mGFP expressing MuSC labelled with Edu; Full array = mGFP expressing MuSC labelled with MYOG; stars = mGFP expressing MuSC without labelling. Below are single images. (H) Proportion of MuSC expressing mGFP per fibre. (I) Percentage of MuSC nuclei expressing MYOG. (J) Percentage of MuSC expressing PAX7.
Considering these data, we suspected that TNF‐α might also alter the myogenic function of SkM‐EVs and, consequently, SkM regeneration. To test this hypothesis, we submitted mice to a cardiotoxin‐induced injury in TA, and concomitantly injected SkM‐EVs (Figure S2A). Five days post‐injections (i.e., after the acute inflammatory phase), the size of the regenerated fibres was quantified. Specifically, mice treated with CTR‐sEVs showed a significant increase in the number of fibres >30 µm (Figure 5C) and had the highest number of MYOG+ nuclei/fibre (Figure 5D) compared to all other groups. This increase was not observed with TNF‐sEVs. We also performed Ki67 immunolabelling for PAX7‐expressing MuSCs in order to distinguish quiescent (PAX7+, Ki67−) from cycling (PAX7+, Ki67+) MuSCs. While sEVs did not affect the number or the activation of MuSC compared to untreated muscle (Figure 5E,F), both CTR‐lEVs and TNF‐lEVs significantly increased their number (Figure 5E), but reduced their activation (Figure 5F).
In our in vivo setup, we could not exclude that injected EVs might act on other muscle‐resident cell types, such as immune cells, that subsequently might also influence MuSC behaviour. Therefore, to determine the direct effects of SkM‐EVs on MuSCs, we used an ex vivo setup where freshly isolated fibres containing non‐activated MuSCs were treated immediately with SkM‐EVs (Figures 5G and S5D,E). After 72 h, which corresponds to the time when myoblasts exit the cell cycle and initiate differentiation, we found that the total number of MuSCs/fibre did not differ between each condition (Figure 5H). Both CTR‐sEV and TNF‐sEV treatments increased the proportion of MYOG⁺ differentiated cells, whereas CTR‐lEV‐ and TNF‐lEV‐treated fibres showed a decreased proportion of MYOG⁺ cells compared to untreated controls (Figure 5I, not significant for TNF‐EVs). Accordingly, sEV conditions reduced the proportion of PAX7⁺ cells, while lEVs increased it (Figure 5J). Notably, the effect of TNF‐α on EV function was less pronounced in vitro than in vivo (Figure 5C–J). These findings suggest that other muscle‐resident cell types may contribute to the TA phenotype observed 5 days after EV injections. Altogether, these results confirm that sEVs and lEVs exert opposing effects on MuSCs—sEVs promote their differentiation, while lEVs inhibit and promote MuSC proliferation. Importantly, TNF‐α–EVs might also act on other cell types involved in muscle regeneration, such as immune cells.
3.4. SEVs and lEVs Modulate the Inflammatory Response During Muscle Regeneration
Therefore, to assess whether SkM‐EVs modulate immune cell activities, we analyzed the effects of SkM‐EV treatment on macrophage phenotype. We first examined macrophage migratory capacity and found that both CTR‐ and TNF‐sEVs enhanced macrophage migration in vitro, but not lEVs (Figure 6A). However, only CTR‐sEVs induced the expression of CD86 (Figure 6B) and Il1b (Figure 6C), markers associated with the pro‐inflammatory M1 macrophage phenotype. In vivo, no significant differences were observed in the total number of macrophages across conditions (Figure 6D). Nonetheless, the expression of CD206, a marker for the anti‐inflammatory M2 phenotype, was significantly reduced in the CTR‐lEV condition compared to the others (Figure 6E). Additionally, CTR‐sEVs induced sustained expression of TNF‐α in muscle tissue (Figure 6F). Taken together, these data suggest that CTR‐lEVs may impair or delay the transition from the pro‐inflammatory to an anti‐inflammatory response, an essential step for promoting MuSC differentiation. Conversely, CTR‐sEVs promote both M1 macrophage polarization and their ability to migrate. The transitory inflammation induced by CTR‐sEVs could participate in the accelerated muscle regeneration observed in Figure 5C (Li 2003). However, TNF‐α altered the sEV effect on macrophage M1 polarization in vitro (Figure 6B,C) and in vivo (Figure 6E).
FIGURE 6.

sEVs and lEVs modulate the inflammatory response during muscle regeneration. (A) Effect of muscle‐derived EVs on macrophage RAW 264.7 migration. Below are representative images used to quantify gap reduction 48 h after the EV treatment. (B) Quantification of CD86 by qRT‐PCR, 48 h post‐treatments with EVs. (C) Quantification of Il‐1beta with qRT‐PCR, 3 h post‐treatment. Of note Il‐beta mRNA increase was not observed any more at 48 h, showing the rapid effect of sEVs on cytokine expression in macrophages. (D) In vivo quantification of macrophages by immunohistochemistry (5 days post‐injury and EV treatments, Figure S2B). (E) Quantification of CD206 and TNF alpha mRNAs (F) by qRT‐PCR (5 days post‐injury and EV treatments). In (B, C, E, F) data are normalized to TBP mRNA levels, and expressed as arbitrary units. (G) Genes from the sphingomyelin pathway involved in S1P synthesis and regulated by TNF‐α (green = down‐regulated genes and red = up‐regulated genes in response to TNF‐α, from Figure 4B). UNT = untreated cells; CTR‐EVs = EVs released from C2C12 myotubes treated with BSA; TNF‐EVs = EVs released from C2C12 myotubes treated with TNF alpha.
3.5. TNF‐α Altered the Ratio of Sphingosine‐1‐Phosphate d18:1/d16:1 in sEVs and lEVs, Which Is Involved in MuSC Differentiation
Since TNF‐α differentially altered the lipid profiles of lEVs and sEVs (Figures 1E and 4C,D), we wondered whether specific lipids might explain their differing effects on MuSCs and macrophages. We focused on the sphingolipids, being both major EV lipids and known mediators of TNF‐α in muscle (De Larichaudy et al. 2012). Although TNF‐α induced the expression of SMPD2 (Figure 4B) which hydrolyses sphingomyelin into ceramides (Sawai et al. 1999, Figure 6G) and decreased the expression of CERK (Figures 4B and 6G) involved in the synthesis of ceramide‐1 phosphate from ceramide (Sugiura et al. 2002), we did not observed the expected increase proportion of ceramides in both myotubes and EVs (Figures 1E and 4C). As TNF‐α also induced the expression of SPHK1 (Figures 4B and 6G), which produces sphingosine‐1‐phosphate (S1P) from sphingosine, we suspected that SkM‐EVs might contain S1P. S1P is indeed an important bioactive lipid for MuSC proliferation and macrophage migration, and we hypothesized it could be one of the major effectors of SkM‐EVs during SkM regeneration (Becciolini et al. 2006; Donati et al. 2005). Targeted LC‐MS/MS identified two S1P variants in SkM‐EVs; that is, the major species d18:1 and the atypical d16:1 (Glueck et al. 2022) with opposite proportions in sEVs and lEVs, respectively (Figure 7A). In response to TNF‐α, the proportion of d16:1 decreased in TNF‐sEVs versus CTR‐sEV whereas the proportions of d18:1 and d16:1 were not affected in lEVs (Figure 7A). Recently, it was shown that cancer cells treated with different ratios of d18:1 and d16:1 showed differential expression of CCN2 (Glueck et al. 2022), a gene also involved in TNF‐α‐induced MYOG repression and myoblast proliferation (Nishida et al. 2015). Therefore, we treated myoblasts using the d18:1/d16:1 ratio contained in sEVs or lEVs (Figure 7A). As in cancer cells, myoblasts expressed higher levels of CCN2 when the ratio contained more d16:1 than d18:1 (Figure 7B). Consistent with the d18:1/d16:1 ratios quantified in SkM‐EVs, lEV‐treated myoblasts also displayed upregulation of CCN2 (Figure 7C).
FIGURE 7.

Sphingosine‐1‐phosphate d18:1 and d16:1 have reverse effects on myoblast proliferation and satellite cell activation. (A) Proportions of sphingosine‐1‐phosphate d18:1(*) and d16:1(*) in 100 µg of SkM‐EVs, quantified by targeted LCMS/MS analyses and expressed as percentages of S1Ps. (B) C2C12 myoblasts were treated with 1 µM of different proportions of d18:1 and d16:1, for 3 h. (C) C2C12 myoblasts were treated with 5 µg of SkM‐EVs for 24 h. (D) Isolated muscle fibres were treated with 1 µM of S1P containing different proportions of d18:1 and d16:1, for 72 h. Then fibres were fixed and labelled with antibodies against MyoG, PAX7 and BrdU (n = 6). (*) = Sphingolipid base nomenclature gives the number of hydroxyl groups (d for two), followed by the chain length (i.e., the number of carbons, 18 or 16) and number of double bonds (1). UNT = untreated cells; CTR‐EVs = EVs released from C2C12 myotubes treated with BSA; TNF‐EVs = EVs released from C2C12 myotubes treated with TNF alpha.
MuSC from isolated fibres were then treated with different proportions of d16:1 and d18:1 (Figure 7D). Compared to the control, the proportion of MYOG+ cells was the highest when d18:1 was higher than d16:1 in the mixt (Figure 7D, a‐b vs. c). Conversely, the proportion of PAX7+ versus MYOG+ cells was strongly increased when d16:1 was higher than d18:1 in the mixt. Thus, the relative proportions of sphingosine‐1‐phosphate subspecies in SkM‐EVs, specifically d18:1 versus d16:1, play a crucial role in modulating myogenesis, with an increased d18:1/d16:1 ratio favouring myogenic differentiation, while a higher d16:1/d18:1 ratio promoting the maintenance of progenitor cells.
Finally, we also assessed the d16:1/d18:1 combination on macrophage behaviour. A positive d18:1/d16:1 ratio induced macrophage migration in contrast to a negative ratio such as in lEVs (Figure 7E). Concomitantly, a positive d18:1/d16:1 ratio induced higher expression of M1 polarization markers (i.e., CD86 (Figure 7F) and Il1‐β (Figure 7G)). Taken together, these data demonstrated that the balance of these sphingolipids in SkM‐EVs not only influenced myogenic differentiation, but also might play a pivotal role in immune cell behaviour, particularly by promoting macrophage migration and M1 polarization.
4. Discussion
This study shows that the production of EVs by SkM cells occurs mainly at plasma membrane (PM) domains enriched in lipid raft‐like domains for sEVs, or with a lipid composition similar to that of the predominant cellular PM for lEVs. These data complement the results of a previous study, based on the use of small‐angle X‐ray scattering (SAXS) and small‐angle neutron scattering (SANS) measurements, which showed that the membrane organization of SkM sEVs was different from that of lEVs, and which the authors explained as the result of a different organization of their lipid bilayers (Romancino et al. 2018). Hence, contrary to what we published previously, based solely on observations (Jalabert et al. 2021; Forterre et al. 2014), we are unable to provide evidence that SkM releases exosomes from the fusion of MVBs with the PM, and current techniques do not allow us to go further. In fact, there is a growing body of evidence showing that for many cell types, the predominant form of EV production is associated with PM budding (Fordjour et al. 2022; Kowal et al. 2016), and this appears to be the case for muscle cells.
To understand this particular type of EV biogenesis in SkM cells, it is necessary to identify the circumstances that allow muscle cells to produce EVs. Compared to other cell types, SkM cells are syncytial, non‐proliferative and have an estimated lifespan of 30–70 years (Sender and Milo 2021). Thus, the production of SkM‐EVs is not associated with the export of exosomes containing obsolete cellular components that are sorted during proliferation or differentiation (Desdin‐Mico and Mittelbrunn 2017). Previous proteomic analyses of SkM‐EVs have shown that lEVs and sEVs from human or mouse myotubes contain proteins from the ESCRT‐I machinery, such as Dysferlin, Annexins and Caveolin‐3 (Le Bihan et al. 2012; Forterre et al. 2014), which suggests that the production of SkM‐EVs is strongly associated with PM repair (Jimenez and Perez 2017; He et al. 2022). Consistently, myotubes in culture stimulated by electrical pulses to induce mechanical stress and PM alterations release more sEVs than unstimulated cells (Murata et al. 2023). It is presently not known whether it also affects the release of lEVs.
The second situation that induces SKM EV release is the modulation of SkM lipid composition and, consequently, the lipid composition of the PM. We have previously shown that SkM from mice fed with a high‐palmitate diet released more sEVs than SkM from mice fed with a standard diet. This increase was reproduced in vitro in palmitate‐treated C2C12 (Aswad et al. 2014). Here we show that PM co‐enrichment in cholesterol and sphingomyelin in response to TNF‐α correlates with the release of sEVs. Both lipids are necessary for sEV formation because we previously found that SkM cholesterol enrichment alone (e.g., SkM from ob/ob mice (Jalabert et al. 2021)) is not sufficient to induce sEV release ex vivo, probably because this condition forms less ordered PM microdomains. Conversely, lEV release is not affected by TNF‐α and does not involve TSG101 and ALIX, suggesting a distinct mechanistic pathway for lEV release from SkM.
Although it is known that lipids are major components of EVs, it is the first study showing the impact of SkM‐EV lipid composition on their biological functions during SkM regeneration. Of importance is the discovery that SkM‐EVs contain the sphingosine‐1 phosphate (S1P), a derivative of ceramide. In response to SkM injury, sphingomyelin in the inner leaflet of the plasma membrane is metabolized to produce S1P (Nagata et al. 2006). It is known that S1P both enhances immune cell recruitment (Danieli‐Betto et al. 2010; Weigert et al. 2019) and activates MuSC to enter the cell cycle (Nagata et al. 2006). In SkM, S1P signalling is mediated by the sphingosine receptor 2 (Loh et al. 2012). Here, we show that under high metabolic stress, such as the one induced by TNF‐α, SkM cells release two S1P sub‐species; that is, the major and most studied palmitate‐derived d18:1 and the atypical myristate‐derived d16:1. Remarkably, we discover that sEVs and lEVs incorporate different ratios of these two S1Ps, that is, d16:1 is more enriched in lEVs compared to d18:1, and inversely for sEVs. Because of its polar head group, S1P cannot cross cell membranes by diffusion. In addition, they are very hydrophobic and practically insoluble in water. A transporter has been identified, but it is not ubiquitously expressed. The fact that S1Ps are contained in SkM‐EVs supports a previous study on cancer cells showing that cancer‐derived EVs are used as vehicles for S1P export from cells (Deng et al. 2015). Interestingly, we found that the EV lipid composition might be important for the selection of S1P sub‐species, that is, d18:1 is more incorporated in cholesterol‐rich sEVs than d16:1.
On its own, d16:1 had almost no effect on macrophage migration and MuSC proliferation compared to d18:1. However, when its concentration in EVs exceeded that of d18:1, d16:1 reduced the effect of d18:1 on MuSC differentiation and delayed the anti‐inflammatory response necessary for MuSC differentiation in vivo. As the switch from pro‐inflammatory (M1) to anti‐inflammatory (M2) macrophages is essential for MuSC differentiation and for effective muscle regeneration (Yang and Hu 2018), this result partly explains how the balance between d16:1 and d18:1 promotes muscle regeneration. However, the mechanism underlying the effect of d16:1 on MuSC is not clear as indeed, both d18:1 and d16:1 can bind S1PR2. As d16:1 has less affinity for this receptor (Wang et al. 2020), we can postulate that d16:1 acts as a competitive antagonism of d18:1 lowering d18:1 signalling outputs. It was previously found that when used separately on cardiomyocytes, d18:1 induced autophagy whereas d16:1 induced apoptosis (Russo et al. 2013). Taken all together, these data indicate that these S1Ps have non‐overlapping intracellular roles on their own, but their ratio may fine‐tune cellular responses and could have significant implications in the treatment of muscle diseases. We are currently working on this hypothesis.
More broadly, the use of sphingosine‐1‐phosphate d16:1‐enriched EVs derived from skeletal muscle could offer therapeutic benefits in various muscular pathologies characterized by the progressive loss of muscle regenerative capacity due to the exhaustion of muscle satellite cells. Such conditions include chronic muscle diseases, muscular dystrophies and aging. Once the satellite cell pool is depleted, muscle regeneration becomes inefficient, leading to accelerated muscle atrophy and functional decline. In this study, we show that a d16:1/d18:1 ratio greater than 1 favours MuSC proliferation at the expense of their differentiation. This suggests that modulating the sphingolipid composition of EVs, particularly increasing the d16:1/d18:1 ratio, could be a viable strategy to transiently expand the MuSC pool in vivo. Such an approach may enhance the regenerative potential of muscle tissue in addition to therapeutic interventions. Further studies are required to determine the most effective mode of administration, optimal dosing and long‐term safety of these EV‐based therapies. Importantly, our findings further confirm that lipids are not merely structural components of EVs but active modulators of their biological function (Rome and Tacconi 2024). Therefore, lipid composition should be a key consideration when producing EVs for regenerative medicine applications.
Author Contributions
Rhyma Hakkar: investigation, methodology, formal analysis, writing–review and editing. Caroline E. Brun: conceptualization, investigation, methodology, data curation, writing–review and editing. Pascal Leblanc: methodology, writing–review and editing. Emmanuelle Meugnier: methodology, formal analysis. Emmanuelle Danty: methodology. Olivier Blanc‐brude: methodology. Stefano Tacconi: methodology. Audrey Jalabert: methodology. Laura Reininger: methodology. Sandra Pesenti: methodology, formal analysis. Catherine Calzada: methodology. Vincent Gache: methodology. Sanjay B. Vasan: methodology. Julien Pichon: methodology, formal analysis. Thibaut Larcher: methodology, formal analysis. Elizabeth Errazuriz‐cerda: methodology, visualization, formal analysis. Christelle Cassin: methodology. Bong Hwan Sung: methodology, writing–review and editing. Alissa Weaver: writing–review and editing. Antonella Bongiovanni: writing–review and editing. Karl Rouger: conceptualization, writing–review and editing, formal analysis. Jean‐Paul Pais de Barros: methodology, writing–review and editing, formal analysis. karim Bouzakri: conceptualization, writing–review and editing, supervision, resources. Sophie Rome: conceptualization, funding acquisition, writing–original draft, visualization, formal analysis, data curation, supervision, resources.
Conflicts of Interest
Some authors declare the following financial competing interests: S.R., CE.B, and RH have filed a patent related to the use of different ratios of sphingosine‐1‐phosphate subspecies free or vesicle‐complexed to favour the regeneration of the MuSC pool in muscle diseases (#EP25306216.0, 28/07/2025). The remaining authors declare no competing interests.
Supporting information
Supplementary table 1
Supplementary table 2
Supplementary Figure 1:
A‐SEM images showing that C2C12 myotubes treated with BSA + TNF‐α for 24h have similar morphologies than the untreated myotubes. Bar = 300µm. B‐Protocole of EV extraction used in this study to isolate large and small EVs released from C2C12 myotubes. C‐C2C12 myotubes were treated with BSA + TNF‐α for 24h. Then the medium was changed for serum‐free DMEM (4.5 g/l glucose) for an additional 18h. Cells were then treated with insulin to quantify the insulin‐induced AKT phosphorylation (p‐AKT) vs the untreated condition (* = p〈0.05 vs untreated, student t‐test). Below representative WB used to quantify the ration phosphorylated AKT/total AKT. Antibodies are provided in Table S1. A. D‐Measure of C2C12 width (n = 6 replicates, 5 pictures were taken for each replicate) to evaluate myotube atrophy, 18h post‐treatment with TNF‐α vs BSA. E‐In order to validate the CD63 antibodies (ab216130), we performed 3 different co‐immunolabellings on C2C12 myoblasts: a‐LAMP1 (lysosomes, MVB) + BMP (Bis(monoacylglycerol)phosphate (Z‐PLBPA) a lipid located both in acidic MVBs and lysosomes. LAMP1 and BMP merged totally. b‐EEA1 (early endosomes) + BMP. EEA1 and BMP did not co‐locallized. c‐CD63 + BMP. CD63 merged partially with BMP. Thus our CD63 antibody recognized all compartements containing CD63, such as lysosomes/MVB and early endosomes. F‐Co‐immunolabelling of non permeabilized C2C12 myotubes (left) and longitudinal section of murine Tibialis anterior (TA) (right) showing that CD63 and CD81 are both expressed at the surface of muscle cells (X10). CD63 and CD81 merged only partially at the PM of C2C12 myotubes, or at the surface of murine TA.
Supplementary Figure 2:
A‐In vivo experiments to determine the activities of sEVs and lEVs on SkM regeneration. Each group of mice contained 5 animals. CTX = cardiotoxin. Intramuscular injections of EVs are performed in each Tibialis Anterior (TA). Five days post‐regeneration, mice were euthanazied and the TA were frozen either for immunohistochemistry or genomic analyses. B‐representative fluorescent images of TA to detect cells positive for PAX7 and MYOG, or macrophages (Antibodies are listed in Table S1. A).
Supplementary Figure 3:
A‐Localization of pHluorin (pH‐sensitive modified version of GFP) and mScarlet in the CD63 protein . B‐PHluorin green fluorescence is quenched in acid lysosomes and MVBs, so when labeled CD63 is expressed in these organelles only the red fluorescence from mScarlet is detected. When CD63 is expressed in early endosomes or at the plasma membrane, a yellow fluorescence is detected. C‐Validation of labelled CD63 in C2C12 myoblast (different levels of fluorescent intensities indicate different levels in the expression of pHluorin_M153R‐CD63‐mScarlet), or myotubes (D). N = nucleus. E‐Murine C2C12 myotubes or F‐Human Y711i myotubes infected with adenoviruses expressing pHluorin_M153R‐CD63‐mScarlet were visualized by TEM. Gold immunolabelling of GFP (5nm gold particles) was performed to detect GFP in MVBs (〈1µm organelles) (E‐F). It is worth noting that the fixation protocol used for immunolabelling in TEM does not optimally preserve cellular structures; however, intraluminal vesicles (ILVs) can still be observed in MVBs on 3F. In F, Human Y711i myotubes were co‐labelled with GFP (5nm gold particles) and CD63 (15nm gold particles) to confirm that the construct shows similar localization as endogenous CD63 and was also expressed at the plasma membrane. G‐Summary of the ExoView technology. CD81 positive EVs from the conditioned medium of C2C12 myotubes were first captured on a support containing anti‐CD81. Then a second antibody (CD63 or GFP) were used to detect EVs positive for pHluorin_M153R‐CD63‐mScarlet or CD63. The fluorescence above the backgound indicates the presence of EVs containing the pHluorin_M153R‐CD63‐mScarlet in CD81 and /or CD63 positive EVs, released in the conditioned medium.
Supplementary Figure 4:
Particle quantification by Nanotracking Analyses (NTA). The concentrations take into account the dilution factors of the sEVs before analyses. Of note: because the lEVs are too polydispersed (Fig. 1C‐D), it was not possible to quantify the number of lEV particles. NTA settings are indicated on this figure.
Supplementary Figure 5:
A‐Gold immunolabelling of ALIX on C2C12 myotubes showing the presence of the protein at the surface of EVs generated from the plasma membrane. Red arrays indicated ALIX+ EVs. B‐Gold immunolabelling of TSG101 on C2C12 myotubes showing the presence of the protein at the surface of EVs generated from the plasma membrane. Yellow arrays indicate the presence of gold particle‐associated to ALIX. C‐Summary protocol used to induce the expression mGFP in PAX7+ MuSC, well‐described in. D‐Representative image of mGFP+ MuSC on isolated fibers, treated for 72h with EVs.
Supplementary Figure 6:
A‐ Blots used to draw Fig. 1. B‐ Additional replicates to confirm that sEVs and lEVs have different content of ALIX and TSG101.
Acknowledgements
We thank Emmanouil Dermitzakis and Cédric Howald from the university of Geneva for the RNAseq data; Raphaël Planche, Stéphanie Chanon, Armelle Penhoat from CarMeN laboratory for their technical assistance; the staff of Boisbonne Center (Oniris) and the APEX platform (INRAE/Oniris, PAnTher) for animal care and technical support; the staff from Centre Européen d'Etude du Diabète of Strasbourg for their excellent technical support. EV analyses with ExoView were performed in collaboration with Drs. Alex Shephard, Jan Brants and Veronica Foisor employed at unchainedlabs.com at the time of this study. We thank Rajkumar Vutukuri from the Institute of General Pharmacology and Toxicology, Goethe University in Frankfurt, Germany for his help and advice for the preparation of the S1P subspecies. For CryoEM images, we thank Dr. Jean‐Michel Guigner of the electron microscopy platform of the Institut de Minéralogie, de Physique des Matériaux et de Cosmochimie, Sorbonne Université, Paris, France. The Scanning Electron microscopy pictures were performed at the Centre Technologiques des microsctructure of Lyon 1 University, France. We would like to sincerely thank the reviewers for their careful reading, constructive feedback and insightful suggestions. Their comments have significantly helped us to improve the clarity, rigor and overall quality of our manuscript.
Hakkar, R. , Brun C. E., Leblanc P., et al. 2025. “Sphingolipids in Extracellular Vesicles Released From the Skeletal Muscle Plasma Membrane Control Muscle Stem Cell Fate During Muscle Regeneration.” Journal of Extracellular Vesicles 14, no. 9: e70164. 10.1002/jev2.70164
Funding: This work was supported by three research grants from the Agence National de la Recherche Française [# ANR‐21‐CE14‐617 0081; # ANR‐20‐CE18‐0026; ANR‐22‐CE14‐0070].
Data Availability Statement
All unique/stable reagents generated in this study are available from Sophie ROME with a completed material transfer agreement. The raw lipidomic data are stored on a network drive at the University Bourgogne Europe computing data center and are available upon request from Joao.Pais‐De‐Barros@u‐bourgogne.fr. The RNAseq data are available from the Gene Expression Omnibus database. The raw data of the animal protocol for muscle regeneration, and the images used for the analyses are available from Karl.Rouger@inrae.fr.
References
- Alves, M. , Bales B. L., and Peric M.. 2008. “Effect of Lysophosphatidylcholine on the Surface Hydration of Phospholipid Vesicles.” Biochimica Et Biophysica Acta 1778, no. 2: 414–422. [DOI] [PMC free article] [PubMed] [Google Scholar]
- Anakor, E. , Milla V., Connolly O., et al. 2022. “The Neurotoxicity of Vesicles Secreted by ALS Patient Myotubes Is Specific to Exosome‐Like and Not Larger Subtypes.” Cells 11, no. 5: 845. [DOI] [PMC free article] [PubMed] [Google Scholar]
- Aswad, H. , Forterre A., Wiklander O. P., et al. 2014. “Exosomes Participate in the Alteration of Muscle Homeostasis During Lipid‐Induced Insulin Resistance in Mice.” Diabetologia 57, no. 10: 2155–2164. [DOI] [PMC free article] [PubMed] [Google Scholar]
- Baci, D. , Chirivi M., Pace V., et al. 2020. “Extracellular Vesicles From Skeletal Muscle Cells Efficiently Promote Myogenesis in Induced Pluripotent Stem Cells.” Cells 9, no. 6: 1527. [DOI] [PMC free article] [PubMed] [Google Scholar]
- Becciolini, L. , Meacci E., Donati C., Cencetti F., Rapizzi E., and Bruni P.. 2006. “Sphingosine 1‐Phosphate Inhibits Cell Migration in C2C12 Myoblasts.” Biochimica Et Biophysica Acta 1761, no. 1: 43–51. [DOI] [PubMed] [Google Scholar]
- Bouzakri, K. , Roques M., Gual P., et al. 2003. “Reduced Activation of Phosphatidylinositol‐3 Kinase and Increased Serine 636 Phosphorylation of Insulin Receptor Substrate‐1 in Primary Culture of Skeletal Muscle Cells From Patients With Type 2 Diabetes.” Diabetes 52, no. 6: 1319–1325. [DOI] [PubMed] [Google Scholar]
- Breitwieser, K. , Koch L. F., Tertel T., et al. 2022. “Detailed Characterization of Small Extracellular Vesicles From Different Cell Types Based on Tetraspanin Composition by ExoView R100 Platform.” International Journal of Molecular Sciences 23, no. 15: 8544. [DOI] [PMC free article] [PubMed] [Google Scholar]
- Briguet, A. , Courdier‐Fruh I., Foster M., Meier T., and Magyar J. P.. 2004. “Histological Parameters for the Quantitative Assessment of Muscular Dystrophy in the mdx‐Mouse.” Neuromuscular Disorders: NMD 14, no. 10: 675–682. [DOI] [PubMed] [Google Scholar]
- Bruce, C. R. , and Dyck D. J.. 2004. “Cytokine Regulation of Skeletal Muscle Fatty Acid Metabolism: Effect of Interleukin‐6 and Tumor Necrosis Factor‐Alpha.” American Journal of Physiology. Endocrinology and Metabolism 287, no. 4: E616–E621. [DOI] [PubMed] [Google Scholar]
- Brun, C. E. , Wang Y. X., and Rudnicki M. A.. 2018. “Single EDL Myofiber Isolation for Analyses of Quiescent and Activated Muscle Stem Cells.” Methods in Molecular Biology 1686: 149–159. [DOI] [PubMed] [Google Scholar]
- Buzas, E. I. 2023. “The Roles of Extracellular Vesicles in the Immune System.” Nature Reviews. Immunology 23, no. 4: 236–250. [DOI] [PMC free article] [PubMed] [Google Scholar]
- Charrier, M. , Leroux I., Pichon J., et al. 2024. “Human MuStem Cells Are Competent to Fuse With Nonhuman Primate Myofibers in a Clinically Relevant Transplantation Context: A Proof‐of‐Concept Study.” Journal of Neuropathology and Experimental Neurology 83, no. 8: 684–694. [DOI] [PubMed] [Google Scholar]
- Chaussade, C. , Pirola L., Bonnafous S., et al. 2003. “Expression of Myotubularin by an Adenoviral Vector Demonstrates Its Function as a Phosphatidylinositol 3‐Phosphate [PtdIns(3)P] Phosphatase in Muscle Cell Lines: Involvement of PtdIns(3)P in Insulin‐Stimulated Glucose Transport.” Molecular Endocrinology 17, no. 12: 2448–2460. [DOI] [PubMed] [Google Scholar]
- Chen, S. E. , Gerken E., Zhang Y., et al. 2005. “Role of TNF‐Alpha Signaling in Regeneration of Cardiotoxin‐Injured Muscle.” American Journal of Physiology‐Cell Physiology 289, no. 5: C1179–C1187. [DOI] [PMC free article] [PubMed] [Google Scholar]
- Coudert, L. , Osseni A., Gangloff Y. G., Schaeffer L., and Leblanc P.. 2021. “The ESCRT‐0 Subcomplex Component Hrs/Hgs Is a Master Regulator of Myogenesis via Modulation of Signaling and Degradation Pathways.” BMC Biology 19, no. 1: 153. [DOI] [PMC free article] [PubMed] [Google Scholar]
- Danieli‐Betto, D. , Peron S., Germinario E., et al. 2010. “Sphingosine 1‐Phosphate Signaling Is Involved in Skeletal Muscle Regeneration.” American Journal of Physiology‐Cell Physiology 298, no. 3: C550–C558. [DOI] [PubMed] [Google Scholar]
- de Gasperi, R. , Hamidi S., Harlow L. M., Ksiezak‐Reding H., Bauman W. A., and Cardozo C. P.. 2017. “Denervation‐Related Alterations and Biological Activity of miRNAs Contained in Exosomes Released by Skeletal Muscle Fibers.” Scientific Reports 7, no. 1: 12888. [DOI] [PMC free article] [PubMed] [Google Scholar]
- De Larichaudy, J. , Zufferli A., Serra F., et al. 2012. “TNF‐Alpha‐ and Tumor‐Induced Skeletal Muscle Atrophy Involves Sphingolipid Metabolism.” Skeletal Muscle 2, no. 1: 2. [DOI] [PMC free article] [PubMed] [Google Scholar]
- Deng, Z. , Mu J., Tseng M., et al. 2015. “Enterobacteria‐Secreted Particles Induce Production of Exosome‐Like S1P‐Containing Particles by Intestinal Epithelium to Drive Th17‐Mediated Tumorigenesis.” Nature Communications 6: 6956. [DOI] [PMC free article] [PubMed] [Google Scholar]
- Desdin‐Mico, G. , and Mittelbrunn M.. 2017. “Role of Exosomes in the Protection of Cellular Homeostasis.” Cell Adhesion & Migration 11, no. 2: 127–134. [DOI] [PMC free article] [PubMed] [Google Scholar]
- Donati, C. , Meacci E., Nuti F., Becciolini L., Farnararo M., and Bruni P.. 2005. “Sphingosine 1‐Phosphate Regulates Myogenic Differentiation: A Major Role for S1P2 Receptor.” FASEB Journal: Official Publication of the Federation of American Societies for Experimental Biology 19, no. 3: 449–451. [DOI] [PubMed] [Google Scholar]
- Durcin, M. , Fleury A., Taillebois E., et al. 2017. “Characterisation of Adipocyte‐Derived Extracellular Vesicle Subtypes Identifies Distinct Protein and Lipid Signatures for Large and Small Extracellular Vesicles.” Journal of Extracellular Vesicles 6, no. 1: 1305677. [DOI] [PMC free article] [PubMed] [Google Scholar]
- Fordjour, F. K. , Guo C., Ai Y., Daaboul G. G., and Gould S. J.. 2022. “A Shared, Stochastic Pathway Mediates Exosome Protein Budding Along Plasma and Endosome Membranes.” Journal of Biological Chemistry 298, no. 10: 102394. [DOI] [PMC free article] [PubMed] [Google Scholar]
- Forterre, A. , Jalabert A., Berger E., et al. 2014. “Proteomic Analysis of C2C12 Myoblast and Myotube Exosome‐Like Vesicles: A New Paradigm for Myoblast‐Myotube Cross Talk?” PLoS ONE 9, no. 1: e84153. [DOI] [PMC free article] [PubMed] [Google Scholar]
- Glueck, M. , Koch A., Brunkhorst R., et al. 2022. “The Atypical Sphingosine 1‐Phosphate Variant, d16:1 S1P, Mediates CTGF Induction via S1P2 Activation in Renal Cell Carcinoma.” FEBS Journal 289, no. 18: 5670–5681. [DOI] [PubMed] [Google Scholar]
- Guescini, M. , Maggio S., Ceccaroli P., et al. 2017. “Extracellular Vesicles Released by Oxidatively Injured or Intact C2C12 Myotubes Promote Distinct Responses Converging Toward Myogenesis.” International Journal of Molecular Sciences 18, no. 11: 2488. [DOI] [PMC free article] [PubMed] [Google Scholar]
- Haraszti, R. A. , Didiot M. C., Sapp E., et al. 2016. “High‐Resolution Proteomic and Lipidomic Analysis of Exosomes and Microvesicles From Different Cell Sources.” Journal of Extracellular Vesicles 5: 32570. [DOI] [PMC free article] [PubMed] [Google Scholar]
- He, S. , Singh D., and Helfield B.. 2022. “An Overview of Cell Membrane Perforation and Resealing Mechanisms for Localized Drug Delivery.” Pharmaceutics 14, no. 4: 886. [DOI] [PMC free article] [PubMed] [Google Scholar]
- Hudson, M. B. , Woodworth‐Hobbs M. E., Zheng B., et al. 2014. “miR‐23a Is Decreased During Muscle Atrophy by a Mechanism That Includes Calcineurin Signaling and Exosome‐Mediated Export.” American Journal of Physiology‐Cell Physiology 306, no. 6: C551–C558. [DOI] [PMC free article] [PubMed] [Google Scholar]
- Hurley, J. H. 2015. “ESCRTs Are Everywhere.” EMBO Journal 34, no. 19: 2398–2407. [DOI] [PMC free article] [PubMed] [Google Scholar]
- Jalabert, A. , Reininger L., Berger E., et al. 2021. “Profiling of Ob/Ob Mice Skeletal Muscle Exosome‐Like Vesicles Demonstrates Combined Action of miRNAs, Proteins and Lipids to Modulate Lipid Homeostasis in Recipient Cells.” Scientific Reports 11, no. 1: 21626. [DOI] [PMC free article] [PubMed] [Google Scholar]
- Ji, H. , Chen M., Greening D. W., et al. 2014. “Deep Sequencing of RNA From Three Different Extracellular Vesicle (EV) Subtypes Released From the Human LIM1863 Colon Cancer Cell Line Uncovers Distinct miRNA‐Enrichment Signatures.” PLoS ONE 9, no. 10: e110314. [DOI] [PMC free article] [PubMed] [Google Scholar]
- Jimenez, A. J. , and Perez F.. 2017. “Plasma Membrane Repair: The Adaptable Cell Life‐Insurance.” Current Opinion in Cell Biology 47: 99–107. [DOI] [PubMed] [Google Scholar]
- Kim, S. , Lee M. J., Choi J. Y., et al. 2018. “Roles of Exosome‐Like Vesicles Released From Inflammatory C2C12 Myotubes: Regulation of Myocyte Differentiation and Myokine Expression.” Cellular Physiology and Biochemistry: International Journal of Experimental Cellular Physiology, Biochemistry, and Pharmacology 48, no. 5: 1829–1842. [DOI] [PubMed] [Google Scholar]
- Kowal, J. , Arras G., Colombo M., et al. 2016. “Proteomic Comparison Defines Novel Markers to Characterize Heterogeneous Populations of Extracellular Vesicle Subtypes.” Proceedings of the National Academy of Sciences of the United States of America 113, no. 8: E968–E977. [DOI] [PMC free article] [PubMed] [Google Scholar]
- Le Bihan, M. C. , Bigot A., Jensen S. S., et al. 2012. “In‐Depth Analysis of the Secretome Identifies Three Major Independent Secretory Pathways in Differentiating Human Myoblasts.” Journal of Proteomics 77: 344–356. [DOI] [PubMed] [Google Scholar]
- Leblanc, P. , Arellano‐Anaya Z. E., Bernard E., et al. 2017. “Isolation of Exosomes and Microvesicles From Cell Culture Systems to Study Prion Transmission.” Methods in Molecular Biology 1545: 153–176. [DOI] [PubMed] [Google Scholar]
- Le Gall, L. , Duddy W. J., Martinat C., et al. 2022. “Muscle Cells of Sporadic Amyotrophic Lateral Sclerosis Patients Secrete Neurotoxic Vesicles.” Journal of Cachexia, Sarcopenia and Muscle 13, no. 2: 1385–1402. [DOI] [PMC free article] [PubMed] [Google Scholar]
- Li, Y. P. 2003. “TNF‐Alpha Is a Mitogen in Skeletal Muscle.” American Journal of Physiology‐Cell Physiology 285, no. 2: C370–C376. [DOI] [PubMed] [Google Scholar]
- Lischnig, A. , Bergqvist M., Ochiya T., and Lasser C.. 2022. “Quantitative Proteomics Identifies Proteins Enriched in Large and Small Extracellular Vesicles.” Molecular & Cellular Proteomics: MCP 21, no. 9: 100273. [DOI] [PMC free article] [PubMed] [Google Scholar]
- Loh, K. C. , Leong W. I., Carlson M. E., et al. 2012. “Sphingosine‐1‐Phosphate Enhances Satellite Cell Activation in Dystrophic Muscles Through a S1PR2/STAT3 Signaling Pathway.” PLoS ONE 7, no. 5: e37218. [DOI] [PMC free article] [PubMed] [Google Scholar]
- Luo, P. , Mao K., Xu J., et al. 2020. “Metabolic Characteristics of Large and Small Extracellular Vesicles From Pleural Effusion Reveal Biomarker Candidates for the Diagnosis of Tuberculosis and Malignancy.” Journal of Extracellular Vesicles 9, no. 1: 1790158. [DOI] [PMC free article] [PubMed] [Google Scholar]
- Murata, A. , Akiyama H., Honda H., and Shimizu K.. 2023. “Electrical Pulse Stimulation‐Induced Tetanic Exercise Simulation Increases the Secretion of Extracellular Vesicles From C2C12 Myotubes.” Biochemical and Biophysical Research Communications 672: 177–184. [DOI] [PubMed] [Google Scholar]
- Nagata, Y. , Partridge T. A., Matsuda R., and Zammit P. S.. 2006. “Entry of Muscle Satellite Cells Into the Cell Cycle Requires Sphingolipid Signaling.” Journal of Cell Biology 174, no. 2: 245–253. [DOI] [PMC free article] [PubMed] [Google Scholar]
- Nishida, T. , Kubota S., Aoyama E., Janune D., Lyons K. M., and Takigawa M.. 2015. “CCN Family Protein 2 (CCN2) Promotes the Early Differentiation, but Inhibits the Terminal Differentiation of Skeletal Myoblasts.” Journal of Biochemistry 157, no. 2: 91–100. [DOI] [PMC free article] [PubMed] [Google Scholar]
- Pike, L. J. 2009. “The Challenge of Lipid Rafts.” Journal of Lipid Research 50: no. Suppl(Suppl): S323–S328. [DOI] [PMC free article] [PubMed] [Google Scholar]
- Romancino, D. P. , Buffa V., Caruso S., et al. 2018. “Palmitoylation Is a Post‐Translational Modification of Alix Regulating the Membrane Organization of Exosome‐Like Small Extracellular Vesicles.” Biochimica Et Biophysica Acta. General Subjects 1862, no. 12: 2879–2887. [DOI] [PubMed] [Google Scholar]
- Romancino, D. P. , Paterniti G., Campos Y., et al. 2013. “Identification and Characterization of the Nano‐Sized Vesicles Released by Muscle Cells.” FEBS Letters 587, no. 9: 1379–1384. [DOI] [PMC free article] [PubMed] [Google Scholar]
- Rome, S. 2022. “Muscle and Adipose Tissue Communicate With Extracellular Vesicles.” International Journal of Molecular Sciences 23, no. 13: 7052. [DOI] [PMC free article] [PubMed] [Google Scholar]
- Rome, S. , Forterre A., Mizgier M. L., and Bouzakri K.. 2019. “Skeletal Muscle‐Released Extracellular Vesicles: State of the Art.” Frontiers in Physiology 10: 929. [DOI] [PMC free article] [PubMed] [Google Scholar]
- Rome, S. , and Tacconi S.. 2024. “High‐Fat Diets: You Are What You Eat….Your Extracellular Vesicles Too!.” Journal of Extracellular Vesicles 13, no. 1: e12382. [DOI] [PMC free article] [PubMed] [Google Scholar]
- Russo, S. B. , Tidhar R., Futerman A. H., and Cowart L. A.. 2013. “Myristate‐Derived d16:0 Sphingolipids Constitute a Cardiac Sphingolipid Pool With Distinct Synthetic Routes and Functional Properties.” Journal of Biological Chemistry 288, no. 19: 13397–13409. [DOI] [PMC free article] [PubMed] [Google Scholar]
- Sawai, H. , Domae N., Nagan N., and Hannun Y. A.. 1999. “Function of the Cloned Putative Neutral Sphingomyelinase as Lyso‐Platelet Activating Factor‐Phospholipase C.” Journal of Biological Chemistry 274, no. 53: 38131–38139. [DOI] [PubMed] [Google Scholar]
- Sbarigia, C. , Rome S., Dini L., and Tacconi S.. 2024. “New Perspectives of the Role of Skeletal Muscle Derived Extracellular Vesicles in the Pathogenesis of Amyotrophic Lateral Sclerosis: The ‘Dying Back’ Hypothesis.” Journal of Extracellular Biology 3, no. 11: e70019. [DOI] [PMC free article] [PubMed] [Google Scholar]
- Sender, R. , and Milo R.. 2021. “The Distribution of Cellular Turnover in the Human Body.” Nature Medicine 27, no. 1: 45–48. [DOI] [PubMed] [Google Scholar]
- Seu, K. J. , Cambrea L. R., Everly R. M., and Hovis J. S.. 2006. “Influence of Lipid Chemistry on Membrane Fluidity: Tail and Headgroup Interactions.” Biophysical Journal 91, no. 10: 3727–3735. [DOI] [PMC free article] [PubMed] [Google Scholar]
- Shao, X. , Gong W., Wang Q., et al. 2022. “Atrophic Skeletal Muscle Fibre‐Derived Small Extracellular Vesicle miR‐690 Inhibits Satellite Cell Differentiation During Ageing.” Journal of Cachexia, Sarcopenia and Muscle 13, no. 6: 3163–3180. [DOI] [PMC free article] [PubMed] [Google Scholar]
- Skotland, T. , Ekroos K., Llorente A., and Sandvig K.. 2025. “Quantitative Lipid Analysis of Extracellular Vesicle Preparations: A Perspective.” Journal of Extracellular Vesicles 14, no. 3: e70049. [DOI] [PMC free article] [PubMed] [Google Scholar]
- Skotland, T. , Sagini K., Sandvig K., and Llorente A.. 2020. “An Emerging Focus on Lipids in Extracellular Vesicles.” Advanced Drug Delivery Reviews 159: 308–321. [DOI] [PubMed] [Google Scholar]
- Suarez‐Arnedo, A. , Torres Figueroa F., Clavijo C., Arbelaez P., Cruz J. C., and Munoz‐Camargo C.. 2020. “An Image J Plugin for the High Throughput Image Analysis of In Vitro Scratch Wound Healing Assays.” PLoS ONE 15, no. 7: e0232565. [DOI] [PMC free article] [PubMed] [Google Scholar]
- Sugiura, M. , Kono K., Liu H., et al. 2002. “Ceramide Kinase, a Novel Lipid Kinase. Molecular Cloning and Functional Characterization.” Journal of Biological Chemistry 277, no. 26: 23294–23300. [DOI] [PubMed] [Google Scholar]
- Sung, B. H. , von Lersner A., Guerrero J., et al. 2020. “A Live Cell Reporter of Exosome Secretion and Uptake Reveals Pathfinding Behavior of Migrating Cells.” Nature Communications 11, no. 1: 2092. [DOI] [PMC free article] [PubMed] [Google Scholar]
- Thery, C. , Amigorena S., Raposo G., and Clayton A.. 2006. “Isolation and Characterization of Exosomes From Cell Culture Supernatants and Biological Fluids.” Current Protocols in Cell Biology Chapter 3: Unit 3 22. 10.1002/0471143030.cb0322s3. [DOI] [PubMed]
- Thery, C. , Witwer K. W., Aikawa E., et al. 2018. “Minimal Information for Studies of Extracellular Vesicles 2018 (MISEV2018): A Position Statement of the International Society for Extracellular Vesicles and Update of the MISEV2014 Guidelines.” Journal of Extracellular Vesicles 7, no. 1: 1535750. [DOI] [PMC free article] [PubMed] [Google Scholar]
- Tse, M. C. L. , Herlea‐Pana O., Brobst D., et al. 2017. “Tumor Necrosis Factor‐Alpha Promotes Phosphoinositide 3‐Kinase Enhancer A and AMP‐Activated Protein Kinase Interaction to Suppress Lipid Oxidation in Skeletal Muscle.” Diabetes 66, no. 7: 1858–1870. [DOI] [PMC free article] [PubMed] [Google Scholar]
- Valadi, H. , Ekstrom K., Bossios A., Sjostrand M., Lee J. J., and Lotvall J. O.. 2007. “Exosome‐Mediated Transfer of mRNAs and microRNAs Is a Novel Mechanism of Genetic Exchange Between Cells.” Nature Cell Biology 9, no. 6: 654–659. [DOI] [PubMed] [Google Scholar]
- Visnovitz, T. , Lenzinger D., Koncz A., et al. 2025. “A ‘Torn Bag Mechanism’ of Small Extracellular Vesicle Release via Limiting Membrane Rupture of En Bloc Released Amphisomes (Amphiectosomes).” eLife 13: RP95828. [DOI] [PMC free article] [PubMed] [Google Scholar]
- Vumbaca, S. , Giuliani G., Fiorentini V., et al. 2021. “Characterization of the Skeletal Muscle Secretome Reveals a Role for Extracellular Vesicles and IL1alpha/IL1beta in Restricting Fibro/Adipogenic Progenitor Adipogenesis.” Biomolecules 11, no. 8: 1171. [DOI] [PMC free article] [PubMed] [Google Scholar]
- Wang, W. , Xiang P., Chew W. S., et al. 2020. “Activation of Sphingosine 1‐Phosphate Receptor 2 Attenuates Chemotherapy‐Induced Neuropathy.” Journal of Biological Chemistry 295, no. 4: 1143–1152. [DOI] [PMC free article] [PubMed] [Google Scholar]
- Weigert, A. , Olesch C., and Brune B.. 2019. “Sphingosine‐1‐Phosphate and Macrophage Biology‐How the Sphinx Tames the Big Eater.” Frontiers in Immunology 10: 1706. [DOI] [PMC free article] [PubMed] [Google Scholar]
- Welsh, J. A. , Goberdhan D. C. I., O'Driscoll L., et al. 2024. “Minimal Information for Studies of Extracellular Vesicles (MISEV2023): From Basic to Advanced Approaches.” Journal of Extracellular Vesicles 13, no. 2: e12404. [DOI] [PMC free article] [PubMed] [Google Scholar]
- Yang, W. , and Hu P.. 2018. “Skeletal Muscle Regeneration Is Modulated by Inflammation.” Journal of Orthopaedic Translation 13: 25–32. [DOI] [PMC free article] [PubMed] [Google Scholar]
Associated Data
This section collects any data citations, data availability statements, or supplementary materials included in this article.
Supplementary Materials
Supplementary table 1
Supplementary table 2
Supplementary Figure 1:
A‐SEM images showing that C2C12 myotubes treated with BSA + TNF‐α for 24h have similar morphologies than the untreated myotubes. Bar = 300µm. B‐Protocole of EV extraction used in this study to isolate large and small EVs released from C2C12 myotubes. C‐C2C12 myotubes were treated with BSA + TNF‐α for 24h. Then the medium was changed for serum‐free DMEM (4.5 g/l glucose) for an additional 18h. Cells were then treated with insulin to quantify the insulin‐induced AKT phosphorylation (p‐AKT) vs the untreated condition (* = p〈0.05 vs untreated, student t‐test). Below representative WB used to quantify the ration phosphorylated AKT/total AKT. Antibodies are provided in Table S1. A. D‐Measure of C2C12 width (n = 6 replicates, 5 pictures were taken for each replicate) to evaluate myotube atrophy, 18h post‐treatment with TNF‐α vs BSA. E‐In order to validate the CD63 antibodies (ab216130), we performed 3 different co‐immunolabellings on C2C12 myoblasts: a‐LAMP1 (lysosomes, MVB) + BMP (Bis(monoacylglycerol)phosphate (Z‐PLBPA) a lipid located both in acidic MVBs and lysosomes. LAMP1 and BMP merged totally. b‐EEA1 (early endosomes) + BMP. EEA1 and BMP did not co‐locallized. c‐CD63 + BMP. CD63 merged partially with BMP. Thus our CD63 antibody recognized all compartements containing CD63, such as lysosomes/MVB and early endosomes. F‐Co‐immunolabelling of non permeabilized C2C12 myotubes (left) and longitudinal section of murine Tibialis anterior (TA) (right) showing that CD63 and CD81 are both expressed at the surface of muscle cells (X10). CD63 and CD81 merged only partially at the PM of C2C12 myotubes, or at the surface of murine TA.
Supplementary Figure 2:
A‐In vivo experiments to determine the activities of sEVs and lEVs on SkM regeneration. Each group of mice contained 5 animals. CTX = cardiotoxin. Intramuscular injections of EVs are performed in each Tibialis Anterior (TA). Five days post‐regeneration, mice were euthanazied and the TA were frozen either for immunohistochemistry or genomic analyses. B‐representative fluorescent images of TA to detect cells positive for PAX7 and MYOG, or macrophages (Antibodies are listed in Table S1. A).
Supplementary Figure 3:
A‐Localization of pHluorin (pH‐sensitive modified version of GFP) and mScarlet in the CD63 protein . B‐PHluorin green fluorescence is quenched in acid lysosomes and MVBs, so when labeled CD63 is expressed in these organelles only the red fluorescence from mScarlet is detected. When CD63 is expressed in early endosomes or at the plasma membrane, a yellow fluorescence is detected. C‐Validation of labelled CD63 in C2C12 myoblast (different levels of fluorescent intensities indicate different levels in the expression of pHluorin_M153R‐CD63‐mScarlet), or myotubes (D). N = nucleus. E‐Murine C2C12 myotubes or F‐Human Y711i myotubes infected with adenoviruses expressing pHluorin_M153R‐CD63‐mScarlet were visualized by TEM. Gold immunolabelling of GFP (5nm gold particles) was performed to detect GFP in MVBs (〈1µm organelles) (E‐F). It is worth noting that the fixation protocol used for immunolabelling in TEM does not optimally preserve cellular structures; however, intraluminal vesicles (ILVs) can still be observed in MVBs on 3F. In F, Human Y711i myotubes were co‐labelled with GFP (5nm gold particles) and CD63 (15nm gold particles) to confirm that the construct shows similar localization as endogenous CD63 and was also expressed at the plasma membrane. G‐Summary of the ExoView technology. CD81 positive EVs from the conditioned medium of C2C12 myotubes were first captured on a support containing anti‐CD81. Then a second antibody (CD63 or GFP) were used to detect EVs positive for pHluorin_M153R‐CD63‐mScarlet or CD63. The fluorescence above the backgound indicates the presence of EVs containing the pHluorin_M153R‐CD63‐mScarlet in CD81 and /or CD63 positive EVs, released in the conditioned medium.
Supplementary Figure 4:
Particle quantification by Nanotracking Analyses (NTA). The concentrations take into account the dilution factors of the sEVs before analyses. Of note: because the lEVs are too polydispersed (Fig. 1C‐D), it was not possible to quantify the number of lEV particles. NTA settings are indicated on this figure.
Supplementary Figure 5:
A‐Gold immunolabelling of ALIX on C2C12 myotubes showing the presence of the protein at the surface of EVs generated from the plasma membrane. Red arrays indicated ALIX+ EVs. B‐Gold immunolabelling of TSG101 on C2C12 myotubes showing the presence of the protein at the surface of EVs generated from the plasma membrane. Yellow arrays indicate the presence of gold particle‐associated to ALIX. C‐Summary protocol used to induce the expression mGFP in PAX7+ MuSC, well‐described in. D‐Representative image of mGFP+ MuSC on isolated fibers, treated for 72h with EVs.
Supplementary Figure 6:
A‐ Blots used to draw Fig. 1. B‐ Additional replicates to confirm that sEVs and lEVs have different content of ALIX and TSG101.
Data Availability Statement
All unique/stable reagents generated in this study are available from Sophie ROME with a completed material transfer agreement. The raw lipidomic data are stored on a network drive at the University Bourgogne Europe computing data center and are available upon request from Joao.Pais‐De‐Barros@u‐bourgogne.fr. The RNAseq data are available from the Gene Expression Omnibus database. The raw data of the animal protocol for muscle regeneration, and the images used for the analyses are available from Karl.Rouger@inrae.fr.